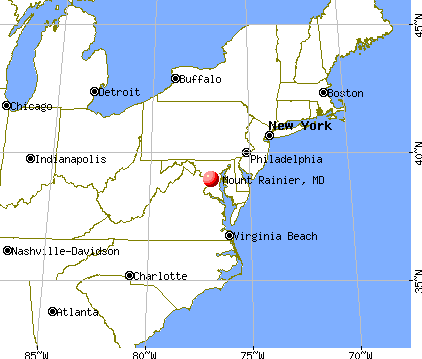
Mount Rainier, Maryland
Submit your own pictures of this city and show them to the world
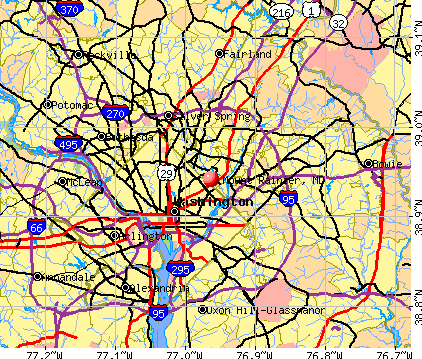
- OSM Map
- General Map
- Google Map
- MSN Map
Population change since 2000: -4.4%
 |
| Males: 3,957 | |
| Females: 4,169 |
| Median resident age: | 41.3 years |
| Maryland median age: | 39.7 years |
Zip codes: 20712.
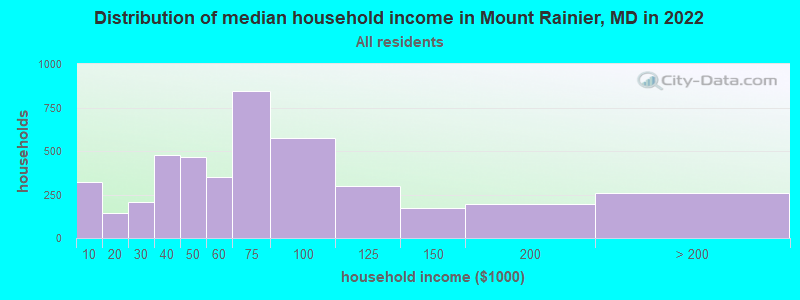
| Mount Rainier: | $61,881 |
| MD: | $94,991 |
Estimated per capita income in 2022: $38,363 (it was $17,558 in 2000)
Mount Rainier city income, earnings, and wages data
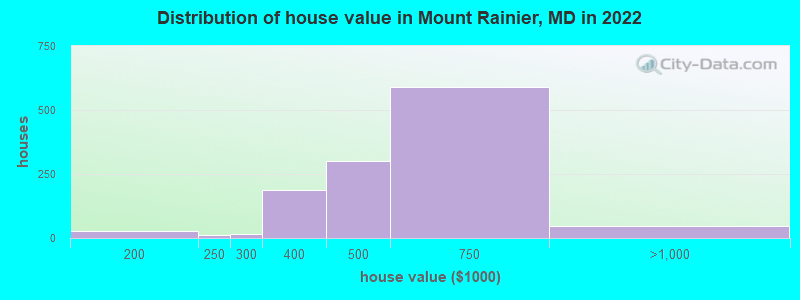
Estimated median house or condo value in 2022: $537,873 (it was $112,700 in 2000)
| Mount Rainier: | $537,873 |
| MD: | $398,100 |
Mean prices in 2022: all housing units: $487,869; detached houses: $492,564; townhouses or other attached units: $404,066
Median gross rent in 2022: $1,351.
(4.0% for White Non-Hispanic residents, 9.4% for Black residents, 6.2% for Hispanic or Latino residents, 3.5% for other race residents, 18.8% for two or more races residents)
Detailed information about poverty and poor residents in Mount Rainier, MD

Compare current foreclosures near Mount Rainier, MD:
| Photo | Address | Area | Beds / Baths | Price | Details |
|---|---|---|---|---|---|

|
#1
Upshur St
Mount Rainier, MD 20712
|
992 sq. feet
|
2 baths - beds |
show details | |

|
#2
Upshur St
Mount Rainier, MD 20712
|
1,014 sq. feet
|
1 baths - beds |
show details | |

|
#3
32nd St
Mount Rainier, MD 20712
|
1,284 sq. feet
|
1 baths - beds |
show details | |

|
#4
30th St
Mount Rainier, MD 20712
|
1,916 sq. feet
|
2 baths - beds |
show details | |

|
#5
Bunker Hill Rd
Mount Rainier, MD 20712
|
929 sq. feet
|
1 baths - beds |
show details | |

|
#6
28th St
Mount Rainier, MD 20712
|
1,352 sq. feet
|
2 baths - beds |
show details | |

|
#7
30th St
Mount Rainier, MD 20712
|
1,790 sq. feet
|
2 baths - beds |
show details | |

|
#8
Eastern Ave
Mount Rainier, MD 20712
|
- sq. feet
|
- baths - beds |
show details | |

|
#9
Varnum St
Mount Rainier, MD 20712
|
- sq. feet
|
- baths - beds |
show details | |

|
#10
Carousel Ct
Upper Marlboro, MD 20772
|
2,112 sq. feet
|
2 baths 3 beds |
$412,000
|
show details |
| Photo | Address | Area | Beds / Baths | Price | Details |
|---|---|---|---|---|---|

|
#11
17th St NW Apt 504
Washington, DC 20009
|
800 sq. feet
|
1 baths 1 beds |
$419,900
|
show details |

|
#12
Pooks Hill Rd Apt 1612s
Bethesda, MD 20814
|
1,250 sq. feet
|
1 baths 2 beds |
$289,000
|
show details |

|
#13
Addison Rd
Capitol Heights, MD 20743
|
1,400 sq. feet
|
1 baths 3 beds |
$260,000
|
show details |

|
#14
Interlachen Dr Apt 111
Silver Spring, MD 20906
|
965 sq. feet
|
1 baths 2 beds |
$148,000
|
show details |

|
#15
Heming Ln
Bowie, MD 20716
|
1,800 sq. feet
|
2 baths 3 beds |
$400,000
|
show details |

|
#16
Cathedral Ave NW Apt 108
Washington, DC 20016
|
765 sq. feet
|
1 baths 1 beds |
$279,900
|
show details |

|
#17
Whistling Duck Dr
Upper Marlboro, MD 20774
|
1,740 sq. feet
|
2 baths 3 beds |
$389,500
|
show details |

|
#18
Hammersmith Cir
Silver Spring, MD 20906
|
1,152 sq. feet
|
1 baths 3 beds |
$353,600
|
show details |

|
#19
Eastern Ave NE
Washington, DC 20011
|
1,024 sq. feet
|
1 baths 3 beds |
$395,000
|
show details |

|
#20
Parkside Dr
Bowie, MD 20721
|
5,066 sq. feet
|
2 baths 5 beds |
$780,000
|
show details |
| Photo | Address | Area | Beds / Baths | Price | Details |
|---|---|---|---|---|---|

|
#21
Gladys Retreat Cir
Bowie, MD 20720
|
2,880 sq. feet
|
3 baths 3 beds |
$409,900
|
show details |

|
#22
19th St NW
Washington, DC 20036
|
2,515 sq. feet
|
6 baths 8 beds |
$1,684,800
|
show details |

|
#23
Old Fort Rd
Fort Washington, MD 20744
|
721 sq. feet
|
1 baths 2 beds |
$179,900
|
show details |

|
#24
Pickett Dr
Suitland, MD 20746
|
1,296 sq. feet
|
1 baths 2 beds |
$358,900
|
show details |

|
#25
Delaware Ave SW Apt N720
Washington, DC 20024
|
- sq. feet
|
1 baths 1 beds |
$155,000
|
show details |

|
#26
T St SE Apt 3
Washington, DC 20020
|
- sq. feet
|
2 baths 4 beds |
$339,900
|
show details |

|
#27
Willow Leaf Ct
Odenton, MD 21113
|
1,476 sq. feet
|
2 baths 2 beds |
show details | |

|
#28
4th St NE Apt 2
Washington, DC 20002
|
1,061 sq. feet
|
2 baths 2 beds |
show details | |

|
#29
Rugged Ln
Capitol Heights, MD 20743
|
- sq. feet
|
3 baths 4 beds |
show details | |

|
#30
S Arbory Ln
Laurel, MD 20707
|
1,283 sq. feet
|
3 baths 3 beds |
show details |
| Photo | Address | Area | Beds / Baths | Price | Details |
|---|---|---|---|---|---|

|
#31
Norge Ct
Bowie, MD 20716
|
1,160 sq. feet
|
1 baths 3 beds |
show details | |

|
#32
Aquarius Ave
Silver Spring, MD 20906
|
1,407 sq. feet
|
2 baths 4 beds |
show details | |

|
#33
Pearl Fog Way
Dunn Loring, VA 22027
|
3,356 sq. feet
|
4 baths 4 beds |
show details | |

|
#34
Connecticut Ave NW Apt 606
Washington, DC 20008
|
160 sq. feet
|
1 baths 1 beds |
show details | |

|
#35
Dennington Dr
Bowie, MD 20721
|
4,164 sq. feet
|
2 baths 4 beds |
show details | |

|
#36
Windbreak Dr
Alexandria, VA 22306
|
1,360 sq. feet
|
3 baths 3 beds |
show details | |

|
#37
English Ct
Suitland, MD 20746
|
1,296 sq. feet
|
2 baths 3 beds |
show details | |

|
#38
Trent St
Clinton, MD 20735
|
1,080 sq. feet
|
2 baths 3 beds |
show details | |

|
#39
Peppertree Ln
Silver Spring, MD 20906
|
1,309 sq. feet
|
2 baths 3 beds |
show details | |

|
#40
Secretariat Dr
Bowie, MD 20721
|
3,050 sq. feet
|
4 baths 5 beds |
show details |
| Photo | Address | Area | Beds / Baths | Price | Details |
|---|---|---|---|---|---|

|
#41
Tayack Pl Unit 203
Alexandria, VA 22312
|
1,322 sq. feet
|
2 baths 2 beds |
show details | |

|
#42
Clovis Ave
Capitol Heights, MD 20743
|
952 sq. feet
|
1 baths 3 beds |
show details | |

|
#43
1918 M Street NE
Washington, DC 20002
|
5,487 sq. feet
|
12 baths 18 beds |
show details | |

|
#44
Arbroath Dr
Clinton, MD 20735
|
1,432 sq. feet
|
2 baths 3 beds |
show details | |

|
#45
Cathedral Ave NW Apt 404w
Washington, DC 20016
|
803 sq. feet
|
1 baths 1 beds |
show details | |

|
#46
New Mark Esplanade
Rockville, MD 20850
|
1,428 sq. feet
|
3 baths 2 beds |
show details | |

|
#47
Lee Landing Dr
Falls Church, VA 22043
|
900 sq. feet
|
1 baths 2 beds |
show details | |

|
#48
Southern Ave SE
Washington, DC 20019
|
1,024 sq. feet
|
1 baths 3 beds |
show details | |

|
#49
Sutton Ct
Upper Marlboro, MD 20774
|
1,546 sq. feet
|
3 baths 5 beds |
show details | |

|
Check over 1 million property listings on Foreclosure.com!
|
browse all offers | |||


- 3,40141.6%Black alone
- 2,85634.9%Hispanic
- 1,57919.3%White alone
- 1762.2%Two or more races
- 1071.3%Asian alone
- 871.1%Other race alone
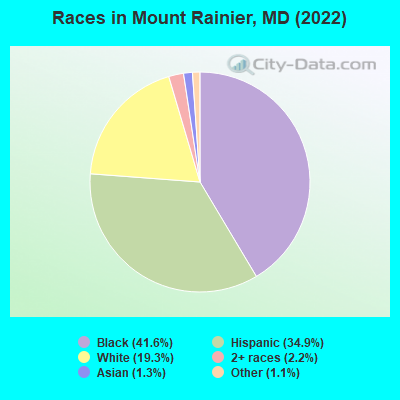
Races in Mount Rainier detailed stats: ancestries, foreign born residents, place of birth
According to our research of Maryland and other state lists, there were 10 registered sex offenders living in Mount Rainier, Maryland as of April 25, 2024.
The ratio of all residents to sex offenders in Mount Rainier is 846 to 1.
The ratio of registered sex offenders to all residents in this city is near the state average.
Type |
2009 |
2010 |
2011 |
2012 |
2013 |
2014 |
2015 |
2016 |
2017 |
2018 |
2019 |
2020 |
2022 |
|---|---|---|---|---|---|---|---|---|---|---|---|---|---|
| Murders (per 100,000) | 0 (0.0) | 0 (0.0) | 2 (24.5) | 1 (12.1) | 0 (0.0) | 0 (0.0) | 0 (0.0) | 0 (0.0) | 1 (11.7) | 0 (0.0) | 1 (12.3) | 0 (0.0) | 0 (0.0) |
| Rapes (per 100,000) | 1 (12.0) | 1 (12.4) | 1 (12.3) | 1 (12.1) | 1 (12.1) | 0 (0.0) | 1 (11.7) | 2 (23.4) | 0 (0.0) | 5 (61.0) | 1 (12.3) | 2 (24.6) | 2 (24.7) |
| Robberies (per 100,000) | 69 (831.0) | 58 (717.8) | 37 (453.6) | 39 (473.6) | 35 (423.3) | 26 (311.4) | 30 (352.3) | 24 (280.6) | 8 (93.9) | 19 (231.8) | 19 (233.3) | 32 (393.8) | 29 (357.5) |
| Assaults (per 100,000) | 9 (108.4) | 27 (334.2) | 26 (318.7) | 32 (388.6) | 14 (169.3) | 7 (83.8) | 13 (152.7) | 20 (233.9) | 15 (176.1) | 11 (134.2) | 12 (147.4) | 21 (258.4) | 15 (184.9) |
| Burglaries (per 100,000) | 57 (686.5) | 58 (717.8) | 52 (637.5) | 62 (753.0) | 64 (774.1) | 41 (491.1) | 61 (716.4) | 54 (631.4) | 30 (352.3) | 15 (183.0) | 24 (294.7) | 17 (209.2) | 18 (221.9) |
| Thefts (per 100,000) | 181 (2,180) | 192 (2,376) | 219 (2,685) | 149 (1,810) | 170 (2,056) | 188 (2,252) | 166 (1,950) | 143 (1,672) | 122 (1,433) | 214 (2,610) | 199 (2,444) | 152 (1,871) | 177 (2,182) |
| Auto thefts (per 100,000) | 74 (891.2) | 64 (792.1) | 71 (870.4) | 66 (801.6) | 46 (556.4) | 70 (838.4) | 56 (657.7) | 40 (467.7) | 32 (375.8) | 41 (500.1) | 32 (393.0) | 31 (381.5) | 31 (382.1) |
| Arson (per 100,000) | 2 (24.1) | 2 (24.8) | 0 (0.0) | 0 (0.0) | 0 (0.0) | 0 (0.0) | 0 (0.0) | 1 (11.7) | 0 (0.0) | 0 (0.0) | 0 (0.0) | 1 (12.3) | 0 (0.0) |
| City-Data.com crime index | 487.2 | 500.7 | 480.3 | 443.0 | 351.5 | 301.7 | 326.4 | 298.2 | 198.9 | 302.4 | 283.7 | 309.5 | 297.3 |
The City-Data.com crime index weighs serious crimes and violent crimes more heavily. Higher means more crime, U.S. average is 246.1. It adjusts for the number of visitors and daily workers commuting into cities.
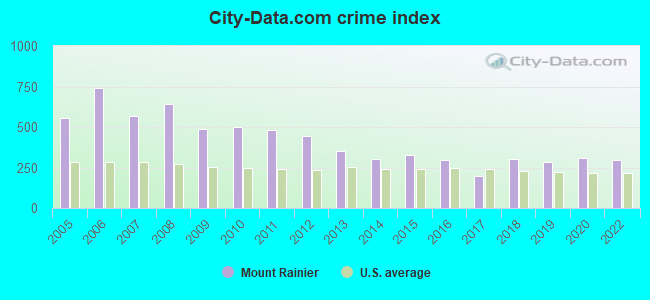
Crime rate in Mount Rainier detailed stats: murders, rapes, robberies, assaults, burglaries, thefts, arson
Full-time law enforcement employees in 2021, including police officers: 19 (17 officers - 15 male; 2 female).
| Officers per 1,000 residents here: | 2.09 |
| Maryland average: | 2.47 |
 Recent articles from our blog. Our writers, many of them Ph.D. graduates or candidates, create easy-to-read articles on a wide variety of topics.


Latest news from Mount Rainier, MD collected exclusively by city-data.com from local newspapers, TV, and radio stations
Ancestries: African (6.5%), Lithuanian (2.4%), Trinidadian and Tobagonian (1.9%), German (1.8%), American (1.3%), Irish (1.3%).
Current Local Time: EST time zone
Incorporated in 1910
Elevation: 130 feet
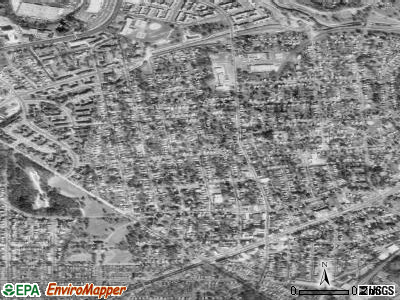
Land area: 0.65 square miles.
Population density: 12,468 people per square mile (very high).
2,981 residents are foreign born (25.8% Latin America, 5.8% Africa).
| This city: | 36.5% |
| Maryland: | 15.7% |
Median real estate property taxes paid for housing units with mortgages in 2022: $5,803 (1.0%)
Median real estate property taxes paid for housing units with no mortgage in 2022: $4,929 (1.0%)
Nearest city with pop. 50,000+: Washington, DC  (3.3 miles , pop. 572,059).
Nearest city with pop. 1,000,000+: Philadelphia, PA (121.5 miles , pop. 1,517,550).
Nearest cities:
), ), ), ), ), )Latitude: 38.94 N, Longitude: 76.96 W
Daytime population change due to commuting: -3,210 (-39.3%)
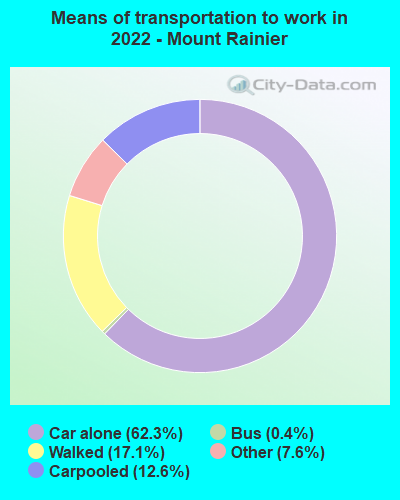
Workers who live and work in this city: 1,038 (21.9%)
Property values in Mount Rainier, MD
Mount Rainier, Maryland accommodation & food services, waste management - Economy and Business Data
| Here: | 2.1% |
| Maryland: | 2.0% |
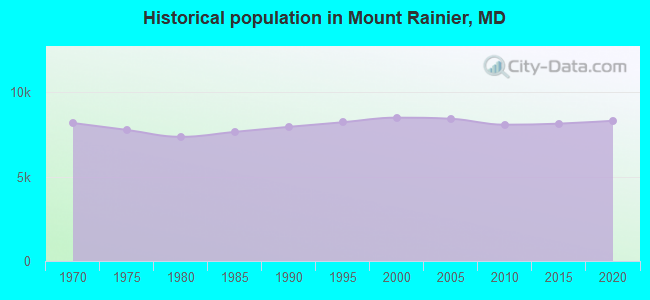
Population change in the 1990s: +418 (+5.2%).
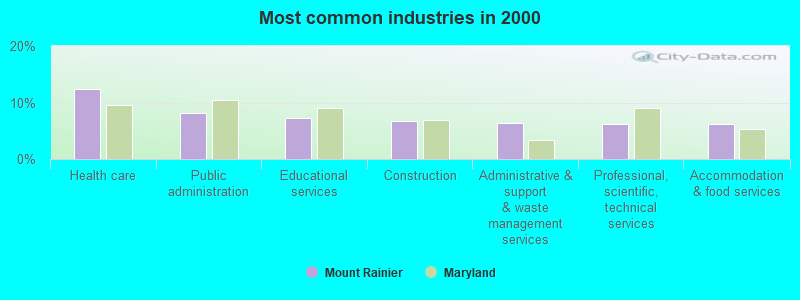
- Health care (12.4%)
- Public administration (8.1%)
- Educational services (7.3%)
- Construction (6.7%)
- Administrative & support & waste management services (6.5%)
- Professional, scientific, technical services (6.3%)
- Accommodation & food services (6.2%)
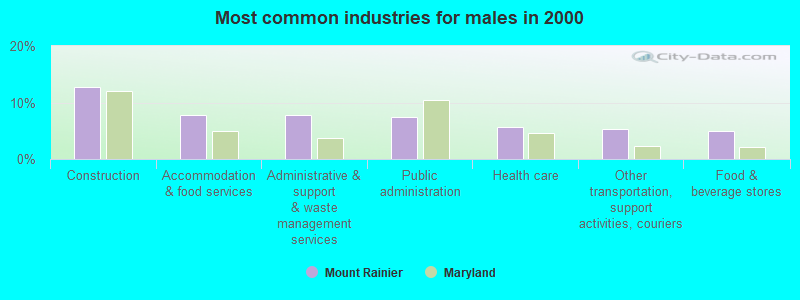
- Construction (12.7%)
- Accommodation & food services (7.8%)
- Administrative & support & waste management services (7.8%)
- Public administration (7.5%)
- Health care (5.7%)
- Other transportation, support activities, couriers (5.3%)
- Food & beverage stores (4.9%)
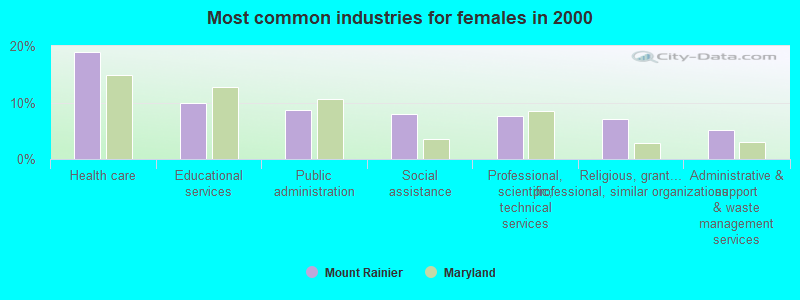
- Health care (19.0%)
- Educational services (10.0%)
- Public administration (8.7%)
- Social assistance (8.0%)
- Professional, scientific, technical services (7.7%)
- Religious, grantmaking, civic, professional, similar organizations (7.1%)
- Administrative & support & waste management services (5.1%)
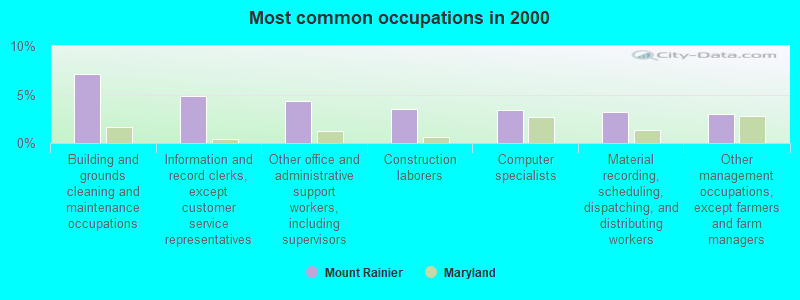
- Building and grounds cleaning and maintenance occupations (7.1%)
- Information and record clerks, except customer service representatives (4.9%)
- Other office and administrative support workers, including supervisors (4.4%)
- Construction laborers (3.5%)
- Computer specialists (3.4%)
- Material recording, scheduling, dispatching, and distributing workers (3.2%)
- Other management occupations, except farmers and farm managers (3.0%)
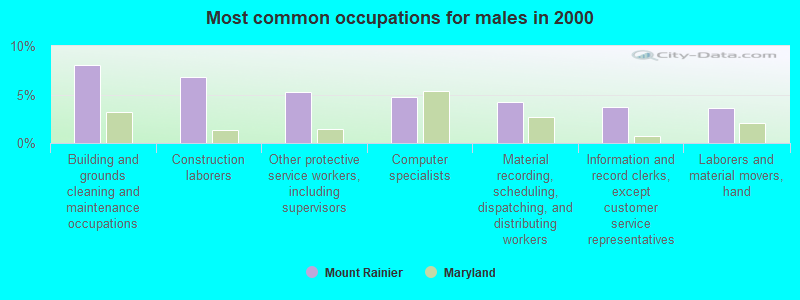
- Building and grounds cleaning and maintenance occupations (8.0%)
- Construction laborers (6.8%)
- Other protective service workers, including supervisors (5.3%)
- Computer specialists (4.7%)
- Material recording, scheduling, dispatching, and distributing workers (4.3%)
- Information and record clerks, except customer service representatives (3.7%)
- Laborers and material movers, hand (3.6%)
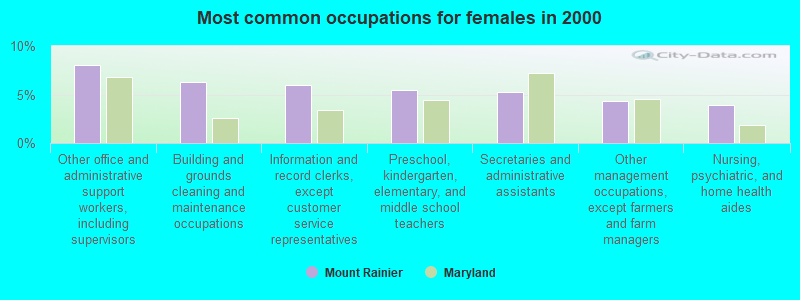
- Other office and administrative support workers, including supervisors (8.0%)
- Building and grounds cleaning and maintenance occupations (6.3%)
- Information and record clerks, except customer service representatives (6.0%)
- Preschool, kindergarten, elementary, and middle school teachers (5.5%)
- Secretaries and administrative assistants (5.2%)
- Other management occupations, except farmers and farm managers (4.3%)
- Nursing, psychiatric, and home health aides (4.0%)
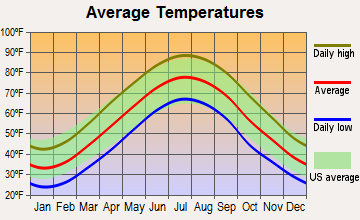
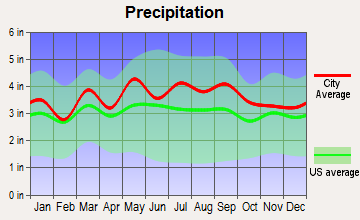
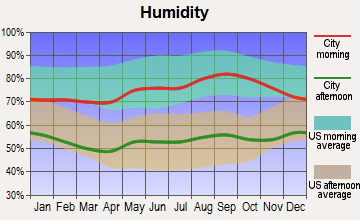
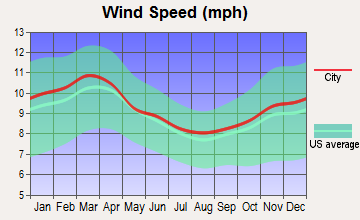
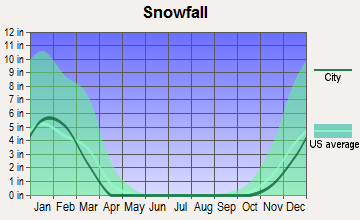
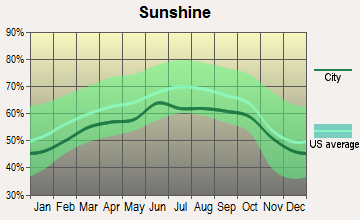
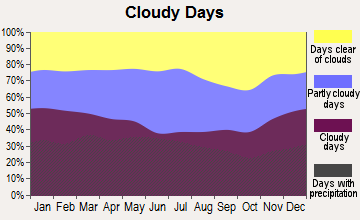
Average climate in Mount Rainier, Maryland
Based on data reported by over 4,000 weather stations
|
|

(lower is better)
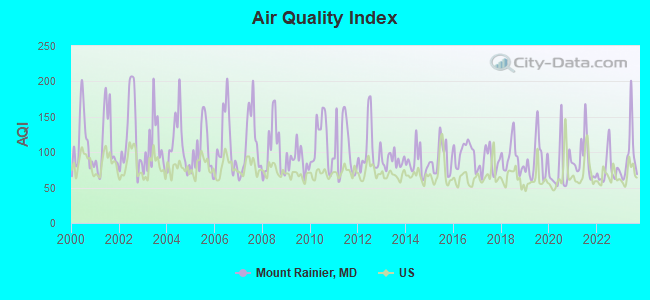
Air Quality Index (AQI) level in 2023 was 95.6. This is worse than average.
| City: | 95.6 |
| U.S.: | 72.6 |
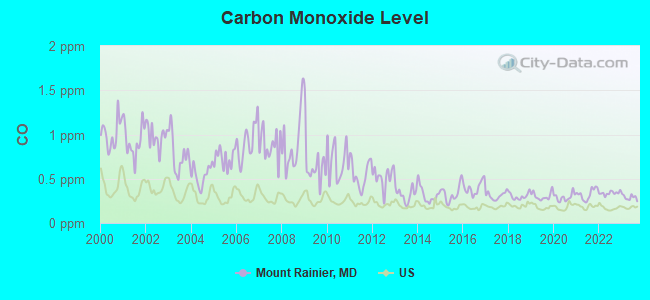
Carbon Monoxide (CO) [ppm] level in 2023 was 0.290. This is about average. Closest monitor was 1.8 miles away from the city center.
| City: | 0.290 |
| U.S.: | 0.251 |
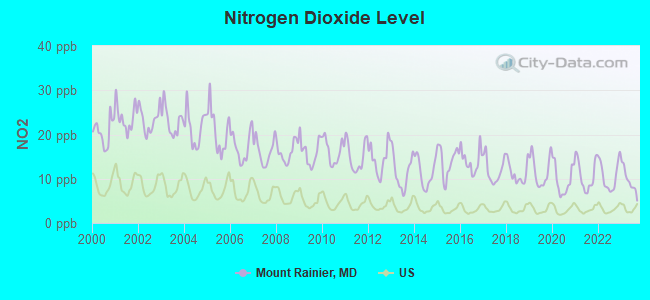
Nitrogen Dioxide (NO2) [ppb] level in 2023 was 9.56. This is significantly worse than average. Closest monitor was 1.8 miles away from the city center.
| City: | 9.56 |
| U.S.: | 5.11 |
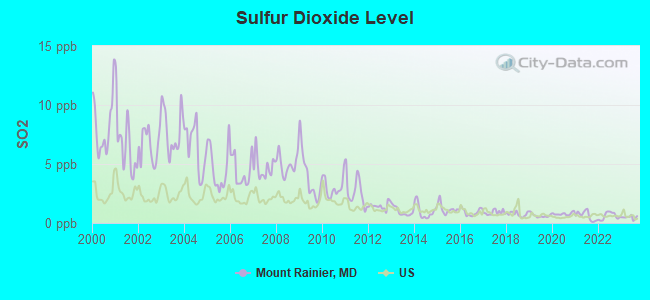
Sulfur Dioxide (SO2) [ppb] level in 2023 was 0.480. This is significantly better than average. Closest monitor was 1.8 miles away from the city center.
| City: | 0.480 |
| U.S.: | 1.515 |

Ozone [ppb] level in 2023 was 30.8. This is about average. Closest monitor was 1.8 miles away from the city center.
| City: | 30.8 |
| U.S.: | 33.3 |
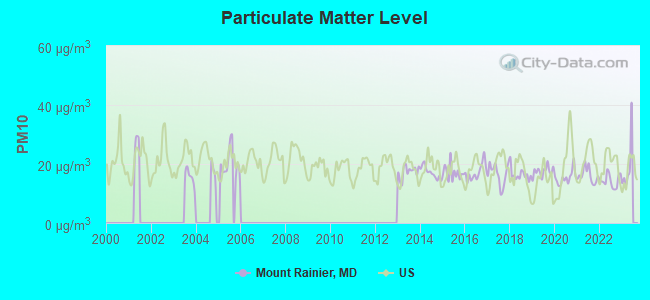
Particulate Matter (PM10) [µg/m3] level in 2022 was 14.3. This is better than average. Closest monitor was 1.6 miles away from the city center.
| City: | 14.3 |
| U.S.: | 19.2 |
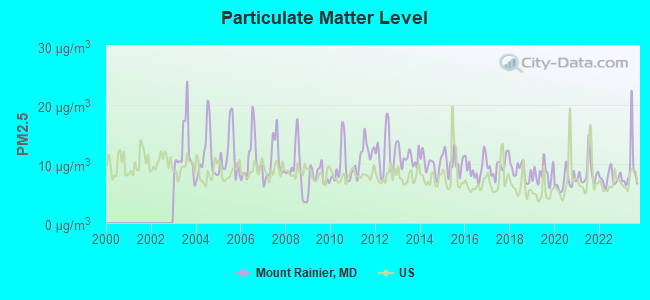
Particulate Matter (PM2.5) [µg/m3] level in 2023 was 9.22. This is about average. Closest monitor was 1.5 miles away from the city center.
| City: | 9.22 |
| U.S.: | 8.11 |
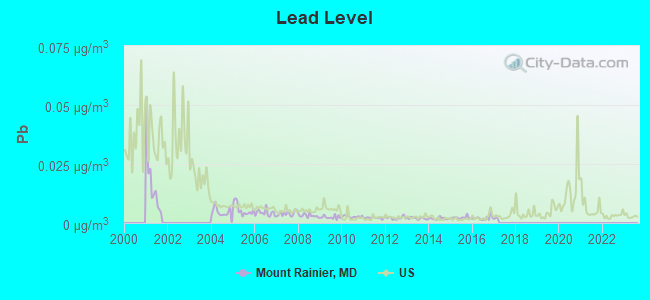
Lead (Pb) [µg/m3] level in 2016 was 0.00212. This is significantly better than average. Closest monitor was 1.6 miles away from the city center.
| City: | 0.00212 |
| U.S.: | 0.00931 |
Tornado activity:
Mount Rainier-area historical tornado activity is slightly above Maryland state average. It is 11% greater than the overall U.S. average.
On 9/24/2001, a category F3 (max. wind speeds 158-206 mph) tornado 1.2 miles away from the Mount Rainier city center killed 2 people and injured 55 people and caused $101 million in damages.
On 4/28/2002, a category F4 (max. wind speeds 207-260 mph) tornado 29.5 miles away from the city center killed 3 people and injured 122 people and caused $124 million in damages.
Earthquake activity:
Mount Rainier-area historical earthquake activity is significantly above Maryland state average. It is 57% smaller than the overall U.S. average.On 8/23/2011 at 17:51:04, a magnitude 5.8 (5.8 MW, Depth: 3.7 mi, Class: Moderate, Intensity: VI - VII) earthquake occurred 88.7 miles away from the city center
On 1/16/1994 at 01:49:16, a magnitude 4.6 (4.6 MB, 4.6 LG, Depth: 3.1 mi, Class: Light, Intensity: IV - V) earthquake occurred 108.0 miles away from the city center
On 8/25/2011 at 05:07:52, a magnitude 4.5 (4.5 ML, Depth: 4.2 mi) earthquake occurred 87.7 miles away from the city center
On 12/9/2003 at 20:59:18, a magnitude 4.5 (4.5 ML, Depth: 6.2 mi) earthquake occurred 101.6 miles away from Mount Rainier center
On 12/9/2003 at 20:59:14, a magnitude 4.5 (4.5 MB, 4.5 LG) earthquake occurred 106.7 miles away from Mount Rainier center
On 9/25/1998 at 19:52:52, a magnitude 5.2 (4.8 MB, 4.3 MS, 5.2 LG, 4.5 MW, Depth: 3.1 mi) earthquake occurred 252.9 miles away from Mount Rainier center
Magnitude types: regional Lg-wave magnitude (LG), body-wave magnitude (MB), local magnitude (ML), surface-wave magnitude (MS), moment magnitude (MW)
Natural disasters:
The number of natural disasters in Prince George's County (16) is near the US average (15).Major Disasters (Presidential) Declared: 11
Emergencies Declared: 5
Causes of natural disasters: Hurricanes: 5, Winter Storms: 5, Snowstorms: 3, Floods: 2, Storms: 2, Tropical Storms: 2, Blizzard: 1, Heavy Rain: 1, Ice Storm: 1, Snowfall: 1 (Note: some incidents may be assigned to more than one category).

Hospitals and medical centers near Mount Rainier:
- RAI - CHILLUM-HYATTSVILLE (Dialysis Facility, about 1 miles away; HYATTSVILLE, MD)
- UNIVERSAL DIALYSIS CENTER (Dialysis Facility, about 1 miles away; COTTAGE CITY, MD)
- US RENAL CARE - HYATTSVILLE (Dialysis Facility, about 2 miles away; HYATTSVILLE, MD)
- ST THOMAS MORE MEDICAL COMPLEX (Nursing Home, about 2 miles away; HYATTSVILLE, MD)
- T AND N NURSING CARE LLC (Home Health Center, about 2 miles away; WASHINGTON, DC)
- SACRED HEART HOME INC (Nursing Home, about 2 miles away; HYATTSVILLE, MD)
- INTERNATIONAL DIALYSIS CENTER LLC (Dialysis Facility, about 2 miles away; WASHINGTON, DC)
Amtrak stations near Mount Rainier:
- 4 miles: WASHINGTON (50 MASSACHUSETTS AVE. N.E.) . Services: ticket office, fully wheelchair accessible, enclosed waiting area, public restrooms, public payphones, full-service food facilities and snack bar, ATM, paid short-term parking, paid long-term parking, car rental agency, taxi stand, public transit connection.
- 6 miles: NEW CARROLLTON (4300 GARDEN CITY DR.) . Services: ticket office, fully wheelchair accessible, enclosed waiting area, public restrooms, public payphones, snack bar, ATM, paid short-term parking, paid long-term parking, call for car rental service, taxi stand, public transit connection.
- 11 miles: ALEXANDRIA (110 CALLAHAN DR.) . Services: ticket office, partially wheelchair accessible, enclosed waiting area, public restrooms, public payphones, vending machines, ATM, free short-term parking, free long-term parking, call for car rental service, call for taxi service, public transit connection.
Colleges/universities with over 2000 students nearest to Mount Rainier:
- Catholic University of America (about 2 miles; Washington, DC; Full-time enrollment: 5,365)
- University of Maryland-University College (about 4 miles; Adelphi, MD; FT enrollment: 25,040)
- Howard University (about 4 miles; Washington, DC; FT enrollment: 7,838)
- University of Maryland-College Park (about 4 miles; College Park, MD; FT enrollment: 32,734)
- Strayer University-Global Region (about 5 miles; Washington, DC; FT enrollment: 2,613)
- George Washington University (about 6 miles; Washington, DC; FT enrollment: 18,928)
- University of the District of Columbia (about 6 miles; Washington, DC; FT enrollment: 3,675)
Public elementary/middle schools in Mount Rainier:
- MT RAINIER ELEMENTARY (Location: 4011 32ND ST, Grades: PK-6)
- THOMAS S. STONE ELEMENTARY (Location: 4500 34TH ST, Grades: PK-5)
Points of interest:
Notable locations in Mount Rainier: Mount Rainier Police Department (A), Mount Rainier Branch Library (B), Mount Rainier Police Station (C), Mount Rainier Fire Station Company 3 (D), Mount Rainier City Hall (E), Mount Ranier Branch Prince George's County Memorial Library (F). Display/hide their locations on the map
Churches in Mount Rainier include: Mount Rainier Christian Church (A), Mount Rainier United Methodist Church (B), Saint James Catholic Church (C), Saint Johns Episcopal Church (D), Trinity Lutheran Church (E), First Baptist Church of Mount Rainier (F). Display/hide their locations on the map
Parks in Mount Rainier include: Mount Rainier Neighborhood Park (1), Mount Rainier Historic District (2). Display/hide their locations on the map
Birthplace of: Arthur S. Moreau, Jr. - Navy admiral, Harry Chappas - Baseball player.
| This city: | 2.4 people |
| Maryland: | 2.6 people |
| This city: | 51.9% |
| Whole state: | 67.1% |
| This city: | 7.4% |
| Whole state: | 6.4% |
Likely homosexual households (counted as self-reported same-sex unmarried-partner households)
- Lesbian couples: 0.7% of all households
- Gay men: 0.7% of all households
9 people in religious group quarters in 2000
For population 15 years and over in Mount Rainier:
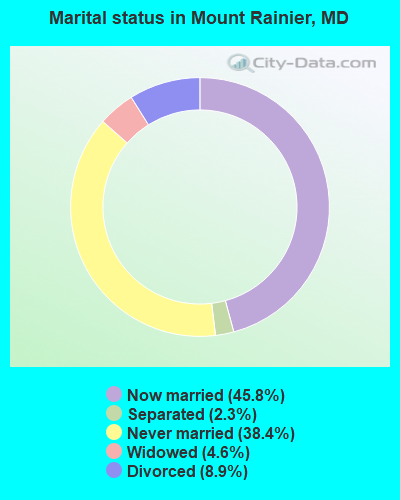
- Never married: 38.4%
- Now married: 45.8%
- Separated: 2.3%
- Widowed: 4.6%
- Divorced: 8.9%
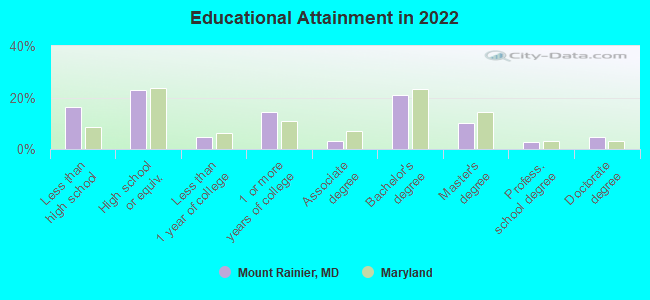
For population 25 years and over in Mount Rainier:
- High school or higher: 83.1%
- Bachelor's degree or higher: 36.7%
- Graduate or professional degree: 16.3%
- Unemployed: 7.4%
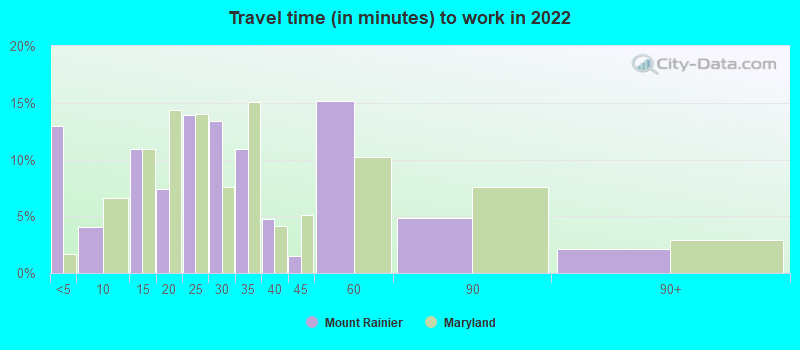
- Mean travel time to work (commute): 25.9 minutes
| Here: | 15.9 |
| Maryland average: | 12.7 |
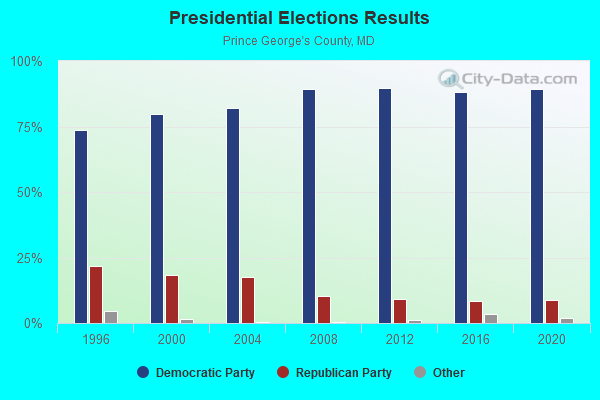
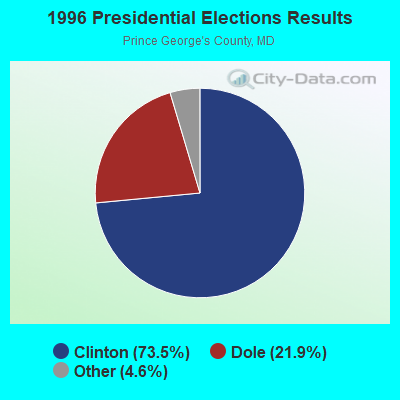
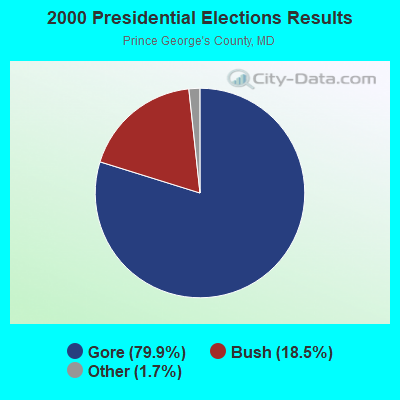
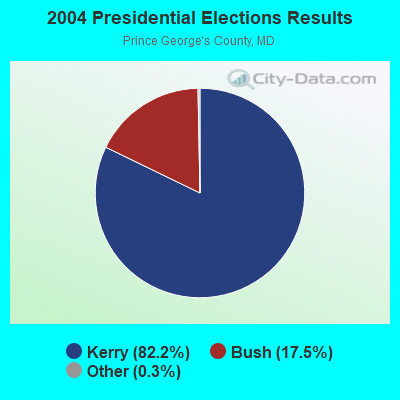
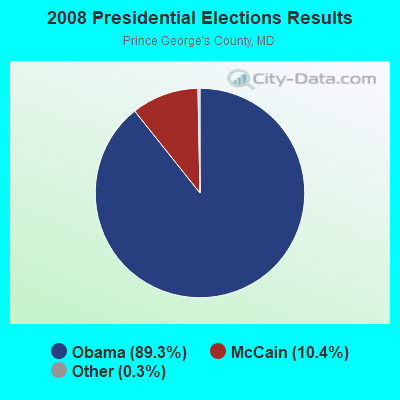

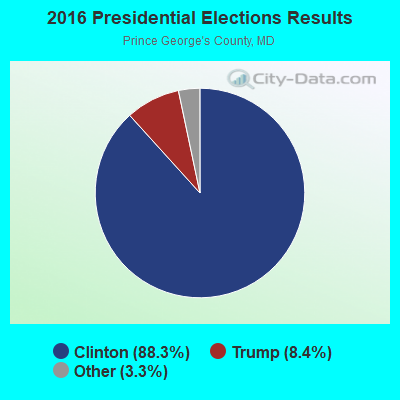
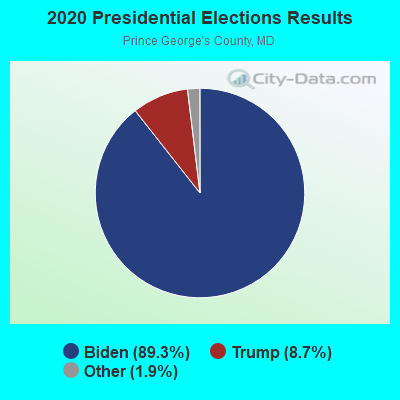
Graphs represent county-level data. Detailed 2008 Election Results
Religion statistics for Mount Rainier, MD (based on Prince George's County data)
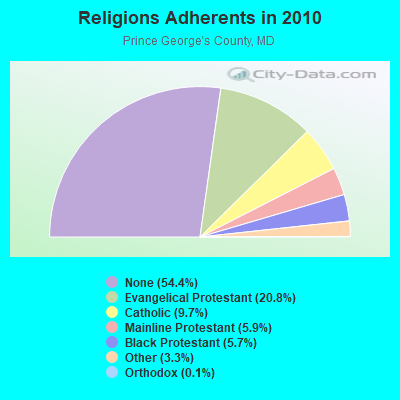
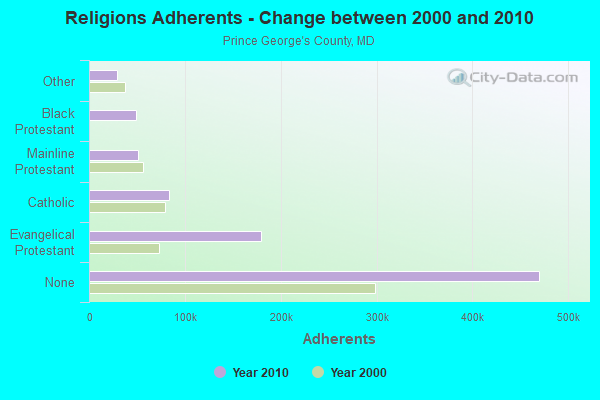
| Religion | Adherents | Congregations |
|---|---|---|
| Evangelical Protestant | 179,374 | 430 |
| Catholic | 83,959 | 35 |
| Mainline Protestant | 51,153 | 156 |
| Black Protestant | 48,984 | 66 |
| Other | 28,743 | 57 |
| Orthodox | 1,218 | 6 |
| None | 469,989 | - |
Food Environment Statistics:
| Here: | 1.70 / 10,000 pop. |
| Maryland: | 1.96 / 10,000 pop. |
| Prince George's County: | 0.02 / 10,000 pop. |
| Maryland: | 0.07 / 10,000 pop. |
| Prince George's County: | 1.60 / 10,000 pop. |
| Maryland: | 1.22 / 10,000 pop. |
| This county: | 1.66 / 10,000 pop. |
| State: | 2.05 / 10,000 pop. |
| Here: | 3.24 / 10,000 pop. |
| Maryland: | 5.40 / 10,000 pop. |
| Prince George's County: | 10.5% |
| State: | 9.1% |
| This county: | 30.7% |
| State: | 26.7% |
| This county: | 16.7% |
| State: | 15.5% |
Health and Nutrition:
| Mount Rainier: | 47.4% |
| Maryland: | 50.1% |
| Mount Rainier: | 47.0% |
| Maryland: | 47.6% |
| Here: | 29.2 |
| State: | 28.8 |
| Mount Rainier: | 19.4% |
| Maryland: | 20.0% |
| This city: | 11.4% |
| Maryland: | 11.3% |
| Here: | 6.6 |
| State: | 6.8 |
| This city: | 33.5% |
| Maryland: | 34.1% |
| Here: | 55.3% |
| Maryland: | 56.5% |
| Mount Rainier: | 83.9% |
| Maryland: | 80.5% |
More about Health and Nutrition of Mount Rainier, MD Residents
| Local government employment and payroll (March 2022) | |||||
| Function | Full-time employees | Monthly full-time payroll | Average yearly full-time wage | Part-time employees | Monthly part-time payroll |
|---|---|---|---|---|---|
| Police Protection - Officers | 19 | $123,781 | $78,177 | 0 | $0 |
| Other Government Administration | 8 | $27,778 | $41,667 | 0 | $0 |
| Streets and Highways | 7 | $29,736 | $50,976 | 0 | $0 |
| Other and Unallocable | 4 | $21,434 | $64,302 | 0 | $0 |
| Police - Other | 2 | $8,346 | $50,076 | 0 | $0 |
| Financial Administration | 1 | $9,553 | $114,636 | 0 | $0 |
| Totals for Government | 41 | $220,628 | $64,574 | 0 | $0 |
Mount Rainier government finances - Expenditure in 2017 (per resident):
- Current Operations - Police Protection: $2,677,000 ($329.44)
Regular Highways: $1,299,000 ($159.86)
Central Staff Services: $751,000 ($92.42)
Housing and Community Development: $624,000 ($76.79)
Protective Inspection and Regulation - Other: $274,000 ($33.72)
General - Other: $267,000 ($32.86)
Solid Waste Management: $100,000 ($12.31)
Parking Facilities: $98,000 ($12.06)
Judicial and Legal Services: $66,000 ($8.12)
Transit Utilities: $65,000 ($8.00)
General Public Buildings: $42,000 ($5.17)
- General - Interest on Debt: $112,000 ($13.78)
- Other Capital Outlay - Police Protection: $43,000 ($5.29)
Central Staff Services: $1,000 ($0.12)
- Total Salaries and Wages: $3,062,000 ($376.82)
Mount Rainier government finances - Revenue in 2017 (per resident):
- Charges - Parking Facilities: $33,000 ($4.06)
Other: $14,000 ($1.72)
Solid Waste Management: $6,000 ($0.74)
- Federal Intergovernmental - Highways: $576,000 ($70.88)
Other: $9,000 ($1.11)
- Local Intergovernmental - General Local Government Support: $27,000 ($3.32)
Housing and Community Development: $3,000 ($0.37)
Highways: $1,000 ($0.12)
Other: $1,000 ($0.12)
- Miscellaneous - Fines and Forfeits: $606,000 ($74.58)
General Revenue - Other: $62,000 ($7.63)
Rents: $32,000 ($3.94)
Interest Earnings: $4,000 ($0.49)
Sale of Property: $1,000 ($0.12)
- Revenue - Transit Utilities: $5,000 ($0.62)
- State Intergovernmental - Other: $284,000 ($34.95)
Highways: $105,000 ($12.92)
- Tax - Property: $4,374,000 ($538.27)
Occupation and Business License - Other: $378,000 ($46.52)
Public Utility License: $232,000 ($28.55)
Other License: $13,000 ($1.60)
Amusements Sales: $4,000 ($0.49)
Mount Rainier government finances - Debt in 2017 (per resident):
- Long Term Debt - Beginning Outstanding - Unspecified Public Purpose: $2,379,000 ($292.76)
Outstanding Unspecified Public Purpose: $2,119,000 ($260.77)
Retired Unspecified Public Purpose: $260,000 ($32.00)
Mount Rainier government finances - Cash and Securities in 2017 (per resident):
- Other Funds - Cash and Securities: $4,520,000 ($556.24)
6.37% of this county's 2021 resident taxpayers lived in other counties in 2020 ($55,200 average adjusted gross income)
| Here: | 6.37% |
| Maryland average: | 7.42% |
0.04% of residents moved from foreign countries ($466 average AGI)
Prince George's County: 0.04% Maryland average: 0.05%
Top counties from which taxpayers relocated into this county between 2020 and 2021:
| from District of Columbia, DC | |
| from Montgomery County, MD | |
| from Anne Arundel County, MD |
8.15% of this county's 2020 resident taxpayers moved to other counties in 2021 ($59,145 average adjusted gross income)
| Here: | 8.15% |
| Maryland average: | 7.91% |
0.05% of residents moved to foreign countries ($401 average AGI)
Prince George's County: 0.05% Maryland average: 0.04%
Top counties to which taxpayers relocated from this county between 2020 and 2021:
| to Montgomery County, MD | |
| to Anne Arundel County, MD | |
| to District of Columbia, DC |
| Businesses in Mount Rainier, MD | ||||
| Name | Count | Name | Count | |
|---|---|---|---|---|
| 7-Eleven | 3 | Penske | 1 | |
| Advance Auto Parts | 1 | U-Haul | 1 | |
Strongest AM radio stations in Mount Rainier:
- WTEM (980 AM; 50 kW; WASHINGTON, DC; Owner: AMFM RADIO LICENSES, L.L.C.)
- WPGC (1580 AM; 50 kW; MORNINGSIDE, MD; Owner: INFINITY WPGC(AM), INC.)
- WTOP (1500 AM; 50 kW; WASHINGTON, DC; Owner: BONNEVILLE HOLDING COMPANY)
- WUST (1120 AM; daytime; 20 kW; WASHINGTON, DC)
- WWRC (1260 AM; 5 kW; WASHINGTON, DC; Owner: AMFM RADIO LICENSES, L.L.C.)
- WMET (1150 AM; 50 kW; GAITHERSBURG, MD; Owner: BELTWAY ACQUISITION CORPORATION)
- WACA (1540 AM; daytime; 5 kW; WHEATON, MD; Owner: AC ACQUISITION, LLC)
- WCBM (680 AM; 50 kW; BALTIMORE, MD; Owner: WCBM MARYLAND, INC.)
- WABS (780 AM; daytime; 5 kW; ARLINGTON, VA; Owner: SALEM MEDIA OF VIRGINIA, INC.)
- WWGB (1030 AM; daytime; 50 kW; INDIAN HEAD, MD; Owner: GOOD BODY MEDIA, LLC)
- WMAL (630 AM; 5 kW; WASHINGTON, DC; Owner: WMAL, INC.)
- WBIS (1190 AM; 50 kW; ANNAPOLIS, MD; Owner: NATIONS RADIO, LLC)
- WOL (1450 AM; 1 kW; WASHINGTON, DC; Owner: RADIO ONE LICENSES, LLC)
Strongest FM radio stations in Mount Rainier:
- WBIG-FM (100.3 FM; WASHINGTON, DC; Owner: AMFM RADIO LICENSES, L.L.C.)
- WCSP-FM (90.1 FM; WASHINGTON, DC; Owner: NATIONAL CABLE SATELLITE CORPORATION)
- WRQX (107.3 FM; WASHINGTON, DC; Owner: WMAL, INC.)
- WHUR-FM (96.3 FM; WASHINGTON, DC; Owner: THE HOWARD UNIVERSITY)
- WASH (97.1 FM; WASHINGTON, DC; Owner: AMFM RADIO LICENSES, L.L.C.)
- WWDC-FM (101.1 FM; WASHINGTON, DC; Owner: AMFM RADIO LICENSES, L.L.C.)
- WKYS (93.9 FM; WASHINGTON, DC; Owner: RADIO ONE LICENSES, LLC)
- WARW (94.7 FM; BETHESDA, MD; Owner: INFINITY BROADCASTING OPERATIONS, INC.)
- WPGC-FM (95.5 FM; MORNINGSIDE, MD; Owner: INFINITY BROADCASTING CORPORATION OF MARYLAND)
- WIHT (99.5 FM; WASHINGTON, DC; Owner: AMFM RADIO LICENSES, L.L.C.)
- WHFS (99.1 FM; ANNAPOLIS, MD; Owner: INFINITY BROADCASTING OPERATIONS, INC.)
- WGMS-FM (103.5 FM; WASHINGTON, DC; Owner: BONNEVILLE HOLDING COMPANY)
- WAMU (88.5 FM; WASHINGTON, DC; Owner: THE EXEC. COMM. OF THE BD. OF TRUSTEES OF AMERICAN UNIV.)
- WMMJ (102.3 FM; BETHESDA, MD; Owner: RADIO ONE LICENSES, LLC)
- WPFW (89.3 FM; WASHINGTON, DC; Owner: PACIFICA FOUNDATION, INC.)
- WETA (90.9 FM; WASHINGTON, DC; Owner: GREATER WASHINGTON EDUCATIONAL TELECOMMUNICATIONS ASSN.)
- WGTS (91.9 FM; TAKOMA PARK, MD; Owner: COLUMBIA UNION COLLEGE BROADCASTING, INC.)
- WAVA (105.1 FM; ARLINGTON, VA; Owner: SALEM MEDIA OF VIRGINIA, INC.)
- WJFK-FM (106.7 FM; MANASSAS, VA; Owner: INFINITY BROADCASTING CORP. OF WASHINGTON, DC)
- WMZQ-FM (98.7 FM; WASHINGTON, DC; Owner: AMFM RADIO LICENSES, L.L.C.)
TV broadcast stations around Mount Rainier:
- WBDC-TV (Channel 50; WASHINGTON, DC; Owner: WBDC BROADCASTING, INC.)
- WJLA-TV (Channel 7; WASHINGTON, DC; Owner: ACC LICENSEE, INC.)
- WUSA (Channel 9; WASHINGTON, DC; Owner: THE DETROIT NEWS, INC.)
- WTTG (Channel 5; WASHINGTON, DC; Owner: FOX TELEVISION STATIONS, INC.)
- WZDC-LP (Channel 64; WASHINGTON, DC; Owner: ONDA CAPITAL, INC.)
- WHUT-TV (Channel 32; WASHINGTON, DC; Owner: HOWARD UNIVERSITY)
- WRC-TV (Channel 4; WASHINGTON, DC; Owner: NBC SUBSIDIARY (WRC-TV), INC.)
- WETA-TV (Channel 26; WASHINGTON, DC; Owner: THE GREATER WASHINGTON ED TELECOMM. ASSOC)
- WDCA (Channel 20; WASHINGTON, DC; Owner: FOX TELEVISION STATIONS, INC.)
- W28BY (Channel 63; BALTIMORE, MD; Owner: INFORMATION SUPER STATION, L.L.C.)
- WMDO-CA (Channel 30; WASHINGTON, DC; Owner: ENTRAVISION HOLDINGS, LLC)
- WKRP-LP (Channel 42; WASHINGTON, DC; Owner: CAPITAL MEDIA, LLC)
- WNVC (Channel 56; FAIRFAX, VA; Owner: COMMONWEALTH PUBLIC BROADCASTING CORPORATION)
- WMPT (Channel 22; ANNAPOLIS, MD; Owner: MARYLAND PUBLIC BROADCASTING COMMISSION)
- WBAL-TV (Channel 11; BALTIMORE, MD; Owner: WBAL HEARST-ARGYLE TV, INC. (CA CORP.))
- WMAR-TV (Channel 2; BALTIMORE, MD; Owner: SCRIPPS HOWARD BROADCASTING COMPANY)
- WBFF (Channel 45; BALTIMORE, MD; Owner: CHESAPEAKE TELEVISION LICENSEE, LLC)
- WNUV (Channel 54; BALTIMORE, MD; Owner: BALTIMORE (WNUV-TV) LICENSEE, INC.)
- WUTB (Channel 24; BALTIMORE, MD; Owner: FOX TELEVISION STATIONS, INC.)
- WIAV-LP (Channel 58; WASHINGTON, DC; Owner: ASIAVISION, INC.)
- WJZ-TV (Channel 13; BALTIMORE, MD; Owner: VIACOM INC.)
- WMPB (Channel 67; BALTIMORE, MD; Owner: MARYLAND PUBLIC BROADCASTING COMMISSION)
- WPXW (Channel 66; MANASSAS, VA; Owner: PAXSON WASHINGTON LICENSE, INC.)
- W63BP (Channel 63; ANNAPOLIS, MD; Owner: ANNAPOLIS BROADCASTING COMPANY, INC.)
- WNVT (Channel 53; GOLDVEIN, VA; Owner: COMMONWEALTH PUBLIC BROADCASTING CORPORATION)
- National Bridge Inventory (NBI) Statistics
- 4Number of bridges
- 16ft / 5.4mTotal length
- 10,185Total average daily traffic
- 508Total average daily truck traffic
- 13,616Total future (year 2036) average daily traffic
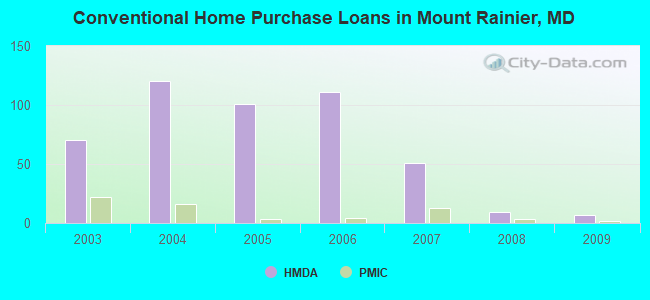
| Home Mortgage Disclosure Act Aggregated Statistics For Year 2009 (Based on 1 full and 1 partial tracts) | ||||||||||||
| A) FHA, FSA/RHS & VA Home Purchase Loans | B) Conventional Home Purchase Loans | C) Refinancings | D) Home Improvement Loans | E) Loans on Dwellings For 5+ Families | F) Non-occupant Loans on < 5 Family Dwellings (A B C & D) | |||||||
|---|---|---|---|---|---|---|---|---|---|---|---|---|
| Number | Average Value | Number | Average Value | Number | Average Value | Number | Average Value | Number | Average Value | Number | Average Value | |
| LOANS ORIGINATED | 22 | $225,455 | 7 | $188,143 | 53 | $206,112 | 2 | $170,000 | 1 | $9,358,800 | 0 | $0 |
| APPLICATIONS APPROVED, NOT ACCEPTED | 1 | $100,000 | 3 | $148,333 | 10 | $167,305 | 0 | $0 | 0 | $0 | 0 | $0 |
| APPLICATIONS DENIED | 0 | $0 | 3 | $182,333 | 43 | $212,241 | 4 | $142,878 | 0 | $0 | 3 | $70,943 |
| APPLICATIONS WITHDRAWN | 5 | $246,600 | 4 | $226,000 | 28 | $196,239 | 1 | $161,650 | 0 | $0 | 3 | $207,667 |
| FILES CLOSED FOR INCOMPLETENESS | 0 | $0 | 0 | $0 | 8 | $215,750 | 1 | $45,000 | 0 | $0 | 0 | $0 |
Detailed HMDA statistics for the following Tracts: 8047.00 , 8048.00
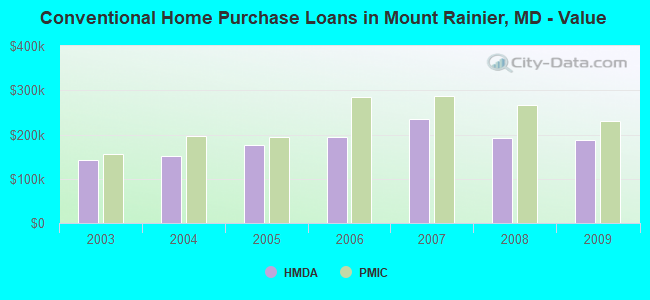
| Private Mortgage Insurance Companies Aggregated Statistics For Year 2009 (Based on 1 full and 1 partial tracts) | ||||
| A) Conventional Home Purchase Loans | B) Refinancings | |||
|---|---|---|---|---|
| Number | Average Value | Number | Average Value | |
| LOANS ORIGINATED | 2 | $230,435 | 1 | $220,000 |
| APPLICATIONS APPROVED, NOT ACCEPTED | 3 | $325,000 | 0 | $0 |
| APPLICATIONS DENIED | 0 | $0 | 0 | $0 |
| APPLICATIONS WITHDRAWN | 0 | $0 | 0 | $0 |
| FILES CLOSED FOR INCOMPLETENESS | 0 | $0 | 0 | $0 |
Detailed PMIC statistics for the following Tracts: 8047.00 , 8048.00
| Most common first names in Mount Rainier, MD among deceased individuals | ||
| Name | Count | Lived (average) |
|---|---|---|
| James | 33 | 67.6 years |
| William | 31 | 71.4 years |
| Mary | 31 | 78.3 years |
| John | 25 | 74.6 years |
| Charles | 20 | 69.8 years |
| Robert | 15 | 71.3 years |
| Helen | 14 | 78.5 years |
| George | 14 | 69.1 years |
| Thomas | 13 | 76.7 years |
| Mildred | 12 | 77.7 years |
| Most common last names in Mount Rainier, MD among deceased individuals | ||
| Last name | Count | Lived (average) |
|---|---|---|
| Williams | 16 | 78.8 years |
| Smith | 13 | 73.2 years |
| Brown | 12 | 64.7 years |
| Carter | 8 | 73.2 years |
| White | 8 | 74.7 years |
| Thompson | 8 | 71.6 years |
| Jones | 7 | 61.6 years |
| Howard | 7 | 79.7 years |
| Davis | 7 | 57.3 years |
| Bell | 6 | 80.8 years |
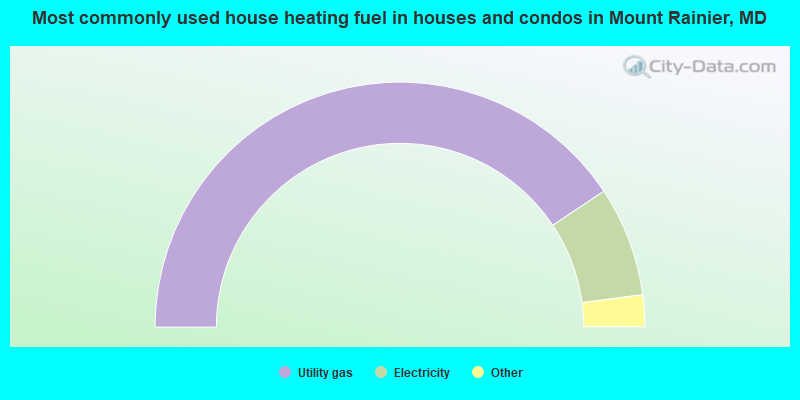
- 81.4%Utility gas
- 14.5%Electricity
- 2.4%Fuel oil, kerosene, etc.
- 1.8%Bottled, tank, or LP gas
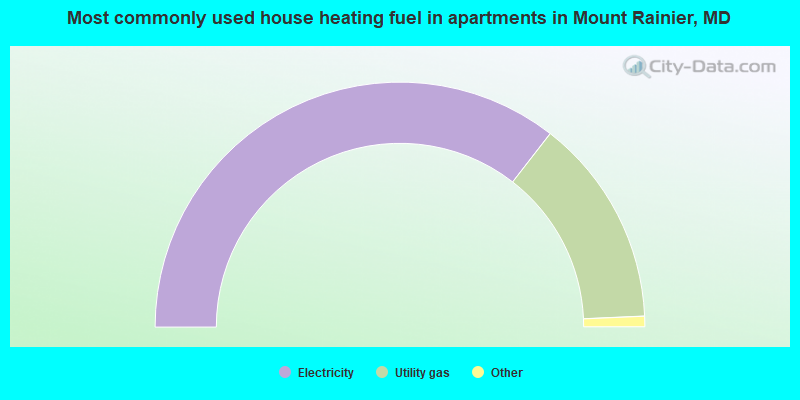
- 71.1%Electricity
- 27.6%Utility gas
- 0.9%Bottled, tank, or LP gas
- 0.4%No fuel used
Mount Rainier compared to Maryland state average:
- Median household income below state average.
- Unemployed percentage below state average.
- Hispanic race population percentage significantly above state average.
- Foreign-born population percentage above state average.
- Renting percentage significantly above state average.
- Length of stay since moving in above state average.
- Number of rooms per house significantly below state average.
- House age above state average.
Mount Rainier on our top lists:
- #14 on the list of "Top 101 cities with the most people walking to work (population 5,000+)"
- #30 on the list of "Top 101 cities with the most people taking subway or elevated to work (population 5,000+)"
- #31 on the list of "Top 101 cities with the most residents born in El Salvador (population 500+)"
- #36 on the list of "Top 101 cities with the least people driving a car to work alone (population 5,000+)"
- #48 on the list of "Top 101 cities with the lowest percentage of workers working at home, population 5,000+"
- #52 on the list of "Top 101 cities with the highest housing density (population 2,000+)"
- #55 on the list of "Top 101 cities with the smallest house values disparities (population 5,000+)"
- #62 on the list of "Top 101 cities with the most residents born in Ethiopia (population 500+)"
- #67 on the list of "Top 101 cities with the highest number of robberies per 100,000 residents, excludes tourist destinations and others with a lot of outsiders visiting based on city industries data (population 5,000+)"
- #68 on the list of "Top 101 cities with largest percentage of males in industries: construction (population 5,000+)"
- #73 on the list of "Top 100 cities with highest percentage of renters (pop. 5,000+)"
- #76 on the list of "Top 101 cities with the most residents born in Eastern Africa (population 500+)"
- #78 on the list of "Top 101 cities with largest percentage of males in occupations: construction and extraction occupations (population 5,000+)"
- #82 on the list of "Top 101 cities with the most residents born in Other Western Africa (population 500+)"
- #84 on the list of "Top 101 cities with the most residents born in Middle Africa (population 500+)"
- #90 on the list of "Top 101 cities with the highest number of auto thefts per 100,000 residents, excludes tourist destinations and others with a lot of outsiders visiting based on city industries data (population 5,000+)"
- #92 on the list of "Top 100 cities with smallest houses (pop. 5,000+)"
- #96 on the list of "Top 101 cities with largest percentage of females in industries: other services, except public administration (population 5,000+)"
- #97 on the list of "Top 101 cities with the most residents born in Africa (population 500+)"
- #97 on the list of "Top 101 cities with the most residents born in Trinidad and Tobago (population 500+)"
- #89 (20712) on the list of "Top 101 zip codes with the largest percentage of Subsaharan African first ancestries (pop 5,000+)"
- #5 on the list of "Top 101 counties with highest percentage of residents voting for Obama (Democrat) in the 2012 Presidential Election"
- #12 on the list of "Top 101 counties with the highest number of infant deaths per 1000 residents 2007-2013 (pop. 50,000+)"
- #13 on the list of "Top 101 counties with the highest average weight of females"
- #14 on the list of "Top 101 counties with the highest Nitrogen Dioxide air pollution readings in 2012 (ppm)"
- #14 on the list of "Top 101 counties with the most Black Protestant adherents"

|
Total of 5 patent applications in 2008-2024.