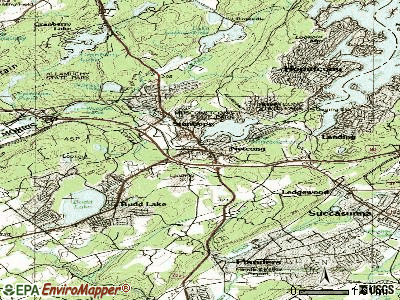
Netcong, New Jersey
Submit your own pictures of this borough and show them to the world
- OSM Map
- General Map
- Google Map
- MSN Map
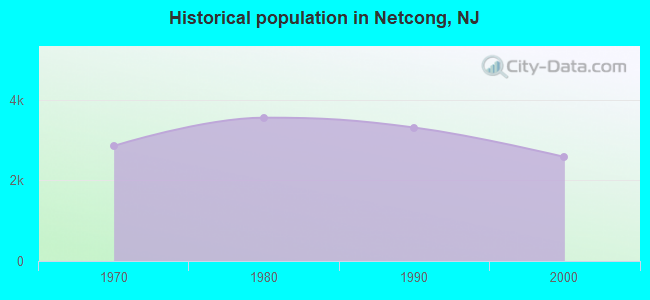
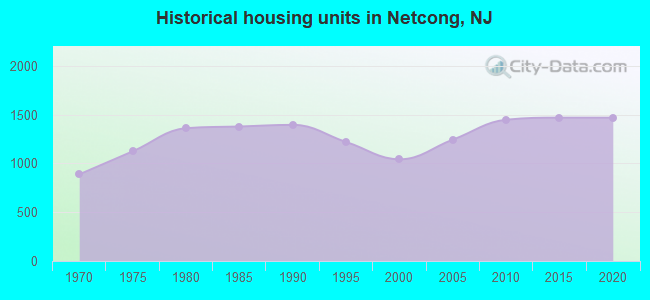
Population change since 2000: +41.9%
| Males: 1,741 | |
| Females: 1,920 |
| Median resident age: | 43.5 years |
| New Jersey median age: | 40.4 years |
Zip codes: 07857.
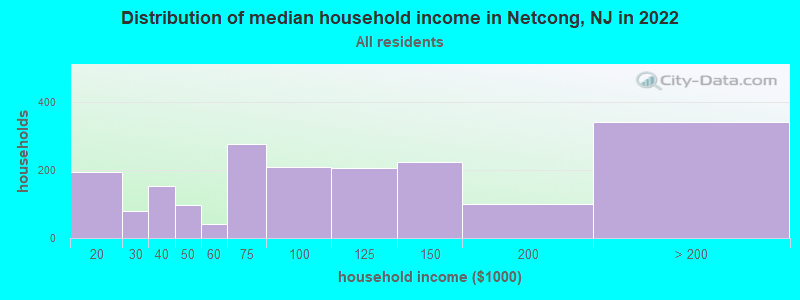
| Netcong: | $83,752 |
| NJ: | $96,346 |
Estimated per capita income in 2022: $54,981 (it was $23,472 in 2000)
Netcong borough income, earnings, and wages data
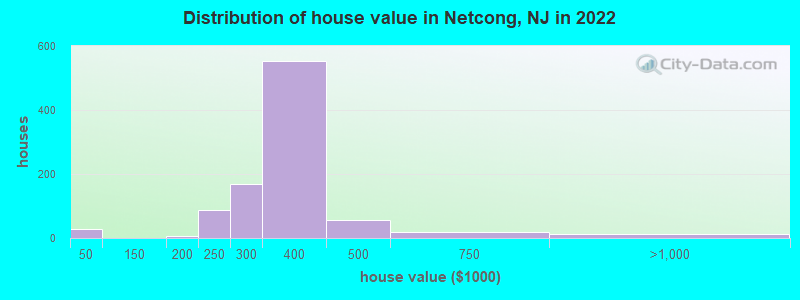
Estimated median house or condo value in 2022: $341,856 (it was $149,600 in 2000)
| Netcong: | $341,856 |
| NJ: | $428,900 |
Mean prices in 2022: all housing units: $324,484; detached houses: $330,459; townhouses or other attached units: $289,836
Median gross rent in 2022: $1,340.
(5.2% for White Non-Hispanic residents, 31.3% for Hispanic or Latino residents, 5.1% for two or more races residents)
Detailed information about poverty and poor residents in Netcong, NJ
Compare current foreclosures near Netcong, NJ:
| Photo | Address | Area | Beds / Baths | Price | Details |
|---|---|---|---|---|---|

|
#1
Koclas Dr
Netcong, NJ 07857
|
2,050 sq. feet
|
3 baths 5 beds |
show details | |

|
#2
Amendola Dr
Netcong, NJ 07857
|
1,296 sq. feet
|
- baths - beds |
show details | |

|
#3
Barone St
Netcong, NJ 07857
|
1,120 sq. feet
|
- baths - beds |
show details | |

|
#4
Allen St
Netcong, NJ 07857
|
1,633 sq. feet
|
- baths - beds |
show details | |

|
#5
Wiltop Rd
Netcong, NJ 07857
|
1,680 sq. feet
|
- baths - beds |
show details | |

|
#6
Dylan Dr
Sparta, NJ 07871
|
1,267 sq. feet
|
2 baths 2 beds |
$399,900
|
show details |

|
#7
Maple Ave
Stockholm, NJ 07460
|
1,305 sq. feet
|
1 baths 3 beds |
$364,900
|
show details |

|
#8
Bucknell Trl
Hopatcong, NJ 07843
|
672 sq. feet
|
1 baths 2 beds |
$279,900
|
show details |

|
#9
River Styx Rd
Hopatcong, NJ 07843
|
1,389 sq. feet
|
1 baths 3 beds |
$123,900
|
show details |

|
#10
S Beverwyck Rd
Parsippany, NJ 07054
|
895 sq. feet
|
1 baths 3 beds |
$306,800
|
show details |
| Photo | Address | Area | Beds / Baths | Price | Details |
|---|---|---|---|---|---|

|
#11
Branchville Lawson Rd
Newton, NJ 07860
|
1,100 sq. feet
|
1 baths 2 beds |
$349,900
|
show details |

|
#12
Lawrence Rd
Lafayette, NJ 07848
|
2,677 sq. feet
|
3 baths 3 beds |
$559,900
|
show details |

|
#13
Millbrook Rd
Blairstown, NJ 07825
|
1,248 sq. feet
|
1 baths 4 beds |
$260,000
|
show details |

|
#14
Axford Ave
Oxford, NJ 07863
|
1,040 sq. feet
|
1 baths 3 beds |
show details | |

|
#15
Aspen Ct
Stanhope, NJ 07874
|
861 sq. feet
|
1 baths 1 beds |
show details | |

|
#16
State Route 10 Bldg
Morris Plains, NJ 07950
|
800 sq. feet
|
1 baths 1 beds |
show details | |

|
#17
Budd Ave
Budd Lake, NJ 07828
|
816 sq. feet
|
1 baths 2 beds |
show details | |

|
#18
Tamarack Rd
Andover, NJ 07821
|
1,250 sq. feet
|
1 baths 2 beds |
show details | |

|
#19
Hutchins Ln
Randolph, NJ 07869
|
3,731 sq. feet
|
3 baths 4 beds |
show details | |

|
#20
Vivian Plz
Newton, NJ 07860
|
1,776 sq. feet
|
2 baths 3 beds |
show details |
| Photo | Address | Area | Beds / Baths | Price | Details |
|---|---|---|---|---|---|

|
#21
Tamarack Rd
Belvidere, NJ 07823
|
3,466 sq. feet
|
2 baths 4 beds |
show details | |

|
#22
Birch Pkwy
Sparta, NJ 07871
|
1,792 sq. feet
|
3 baths 3 beds |
show details | |

|
#23
Sand Shore Rd
Budd Lake, NJ 07828
|
936 sq. feet
|
1 baths 2 beds |
show details | |

|
#24
Rt 206
Andover, NJ 07821
|
- sq. feet
|
2 baths 4 beds |
show details | |

|
#25
Ka Ton Nah Trl
Andover, NJ 07821
|
966 sq. feet
|
1 baths 2 beds |
show details | |

|
#26
Cliffwood Rd
Chester, NJ 07930
|
3,486 sq. feet
|
2 baths 4 beds |
show details | |

|
#27
Rollins Trl
Hopatcong, NJ 07843
|
2,251 sq. feet
|
2 baths 3 beds |
show details | |

|
#28
W Baldwin St
Hackettstown, NJ 07840
|
1,778 sq. feet
|
2 baths 3 beds |
show details | |

|
#29
Grannis Ave
Morris Plains, NJ 07950
|
2,294 sq. feet
|
1 baths 4 beds |
show details | |

|
#30
Wildcat Rd
Sparta, NJ 07871
|
888 sq. feet
|
1 baths 3 beds |
show details |
| Photo | Address | Area | Beds / Baths | Price | Details |
|---|---|---|---|---|---|

|
#31
Carlisle Ct
Chester, NJ 07930
|
5,735 sq. feet
|
5 baths 4 beds |
show details | |

|
#32
Douglas Dr
Sparta, NJ 07871
|
5,746 sq. feet
|
5 baths 4 beds |
show details | |

|
#33
Windy Bush Ln
Sparta, NJ 07871
|
1,778 sq. feet
|
2 baths 2 beds |
show details | |

|
#34
Ironia Rd
Mendham, NJ 07945
|
5,025 sq. feet
|
4 baths 5 beds |
show details | |

|
#35
Kensington Ct
Morristown, NJ 07960
|
4,424 sq. feet
|
6 baths 6 beds |
show details | |

|
#36
Lyons Ave
Stockholm, NJ 07460
|
582 sq. feet
|
1 baths 2 beds |
show details | |

|
#37
Shores Rd
Brookside, NJ 07926
|
- sq. feet
|
2 baths 4 beds |
show details | |

|
#38
Garden Ct
Succasunna, NJ 07876
|
1,150 sq. feet
|
1 baths 2 beds |
show details | |

|
#39
Lord Stirling Dr
Parsippany, NJ 07054
|
1,930 sq. feet
|
3 baths 4 beds |
show details | |

|
#40
Maple Path
Landing, NJ 07850
|
1,204 sq. feet
|
- baths - beds |
show details |
| Photo | Address | Area | Beds / Baths | Price | Details |
|---|---|---|---|---|---|

|
#41
Iowa Ave
Rockaway, NJ 07866
|
2,936 sq. feet
|
- baths - beds |
show details | |

|
#42
Sussex Ave
Morristown, NJ 07960
|
2,367 sq. feet
|
- baths - beds |
show details | |

|
#43
James Dr
Mount Arlington, NJ 07856
|
3,004 sq. feet
|
- baths - beds |
show details | |

|
#44
Tulsa Trl
Hopatcong, NJ 07843
|
884 sq. feet
|
- baths - beds |
show details | |

|
#45
Van Kirk Pl
Sparta, NJ 07871
|
4,772 sq. feet
|
- baths - beds |
show details | |

|
#46
Sunrise Ct
Sparta, NJ 07871
|
3,892 sq. feet
|
- baths - beds |
show details | |

|
#47
Scenic Dr
Newton, NJ 07860
|
1,908 sq. feet
|
- baths - beds |
show details | |

|
#48
Marsh Hawk # 2
Hackettstown, NJ 07840
|
552 sq. feet
|
1 baths - beds |
show details | |

|
#49
Schindler Ct
Newton, NJ 07860
|
3,877 sq. feet
|
- baths - beds |
show details | |

|
Check over 1 million property listings on Foreclosure.com!
|
browse all offers | |||


- 2,33366.7%White alone
- 66519.0%Hispanic
- 2958.4%Black alone
- 1664.7%Two or more races
- 220.6%American Indian alone
- 110.3%Asian alone
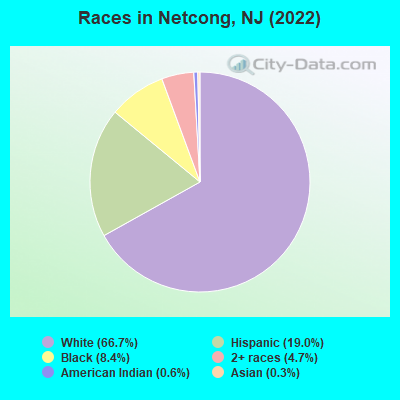
Races in Netcong detailed stats: ancestries, foreign born residents, place of birth
According to our research of New Jersey and other state lists, there were 4 registered sex offenders living in Netcong, New Jersey as of April 25, 2024.
The ratio of all residents to sex offenders in Netcong is 812 to 1.
Type |
2009 |
2010 |
2011 |
2012 |
2013 |
2014 |
2015 |
2016 |
2017 |
2018 |
2019 |
2020 |
2021 |
2022 |
|---|---|---|---|---|---|---|---|---|---|---|---|---|---|---|
| Murders (per 100,000) | 0 (0.0) | 0 (0.0) | 0 (0.0) | 0 (0.0) | 0 (0.0) | 0 (0.0) | 0 (0.0) | 0 (0.0) | 0 (0.0) | 0 (0.0) | 0 (0.0) | 0 (0.0) | 0 (0.0) | 0 (0.0) |
| Rapes (per 100,000) | 1 (31.0) | 0 (0.0) | 0 (0.0) | 0 (0.0) | 2 (61.0) | 0 (0.0) | 3 (92.1) | 0 (0.0) | 0 (0.0) | 2 (62.9) | 5 (158.7) | 0 (0.0) | 0 (0.0) | 0 (0.0) |
| Robberies (per 100,000) | 0 (0.0) | 0 (0.0) | 2 (61.7) | 0 (0.0) | 0 (0.0) | 0 (0.0) | 0 (0.0) | 4 (123.5) | 4 (123.2) | 1 (31.4) | 0 (0.0) | 1 (32.1) | 0 (0.0) | 0 (0.0) |
| Assaults (per 100,000) | 1 (31.0) | 2 (61.9) | 4 (123.3) | 4 (122.5) | 5 (152.5) | 3 (91.9) | 0 (0.0) | 3 (92.6) | 1 (30.8) | 0 (0.0) | 6 (190.4) | 0 (0.0) | 0 (0.0) | 4 (100.7) |
| Burglaries (per 100,000) | 19 (589.9) | 11 (340.3) | 9 (277.5) | 14 (428.7) | 13 (396.5) | 16 (490.3) | 11 (337.5) | 5 (154.3) | 14 (431.2) | 1 (31.4) | 2 (63.5) | 2 (64.2) | 6 (185.1) | 8 (201.4) |
| Thefts (per 100,000) | 50 (1,552) | 50 (1,547) | 34 (1,048) | 61 (1,868) | 34 (1,037) | 22 (674.2) | 13 (398.9) | 26 (802.5) | 36 (1,109) | 12 (377.1) | 25 (793.4) | 11 (353.0) | 20 (616.9) | 20 (503.4) |
| Auto thefts (per 100,000) | 0 (0.0) | 0 (0.0) | 1 (30.8) | 4 (122.5) | 2 (61.0) | 0 (0.0) | 2 (61.4) | 3 (92.6) | 5 (154.0) | 1 (31.4) | 1 (31.7) | 0 (0.0) | 2 (61.7) | 1 (25.2) |
| Arson (per 100,000) | 0 (0.0) | 1 (30.9) | 0 (0.0) | 0 (0.0) | 0 (0.0) | 1 (30.6) | 0 (0.0) | 0 (0.0) | 0 (0.0) | 0 (0.0) | 0 (0.0) | 0 (0.0) | 0 (0.0) | 0 (0.0) |
| City-Data.com crime index | 134.4 | 98.1 | 107.0 | 139.0 | 153.4 | 79.7 | 118.1 | 105.9 | 130.0 | 79.5 | 203.7 | 28.2 | 42.6 | 56.4 |
The City-Data.com crime index weighs serious crimes and violent crimes more heavily. Higher means more crime, U.S. average is 246.1. It adjusts for the number of visitors and daily workers commuting into cities.
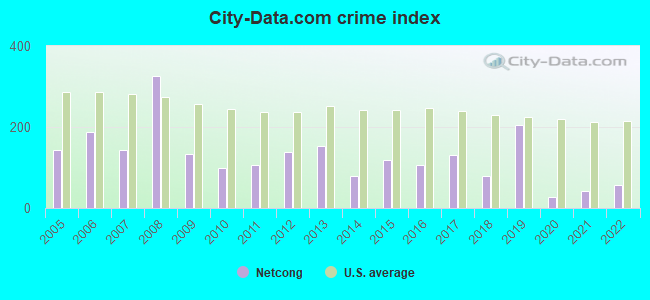
Crime rate in Netcong detailed stats: murders, rapes, robberies, assaults, burglaries, thefts, arson
Full-time law enforcement employees in 2021, including police officers: 14 (13 officers - 13 male; 0 female).
| Officers per 1,000 residents here: | 4.01 |
| New Jersey average: | 5.53 |
 Recent articles from our blog. Our writers, many of them Ph.D. graduates or candidates, create easy-to-read articles on a wide variety of topics.

 | Flanders, NJ (32 replies) |
| What other state gives off a western Morris County vibe? (12 replies) |
| Decided not to purchase home for the 5th time. Thinking about leaving NJ for good. (95 replies) |
| Repatriating to... New Jersey (& need to figure out where!) (13 replies) |
| Morris County: Mendham, Chester, Randolph (21 replies) |
| Help finding the right town (10 replies) |
Latest news from Netcong, NJ collected exclusively by city-data.com from local newspapers, TV, and radio stations
Ancestries: Italian (16.9%), German (11.6%), Irish (5.3%), Jamaican (4.4%), Polish (4.0%), American (2.6%).
Current Local Time: EST time zone
Incorporated in 1894
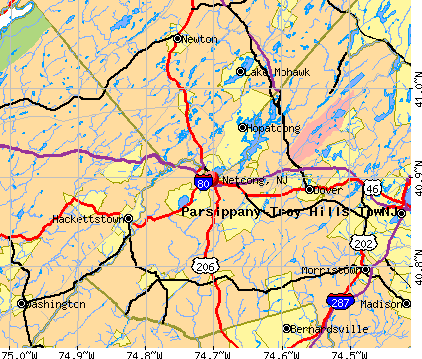
Elevation: 882 feet
Land area: 0.84 square miles.
Population density: 4,352 people per square mile (average).
585 residents are foreign born (12.8% Latin America, 2.5% Europe).
| This borough: | 16.7% |
| New Jersey: | 23.2% |
Median real estate property taxes paid for housing units with mortgages in 2022: $8,952 (2.6%)
Median real estate property taxes paid for housing units with no mortgage in 2022: $9,521 (3.0%)
Nearest city with pop. 50,000+: Wayne, NJ  (23.9 miles , pop. 54,069).
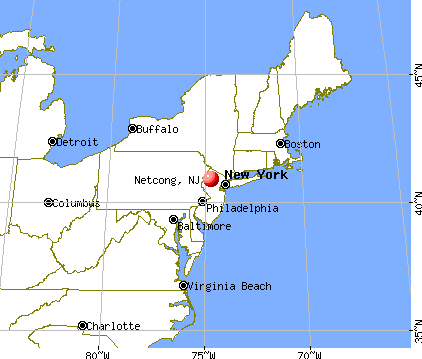
Nearest city with pop. 200,000+: Newark, NJ (29.4 miles , pop. 273,546).
Nearest city with pop. 1,000,000+: Manhattan, NY (39.3 miles , pop. 1,537,195).
Nearest cities:
), ), ), )Latitude: 40.90 N, Longitude: 74.70 W
Area code: 973
Netcong, New Jersey accommodation & food services, waste management - Economy and Business Data
| Here: | 3.6% |
| New Jersey: | 4.5% |
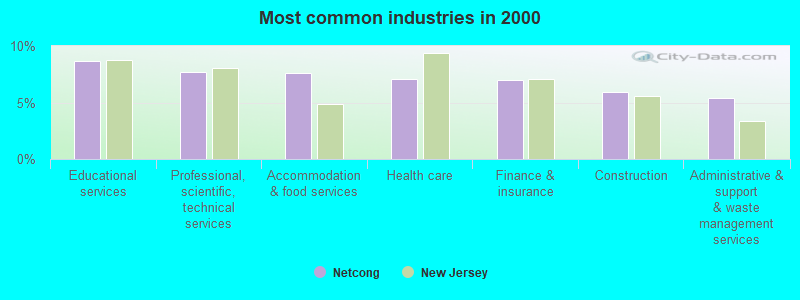
- Educational services (8.7%)
- Professional, scientific, technical services (7.7%)
- Accommodation & food services (7.6%)
- Health care (7.1%)
- Finance & insurance (7.0%)
- Construction (5.9%)
- Administrative & support & waste management services (5.4%)
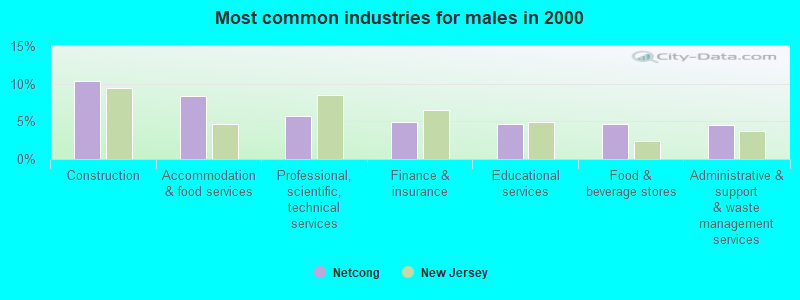
- Construction (10.4%)
- Accommodation & food services (8.4%)
- Professional, scientific, technical services (5.7%)
- Finance & insurance (4.9%)
- Educational services (4.7%)
- Food & beverage stores (4.7%)
- Administrative & support & waste management services (4.5%)
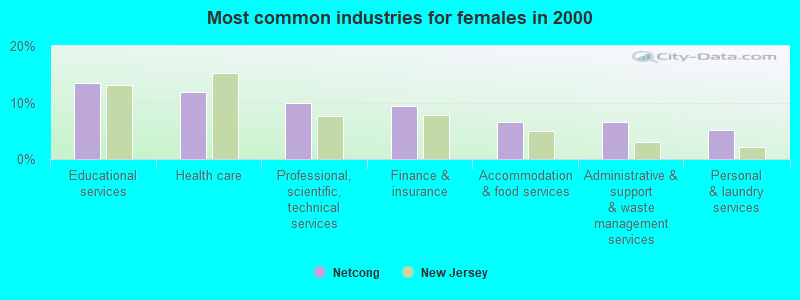
- Educational services (13.4%)
- Health care (11.8%)
- Professional, scientific, technical services (9.9%)
- Finance & insurance (9.5%)
- Accommodation & food services (6.6%)
- Administrative & support & waste management services (6.5%)
- Personal & laundry services (5.2%)
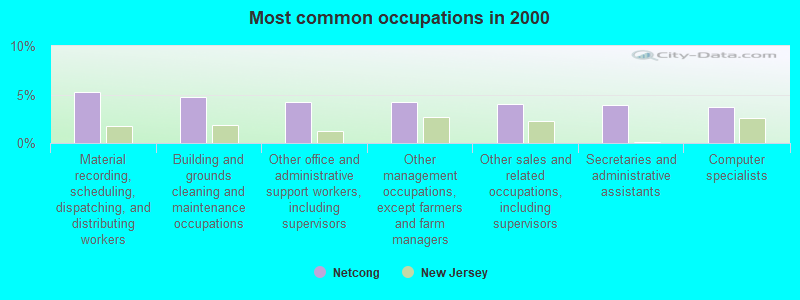
- Material recording, scheduling, dispatching, and distributing workers (5.3%)
- Building and grounds cleaning and maintenance occupations (4.8%)
- Other office and administrative support workers, including supervisors (4.2%)
- Other management occupations, except farmers and farm managers (4.2%)
- Other sales and related occupations, including supervisors (4.0%)
- Secretaries and administrative assistants (3.9%)
- Computer specialists (3.7%)
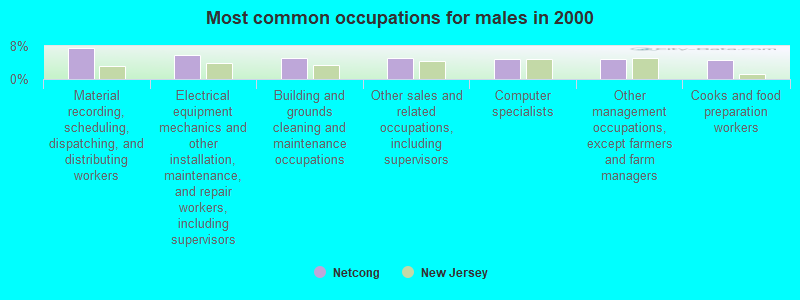
- Material recording, scheduling, dispatching, and distributing workers (7.5%)
- Electrical equipment mechanics and other installation, maintenance, and repair workers, including supervisors (5.7%)
- Building and grounds cleaning and maintenance occupations (5.2%)
- Other sales and related occupations, including supervisors (5.1%)
- Computer specialists (4.9%)
- Other management occupations, except farmers and farm managers (4.8%)
- Cooks and food preparation workers (4.5%)
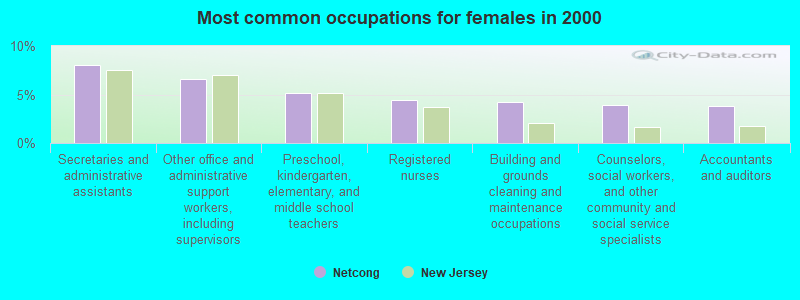
- Secretaries and administrative assistants (8.0%)
- Other office and administrative support workers, including supervisors (6.6%)
- Preschool, kindergarten, elementary, and middle school teachers (5.2%)
- Registered nurses (4.4%)
- Building and grounds cleaning and maintenance occupations (4.3%)
- Counselors, social workers, and other community and social service specialists (3.9%)
- Accountants and auditors (3.8%)
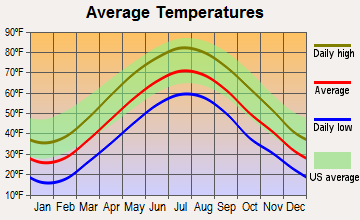
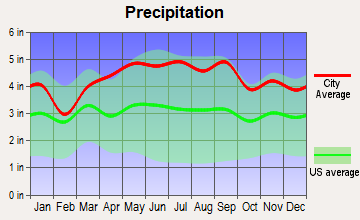
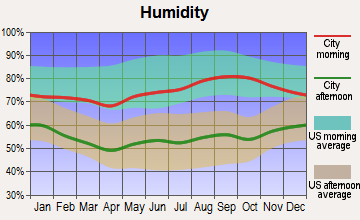
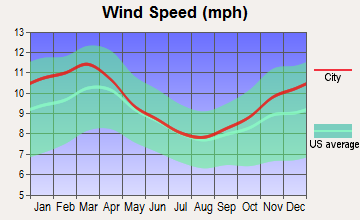
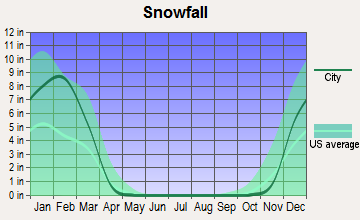
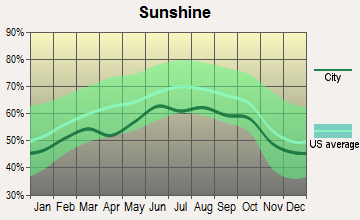
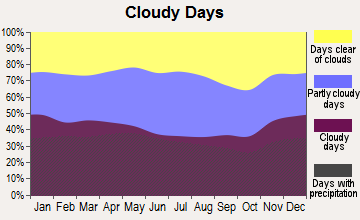
Average climate in Netcong, New Jersey
Based on data reported by over 4,000 weather stations
|
|


(lower is better)
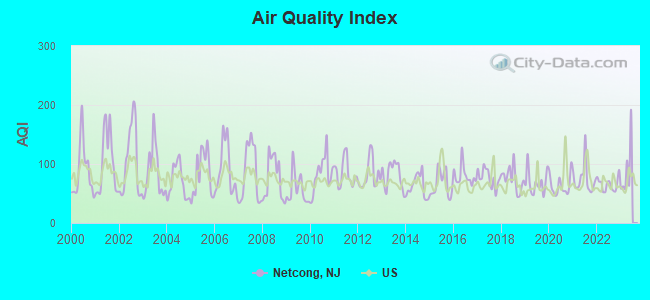
Air Quality Index (AQI) level in 2022 was 65.6. This is about average.
| City: | 65.6 |
| U.S.: | 72.6 |
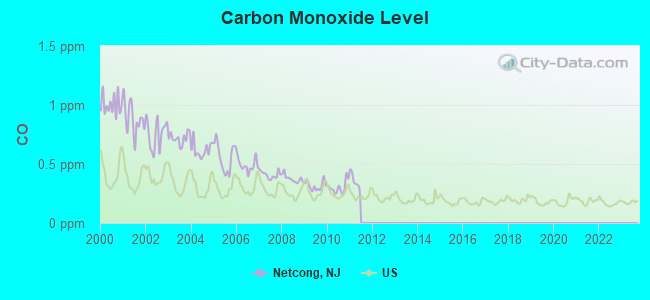
Carbon Monoxide (CO) [ppm] level in 2010 was 0.301. This is about average. Closest monitor was 13.5 miles away from the city center.
| City: | 0.301 |
| U.S.: | 0.251 |
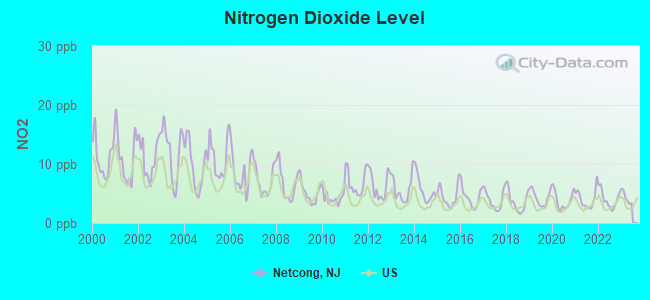
Nitrogen Dioxide (NO2) [ppb] level in 2022 was 4.05. This is better than average. Closest monitor was 7.7 miles away from the city center.
| City: | 4.05 |
| U.S.: | 5.11 |
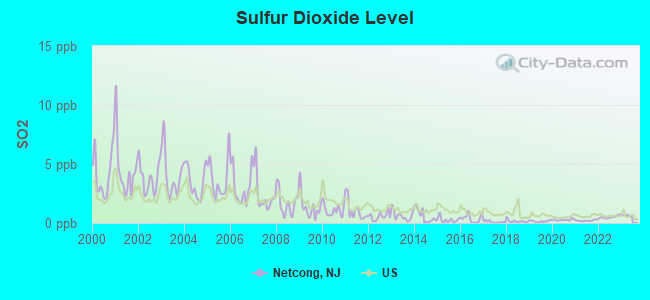
Sulfur Dioxide (SO2) [ppb] level in 2022 was 0.505. This is significantly better than average. Closest monitor was 7.7 miles away from the city center.
| City: | 0.505 |
| U.S.: | 1.515 |
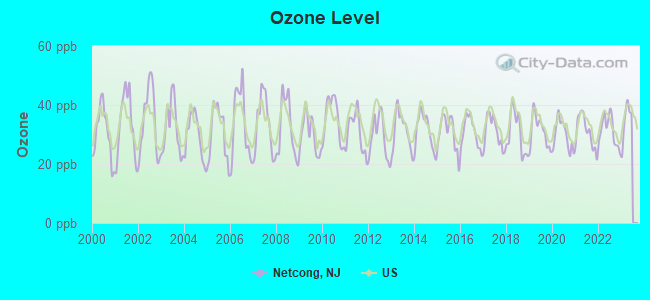
Ozone [ppb] level in 2022 was 31.3. This is about average. Closest monitor was 7.7 miles away from the city center.
| City: | 31.3 |
| U.S.: | 33.3 |
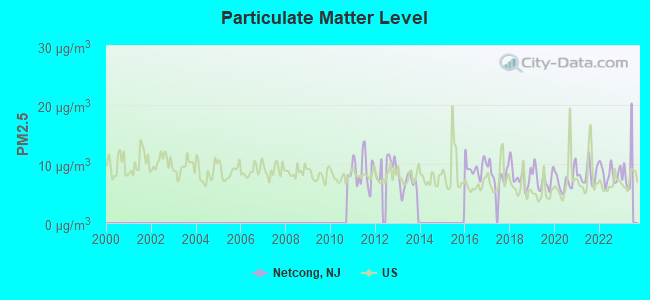
Particulate Matter (PM2.5) [µg/m3] level in 2022 was 8.38. This is about average. Closest monitor was 7.7 miles away from the city center.
| City: | 8.38 |
| U.S.: | 8.11 |
Tornado activity:
Netcong-area historical tornado activity is near New Jersey state average. It is 25% smaller than the overall U.S. average.
On 5/28/1973, a category F3 (max. wind speeds 158-206 mph) tornado 3.4 miles away from the Netcong borough center injured 12 people and caused between $50,000 and $500,000 in damages.
On 5/28/1973, a category F3 tornado 12.6 miles away from the borough center caused between $50,000 and $500,000 in damages.
Earthquake activity:
Netcong-area historical earthquake activity is significantly above New Jersey state average. It is 67% smaller than the overall U.S. average.On 8/23/2011 at 17:51:04, a magnitude 5.8 (5.8 MW, Depth: 3.7 mi, Class: Moderate, Intensity: VI - VII) earthquake occurred 269.3 miles away from the city center
On 10/7/1983 at 10:18:46, a magnitude 5.3 (5.1 MB, 5.3 LG, 5.1 ML) earthquake occurred 212.1 miles away from Netcong center
On 1/16/1994 at 01:49:16, a magnitude 4.6 (4.6 MB, 4.6 LG, Depth: 3.1 mi, Class: Light, Intensity: IV - V) earthquake occurred 80.2 miles away from the city center
On 4/20/2002 at 10:50:47, a magnitude 5.3 (5.3 ML, Depth: 3.0 mi) earthquake occurred 255.2 miles away from Netcong center
On 4/20/2002 at 10:50:47, a magnitude 5.2 (5.2 MB, 4.2 MS, 5.2 MW, 5.0 MW) earthquake occurred 253.3 miles away from the city center
On 1/16/1994 at 00:42:43, a magnitude 4.2 (4.2 MB, 4.0 LG, Depth: 3.1 mi) earthquake occurred 79.0 miles away from the city center
Magnitude types: regional Lg-wave magnitude (LG), body-wave magnitude (MB), local magnitude (ML), surface-wave magnitude (MS), moment magnitude (MW)
Natural disasters:
The number of natural disasters in Morris County (29) is a lot greater than the US average (15).Major Disasters (Presidential) Declared: 19
Emergencies Declared: 9
Causes of natural disasters: Floods: 8, Hurricanes: 7, Storms: 7, Snowstorms: 4, Heavy Rains: 3, Winter Storms: 3, Blizzards: 2, Water Shortages: 2, Mudslide: 1, Tornado: 1, Tropical Storm: 1, Wind: 1, Other: 3 (Note: some incidents may be assigned to more than one category).
Hospitals and medical centers near Netcong:
- HOUSE OF THE GOOD SHEPHERD (Nursing Home, about 6 miles away; HACKETTSTOWN, NJ)
- DAVITA HACKETTSTOWN DC (Dialysis Facility, about 7 miles away; HACKETTSTOWN, NJ)
- HACKETTSTOWN REGIONAL MEDICAL CENTER Acute Care Hospitals (about 7 miles away; HACKETTSTOWN, NJ)
- KINDRED HOSPITAL NEW JERSEY MORRIS COUNTY (Hospital, about 7 miles away; DOVER, NJ)
- SAINT CLARE'S HOSPITAL (Hospital, about 7 miles away; DOVER, NJ)
- DWELLING PLACE AT ST CLARE'S (Nursing Home, about 7 miles away; DOVER, NJ)
- DOVER CHRISTIAN NH (Nursing Home, about 8 miles away; DOVER, NJ)
Colleges/universities with over 2000 students nearest to Netcong:
- County College of Morris (about 8 miles; Randolph, NJ; Full-time enrollment: 6,427)
- Centenary College (about 8 miles; Hackettstown, NJ; FT enrollment: 2,271)
- Sussex County Community College (about 13 miles; Newton, NJ; FT enrollment: 2,402)
- Fairleigh Dickinson University-College at Florham (about 17 miles; Madison, NJ; FT enrollment: 2,690)
- Drew University (about 18 miles; Madison, NJ; FT enrollment: 2,272)
- Raritan Valley Community College (about 20 miles; Branchburg, NJ; FT enrollment: 5,735)
- East Stroudsburg University of Pennsylvania (about 26 miles; East Stroudsburg, PA; FT enrollment: 6,195)
Public elementary/middle school in Netcong:
- NETCONG ELEMENTARY SCHOOL (Students: 295, Location: 26 COLLEGE ROAD, Grades: PK-8)
Private elementary/middle school in Netcong:
Points of interest:
Notable locations in Netcong: Netcong Circle (A), Atlantic Air Ambulance (B), Netcong Fire Department Company 1 (C), Netcong Fire Department Hilltop Fire Company 2 (D). Display/hide their locations on the map
Hotel: Kingtown Motel (USHighway 46 North).
Court: Netcong Borough - Municipal Court (23 Maple Avenue).
Drinking water stations with addresses in Netcong and their reported violations in the past:
NETCONG WATER DEPT (Population served: 3,342, Groundwater):Past health violations:WILD WEST CITY (Population served: 450, Groundwater):Past monitoring violations:
- MCL, Monthly (TCR) - In APR-2013, Contaminant: Coliform. Follow-up actions: St Public Notif requested (APR-15-2013), St Formal NOV issued (APR-15-2013), St Compliance achieved (MAY-29-2013)
- Monitoring, Source Water (GWR) - Between APR-18-2013 and APR-30-2013, Contaminant: E. COLI. Follow-up actions: St Public Notif requested (MAY-13-2013), St Formal NOV issued (MAY-13-2013), St Compliance achieved (MAY-29-2013)
- 9 regular monitoring violations
Past health violations:Past monitoring violations:
- MCL, Monthly (TCR) - In JUN-2013, Contaminant: Coliform. Follow-up actions: St Public Notif requested (JUN-26-2013), St Formal NOV issued (JUN-26-2013), St Public Notif received (JUL-08-2013), St Compliance achieved (JUL-12-2013)
- MCL, Acute (TCR) - In OCT-2010, Contaminant: Coliform. Follow-up actions: St Public Notif received (OCT-26-2010), St Public Notif requested (JAN-14-2011), St Formal NOV issued (2 times from JAN-14-2011 to JAN-26-2011), St Compliance achieved (MAY-22-2011)
- Failure To Address Contamination - In JAN-13-2012, Contaminant: GROUNDWATER RULE. Follow-up actions: St Public Notif requested (APR-19-2012), St Formal NOV issued (APR-19-2012), St Public Notif received (AUG-09-2012)
- 2 routine major monitoring violations
- One regular monitoring violation
| This borough: | 2.3 people |
| New Jersey: | 2.7 people |
| This borough: | 58.7% |
| Whole state: | 69.3% |
| This borough: | 8.2% |
| Whole state: | 5.9% |
Likely homosexual households (counted as self-reported same-sex unmarried-partner households)
- Lesbian couples: 0.4% of all households
- Gay men: 0.2% of all households
Banks with branches in Netcong (2011 data):
- Fulton Bank of New Jersey: Netcong Branch at 9 Ledgewood Avenue, branch established on 1908/01/01. Info updated 2012/02/08: Bank assets: $3,408.9 mil, Deposits: $2,816.1 mil, headquarters in Mount Laurel, NJ, negative income in the last year, Commercial Lending Specialization, 74 total offices, Holding Company: Fulton Financial Corporation
For population 15 years and over in Netcong:
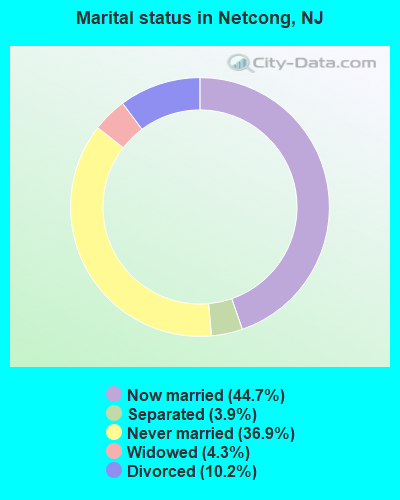
- Never married: 36.9%
- Now married: 44.7%
- Separated: 3.9%
- Widowed: 4.3%
- Divorced: 10.2%
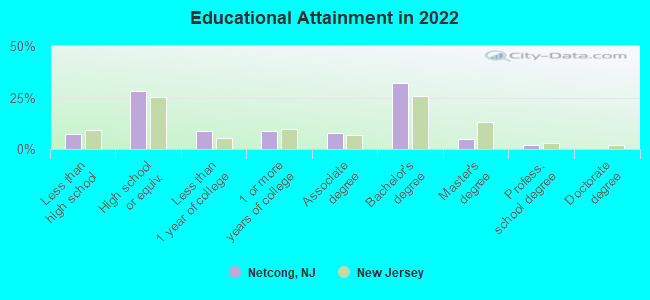
For population 25 years and over in Netcong:
- High school or higher: 91.2%
- Bachelor's degree or higher: 37.2%
- Graduate or professional degree: 6.6%
- Unemployed: 2.9%
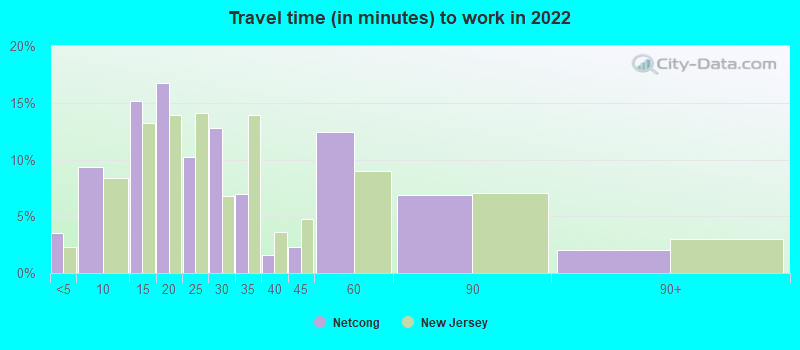
- Mean travel time to work (commute): 20.7 minutes
| Here: | 10.0 |
| New Jersey average: | 12.8 |
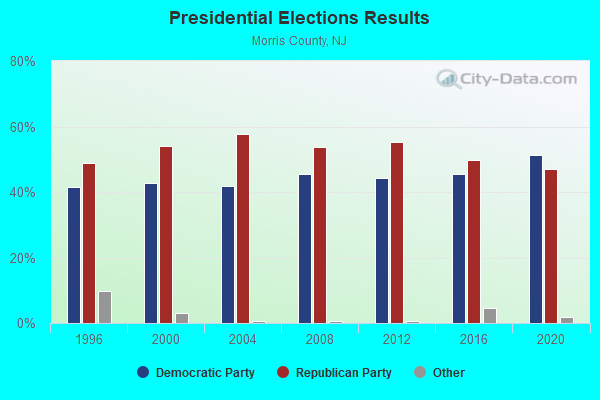
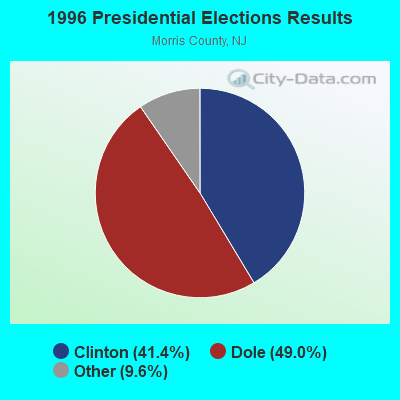
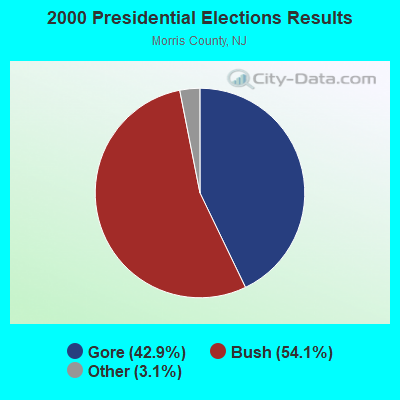
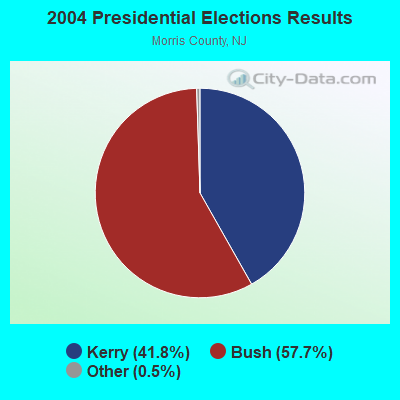
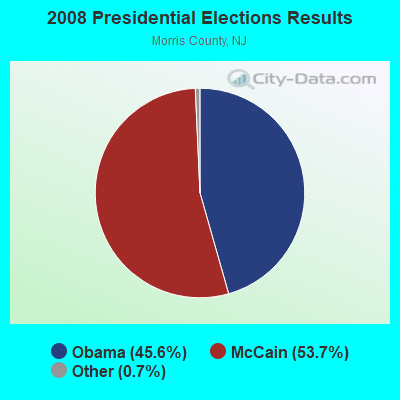
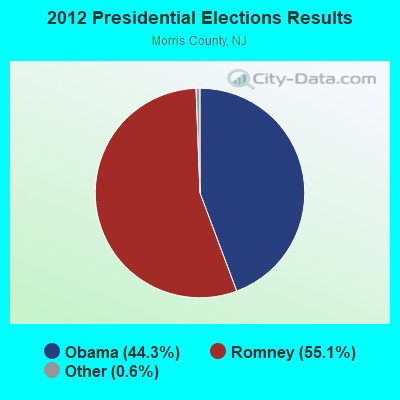
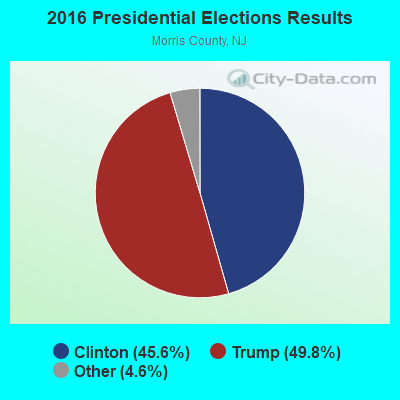
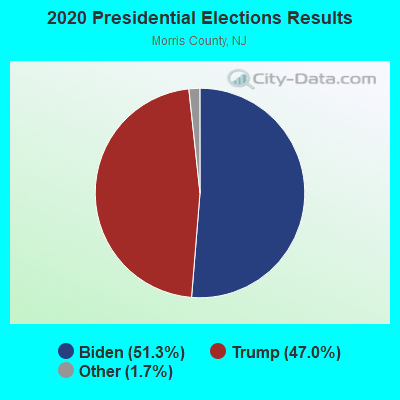
Graphs represent county-level data. Detailed 2008 Election Results
Religion statistics for Netcong, NJ (based on Morris County data)
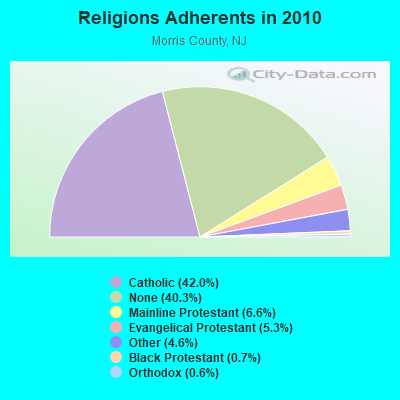
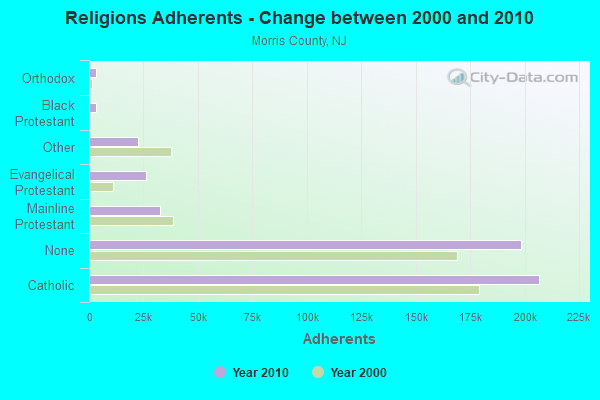
| Religion | Adherents | Congregations |
|---|---|---|
| Catholic | 206,700 | 49 |
| Mainline Protestant | 32,353 | 111 |
| Evangelical Protestant | 25,971 | 94 |
| Other | 22,414 | 43 |
| Black Protestant | 3,281 | 7 |
| Orthodox | 3,145 | 6 |
| None | 198,412 | - |
Food Environment Statistics:
| Morris County: | 2.12 / 10,000 pop. |
| New Jersey: | 2.90 / 10,000 pop. |
| Here: | 0.10 / 10,000 pop. |
| New Jersey: | 0.06 / 10,000 pop. |
| This county: | 1.13 / 10,000 pop. |
| New Jersey: | 1.76 / 10,000 pop. |
| Here: | 0.88 / 10,000 pop. |
| New Jersey: | 0.81 / 10,000 pop. |
| Morris County: | 8.80 / 10,000 pop. |
| State: | 7.15 / 10,000 pop. |
| This county: | 7.3% |
| New Jersey: | 8.3% |
| Here: | 20.4% |
| State: | 23.3% |
| This county: | 20.1% |
| State: | 18.0% |
Health and Nutrition:
| Netcong: | 49.6% |
| New Jersey: | 50.6% |
| Here: | 46.6% |
| State: | 48.5% |
| This city: | 28.4 |
| State: | 28.5 |
| Netcong: | 21.0% |
| New Jersey: | 20.0% |
| Netcong: | 9.0% |
| State: | 11.1% |
| This city: | 6.9 |
| New Jersey: | 6.8 |
| Here: | 33.3% |
| New Jersey: | 33.6% |
| Netcong: | 56.3% |
| New Jersey: | 56.9% |
| Here: | 78.4% |
| State: | 80.0% |
More about Health and Nutrition of Netcong, NJ Residents
| Local government employment and payroll (March 2022) | |||||
| Function | Full-time employees | Monthly full-time payroll | Average yearly full-time wage | Part-time employees | Monthly part-time payroll |
|---|---|---|---|---|---|
| Police Protection - Officers | 13 | $107,668 | $99,386 | 0 | $0 |
| Streets and Highways | 5 | $11,205 | $26,892 | 0 | $0 |
| Sewerage | 5 | $16,964 | $40,714 | 0 | $0 |
| Water Supply | 5 | $20,753 | $49,807 | 0 | $0 |
| Financial Administration | 4 | $13,875 | $41,625 | 0 | $0 |
| Other Government Administration | 1 | $7,652 | $91,824 | 3 | $2,210 |
| Welfare | 0 | $0 | 1 | $1,728 | |
| Other and Unallocable | 0 | $0 | 2 | $2,588 | |
| Police - Other | 0 | $0 | 9 | $9,148 | |
| Totals for Government | 33 | $178,115 | $64,769 | 15 | $15,673 |
Netcong government finances - Expenditure in 2017 (per resident):
- Construction - Regular Highways: $202,000 ($55.18)
General - Other: $137,000 ($37.42)
General Public Buildings: $62,000 ($16.94)
Water Utilities: $35,000 ($9.56)
- Current Operations - Police Protection: $1,085,000 ($296.37)
General - Other: $779,000 ($212.78)
Water Utilities: $376,000 ($102.70)
Sewerage: $290,000 ($79.21)
Central Staff Services: $277,000 ($75.66)
Regular Highways: $232,000 ($63.37)
Judicial and Legal Services: $187,000 ($51.08)
Solid Waste Management: $178,000 ($48.62)
Financial Administration: $163,000 ($44.52)
Health - Other: $77,000 ($21.03)
Local Fire Protection: $54,000 ($14.75)
Parks and Recreation: $35,000 ($9.56)
General Public Buildings: $35,000 ($9.56)
Protective Inspection and Regulation - Other: $13,000 ($3.55)
Libraries: $12,000 ($3.28)
- General - Interest on Debt: $9,000 ($2.46)
- Intergovernmental to Local - Other - Sewerage: $610,000 ($166.62)
- Total Salaries and Wages: $1,609,000 ($439.50)
- Water Utilities - Interest on Debt: $1,000 ($0.27)
Netcong government finances - Revenue in 2017 (per resident):
- Charges - Sewerage: $836,000 ($228.35)
Other: $1,000 ($0.27)
- Local Intergovernmental - Health and Hospitals: $9,000 ($2.46)
Other: $3,000 ($0.82)
- Miscellaneous - Fines and Forfeits: $60,000 ($16.39)
General Revenue - Other: $37,000 ($10.11)
Interest Earnings: $11,000 ($3.00)
- Revenue - Water Utilities: $519,000 ($141.76)
- State Intergovernmental - General Local Government Support: $389,000 ($106.26)
Other: $17,000 ($4.64)
- Tax - Property: $3,234,000 ($883.37)
Other License: $18,000 ($4.92)
Public Utilities Sales: $15,000 ($4.10)
Alcoholic Beverage License: $6,000 ($1.64)
Netcong government finances - Debt in 2017 (per resident):
- Long Term Debt - Beginning Outstanding - Unspecified Public Purpose: $318,000 ($86.86)
Outstanding Unspecified Public Purpose: $294,000 ($80.31)
Retired Unspecified Public Purpose: $24,000 ($6.56)
Netcong government finances - Cash and Securities in 2017 (per resident):
- Bond Funds - Cash and Securities: $905,000 ($247.20)
- Other Funds - Cash and Securities: $2,622,000 ($716.20)
7.05% of this county's 2020 resident taxpayers moved to other counties in 2021 ($142,356 average adjusted gross income)
| Here: | 7.05% |
| New Jersey average: | 7.02% |
0.01% of residents moved to foreign countries ($178 average AGI)
Morris County: 0.01% New Jersey average: 0.02%
Top counties to which taxpayers relocated from this county between 2020 and 2021:
| to Sussex County, NJ | |
| to Essex County, NJ | |
| to Somerset County, NJ |
| Businesses in Netcong, NJ | ||||
| Name | Count | Name | Count | |
|---|---|---|---|---|
| Dunkin Donuts | 1 | U-Haul | 1 | |
| FedEx | 1 | UPS | 1 | |
| Ford | 1 | |||
Strongest AM radio stations in Netcong:
- WMCA (570 AM; 50 kW; NEW YORK, NY; Owner: SALEM MEDIA OF NEW YORK, LLC)
- WSNR (620 AM; 20 kW; JERSEY CITY, NJ)
- WOR (710 AM; 50 kW; NEW YORK, NY; Owner: BUCKLEY BROADCASTING CORPORATION)
- WABC (770 AM; 50 kW; NEW YORK, NY; Owner: WABC-AM RADIO, INC.)
- WINS (1010 AM; 50 kW; NEW YORK, NY; Owner: INFINITY BROADCASTING OPERATIONS, INC.)
- WEPN (1050 AM; 50 kW; NEW YORK, NY; Owner: NEW YORK AM RADIO, LLC)
- WWJZ (640 AM; 50 kW; MOUNT HOLLY, NJ; Owner: ABC, INC.)
- WADO (1280 AM; 50 kW; NEW YORK, NY; Owner: WADO-AM LICENSE CORP.)
- WBBR (1130 AM; 50 kW; NEW YORK, NY; Owner: BLOOMBERG COMMUNICATIONS INC.)
- WFAN (660 AM; 50 kW; NEW YORK, NY; Owner: INFINITY BROADCASTING OPERATIONS, INC.)
- WMTR (1250 AM; 7 kW; MORRISTOWN, NJ; Owner: THE SENTINEL PUBLISHING CO.)
- WVNJ (1160 AM; 20 kW; OAKLAND, NJ; Owner: UNIVERSAL B/CASTING OF NEW YORK,INC.)
- WLIB (1190 AM; 30 kW; NEW YORK, NY; Owner: ICBC BROADCAST HOLDINGS-NY, INC.)
Strongest FM radio stations in Netcong:
- WDHA-FM (105.5 FM; DOVER, NJ; Owner: THE SENTINEL PUBLISHING CO.)
- W284AF (104.7 FM; HACKETTSTOWN, NJ; Owner: WRNJ RADIO, INC.)
- WNNJ-FM (103.7 FM; NEWTON, NJ; Owner: CLEAR CHANNEL BROADCASTING LICENSES, INC.)
- WHCY (106.3 FM; BLAIRSTOWN, NJ; Owner: CLEAR CHANNEL BROADCASTING LICENSES, INC.)
- WRKS (98.7 FM; NEW YORK, NY; Owner: EMMIS RADIO LICENSE CORP OF NEW YORK)
- W224AS (92.7 FM; WASHINGTON, NJ; Owner: WRNJ RADIO, INC.)
- W245AC (96.9 FM; HARMONY TOWNSHIP, NJ; Owner: MERCER COUNTY COMMUNITY COLLEGE)
- WSUS (102.3 FM; FRANKLIN, NJ; Owner: CLEAR CHANNEL BROADCASTING LICENSES, INC.)
- WAWZ (99.1 FM; ZAREPHATH, NJ; Owner: PILLAR OF FIRE)
- WNEW (102.7 FM; NEW YORK, NY; Owner: INFINITY BROADCASTING OPERATIONS, INC.)
- WWPJ (89.5 FM; PEN ARGYL, PA; Owner: MERCER COUNTY COMMUNITY COLLEGE)
- WNJP (88.5 FM; SUSSEX, NJ; Owner: NEW JERSEY PUBLIC BROADCASTING AUTH.)
- WSBG (93.5 FM; STROUDSBURG, PA; Owner: NASSAU BROADCASTING II, L.L.C.)
- WNYC-FM (93.9 FM; NEW YORK, NY; Owner: WNYC RADIO)
- WPAT-FM (93.1 FM; PATERSON, NJ; Owner: WPAT LICENSING, INC.)
- WQCD (101.9 FM; NEW YORK, NY; Owner: EMMIS RADIO LICENSE CORPORATION)
- WKTU (103.5 FM; LAKE SUCCESS, NY; Owner: AMFM RADIO LICENSES, LLC)
- WKCR-FM (89.9 FM; NEW YORK, NY; Owner: TRUSTEES OF COLUMBIA UNIVERSITY IN NEW YORK)
- WAXQ (104.3 FM; NEW YORK, NY; Owner: AMFM NEW YORK LICENSES, LLC)
- WHTZ (100.3 FM; NEWARK, NJ; Owner: AMFM RADIO LICENSES, L.L.C.)
TV broadcast stations around Netcong:
- WMBC-TV (Channel 63; NEWTON, NJ; Owner: MOUNTAIN BROADCASTING CORPORATION)
- WNYW (Channel 5; NEW YORK, NY; Owner: FOX TELEVISION STATIONS, INC.)
- WPXO-LP (Channel 34; EAST ORANGE, NJ; Owner: PAXSON COMMUNICATIONS LPTV, INC.)
- WCBS-TV (Channel 2; NEW YORK, NY; Owner: CBS BROADCASTING INC.)
- WABC-TV (Channel 7; NEW YORK, NY; Owner: AMERICAN BROADCASTING COMPANIES, INC)
- WPIX (Channel 11; NEW YORK, NY; Owner: WPIX, INC.)
- WWOR-TV (Channel 9; SECAUCUS, NJ; Owner: FOX TELEVISION STATIONS, INC.)
- W54CZ (Channel 54; MORRISTOWN, NJ; Owner: WLNY-TV, INC.)
- WPXN-TV (Channel 31; NEW YORK, NY; Owner: PAXSON COMMUNICATIONS LICENSE COMPANY, LLC)
- WNJU (Channel 47; LINDEN, NJ; Owner: WNJU LICENSE CORPORATION)
- WNBC (Channel 4; NEW YORK, NY; Owner: NATIONAL BROADCASTING COMPANY, INC.)
- WNET (Channel 13; NEWARK, NJ; Owner: EDUCATIONAL BROADCASTING CORPORATION)
- WXTV (Channel 41; PATERSON, NJ; Owner: WXTV LICENSE PARTNERSHIP, G.P.)
- WFUT (Channel 68; NEWARK, NJ; Owner: UNIVISION NEW YORK LLC)
- WNYE-TV (Channel 25; NEW YORK, NY; Owner: NEW YORK CITY BOARD OF EDUCATION)
- WXNY-LP (Channel 32; NEW YORK, NY; Owner: ISLAND BROADCASTING COMPANY)
- WFME-TV (Channel 66; WEST MILFORD, NJ; Owner: FAMILY STATIONS, INC.)
- WKOB-LP (Channel 53; NEW YORK, NY; Owner: WKOB COMMUNICATIONS, INC.)
- WEBR-CA (Channel 17; MANHATTAN, NY; Owner: K LICENSEE INC.)
- WRNN-LP (Channel 57; NYACK, NY; Owner: LP NYACK LIMITED PARTNERSHIP)
- W49BE (Channel 49; HACKETTSTOWN, NJ; Owner: NEW JERSEY PUBLIC B/CING. AUTHORITY)
- W60AI (Channel 60; NEW YORK, NY; Owner: VENTANA TELEVISION, INC.)
- WNJT (Channel 52; TRENTON, NJ; Owner: NEW JERSEY PUBLIC BROADCASTING AUTHORITY)
- WLBX-LP (Channel 22; CRANFORD, NJ; Owner: RENARD COMMUNICATIONS CORP.)
- WNJB (Channel 58; NEW BRUNSWICK, NJ; Owner: NEW JERSEY PUBLIC BROADCASTING AUTHORITY)
- National Bridge Inventory (NBI) Statistics
- 28Number of bridges
- 213ft / 65.4mTotal length
- $14,784,000Total costs
- 606,815Total average daily traffic
- 45,408Total average daily truck traffic
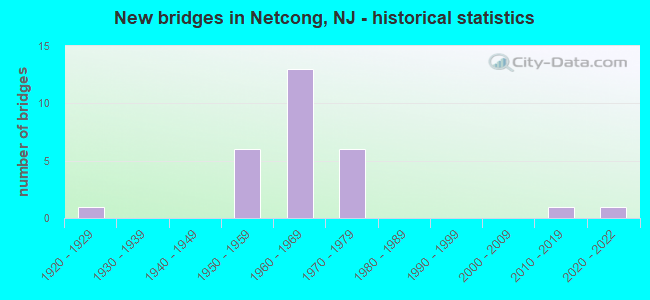
- New bridges - historical statistics
- 11920-1929
- 61950-1959
- 131960-1969
- 61970-1979
- 12010-2019
- 12020-2022
FCC Registered Antenna Towers:
22 (See the full list of FCC Registered Antenna Towers in Netcong)FCC Registered Broadcast Land Mobile Towers:
6- 2.5 Mi Se Of Stanhope (Lat: 40.876667 Lon: -74.676944), Type: Tower, Structure height: 67.1 m, Overall height: 73.2 m, Call Sign: WZX485, Licensee ID: L00004085,
Assigned Frequencies: 45.9400 MHz, Grant Date: 03/27/2004, Expiration Date: 06/16/2014, Cancellation Date: 04/08/2014, Registrant: County Of Morris, Cn900, Morristown, NJ 07963-0900, Phone: (973) 829-8050, Fax: (973) 829-8048, Email:
- 17 Maple Ave (Lat: 40.899000 Lon: -74.705444), Call Sign: KME575, Licensee ID: L00042791,
Assigned Frequencies: 31.2000 MHz, Grant Date: 07/08/1997, Expiration Date: 09/15/2002, Cancellation Date: 01/12/2003, Registrant: Netcong Pharmacy, 17 Maple Ave, Netcong, NJ 07857, Phone: (201) 347-0067
- End Mountain Rd 200 E (Lat: 40.895111 Lon: -74.857667), Call Sign: WSP475, Licensee ID: L00044882,
Assigned Frequencies: 159.540 MHz, Grant Date: 12/28/1999, Expiration Date: 02/23/2005, Cancellation Date: 10/29/2003, Registrant: Abf Freight System Inc, Fort Smith, AR 72917-0048, Phone: (717) 243-1909
- NETCONG, 19 Maple Ave (Lat: 40.907056 Lon: -74.708778), Type: Building, Structure height: 6.1 m, Call Sign: WQIS396,
Assigned Frequencies: 475.600 MHz, 479.400 MHz, 479.425 MHz, 479.525 MHz, 479.550 MHz, 479.625 MHz, 479.750 MHz, 480.000 MHz, 480.050 MHz, 480.075 MHz... (+15 more), Grant Date: 02/15/2018, Expiration Date: 04/30/2028, Certifier: Thomas Zellman, Registrant: County Of Morris, Morristown, NJ 07963-0900, Phone: (973) 829-8600, Fax: (973) 829-8604, Email:
- Nj State Police Rt 206 & Rt 80 (Lat: 40.887222 Lon: -74.698333), Type: Ltower, Structure height: 76 m, Overall height: 80 m, Call Sign: WQUL922,
Assigned Frequencies: 458.487 MHz, Grant Date: 08/13/2014, Expiration Date: 08/13/2024, Certifier: Keith Armstrong, Registrant: Sussex County Sheriff, 135 Morris Turnpike, Newton, NJ 07860, Phone: (973) 940-5500, Email:
- Lat: 40.899306 Lon: -74.699333, Call Sign: WQYE861,
Assigned Frequencies: 451.050 MHz, 456.050 MHz, Grant Date: 09/06/2016, Expiration Date: 09/06/2026, Certifier: Nicole Sylvester, Registrant: Pros Rf, 5219 Adairville Road, Franklin, KY 42134, Phone: (270) 908-4402, Fax: (847) 229-0259, Email:
FCC Registered Microwave Towers:
5- NETCONG SBA, 2.5 Mi Se Of Stanhope (Lat: 40.876667 Lon: -74.676944), Type: Tower, Structure height: 67.1 m, Overall height: 73.2 m, Call Sign: WPWD245,
Assigned Frequencies: 6615.00 MHz, 6034.15 MHz, 6034.15 MHz, 6034.15 MHz, 6685.00 MHz, 6034.15 MHz, Grant Date: 08/12/2022, Expiration Date: 10/17/2032, Certifier: Raymond Strilec Sgt, Registrant: County Of Morris, Morristown, NJ 07963-0900, Phone: (973) 285-2945, Email:
- SITE 68A, Route 206 (88095) (Lat: 40.865333 Lon: -74.679222), Type: Ltower, Structure height: 73.4 m, Overall height: 84.1 m, Call Sign: WQPA693,
Assigned Frequencies: 6345.49 MHz, Grant Date: 01/29/2022, Expiration Date: 03/21/2032, Certifier: Nelson Santos, Registrant: Communications Law Counsel, Pllc, 1717 K Steet, Nw, Suite 900, Washington, DC 20006, Phone: (202) 552-5121, Email:
- SITE 68A, Route 206 (88095) (Lat: 40.865333 Lon: -74.679222), Type: Tower, Structure height: 73.4 m, Overall height: 84.1 m, Call Sign: WQPG724,
Assigned Frequencies: 6256.54 MHz, Grant Date: 05/05/2022, Expiration Date: 05/14/2032, Certifier: Nelson Santos, Registrant: Communications Law Counsel, Pllc, 1717 K Steet, Nw, Suite 900, Washington, DC 20006, Phone: (202) 552-5121, Email:
- AM TWR Netcong, Route 206 (88095) (Lat: 40.865333 Lon: -74.679222), Type: Gtower, Structure height: 73.4 m, Overall height: 84.1 m, Call Sign: WQQF601,
Assigned Frequencies: 6595.00 MHz, 6655.00 MHz, 11245.0 MHz, 11645.0 MHz, 6595.00 MHz, 6655.00 MHz, 11245.0 MHz, 11645.0 MHz, 6595.00 MHz, 6655.00 MHz... (+6 more), Grant Date: 11/28/2012, Expiration Date: 11/28/2022, Cancellation Date: 01/28/2023, Certifier: Steve Hunt, Registrant: New Line Networks LLC, 600 W Chicago Ave, Ste 840, Chicago, IL 60654, Phone: (312) 244-3406, Fax: (773) 913-0473, Email:
- Roxbury, 2.5 Mi Se Of Stanhope (Lat: 40.876667 Lon: -74.676944), Type: Gtower, Structure height: 67.1 m, Overall height: 73.2 m, Call Sign: WRNC797,
Assigned Frequencies: 6063.80 MHz, 6063.80 MHz, 6063.80 MHz, 6063.80 MHz, 6063.80 MHz, 6063.80 MHz, 6063.80 MHz, 6063.80 MHz, 6063.80 MHz, 6063.80 MHz, Grant Date: 07/15/2021, Expiration Date: 07/15/2031, Certifier: Edward Zapf, Registrant: New Jersey State Police, West Trenton, NJ 08628, Phone: (609) 358-1433, Fax: (609) 883-8061, Email:
FCC Registered Amateur Radio Licenses:
12 (See the full list of FCC Registered Amateur Radio Licenses in Netcong)FAA Registered Aircraft Manufacturers and Dealers:
2- GREAT NORTHERN HELICOPTER LLC, 69 Love Ln, Netcong, NJ 07857
Certificate: 04-0826 (LLC), Certificate Issue Date: 04/24/2004, Expiration Date: 04/23/2005 - GREAT NORTHERN HELICOPTER LLC, 69 Love Ln, Netcong, NJ 07857
Certificate: 04-0826 (Corporation), Certificate Issue Date: 04/24/2004, Expiration Date: 04/23/2005
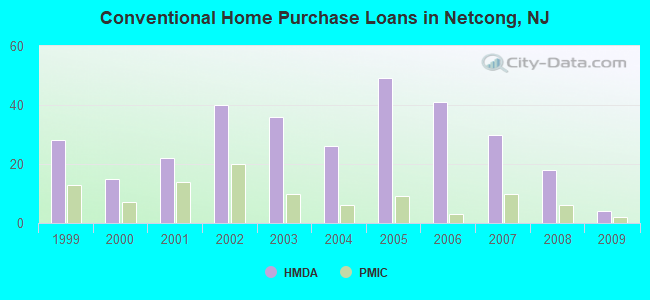
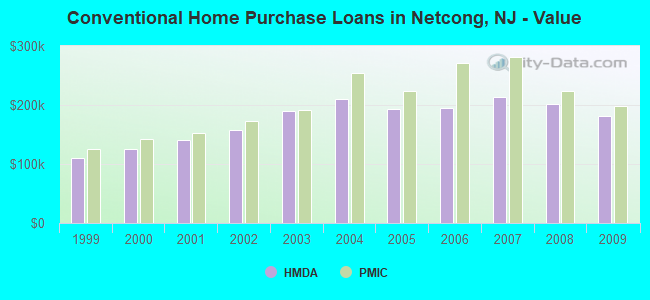
| Home Mortgage Disclosure Act Aggregated Statistics For Year 2009 (Based on 1 full tract) | ||||||||||
| A) FHA, FSA/RHS & VA Home Purchase Loans | B) Conventional Home Purchase Loans | C) Refinancings | D) Home Improvement Loans | F) Non-occupant Loans on < 5 Family Dwellings (A B C & D) | ||||||
|---|---|---|---|---|---|---|---|---|---|---|
| Number | Average Value | Number | Average Value | Number | Average Value | Number | Average Value | Number | Average Value | |
| LOANS ORIGINATED | 1 | $261,000 | 4 | $181,500 | 53 | $202,000 | 5 | $65,400 | 2 | $79,500 |
| APPLICATIONS APPROVED, NOT ACCEPTED | 2 | $214,000 | 0 | $0 | 5 | $233,400 | 0 | $0 | 0 | $0 |
| APPLICATIONS DENIED | 0 | $0 | 2 | $199,000 | 26 | $231,308 | 4 | $78,500 | 0 | $0 |
| APPLICATIONS WITHDRAWN | 2 | $162,500 | 1 | $90,000 | 12 | $206,167 | 1 | $84,000 | 1 | $84,000 |
| FILES CLOSED FOR INCOMPLETENESS | 0 | $0 | 0 | $0 | 4 | $261,500 | 1 | $233,000 | 0 | $0 |
Detailed HMDA statistics for the following Tracts: 0460.00
| Private Mortgage Insurance Companies Aggregated Statistics For Year 2009 (Based on 1 full tract) | ||
| A) Conventional Home Purchase Loans | ||
|---|---|---|
| Number | Average Value | |
| LOANS ORIGINATED | 2 | $198,500 |
| APPLICATIONS APPROVED, NOT ACCEPTED | 0 | $0 |
| APPLICATIONS DENIED | 0 | $0 |
| APPLICATIONS WITHDRAWN | 0 | $0 |
| FILES CLOSED FOR INCOMPLETENESS | 0 | $0 |
Detailed PMIC statistics for the following Tracts: 0460.00
2002 - 2018 National Fire Incident Reporting System (NFIRS) incidents
- Fire incident types reported to NFIRS in Netcong, NJ
- 12068.6%Structure Fires
- 3419.4%Outside Fires
- 148.0%Mobile Property/Vehicle Fires
- 74.0%Other
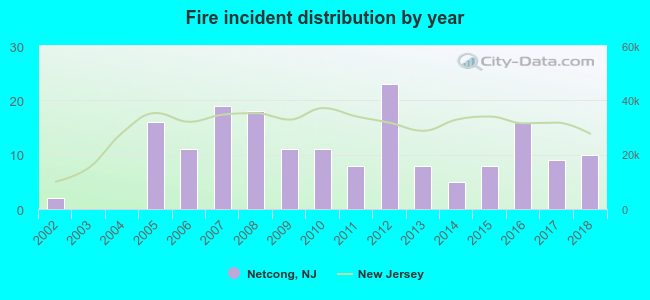 Based on the data from the years 2002 - 2018 the average number of fire incidents per year is 10. The highest number of fires - 23 took place in 2012, and the least - 0 in 2003. The data has a growing trend.
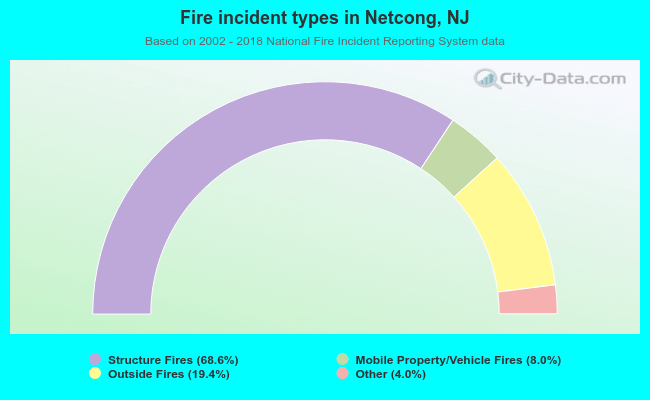 When looking into fire subcategories, the most reports belonged to: Structure Fires (68.6%), and Outside Fires (19.4%).
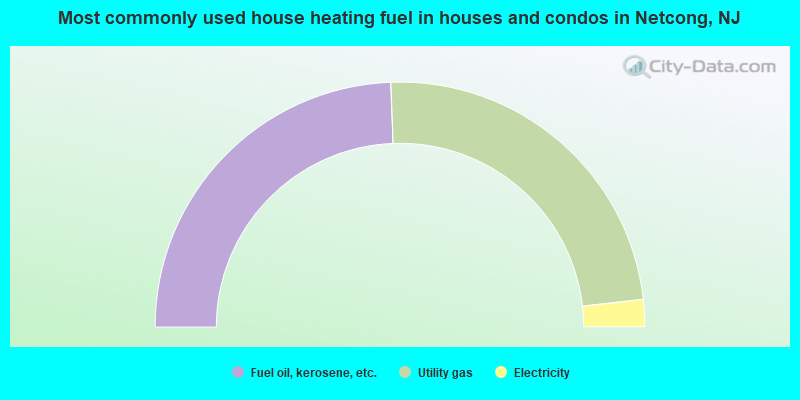
- 48.8%Fuel oil, kerosene, etc.
- 47.6%Utility gas
- 3.6%Electricity
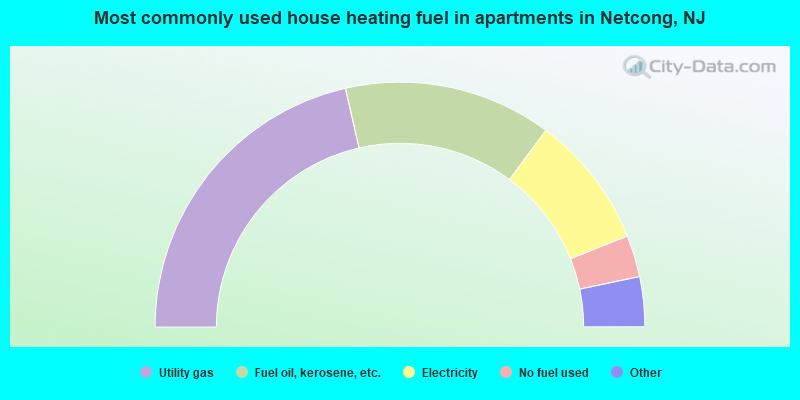
- 42.9%Utility gas
- 27.5%Fuel oil, kerosene, etc.
- 17.6%Electricity
- 5.5%No fuel used
- 3.5%Bottled, tank, or LP gas
- 3.0%Other fuel
Netcong compared to New Jersey state average:
- Unemployed percentage significantly below state average.
- Length of stay since moving in significantly above state average.
Netcong on our top lists:
- #27 on the list of "Top 101 cities with the most residents born in Colombia (population 500+)"
- #34 on the list of "Top 101 cities with the most residents born in Chile (population 500+)"
- #41 on the list of "Top 101 cities with the most residents born in Other Southern Europe (population 500+)"
- #87 on the list of "Top 101 cities with the most residents born in South America (population 500+)"
- #4 on the list of "Top 101 counties with the largest decrease in the number of births per 1000 residents 2000-2006 to 2007-2013 (pop 50,000+)"
- #8 on the list of "Top 101 counties with the lowest number of infant deaths per 1000 residents 2007-2013 (pop. 50,000+)"
- #10 on the list of "Top 101 counties with the highest percentage of residents that visited a dentist within the past year"
- #11 on the list of "Top 101 counties with the largest decrease in the number of infant deaths per 1000 residents 2000-2006 to 2007-2013 (pop. 50,000+)"
- #12 on the list of "Top 101 counties with the best general health status score of residents (1-5), 3 years of data"

|
Total of 5 patent applications in 2008-2024.