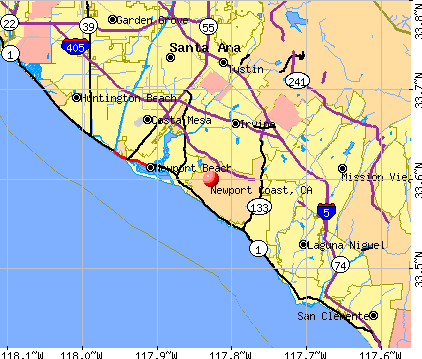
Newport Coast, California
Submit your own pictures of this place and show them to the world
- OSM Map
- General Map
- Google Map
- MSN Map
| Males: 1,366 | |
| Females: 1,399 |
| Median resident age: | 40.1 years |
| California median age: | 33.3 years |
Zip codes: 92657.
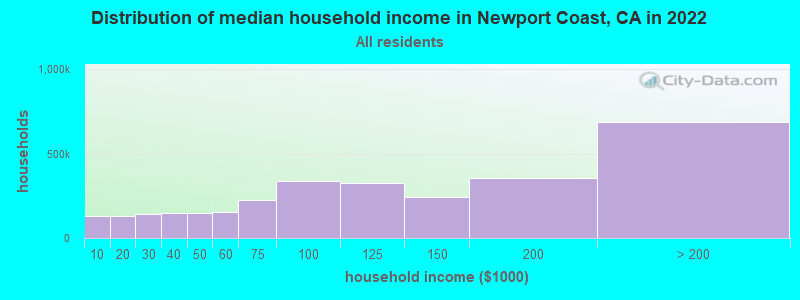
| Newport Coast: | over $200,000 |
| CA: | $91,551 |
Estimated per capita income in 2022: $196,358 (it was $98,770 in 2000)
Newport Coast CDP income, earnings, and wages data
Estimated median house or condo value in 2022: over $1,000,000 (it was $965,700 in 2000)
| Newport Coast: | over $1,000,000 |
| CA: | $715,900 |
Mean prices in 2022: all housing units: over $1,000,000; detached houses: over $1,000,000; townhouses or other attached units: $790,672; in 2-unit structures: over $1,000,000; in 3-to-4-unit structures: $673,483; in 5-or-more-unit structures: $580,884; mobile homes: $204,180; occupied boats, rvs, vans, etc.: $60,368
Detailed information about poverty and poor residents in Newport Coast, CA


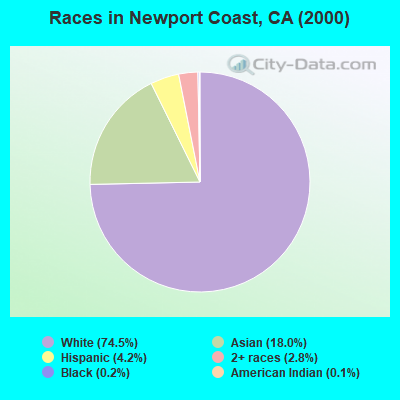
- 1,98974.5%White alone
- 48218.0%Asian alone
- 1124.2%Hispanic
- 762.8%Two or more races
- 60.2%Black alone
- 40.1%American Indian alone
- 20.07%Other race alone
 Recent articles from our blog. Our writers, many of them Ph.D. graduates or candidates, create easy-to-read articles on a wide variety of topics.

 | Orange County Real Estate Trends (206 replies) |
| An Ethnic Family in Newport Beach? (52 replies) |
| What are the dream addresses of Southern California if money was no object? (64 replies) |
| Is moving from California to Florida a thing now? (67 replies) |
| Raising a family within an hour of Carson? (32 replies) |
| Best SoCal areas for families, criteria inside (63 replies) |
Latest news from Newport Coast, CA collected exclusively by city-data.com from local newspapers, TV, and radio stations
Newport Coast, CA City Guides:
Ancestries: German (12.0%), English (9.9%), Russian (8.2%), Irish (7.7%), Italian (7.2%), Polish (6.1%).
Current Local Time: PST time zone
Land area: 7.05 square miles.
Population density: 392 people per square mile (very low).
613 residents are foreign born (16.7% Asia, 3.3% Europe, 2.4% Latin America).
| This place: | 23.0% |
| California: | 26.2% |
| Newport Coast CDP: | 1.0% ($10,001) |
| California: | 0.8% ($1,564) |
Nearest city with pop. 50,000+: Newport Beach, CA  (4.2 miles , pop. 70,032).
Nearest city with pop. 200,000+: Central Coast, CA (4.5 miles , pop. 230,250).
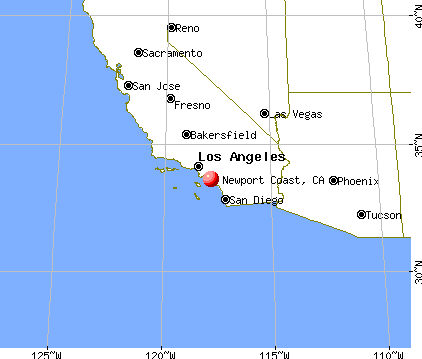
Nearest city with pop. 1,000,000+: Los Angeles, CA (46.1 miles , pop. 3,694,820).
Nearest cities:
), ), ), Latitude: 33.60 N, Longitude: 117.83 W
Area code commonly used in this area: 949
| Here: | 3.8% |
| California: | 5.1% |
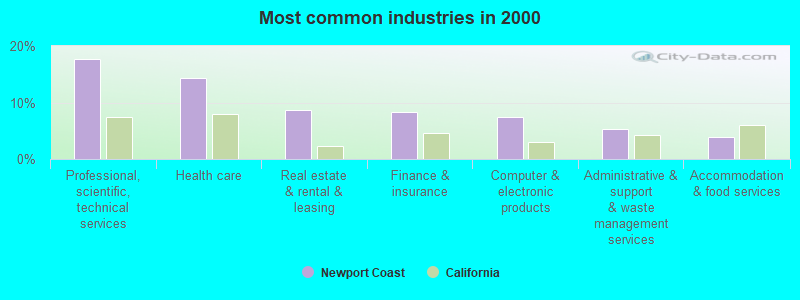
- Professional, scientific, technical services (17.7%)
- Health care (14.4%)
- Real estate & rental & leasing (8.7%)
- Finance & insurance (8.4%)
- Computer & electronic products (7.4%)
- Administrative & support & waste management services (5.4%)
- Accommodation & food services (3.9%)
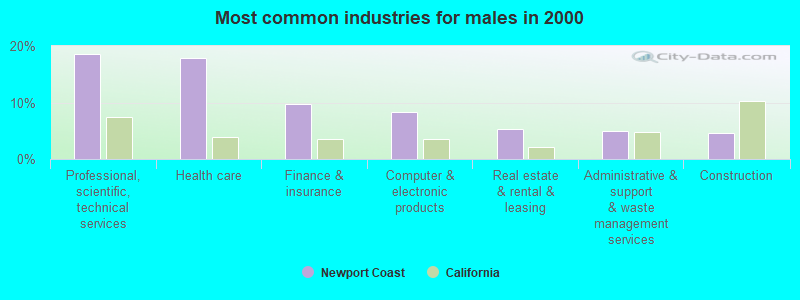
- Professional, scientific, technical services (18.5%)
- Health care (17.8%)
- Finance & insurance (9.8%)
- Computer & electronic products (8.3%)
- Real estate & rental & leasing (5.3%)
- Administrative & support & waste management services (5.0%)
- Construction (4.7%)
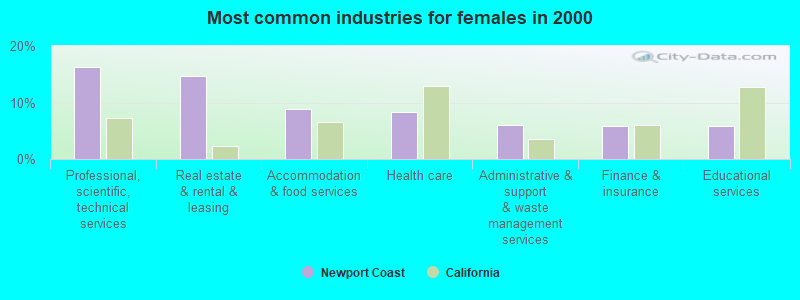
- Professional, scientific, technical services (16.2%)
- Real estate & rental & leasing (14.6%)
- Accommodation & food services (8.9%)
- Health care (8.3%)
- Administrative & support & waste management services (6.1%)
- Finance & insurance (5.9%)
- Educational services (5.9%)
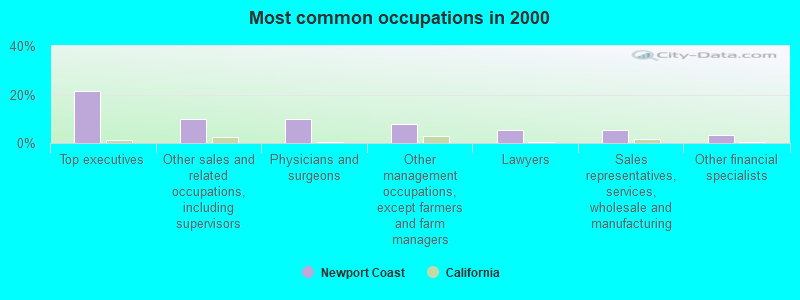
- Top executives (21.4%)
- Other sales and related occupations, including supervisors (10.0%)
- Physicians and surgeons (9.8%)
- Other management occupations, except farmers and farm managers (7.6%)
- Lawyers (5.3%)
- Sales representatives, services, wholesale and manufacturing (5.2%)
- Other financial specialists (3.3%)
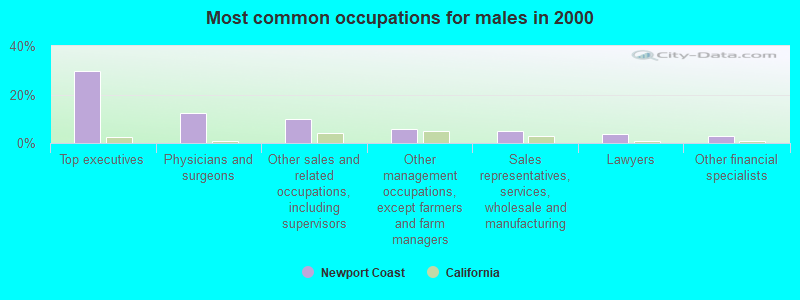
- Top executives (29.5%)
- Physicians and surgeons (12.5%)
- Other sales and related occupations, including supervisors (10.0%)
- Other management occupations, except farmers and farm managers (5.8%)
- Sales representatives, services, wholesale and manufacturing (5.1%)
- Lawyers (3.5%)
- Other financial specialists (3.1%)
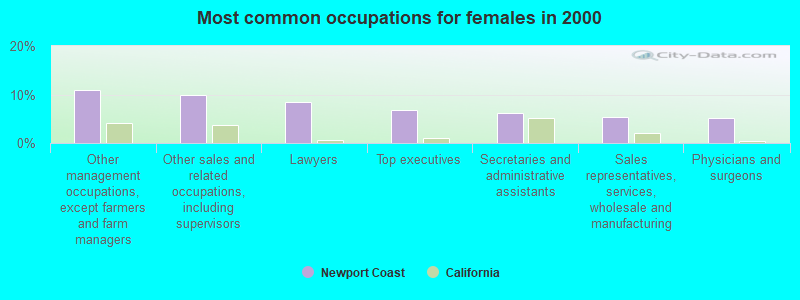
- Other management occupations, except farmers and farm managers (11.0%)
- Other sales and related occupations, including supervisors (9.9%)
- Lawyers (8.5%)
- Top executives (6.9%)
- Secretaries and administrative assistants (6.3%)
- Sales representatives, services, wholesale and manufacturing (5.3%)
- Physicians and surgeons (5.1%)
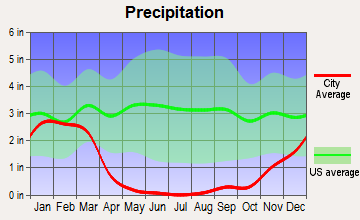
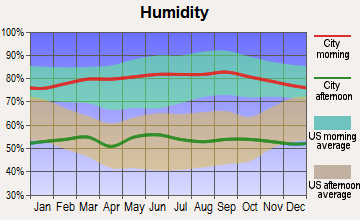
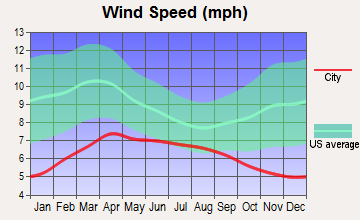
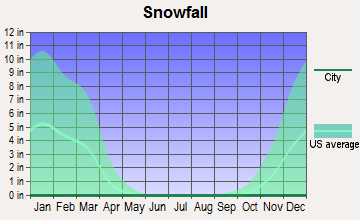
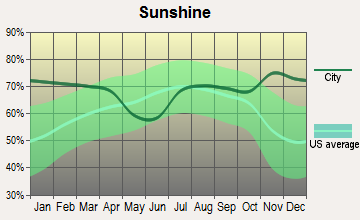
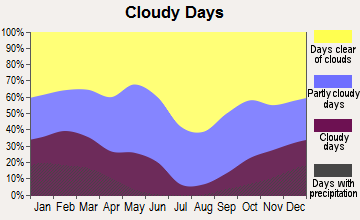
Average climate in Newport Coast, California
Based on data reported by over 4,000 weather stations
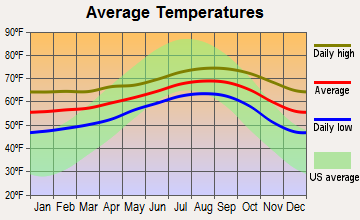
(lower is better)
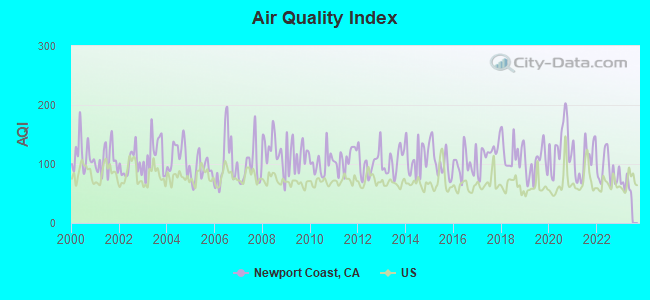
Air Quality Index (AQI) level in 2022 was 89.6. This is worse than average.
| City: | 89.6 |
| U.S.: | 72.6 |
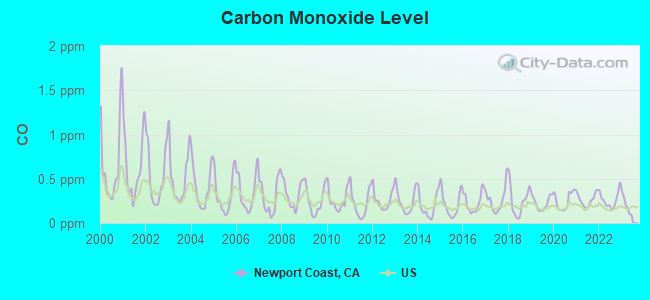
Carbon Monoxide (CO) [ppm] level in 2022 was 0.262. This is about average. Closest monitor was 4.6 miles away from the city center.
| City: | 0.262 |
| U.S.: | 0.251 |
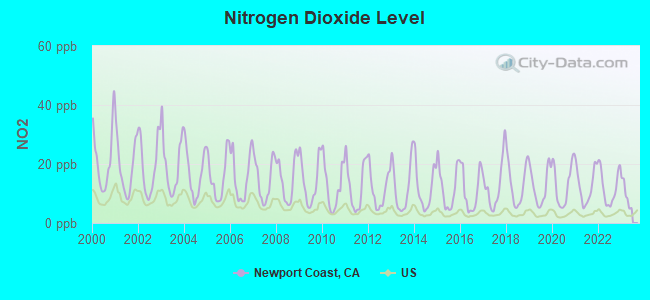
Nitrogen Dioxide (NO2) [ppb] level in 2022 was 12.2. This is significantly worse than average. Closest monitor was 5.7 miles away from the city center.
| City: | 12.2 |
| U.S.: | 5.1 |
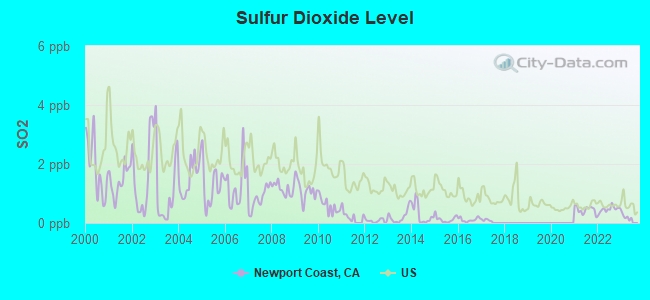
Sulfur Dioxide (SO2) [ppb] level in 2022 was 0.466. This is significantly better than average. Closest monitor was 5.7 miles away from the city center.
| City: | 0.466 |
| U.S.: | 1.515 |
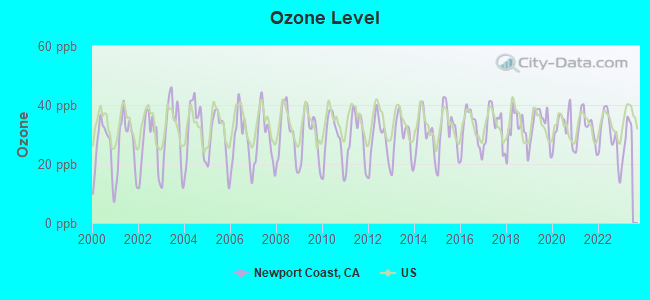
Ozone [ppb] level in 2022 was 29.7. This is about average. Closest monitor was 7.1 miles away from the city center.
| City: | 29.7 |
| U.S.: | 33.3 |
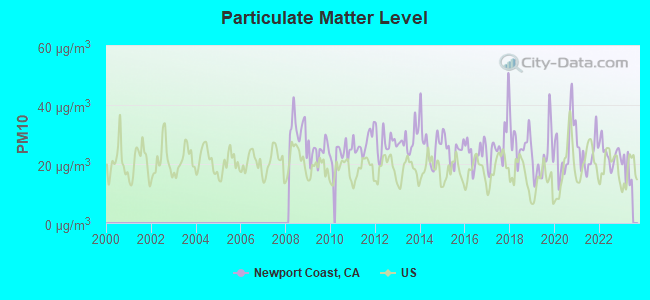
Particulate Matter (PM10) [µg/m3] level in 2022 was 23.6. This is worse than average. Closest monitor was 5.1 miles away from the city center.
| City: | 23.6 |
| U.S.: | 19.2 |
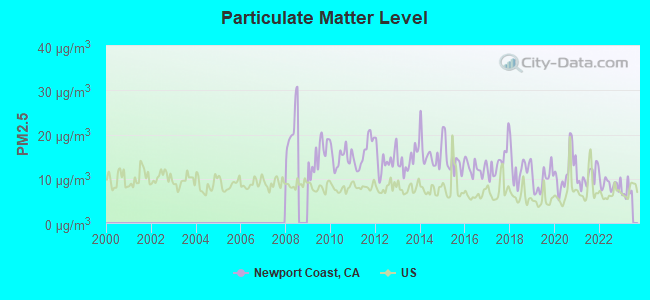
Particulate Matter (PM2.5) [µg/m3] level in 2022 was 8.80. This is about average. Closest monitor was 9.0 miles away from the city center.
| City: | 8.80 |
| U.S.: | 8.11 |
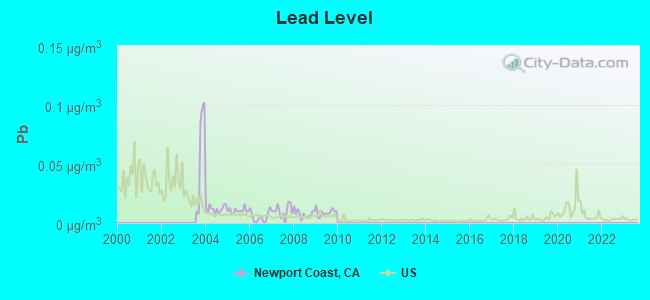
Lead (Pb) [µg/m3] level in 2009 was 0.00893. This is about average. Closest monitor was 7.1 miles away from the city center.
| City: | 0.00893 |
| U.S.: | 0.00931 |
Earthquake activity:
Newport Coast-area historical earthquake activity is significantly above California state average. It is 6680% greater than the overall U.S. average.On 6/28/1992 at 11:57:34, a magnitude 7.6 (6.2 MB, 7.6 MS, 7.3 MW, Depth: 0.7 mi, Class: Major, Intensity: VIII - XII) earthquake occurred 84.7 miles away from Newport Coast center, causing 3 deaths (1 shaking deaths, 2 other deaths) and 400 injuries, causing $100,000,000 total damage and $40,000,000 insured losses
On 7/21/1952 at 11:52:14, a magnitude 7.7 (7.7 UK) earthquake occurred 117.8 miles away from Newport Coast center, causing $50,000,000 total damage
On 10/16/1999 at 09:46:44, a magnitude 7.4 (6.3 MB, 7.4 MS, 7.2 MW, 7.3 ML) earthquake occurred 101.9 miles away from Newport Coast center
On 5/19/1940 at 04:36:40, a magnitude 7.2 (7.2 UK) earthquake occurred 125.8 miles away from Newport Coast center, causing $33,000,000 total damage
On 4/21/1918 at 22:32:30, a magnitude 6.8 (6.8 UK, Class: Strong, Intensity: VII - IX) earthquake occurred 26.7 miles away from the city center
On 11/4/1927 at 13:51:53, a magnitude 7.5 (7.5 UK) earthquake occurred 204.5 miles away from the city center
Magnitude types: body-wave magnitude (MB), local magnitude (ML), surface-wave magnitude (MS), moment magnitude (MW)
Natural disasters:
The number of natural disasters in Orange County (32) is a lot greater than the US average (15).Major Disasters (Presidential) Declared: 22
Emergencies Declared: 2
Causes of natural disasters: Floods: 15, Fires: 13, Storms: 9, Landslides: 6, Winter Storms: 6, Mudslides: 5, Earthquakes: 2, Heavy Rain: 1, Hurricane: 1, Snow: 1, Tornado: 1, Wind: 1, Other: 1 (Note: some incidents may be assigned to more than one category).
Hospitals and medical centers near Newport Coast:
- SURGERY LASER CLINIC (Hospital, about 4 miles away; IRVINE, CA)
- REGENTS POINT - WINDCREST (Nursing Home, about 4 miles away; IRVINE, CA)
- ACCENTCARE HOME HEALTH OF CALIFORNIA, INC (Home Health Center, about 6 miles away; NEWPORT BEACH, CA)
- NEWPORT BAY HOSPITAL (Hospital, about 6 miles away; NEWPORT BEACH, CA)
- RAI-LAGUNA CANYON-IRVINE (Dialysis Facility, about 6 miles away; IRVINE, CA)
- HOAG ORTHOPEDIC INSTITUTE Acute Care Hospitals (about 6 miles away; IRVINE, CA)
- IRVINE REGIONAL HOSPITAL AND MEDICAL CTR (Hospital, about 6 miles away; IRVINE, CA)
Amtrak stations near Newport Coast:
- 3 miles: NEWPORT BEACH (NEWPORT TRANS. CENTER, 1550 AVOCADO AVE.) - Bus Station . Services: fully wheelchair accessible, public payphones, public transit connection.
- 5 miles: LAGUNA BEACH (TRANSIT DEPOT, BROADWAY BTW. BEACH & FOR) - Bus Station
- 7 miles: IRVINE (15215 BARRANCA PKWY.) . Services: ticket office, fully wheelchair accessible, enclosed waiting area, public restrooms, public payphones, snack bar, free short-term parking, free long-term parking, call for taxi service, intercity bus service, public transit connection.
Operable nuclear power plants near Newport Coast:
- 17 miles: San Onofre 2 and 3 in San Clemente, CA.
Colleges/universities with over 2000 students nearest to Newport Coast:
- Coastline Community College (about 3 miles; Fountain Valley, CA; Full-time enrollment: 4,591)
- University of California-Irvine (about 4 miles; Irvine, CA; FT enrollment: 28,587)
- Concordia University-Irvine (about 4 miles; Irvine, CA; FT enrollment: 3,284)
- Brandman University (about 6 miles; Irvine, CA; FT enrollment: 6,027)
- Irvine Valley College (about 6 miles; Irvine, CA; FT enrollment: 8,005)
- Vanguard University of Southern California (about 7 miles; Costa Mesa, CA; FT enrollment: 2,104)
- University of Phoenix-Southern California Campus (about 7 miles; Costa Mesa, CA; FT enrollment: 8,110)
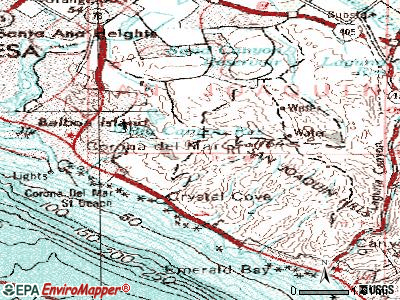
Points of interest:
Notable locations in Newport Coast: Pelican Hill Golf Club (A), Newport Beach Fire Department Station 8 (B). Display/hide their locations on the map
Park in Newport Coast: Crystal Cove Historic District (1). Display/hide its location on the map
Birthplace of: Ryan Kahn - Television personality.
| This place: | 2.7 people |
| California: | 2.9 people |
| This place: | 77.6% |
| Whole state: | 69.4% |
| This place: | 4.5% |
| Whole state: | 5.9% |
Likely homosexual households (counted as self-reported same-sex unmarried-partner households)
- Lesbian couples: 0.2% of all households
- Gay men: 0.2% of all households
| This place: | 2.8% |
| Whole state: | 14.2% |
| This place: | 0.4% |
| Whole state: | 6.3% |
Banks with branches in Newport Coast (2011 data):
- Opus Bank: Crystal Cove Branch at 7776 & 7780 East Coast Highway, branch established on 2011/08/08. Info updated 2011/11/08: Bank assets: $2,404.2 mil, Deposits: $1,831.2 mil, headquarters in Irvine, CA, negative income in the last year, Commercial Lending Specialization, 38 total offices
- U.S. Bank National Association: Newport Coast Drive Vons Branch at 21181 Newport Coast Drive, branch established on 2003/11/10. Info updated 2012/01/30: Bank assets: $330,470.8 mil, Deposits: $236,091.5 mil, headquarters in Cincinnati, OH, positive income, 3121 total offices, Holding Company: U.S. Bancorp
- Wells Fargo Bank, National Association: Newport Coast Branch at 21103 Newport Coast Drive, branch established on 2002/06/10. Info updated 2011/04/05: Bank assets: $1,161,490.0 mil, Deposits: $905,653.0 mil, headquarters in Sioux Falls, SD, positive income, 6395 total offices, Holding Company: Wells Fargo & Company
For population 15 years and over in Newport Coast:
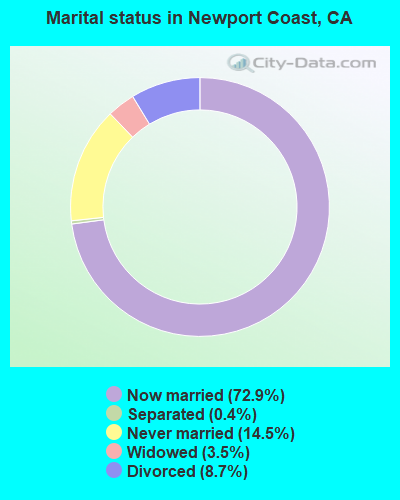
- Never married: 14.5%
- Now married: 72.9%
- Separated: 0.4%
- Widowed: 3.5%
- Divorced: 8.7%
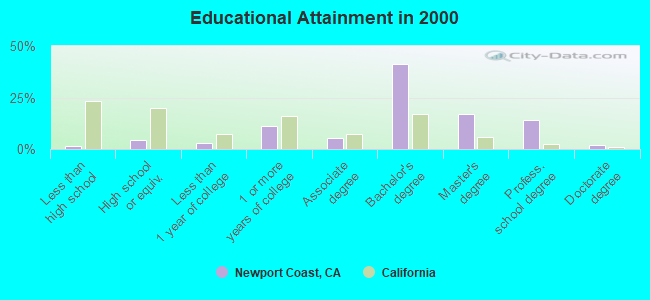
For population 25 years and over in Newport Coast:
- High school or higher: 98.5%
- Bachelor's degree or higher: 74.5%
- Graduate or professional degree: 33.4%
- Mean travel time to work (commute): 30.2 minutes
| Here: | 8.2 |
| California average: | 16.1 |


Graphs represent county-level data. Detailed 2008 Election Results
Religion statistics for Newport Coast, CA (based on Orange County data)


| Religion | Adherents | Congregations |
|---|---|---|
| Catholic | 797,473 | 67 |
| Evangelical Protestant | 345,893 | 894 |
| Other | 141,815 | 329 |
| Mainline Protestant | 76,574 | 202 |
| Orthodox | 13,406 | 19 |
| Black Protestant | 2,424 | 8 |
| None | 1,632,647 | - |
Food Environment Statistics:
| Here: | 1.78 / 10,000 pop. |
| California: | 2.14 / 10,000 pop. |
| Orange County: | 0.06 / 10,000 pop. |
| California: | 0.04 / 10,000 pop. |
| Orange County: | 0.49 / 10,000 pop. |
| California: | 0.62 / 10,000 pop. |
| Orange County: | 1.46 / 10,000 pop. |
| State: | 1.49 / 10,000 pop. |
| This county: | 8.19 / 10,000 pop. |
| California: | 7.42 / 10,000 pop. |
| This county: | 6.3% |
| State: | 7.3% |
| Here: | 18.5% |
| State: | 21.3% |
| This county: | 16.4% |
| California: | 17.9% |
4.86% of this county's 2021 resident taxpayers lived in other counties in 2020 ($95,983 average adjusted gross income)
| Here: | 4.86% |
| California average: | 5.19% |
0.01% of residents moved from foreign countries ($132 average AGI)
Orange County: 0.01% California average: 0.03%
Top counties from which taxpayers relocated into this county between 2020 and 2021:
| from Los Angeles County, CA | |
| from Riverside County, CA | |
| from San Diego County, CA |
5.71% of this county's 2020 resident taxpayers moved to other counties in 2021 ($106,828 average adjusted gross income)
| Here: | 5.71% |
| California average: | 6.14% |
0.01% of residents moved to foreign countries ($180 average AGI)
Orange County: 0.01% California average: 0.02%
Top counties to which taxpayers relocated from this county between 2020 and 2021:
| to Los Angeles County, CA | |
| to Riverside County, CA | |
| to San Diego County, CA |
| Businesses in Newport Coast, CA | ||||
| Name | Count | Name | Count | |
|---|---|---|---|---|
| Banana Republic | 1 | Pier 1 Imports | 1 | |
| FedEx | 2 | Safeway | 1 | |
| Gap | 1 | Starbucks | 2 | |
| Jamba Juice | 1 | Vons | 1 | |
| Marriott | 1 | |||
Strongest AM radio stations in Newport Coast:
- KFI (640 AM; 50 kW; LOS ANGELES, CA; Owner: CAPSTAR TX LIMITED PARTNERSHIP)
- KPLS (830 AM; 50 kW; ORANGE, CA; Owner: CRN LICENSES, LLC)
- KLAC (570 AM; 50 kW; LOS ANGELES, CA; Owner: AMFM RADIO LICENSES, L.L.C.)
- KTNQ (1020 AM; 50 kW; LOS ANGELES, CA; Owner: KTNQ-AM LICENSE CORP.)
- KXTA (1150 AM; 50 kW; LOS ANGELES, CA; Owner: CITICASTERS LICENSES, L.P.)
- KNX (1070 AM; 50 kW; LOS ANGELES, CA; Owner: INFINITY BROADCASTING OPERATIONS, INC.)
- KFWB (980 AM; 50 kW; LOS ANGELES, CA; Owner: INFINITY BROADCASTING OPERATIONS, INC.)
- KDIS (1110 AM; 50 kW; PASADENA, CA; Owner: ABC,INC.)
- KVNR (1480 AM; 5 kW; SANTA ANA, CA; Owner: LBI RADIO LICENSE CORP.)
- KSPN (710 AM; 50 kW; LOS ANGELES, CA; Owner: KABC-AM RADIO, INC.)
- KMPC (1540 AM; 50 kW; LOS ANGELES, CA; Owner: ROSE CITY RADIO CORPORATION)
- KBLA (1580 AM; 50 kW; SANTA MONICA, CA)
- KXMX (1190 AM; 25 kW; ANAHEIM, CA; Owner: NEW INSPIRATION BROADCASTING COMPANY)
Strongest FM radio stations in Newport Coast:
- KWVE (107.9 FM; SAN CLEMENTE, CA; Owner: CALVARY CHAPEL OF COSTA MESA)
- KDLE (103.1 FM; NEWPORT BEACH, CA; Owner: ENTRAVISION HOLDINGS, LLC.)
- KRTM (88.9 FM; TEMECULA, CA; Owner: PENFOLD COMMUNICATIONS, INC.)
- KCBS-FM (93.1 FM; LOS ANGELES, CA; Owner: INFINITY BROADCASTING OPERATIONS, INC.)
- KZLA-FM (93.9 FM; LOS ANGELES, CA; Owner: EMMIS RADIO LICENSE CORPORATION)
- KSBR (88.5 FM; MISSION VIEJO, CA; Owner: SADDLEBACK COMMUNITY COLLEGE DIST.)
- KSCA (101.9 FM; GLENDALE, CA; Owner: HBC LICENSE CORPORATION)
- KPWR (105.9 FM; LOS ANGELES, CA; Owner: EMMIS RADIO LICENSE CORPORATION)
- KLOS (95.5 FM; LOS ANGELES, CA; Owner: KLOS-FM RADIO, INC.)
- K212FA (90.3 FM; TEMPLE CITY, CA; Owner: EDUCATIONAL MEDIA FOUNDATION)
- KOST (103.5 FM; LOS ANGELES, CA; Owner: CAPSTAR TX LIMITED PARTNERSHIP)
- KLSX (97.1 FM; LOS ANGELES, CA; Owner: INFINITY BROADCASTING OPERATIONS, INC.)
- KUSC (91.5 FM; LOS ANGELES, CA; Owner: UNIVERSITY OF SOUTHERN CALIFORNIA)
- KLVE (107.5 FM; LOS ANGELES, CA; Owner: KLVE-FM LICENSE CORP.)
- KIIS-FM (102.7 FM; LOS ANGELES, CA; Owner: CITICASTERS LICENSES, L.P.)
- KKLA-FM (99.5 FM; LOS ANGELES, CA; Owner: NEW INSPIRATION BROADCASTING CO., INC.)
- KPCC (89.3 FM; PASADENA, CA; Owner: PASADENA AREA COMMUNITY COLLEGE DISTRICT)
- KHHT (92.3 FM; LOS ANGELES, CA; Owner: AMFM RADIO LICENSES, L.L.C.)
- KRTH-FM (101.1 FM; LOS ANGELES, CA; Owner: INFINITY BROADCASTING OPERATIONS, INC.)
- KBIG-FM (104.3 FM; LOS ANGELES, CA; Owner: AMFM RADIO LICENSES, L.L.C.)
TV broadcast stations around Newport Coast:
- KTRO-LP (Channel 50; LANCASTER, CA; Owner: ROBERT D. ADELMAN)
FCC Registered Broadcast Land Mobile Towers:
3- Lat: 33.584472 Lon: -117.848667, Call Sign: WPRI475,
Assigned Frequencies: 467.075 MHz, 468.675 MHz, 461.550 MHz, 461.575 MHz, 466.575 MHz, 461.425 MHz, 461.450 MHz, 462.075 MHz, 463.675 MHz, 463.700 MHz, 466.425 MHz, Grant Date: 08/25/2015, Expiration Date: 10/02/2025, Certifier: Steve Belna, Registrant: Marriott Vacations Worldwide Corporation, 7812 Palm Parkway, Orlando, FL 32836, Phone: (407) 206-6000, Fax: (407) 206-6420, Email:
- 5 Longboat (Lat: 33.601167 Lon: -117.830194), Call Sign: WQGJ504,
Assigned Frequencies: 461.587 MHz, 466.587 MHz, 461.612 MHz, 466.612 MHz, 461.637 MHz, 466.637 MHz, 461.687 MHz, 466.687 MHz, 461.762 MHz, 466.762 MHz, Grant Date: 02/06/2007, Expiration Date: 02/06/2017, Cancellation Date: 04/08/2017, Certifier: Steven Potter, Registrant: Sjm Industrial Radio, 1212 E Imperial Ave, El Segundo, CA 90245, Phone: (310) 640-2700, Fax: (310) 640-1095, Email:
- Lat: 33.574361 Lon: -117.840306, Call Sign: WQPV883,
Assigned Frequencies: 451.562 MHz, 451.662 MHz, 452.812 MHz, 456.562 MHz, 456.662 MHz, Grant Date: 08/27/2012, Expiration Date: 08/27/2022, Cancellation Date: 10/29/2022, Certifier: Tad Belshe, Registrant: Spectrum License Consultants, Inc., 6713 Club Meadows Drive, Amarillo, TX 79124, Phone: (806) 352-4810, Fax: (806) 352-4830, Email:
FCC Registered Microwave Towers:
17 (See the full list of FCC Registered Microwave Towers in this town)FCC Registered Maritime Coast & Aviation Ground Towers:
1 (See the full list of FCC Registered Maritime Coast & Aviation Ground Towers)FCC Registered Amateur Radio Licenses:
30 (See the full list of FCC Registered Amateur Radio Licenses in Newport Coast)FAA Registered Aircraft Manufacturers and Dealers:
1 (See the full list of FAA Registered Manufacturers and Dealers in Newport Coast)FAA Registered Aircraft:
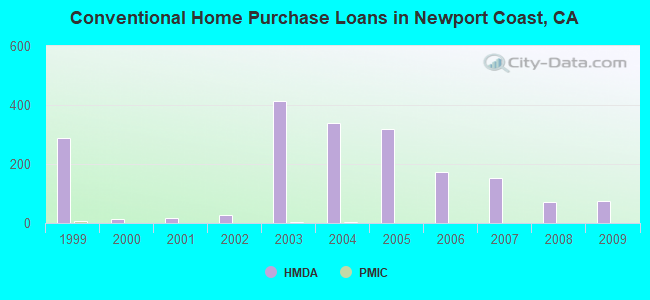
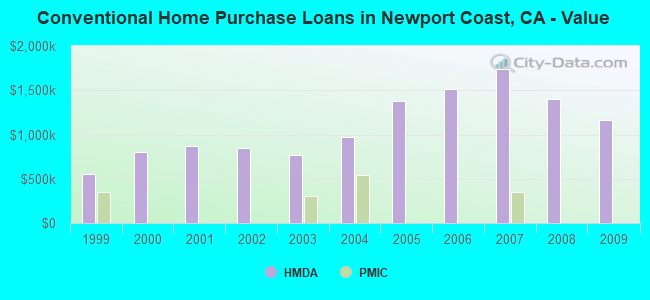
17 (See the full list of FAA Registered Aircraft)| Home Mortgage Disclosure Act Aggregated Statistics For Year 2009 (Based on 1 full and 1 partial tracts) | ||||||||||
| A) FHA, FSA/RHS & VA Home Purchase Loans | B) Conventional Home Purchase Loans | C) Refinancings | D) Home Improvement Loans | F) Non-occupant Loans on < 5 Family Dwellings (A B C & D) | ||||||
|---|---|---|---|---|---|---|---|---|---|---|
| Number | Average Value | Number | Average Value | Number | Average Value | Number | Average Value | Number | Average Value | |
| LOANS ORIGINATED | 4 | $608,142 | 74 | $1,161,936 | 314 | $909,828 | 7 | $566,104 | 33 | $958,709 |
| APPLICATIONS APPROVED, NOT ACCEPTED | 0 | $0 | 12 | $1,140,437 | 35 | $731,742 | 0 | $0 | 4 | $582,072 |
| APPLICATIONS DENIED | 0 | $0 | 25 | $1,432,285 | 98 | $1,470,825 | 1 | $336,030 | 13 | $1,085,822 |
| APPLICATIONS WITHDRAWN | 1 | $294,360 | 18 | $1,151,418 | 82 | $1,567,595 | 2 | $620,820 | 4 | $444,840 |
| FILES CLOSED FOR INCOMPLETENESS | 0 | $0 | 3 | $1,903,997 | 21 | $1,102,270 | 1 | $587,140 | 4 | $1,678,310 |
Detailed HMDA statistics for the following Tracts: 0626.04 , 0626.43
| Private Mortgage Insurance Companies Aggregated Statistics For Year 2007 (Based on 1 partial tract) | ||
| A) Conventional Home Purchase Loans | ||
|---|---|---|
| Number | Average Value | |
| LOANS ORIGINATED | 1 | $351,170 |
| APPLICATIONS APPROVED, NOT ACCEPTED | 0 | $0 |
| APPLICATIONS DENIED | 0 | $0 |
| APPLICATIONS WITHDRAWN | 0 | $0 |
| FILES CLOSED FOR INCOMPLETENESS | 0 | $0 |
Detailed PMIC statistics for the following Tracts: 0626.04 , 0626.43
Newport Coast compared to California state average:
- Median household income above state average.
- Unemployed percentage significantly below state average.
- Black race population percentage significantly below state average.
- Hispanic race population percentage significantly below state average.
- Median age above state average.
- Renting percentage significantly below state average.
- Length of stay since moving in significantly above state average.
- Number of rooms per house significantly below state average.
- House age significantly below state average.
- Percentage of population with a bachelor's degree or higher significantly above state average.
Newport Coast on our top lists:
- #46 on the list of "Top 100 cities with highest median household income"
- #94 on the list of "Top 100 cities with highest median house value"
- #101 on the list of "Top 101 cities with the most residents born in Other Central America (population 500+)"
- #11 (92657) on the list of "Top 101 zip codes with the highest 2012 average Adjusted Gross Income (AGI) for individuals (pop 5,000+)"
- #13 (92657) on the list of "Top 101 zip codes with the highest 2012 average taxable interest for individuals (pop 5,000+)"
- #16 (92657) on the list of "Top 101 zip codes with the highest 2012 average net capital gain/loss (pop 5,000+)"
- #25 (92657) on the list of "Top 101 zip codes with the highest average reported salary/wage in 2012 (pop 5,000+)"
- #51 (92657) on the list of "Top 101 zip codes with the largest percentage of taxpayers reporting net capital gain/loss in 2012 (pop 5,000+)"
- #70 (92657) on the list of "Top 101 zip codes with the highest 2012 average reported profit/loss from business (pop 5,000+)"
- #76 (92657) on the list of "Top 101 zip codes with the largest percentage of taxpayers using charity contributions deductions in 2012 (pop 5,000+)"
- #99 (92657) on the list of "Top 101 zip codes with the largest percentage of taxpayers reporting taxable interest in 2012 (pop 5,000+)"
- #4 on the list of "Top 101 counties with the highest total withdrawal of fresh water for public supply"
- #5 on the list of "Top 101 counties with the most Catholic adherents"
- #6 on the list of "Top 101 counties with the highest ground withdrawal of fresh water for public supply"
- #7 on the list of "Top 101 counties with the most Evangelical Protestant adherents"
- #8 on the list of "Top 101 counties with the highest Particulate Matter (PM2.5) Annual air pollution readings in 2012 (µg/m3)"

|
|
Total of 1624 patent applications in 2008-2024.