Northwest Snohomish, Washington
Submit your own pictures of this place and show them to the world
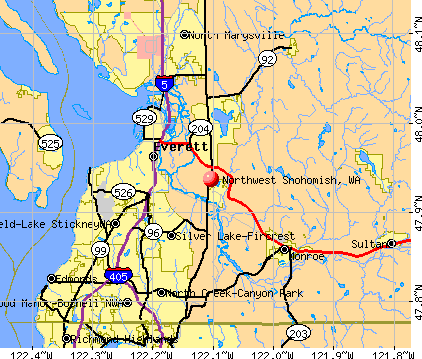
- OSM Map
- General Map
- Google Map
- MSN Map
| Males: 1,121 | |
| Females: 1,165 |
| Median resident age: | 38.0 years |
| Washington median age: | 35.3 years |
Zip codes: 98290.
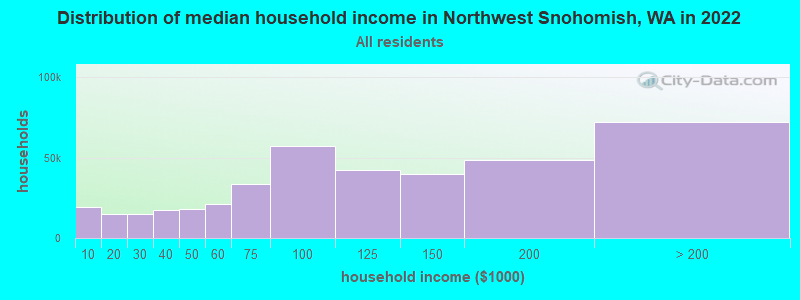
| Northwest Snohomish: | $128,526 |
| WA: | $91,306 |
Estimated per capita income in 2022: $51,140 (it was $23,327 in 2000)
Northwest Snohomish CDP income, earnings, and wages data
Estimated median house or condo value in 2022: $721,898 (it was $190,900 in 2000)
| Northwest Snohomish: | $721,898 |
| WA: | $569,500 |
Mean prices in 2022: all housing units: $766,619; detached houses: $825,949; townhouses or other attached units: $643,803; in 2-unit structures: $530,516; in 3-to-4-unit structures: $479,562; in 5-or-more-unit structures: $400,308; mobile homes: $303,974; occupied boats, rvs, vans, etc.: $101,172
Northwest Snohomish, WA residents, houses, and apartments details
Detailed information about poverty and poor residents in Northwest Snohomish, WA


- 1,93393.8%White alone
- 532.6%Hispanic
- 281.4%Asian alone
- 281.4%Two or more races
- 120.6%American Indian alone
- 60.3%Black alone
- 10.05%Native Hawaiian and Other
Pacific Islander alone
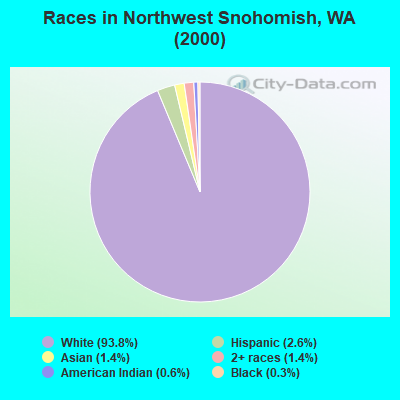
Races in Northwest Snohomish detailed stats: ancestries, foreign born residents, place of birth
 Recent articles from our blog. Our writers, many of them Ph.D. graduates or candidates, create easy-to-read articles on a wide variety of topics.

Latest news from Northwest Snohomish, WA collected exclusively by city-data.com from local newspapers, TV, and radio stations
Ancestries: German (22.0%), English (16.3%), Irish (14.4%), Norwegian (11.7%), Scotch-Irish (4.1%), Dutch (4.0%).
Current Local Time: PST time zone
Land area: 2.54 square miles.
Population density: 902 people per square mile (low).
55 residents are foreign born (1.5% Europe, 0.8% Asia, 0.4% Latin America).
| This place: | 2.7% |
| Washington: | 10.4% |
| Northwest Snohomish CDP: | 1.2% ($2,199) |
| Washington: | 1.2% ($1,915) |
Nearest city with pop. 50,000+: Everett, WA  (4.8 miles , pop. 91,488).
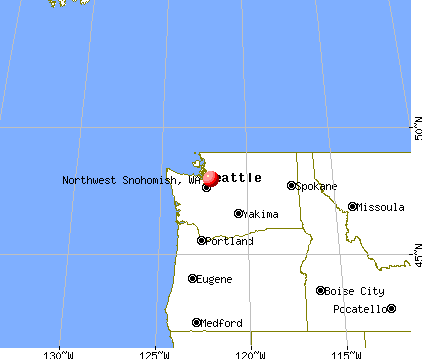
Nearest city with pop. 200,000+: East Seattle, WA (22.4 miles , pop. 480,100).
Nearest city with pop. 1,000,000+: Los Angeles, CA (977.3 miles , pop. 3,694,820).
Nearest cities:
), ), ), ), ), )Latitude: 47.94 N, Longitude: 122.10 W
Property values in Northwest Snohomish, WA
| Here: | 3.6% |
| Washington: | 4.6% |
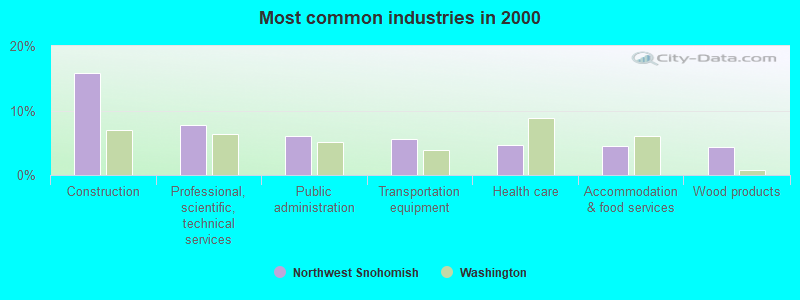
- Construction (15.8%)
- Professional, scientific, technical services (7.7%)
- Public administration (6.1%)
- Transportation equipment (5.5%)
- Health care (4.7%)
- Accommodation & food services (4.5%)
- Wood products (4.4%)
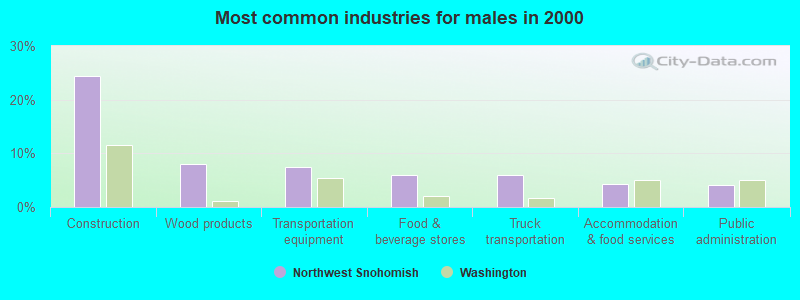
- Construction (24.5%)
- Wood products (8.0%)
- Transportation equipment (7.5%)
- Food & beverage stores (6.0%)
- Truck transportation (6.0%)
- Accommodation & food services (4.2%)
- Public administration (4.0%)
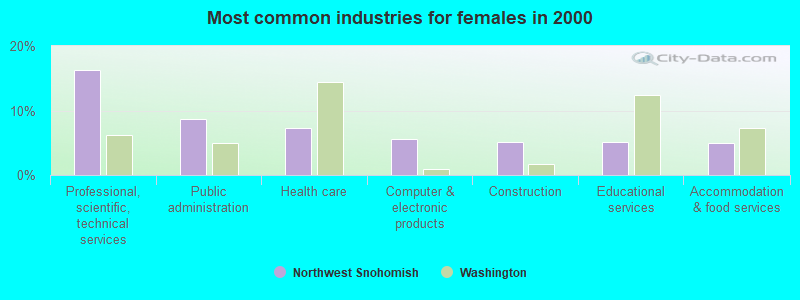
- Professional, scientific, technical services (16.3%)
- Public administration (8.7%)
- Health care (7.3%)
- Computer & electronic products (5.6%)
- Construction (5.1%)
- Educational services (5.1%)
- Accommodation & food services (4.9%)
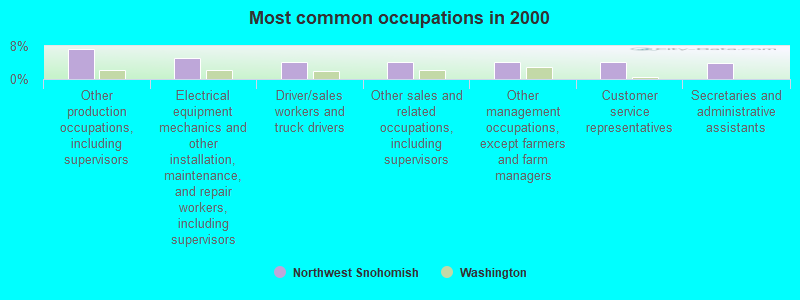
- Other production occupations, including supervisors (7.3%)
- Electrical equipment mechanics and other installation, maintenance, and repair workers, including supervisors (5.1%)
- Driver/sales workers and truck drivers (4.1%)
- Other sales and related occupations, including supervisors (4.0%)
- Other management occupations, except farmers and farm managers (4.0%)
- Customer service representatives (4.0%)
- Secretaries and administrative assistants (3.9%)
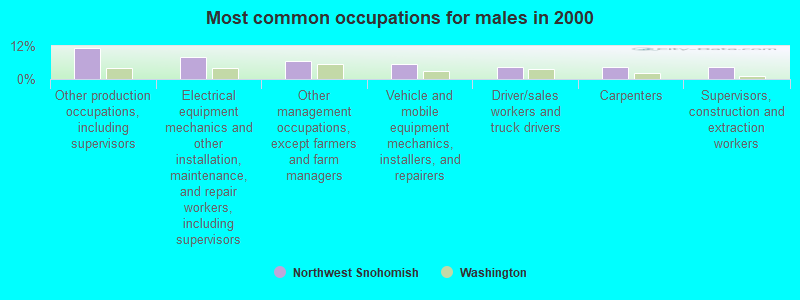
- Other production occupations, including supervisors (11.2%)
- Electrical equipment mechanics and other installation, maintenance, and repair workers, including supervisors (8.0%)
- Other management occupations, except farmers and farm managers (6.4%)
- Vehicle and mobile equipment mechanics, installers, and repairers (5.3%)
- Driver/sales workers and truck drivers (4.4%)
- Carpenters (4.4%)
- Supervisors, construction and extraction workers (4.4%)
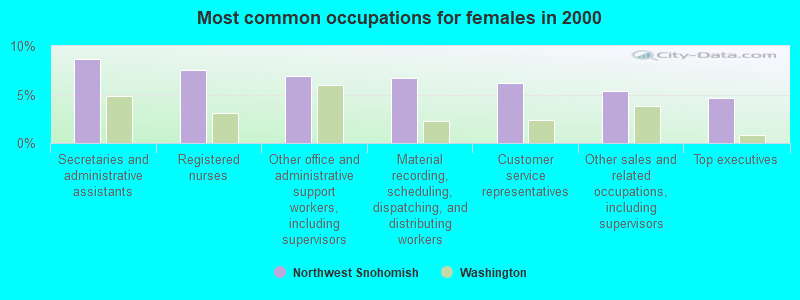
- Secretaries and administrative assistants (8.7%)
- Registered nurses (7.6%)
- Other office and administrative support workers, including supervisors (6.9%)
- Material recording, scheduling, dispatching, and distributing workers (6.7%)
- Customer service representatives (6.2%)
- Other sales and related occupations, including supervisors (5.3%)
- Top executives (4.7%)
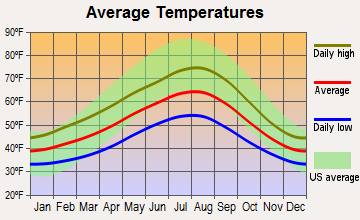
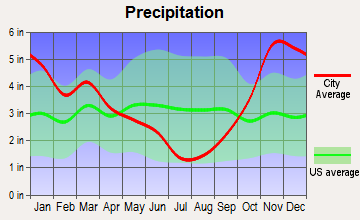
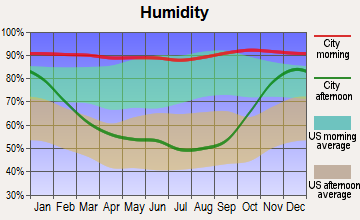
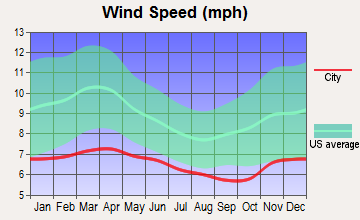
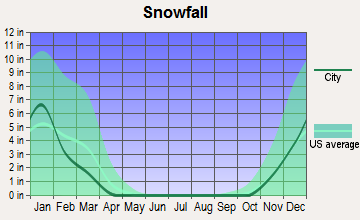
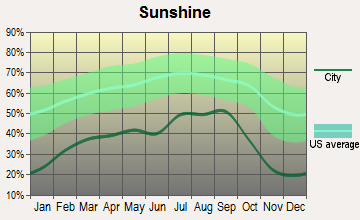
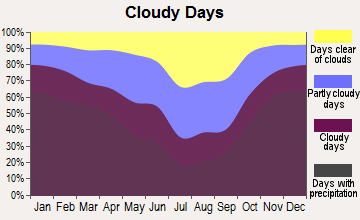
Average climate in Northwest Snohomish, Washington
Based on data reported by over 4,000 weather stations
(lower is better)
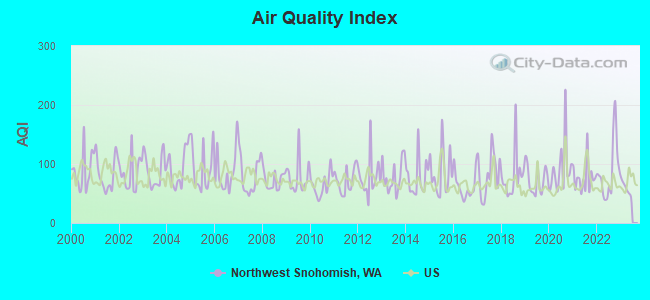
Air Quality Index (AQI) level in 2022 was 88.1. This is worse than average.
| City: | 88.1 |
| U.S.: | 72.6 |
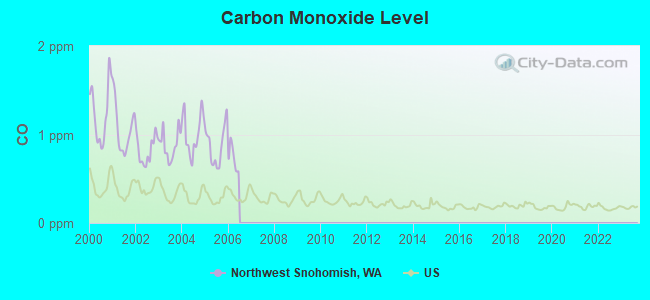
Carbon Monoxide (CO) [ppm] level in 2005 was 0.875. This is significantly worse than average. Closest monitor was 5.1 miles away from the city center.
| City: | 0.875 |
| U.S.: | 0.251 |
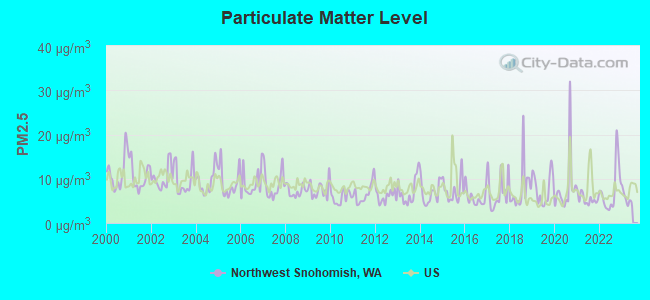
Particulate Matter (PM2.5) [µg/m3] level in 2022 was 7.55. This is about average. Closest monitor was 8.7 miles away from the city center.
| City: | 7.55 |
| U.S.: | 8.11 |
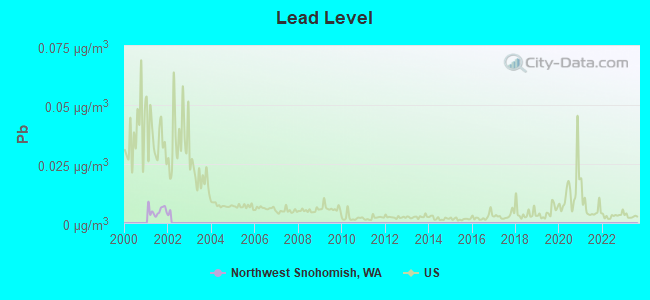
Lead (Pb) [µg/m3] level in 2001 was 0.00522. This is significantly better than average. Closest monitor was 15.0 miles away from the city center.
| City: | 0.00522 |
| U.S.: | 0.00931 |
Earthquake activity:
Northwest Snohomish-area historical earthquake activity is significantly above Washington state average. It is 1224% greater than the overall U.S. average.On 4/13/1949 at 19:55:42, a magnitude 7.0 (7.0 UK, Class: Major, Intensity: VIII - XII) earthquake occurred 51.0 miles away from the city center, causing $80,000,000 total damage
On 2/28/2001 at 18:54:32, a magnitude 6.8 (6.8 MD, Depth: 32.2 mi, Class: Strong, Intensity: VII - IX) earthquake occurred 61.8 miles away from Northwest Snohomish center
On 2/28/2001 at 18:54:32, a magnitude 6.8 (6.5 MB, 6.6 MS, 6.8 MW) earthquake occurred 62.7 miles away from Northwest Snohomish center, causing $2,000,000,000 total damage and $305,000,000 insured losses
On 4/29/1965 at 15:28:43, a magnitude 6.6 (6.6 UK) earthquake occurred 44.2 miles away from Northwest Snohomish center, causing $28,000,000 total damage
On 7/3/1999 at 01:43:54, a magnitude 5.8 (5.4 MB, 5.5 MS, 5.8 MW, 5.3 ME, Depth: 25.2 mi, Class: Moderate, Intensity: VI - VII) earthquake occurred 80.4 miles away from the city center
On 5/3/1996 at 04:04:22, a magnitude 5.5 (5.2 MB, 5.3 MD, 5.5 ML, Depth: 2.5 mi) earthquake occurred 18.1 miles away from Northwest Snohomish center
Magnitude types: body-wave magnitude (MB), duration magnitude (MD), energy magnitude (ME), local magnitude (ML), surface-wave magnitude (MS), moment magnitude (MW)
Natural disasters:
The number of natural disasters in Snohomish County (31) is a lot greater than the US average (15).Major Disasters (Presidential) Declared: 27
Emergencies Declared: 2
Causes of natural disasters: Floods: 21, Storms: 17, Mudslides: 14, Landslides: 10, Winter Storms: 6, Winds: 5, Earthquakes: 2, Heavy Rain: 1, Hurricane: 1, Snow: 1, Tornado: 1, Volcanic Eruption: 1, Other: 1 (Note: some incidents may be assigned to more than one category).
Hospitals and medical centers near Northwest Snohomish:
- DELTA REHABILITATION CENTER (Nursing Home, about 2 miles away; SNOHOMISH, WA)
- MERRY HAVEN CARE CENTER LLC (Nursing Home, about 2 miles away; SNOHOMISH, WA)
- SUNRISE VIEW CONVALESCENT CTR (Nursing Home, about 5 miles away; EVERETT, WA)
- BETHANY ON BROADWAY (Nursing Home, about 6 miles away; EVERETT, WA)
- ALPHA NURSING AND SERVICES INC (Home Health Center, about 6 miles away; EVERETT, WA)
- VIRGINIA MANOR CONVALESCENT HOME (Nursing Home, about 6 miles away; EVERETT, WA)
- BETHANY AT SILVER LAKE (Nursing Home, about 6 miles away; EVERETT, WA)
Amtrak stations near Northwest Snohomish:
- 6 miles: EVERETT (2900 BOND ST.) . Services: ticket office, partially wheelchair accessible, enclosed waiting area, public payphones, free short-term parking, free long-term parking, call for car rental service, taxi stand, public transit connection.
- 9 miles: MONROE (RED BARN UNOCAL) - Bus Station
- 16 miles: EDMONDS (211 RAILROAD AVE.) . Services: ticket office, fully wheelchair accessible, enclosed waiting area, public restrooms, public payphones, vending machines, paid short-term parking, paid long-term parking, call for taxi service, public transit connection.
Colleges/universities with over 2000 students nearest to Northwest Snohomish:
- Everett Community College (about 7 miles; Everett, WA; Full-time enrollment: 5,818)
- University of Washington-Bothell Campus (about 13 miles; Bothell, WA; FT enrollment: 3,902)
- Cascadia Community College (about 13 miles; Bothell, WA; FT enrollment: 2,238)
- Edmonds Community College (about 14 miles; Lynnwood, WA; FT enrollment: 7,271)
- Lake Washington Institute of Technology (about 17 miles; Kirkland, WA; FT enrollment: 2,947)
- Shoreline Community College (about 18 miles; Shoreline, WA; FT enrollment: 5,026)
- Seattle Community College-North Campus (about 20 miles; Seattle, WA; FT enrollment: 4,220)
Points of interest:
Cemetery: Grand Army of the Republic Cemetery (1). Display/hide its location on the map
Lake: Blackmans Lake (A). Display/hide its location on the map
| This place: | 2.8 people |
| Washington: | 2.5 people |
| This place: | 77.9% |
| Whole state: | 66.5% |
| This place: | 5.7% |
| Whole state: | 6.1% |
Likely homosexual households (counted as self-reported same-sex unmarried-partner households)
- Lesbian couples: 0.3% of all households
- Gay men: 0.4% of all households
| This place: | 3.2% |
| Whole state: | 10.6% |
| This place: | 2.7% |
| Whole state: | 4.6% |
For population 15 years and over in Northwest Snohomish:
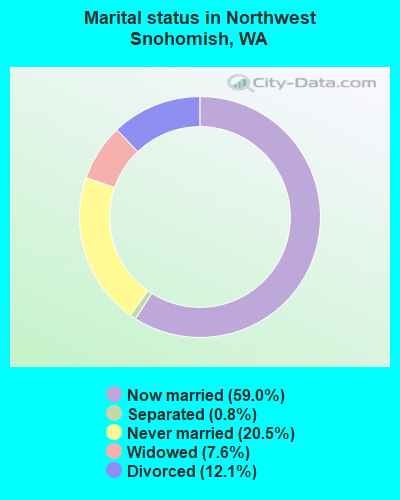
- Never married: 20.5%
- Now married: 59.0%
- Separated: 0.8%
- Widowed: 7.6%
- Divorced: 12.1%
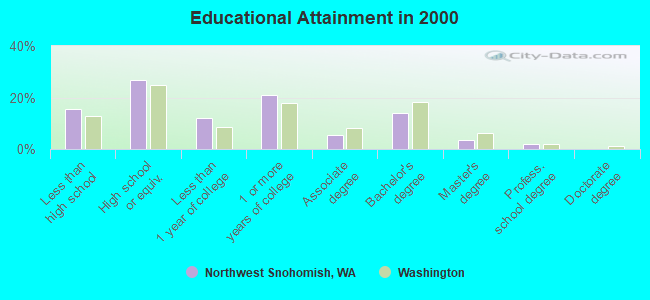
For population 25 years and over in Northwest Snohomish:
- High school or higher: 84.7%
- Bachelor's degree or higher: 19.4%
- Graduate or professional degree: 5.4%
- Unemployed: 5.3%
- Mean travel time to work (commute): 26.2 minutes
| Here: | 9.4 |
| Washington average: | 11.3 |
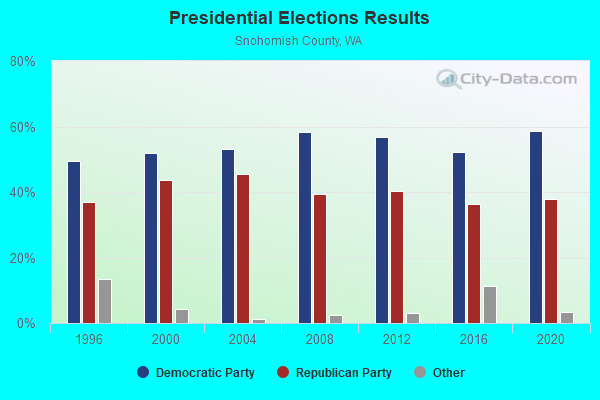
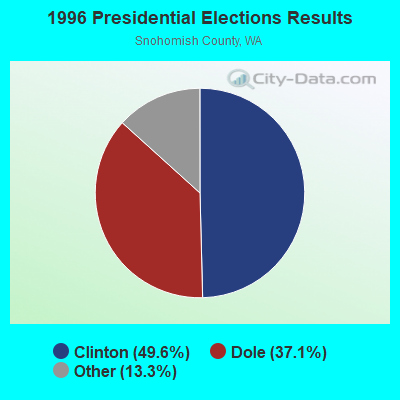
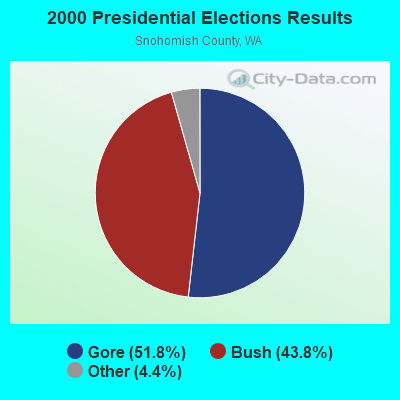
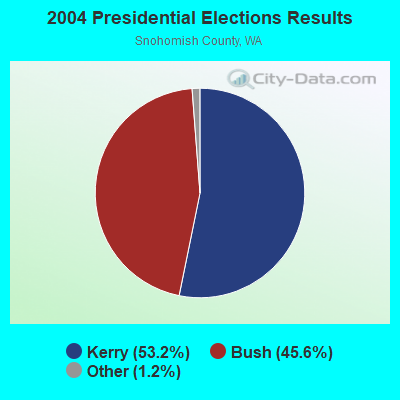
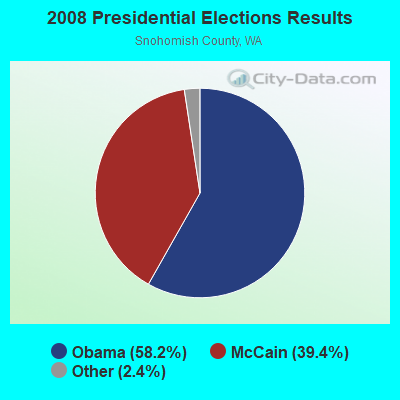

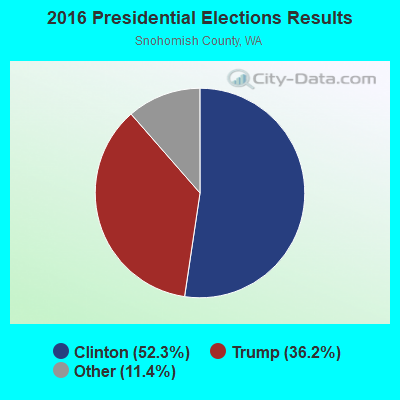
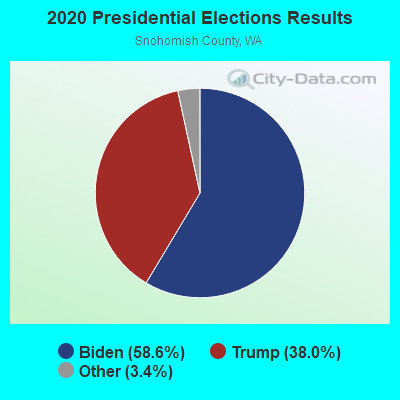
Graphs represent county-level data. Detailed 2008 Election Results
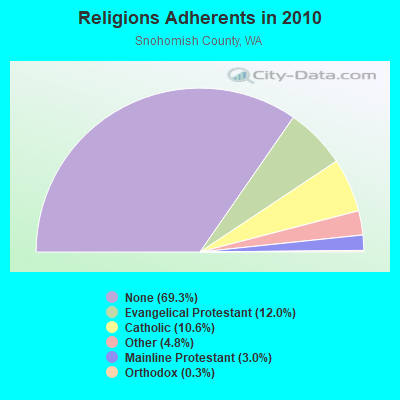
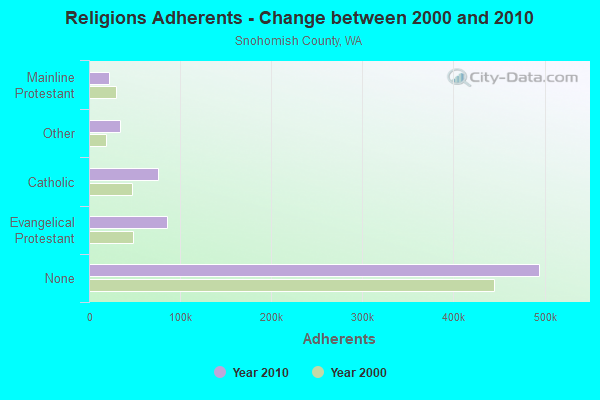
Religion statistics for Northwest Snohomish, WA (based on Snohomish County data)
| Religion | Adherents | Congregations |
|---|---|---|
| Evangelical Protestant | 85,354 | 327 |
| Catholic | 75,393 | 16 |
| Other | 34,270 | 90 |
| Mainline Protestant | 21,642 | 71 |
| Orthodox | 1,943 | 6 |
| Black Protestant | 406 | 4 |
| None | 494,327 | - |
Food Environment Statistics:
| Snohomish County: | 1.79 / 10,000 pop. |
| Washington: | 2.06 / 10,000 pop. |
| Snohomish County: | 0.18 / 10,000 pop. |
| Washington: | 0.19 / 10,000 pop. |
| Snohomish County: | 1.42 / 10,000 pop. |
| Washington: | 1.18 / 10,000 pop. |
| This county: | 2.55 / 10,000 pop. |
| State: | 2.67 / 10,000 pop. |
| Snohomish County: | 6.95 / 10,000 pop. |
| State: | 8.26 / 10,000 pop. |
| Here: | 7.5% |
| Washington: | 7.7% |
| Snohomish County: | 27.4% |
| State: | 25.7% |
| Snohomish County: | 14.3% |
| Washington: | 13.9% |
7.60% of this county's 2021 resident taxpayers lived in other counties in 2020 ($97,930 average adjusted gross income)
| Here: | 7.60% |
| Washington average: | 7.53% |
0.04% of residents moved from foreign countries ($285 average AGI)
Snohomish County: 0.04% Washington average: 0.05%
Top counties from which taxpayers relocated into this county between 2020 and 2021:
| from King County, WA | |
| from Pierce County, WA | |
| from Skagit County, WA |
7.20% of this county's 2020 resident taxpayers moved to other counties in 2021 ($85,049 average adjusted gross income)
| Here: | 7.20% |
| Washington average: | 7.40% |
0.02% of residents moved to foreign countries ($153 average AGI)
Snohomish County: 0.02% Washington average: 0.04%
Top counties to which taxpayers relocated from this county between 2020 and 2021:
| to King County, WA | |
| to Pierce County, WA | |
| to Skagit County, WA |
Strongest AM radio stations in Northwest Snohomish:
- KRKO (1380 AM; 50 kW; EVERETT, WA; Owner: S-R BROADCASTING, CO.)
- KIXI (880 AM; 50 kW; MERCER ISLAND/SEATTL, WA; Owner: BELLEVUE RADIO, INC.)
- KWYZ (1230 AM; 1 kW; EVERETT, WA; Owner: RADIO HANKOOK, INC.)
- KKOL (1300 AM; 50 kW; SEATTLE, WA; Owner: INSPIRATION MEDIA, INC.)
- KIRO (710 AM; 50 kW; SEATTLE, WA; Owner: ENTERCOM SEATTLE LICENSE, LLC)
- KGNW (820 AM; 50 kW; BURIEN-SEATTLE, WA; Owner: INSPIRATION MEDIA, INC.)
- KTTH (770 AM; 50 kW; SEATTLE, WA; Owner: ENTERCOM SEATTLE LICENSE, LLC)
- KOMO (1000 AM; 50 kW; SEATTLE, WA; Owner: FISHER BROADCASTING - SEATTLE RADIO, L.L.C.)
- KYCW (1090 AM; 50 kW; SEATTLE, WA; Owner: INFINITY RADIO SUBSIDIARY OPERATIONS INC.)
- KCIS (630 AM; 5 kW; EDMONDS, WA; Owner: CRISTA MINISTRIES)
- KJR (950 AM; 50 kW; SEATTLE, WA)
- KKNW (1150 AM; 10 kW; SEATTLE, WA; Owner: ORCA RADIO, INC.)
- KNWX (1210 AM; 28 kW; AUBURN-FEDERAL WAY, WA; Owner: ENTERCOM SEATTLE LICENSE, LLC)
Strongest FM radio stations in Northwest Snohomish:
- KSER (90.7 FM; EVERETT, WA; Owner: KSER FOUNDATION)
- KISW (99.9 FM; SEATTLE, WA; Owner: ENTERCOM SEATTLE LICENSE, LLC)
- K205DL (88.9 FM; GRANITE FALLS/EVERET, WA; Owner: CALVARY CHAPEL OF TWIN FALLS, INC.)
- KQBZ (100.7 FM; SEATTLE, WA; Owner: ENTERCOM SEATTLE LICENSE, LLC)
- KCMS (105.3 FM; EDMONDS, WA; Owner: CRISTA MINISTRIES, INC.)
- KMTT (103.7 FM; TACOMA, WA; Owner: ENTERCOM SEATTLE LICENSE, LLC)
- KNDD (107.7 FM; SEATTLE, WA; Owner: ENTERCOM SEATTLE LICENSE, LLC)
- KYPT (96.5 FM; SEATTLE, WA; Owner: INFINITY RADIO SUBSIDIARY OPERATIONS INC.)
- KBSG-FM (97.3 FM; TACOMA, WA; Owner: ENTERCOM SEATTLE LICENSE, LLC)
- KZOK-FM (102.5 FM; SEATTLE, WA; Owner: INFINITY RADIO SUBSIDIARY OPERATIONS INC.)
- KBKS (106.1 FM; TACOMA, WA; Owner: INFINITY RADIO SUBSIDIARY OPERATIONS INC.)
- KING-FM (98.1 FM; SEATTLE, WA; Owner: CLASSIC RADIO, INC.)
- KLSY-FM (92.5 FM; BELLEVUE, WA; Owner: BELLEVUE RADIO INC.)
- KPLU-FM (88.5 FM; TACOMA, WA; Owner: PACIFIC LUTHERAN UNIVERSITY, INC.)
- KWJZ (98.9 FM; SEATTLE, WA; Owner: ORCA RADIO, INC.)
- KMPS-FM (94.1 FM; SEATTLE, WA; Owner: INFINITY RADIO SUBSIDIARY OPERATIONS INC.)
- KRWM (106.9 FM; BREMERTON, WA; Owner: SEASCAPE RADIO, INC.)
- KJR-FM (95.7 FM; SEATTLE, WA; Owner: ACKERLEY MEDIA GROUP, INC.)
- KUBE (93.3 FM; SEATTLE, WA; Owner: ACKERLEY MEDIA GROUP, INC.)
- KPLZ-FM (101.5 FM; SEATTLE, WA; Owner: FISHER BROADCASTING - SEATTLE RADIO, L.L.C.)
TV broadcast stations around Northwest Snohomish:
- K29ED (Channel 29; EVERETT, WA; Owner: TRIBUNE TELEVISION HOLDINGS, INC.)
- KING-TV (Channel 5; SEATTLE, WA; Owner: KING BROADCASTING COMPANY)
- KSTW (Channel 11; TACOMA, WA; Owner: UPN TELEVISION STATIONS INC.)
- KTWB-TV (Channel 22; SEATTLE, WA; Owner: TRIBUNE TELEVISION HOLDINGS, INC.)
- K58DP (Channel 58; SEATTLE, WA; Owner: WORD OF GOD FELLOWSHIP, INC.)
- KOMO-TV (Channel 4; SEATTLE, WA; Owner: FISHER BROADCASTING - SEATTLE TV, L.L.C.)
- KIRO-TV (Channel 7; SEATTLE, WA; Owner: KIRO-TV HOLDINGS, INC.)
- KCTS-TV (Channel 9; SEATTLE, WA; Owner: KCTS TELEVISION)
- KHCV (Channel 45; SEATTLE, WA; Owner: NORTH PACIFIC INTERNATIONAL TELEVISION, INC.)
- KWPX (Channel 33; BELLEVUE, WA; Owner: PAXSON COMMUNICATIONS LICENSE COMPANY, LLC)
- K57HB (Channel 57; EUREKA, CA; Owner: MS COMMUNICATIONS, LLC)
- KONG-TV (Channel 16; EVERETT, WA; Owner: KONG-TV, INC.)
- KWDK (Channel 56; TACOMA, WA; Owner: PUGET SOUND EDUCATIONAL TV, INC.)
- KCPQ (Channel 13; TACOMA, WA; Owner: TRIBUNE TELEVISION NORTHWEST, INC.)
- K68DL (Channel 68; SEATTLE, WA; Owner: THREE ANGELS BROADCASTING NETWORK)
- K58BW (Channel 58; EVERETT, WA; Owner: KIRO-TV HOLDINGS, INC.)
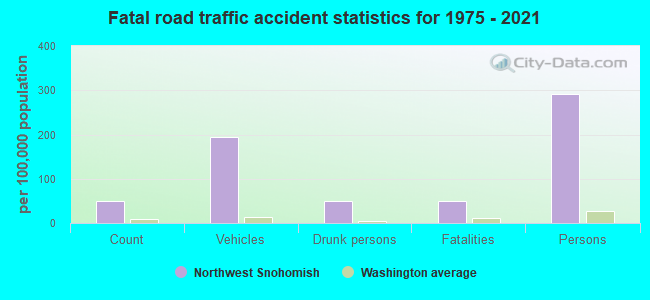
Northwest Snohomish fatal accident list:
- National Bridge Inventory (NBI) Statistics
- 3Number of bridges
- 43ft / 13.3mTotal length
- $7,051,000Total costs
- 55,592Total average daily traffic
- 3,669Total average daily truck traffic
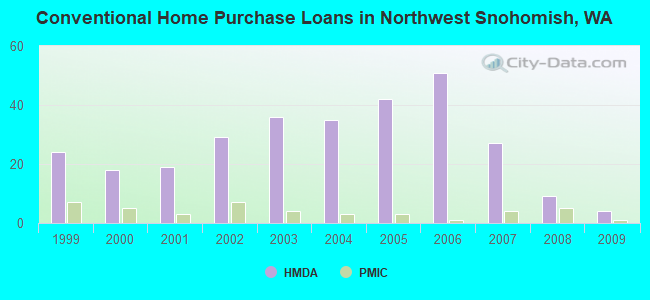
| Home Mortgage Disclosure Act Aggregated Statistics For Year 2009 (Based on 1 partial tract) | ||||||||||
| A) FHA, FSA/RHS & VA Home Purchase Loans | B) Conventional Home Purchase Loans | C) Refinancings | F) Non-occupant Loans on < 5 Family Dwellings (A B C & D) | G) Loans On Manufactured Home Dwelling (A B C & D) | ||||||
|---|---|---|---|---|---|---|---|---|---|---|
| Number | Average Value | Number | Average Value | Number | Average Value | Number | Average Value | Number | Average Value | |
| LOANS ORIGINATED | 5 | $294,104 | 4 | $294,585 | 56 | $251,830 | 1 | $282,990 | 0 | $0 |
| APPLICATIONS APPROVED, NOT ACCEPTED | 0 | $0 | 1 | $252,050 | 9 | $288,373 | 0 | $0 | 0 | $0 |
| APPLICATIONS DENIED | 1 | $201,060 | 0 | $0 | 17 | $282,027 | 1 | $214,430 | 1 | $229,900 |
| APPLICATIONS WITHDRAWN | 0 | $0 | 0 | $0 | 16 | $287,297 | 0 | $0 | 0 | $0 |
| FILES CLOSED FOR INCOMPLETENESS | 0 | $0 | 0 | $0 | 2 | $335,025 | 0 | $0 | 0 | $0 |
Detailed HMDA statistics for the following Tracts: 0525.02
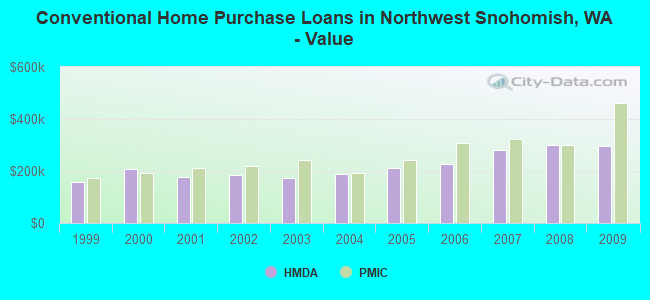
| Private Mortgage Insurance Companies Aggregated Statistics For Year 2009 (Based on 1 partial tract) | ||||
| A) Conventional Home Purchase Loans | B) Refinancings | |||
|---|---|---|---|---|
| Number | Average Value | Number | Average Value | |
| LOANS ORIGINATED | 1 | $461,470 | 1 | $294,270 |
| APPLICATIONS APPROVED, NOT ACCEPTED | 1 | $209,840 | 0 | $0 |
| APPLICATIONS DENIED | 0 | $0 | 0 | $0 |
| APPLICATIONS WITHDRAWN | 0 | $0 | 0 | $0 |
| FILES CLOSED FOR INCOMPLETENESS | 0 | $0 | 0 | $0 |
Detailed PMIC statistics for the following Tracts: 0525.02
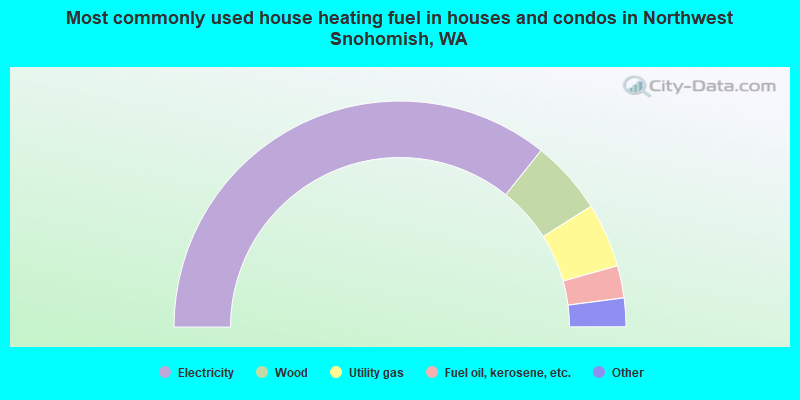
- 71.4%Electricity
- 10.6%Wood
- 9.2%Utility gas
- 4.6%Fuel oil, kerosene, etc.
- 2.4%Bottled, tank, or LP gas
- 1.7%Other fuel
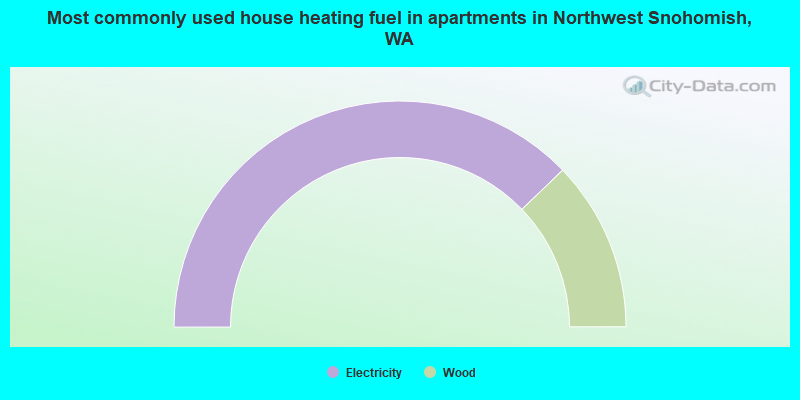
- 75.6%Electricity
- 24.4%Wood
Northwest Snohomish compared to Washington state average:
- Unemployed percentage below state average.
- Black race population percentage significantly below state average.
- Hispanic race population percentage significantly below state average.
- Median age above state average.
- Foreign-born population percentage significantly below state average.
- Renting percentage significantly below state average.
- Length of stay since moving in significantly above state average.
- Number of rooms per house significantly below state average.
- House age significantly below state average.