Ojai, California
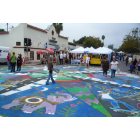
Ojai: Ojai Day, October street festival in downtown Ojai, CA
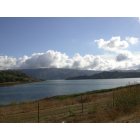
Ojai: Lake Casitas near Ojai, CA
Ojai
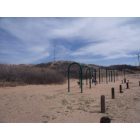
Ojai: Ojai International Garden of Peace
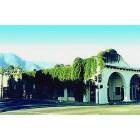
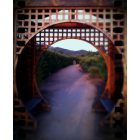
Ojai: Downtown Ojai
- add
your
Submit your own pictures of this city and show them to the world
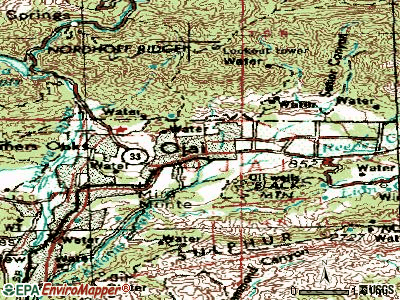
- OSM Map
- General Map
- Google Map
- MSN Map
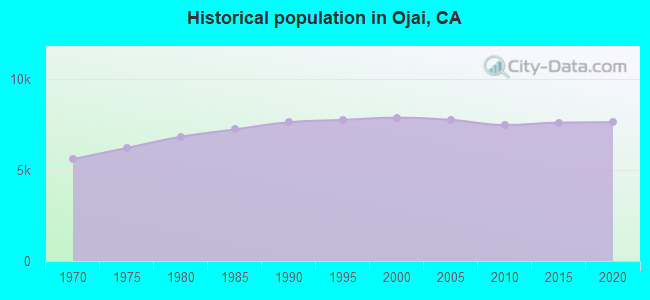
Population change since 2000: -4.1%
 |
| Males: 3,485 | |
| Females: 4,055 |
| Median resident age: | 51.4 years |
| California median age: | 37.9 years |
Zip codes: 93023.
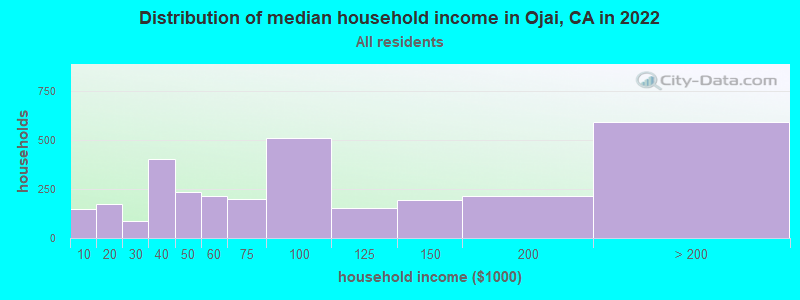
| Ojai: | $76,890 |
| CA: | $91,551 |
Estimated per capita income in 2022: $56,360 (it was $25,670 in 2000)
Ojai city income, earnings, and wages data
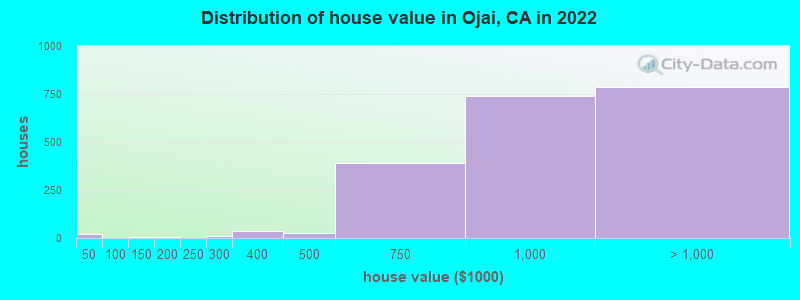
Estimated median house or condo value in 2022: $971,705 (it was $267,800 in 2000)
| Ojai: | $971,705 |
| CA: | $715,900 |
Mean prices in 2022: all housing units: $901,184; detached houses: $999,306; townhouses or other attached units: $610,170; in 2-unit structures: $496,599; in 3-to-4-unit structures: $548,973; in 5-or-more-unit structures: $472,197; mobile homes: $230,708; occupied boats, rvs, vans, etc.: $13,785
Median gross rent in 2022: $1,839.
(7.3% for White Non-Hispanic residents, 66.7% for Black residents, 7.0% for Hispanic or Latino residents, 4.3% for American Indian residents, 5.6% for other race residents, 7.1% for two or more races residents)
Detailed information about poverty and poor residents in Ojai, CA

Compare current foreclosures near Ojai, CA:
| Photo | Address | Area | Beds / Baths | Price | Details |
|---|---|---|---|---|---|

|
#1
S Padre Juan Ave
Ojai, CA 93023
|
1,057 sq. feet
|
1 baths 1 beds |
show details | |

|
#2
Walbridge Way
Ojai, CA 93023
|
2,138 sq. feet
|
2 baths 4 beds |
show details | |

|
#3
Drown Ave
Ojai, CA 93023
|
1,481 sq. feet
|
2 baths 4 beds |
show details | |

|
#4
Shady Ln
Ojai, CA 93023
|
1,180 sq. feet
|
1 baths 3 beds |
show details | |

|
#5
Maricopa Hwy # B-273
Ojai, CA 93023
|
- sq. feet
|
- baths - beds |
show details | |

|
#6
Felix Dr
Ojai, CA 93023
|
- sq. feet
|
- baths - beds |
show details | |

|
#7
Don Antonio Way
Ojai, CA 93023
|
- sq. feet
|
- baths - beds |
show details | |

|
#8
Center Ln
Santa Paula, CA 93060
|
1,250 sq. feet
|
2 baths 3 beds |
show details | |

|
#9
Entrada Dr
Oxnard, CA 93036
|
1,807 sq. feet
|
2 baths 4 beds |
show details | |

|
#10
Kumquat Pl
Oxnard, CA 93036
|
1,860 sq. feet
|
2 baths 5 beds |
show details |
| Photo | Address | Area | Beds / Baths | Price | Details |
|---|---|---|---|---|---|

|
#11
Colonia Ave Apt B
Oxnard, CA 93036
|
912 sq. feet
|
1 baths 2 beds |
show details | |

|
#12
Green River St
Oxnard, CA 93036
|
1,556 sq. feet
|
2 baths 4 beds |
show details | |

|
#13
Saratoga Ave Unit 1201
Ventura, CA 93003
|
1,250 sq. feet
|
2 baths 4 beds |
show details | |

|
#14
Sycamore St
Santa Paula, CA 93060
|
720 sq. feet
|
1 baths 2 beds |
show details | |

|
#15
Utica Ave
Ventura, CA 93004
|
1,354 sq. feet
|
2 baths 4 beds |
show details | |

|
#16
Upper Bay Dr
Oxnard, CA 93036
|
2,333 sq. feet
|
2 baths 4 beds |
show details | |

|
#17
Montgomery Ave
Ventura, CA 93004
|
1,577 sq. feet
|
2 baths 4 beds |
show details | |

|
#18
Tulare St
Ventura, CA 93004
|
1,634 sq. feet
|
2 baths 4 beds |
show details | |

|
#19
Holt St
Ventura, CA 93001
|
952 sq. feet
|
1 baths 2 beds |
show details | |

|
#20
Saratoga Ave Unit 1103
Ventura, CA 93003
|
873 sq. feet
|
1 baths 2 beds |
show details |
| Photo | Address | Area | Beds / Baths | Price | Details |
|---|---|---|---|---|---|

|
#21
Rhonda St
Oxnard, CA 93036
|
1,639 sq. feet
|
2 baths 3 beds |
show details | |

|
#22
Lemon Grove Ave
Ventura, CA 93003
|
1,584 sq. feet
|
2 baths 3 beds |
show details | |

|
#23
Apache Ave
Ventura, CA 93001
|
1,296 sq. feet
|
1 baths 3 beds |
show details | |

|
#24
Rhonda St
Oxnard, CA 93036
|
1,639 sq. feet
|
2 baths 3 beds |
show details | |

|
#25
Swift Ave
Ventura, CA 93003
|
1,908 sq. feet
|
2 baths 5 beds |
show details | |

|
#26
Barber Ln
Ventura, CA 93003
|
1,660 sq. feet
|
2 baths 3 beds |
show details | |

|
#27
Geranium Pl
Oxnard, CA 93036
|
1,000 sq. feet
|
2 baths 3 beds |
show details | |

|
#28
Sandberg Ln
Ventura, CA 93003
|
1,081 sq. feet
|
2 baths 2 beds |
show details | |

|
#29
Parrish St
Ventura, CA 93003
|
2,342 sq. feet
|
2 baths 4 beds |
show details | |

|
#30
Thoreau Ln
Ventura, CA 93003
|
777 sq. feet
|
1 baths 2 beds |
show details |
| Photo | Address | Area | Beds / Baths | Price | Details |
|---|---|---|---|---|---|

|
#31
Prieto St
Santa Paula, CA 93060
|
850 sq. feet
|
1 baths 2 beds |
show details | |

|
#32
Pavin Dr
Oxnard, CA 93036
|
3,149 sq. feet
|
3 baths 5 beds |
show details | |

|
#33
Raccoon Ct
Ventura, CA 93003
|
1,241 sq. feet
|
1 baths 3 beds |
show details | |

|
#34
Bernadette St
Oxnard, CA 93030
|
1,530 sq. feet
|
2 baths 3 beds |
show details | |

|
#35
Scoter Ave
Ventura, CA 93003
|
1,330 sq. feet
|
2 baths 3 beds |
show details | |

|
#36
Forest Park Blvd
Oxnard, CA 93036
|
2,385 sq. feet
|
3 baths 4 beds |
show details | |

|
#37
Primrose Dr
Ventura, CA 93001
|
1,054 sq. feet
|
2 baths 3 beds |
show details | |

|
#38
Moss Landing Blvd
Oxnard, CA 93036
|
999 sq. feet
|
2 baths 2 beds |
show details | |

|
#39
N Ventura Rd
Oxnard, CA 93036
|
1,375 sq. feet
|
2 baths 3 beds |
show details | |

|
#40
Primrose Dr
Ventura, CA 93001
|
1,066 sq. feet
|
2 baths 3 beds |
show details |
| Photo | Address | Area | Beds / Baths | Price | Details |
|---|---|---|---|---|---|

|
#41
Edison Dr
Ventura, CA 93001
|
1,176 sq. feet
|
1 baths 2 beds |
show details | |

|
#42
Salem Ave
Oxnard, CA 93036
|
1,152 sq. feet
|
2 baths 4 beds |
show details | |

|
#43
Cardinal St
Ventura, CA 93003
|
1,338 sq. feet
|
2 baths 4 beds |
show details | |

|
#44
Juneberry Pl
Oxnard, CA 93036
|
1,240 sq. feet
|
2 baths 3 beds |
show details | |

|
#45
Crowley Ave
Ventura, CA 93003
|
2,131 sq. feet
|
2 baths 4 beds |
show details | |

|
#46
Cardigan Ave
Ventura, CA 93004
|
1,240 sq. feet
|
2 baths 3 beds |
show details | |

|
#47
W Vineyard Ave
Oxnard, CA 93036
|
1,013 sq. feet
|
2 baths 2 beds |
show details | |

|
#48
Squirrel Ln
Ventura, CA 93003
|
1,182 sq. feet
|
1 baths 3 beds |
show details | |

|
#49
Pyramid Ave
Ventura, CA 93004
|
1,469 sq. feet
|
2 baths 4 beds |
show details | |

|
Check over 1 million property listings on Foreclosure.com!
|
browse all offers | |||


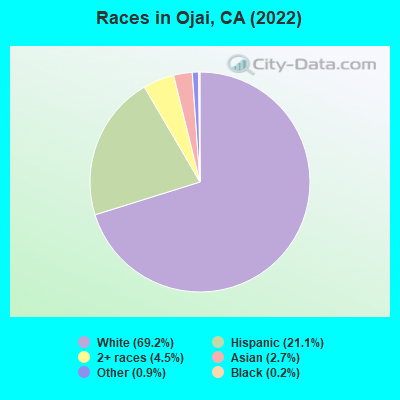
- 5,20769.2%White alone
- 1,58521.1%Hispanic
- 3384.5%Two or more races
- 2052.7%Asian alone
- 640.9%Other race alone
- 130.2%Black alone
According to our research of California and other state lists, there were 6 registered sex offenders living in Ojai, California as of April 23, 2024.
The ratio of all residents to sex offenders in Ojai is 1,273 to 1.
The ratio of registered sex offenders to all residents in this city is lower than the state average.
Type |
2009 |
2010 |
2011 |
2012 |
2013 |
2014 |
2015 |
2016 |
2017 |
2018 |
2019 |
2020 |
2022 |
|---|---|---|---|---|---|---|---|---|---|---|---|---|---|
| Murders (per 100,000) | 0 (0.0) | 0 (0.0) | 0 (0.0) | 0 (0.0) | 0 (0.0) | 0 (0.0) | 0 (0.0) | 0 (0.0) | 0 (0.0) | 0 (0.0) | 0 (0.0) | 0 (0.0) | 0 (0.0) |
| Rapes (per 100,000) | 3 (38.6) | 0 (0.0) | 2 (26.5) | 0 (0.0) | 4 (52.7) | 2 (26.3) | 0 (0.0) | 3 (39.2) | 2 (26.3) | 1 (13.2) | 5 (66.7) | 1 (13.4) | 1 (13.2) |
| Robberies (per 100,000) | 3 (38.6) | 1 (13.4) | 6 (79.5) | 1 (13.1) | 3 (39.6) | 1 (13.1) | 1 (13.0) | 1 (13.1) | 0 (0.0) | 3 (39.5) | 0 (0.0) | 1 (13.4) | 0 (0.0) |
| Assaults (per 100,000) | 11 (141.7) | 18 (241.3) | 17 (225.2) | 12 (157.7) | 7 (92.3) | 7 (92.0) | 6 (78.3) | 6 (78.3) | 2 (26.3) | 2 (26.3) | 3 (40.0) | 1 (13.4) | 3 (39.7) |
| Burglaries (per 100,000) | 38 (489.4) | 31 (415.5) | 32 (423.9) | 24 (315.5) | 15 (197.8) | 20 (262.9) | 15 (195.7) | 14 (182.8) | 11 (144.7) | 12 (158.0) | 15 (200.0) | 19 (254.4) | 15 (198.3) |
| Thefts (per 100,000) | 157 (2,022) | 128 (1,716) | 136 (1,802) | 133 (1,748) | 80 (1,055) | 94 (1,236) | 49 (639.3) | 44 (574.6) | 33 (434.0) | 50 (658.2) | 56 (746.8) | 81 (1,084) | 53 (700.5) |
| Auto thefts (per 100,000) | 2 (25.8) | 4 (53.6) | 3 (39.7) | 5 (65.7) | 8 (105.5) | 6 (78.9) | 2 (26.1) | 5 (65.3) | 1 (13.2) | 6 (79.0) | 3 (40.0) | 6 (80.3) | 4 (52.9) |
| Arson (per 100,000) | 2 (25.8) | 1 (13.4) | 0 (0.0) | 1 (13.1) | 2 (26.4) | 0 (0.0) | 0 (0.0) | 0 (0.0) | 0 (0.0) | 1 (13.2) | 1 (13.3) | 0 (0.0) | 1 (13.2) |
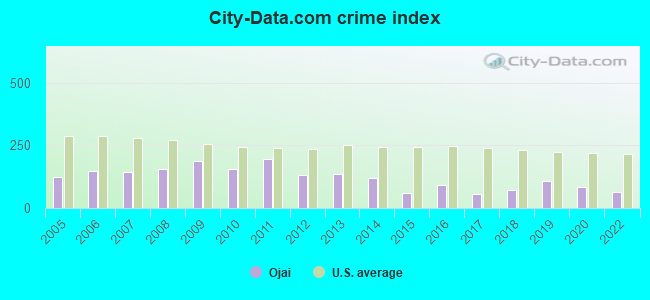
| City-Data.com crime index | 188.0 | 154.3 | 195.0 | 132.8 | 137.0 | 117.5 | 60.9 | 91.9 | 54.8 | 71.3 | 108.4 | 85.0 | 64.6 |
The City-Data.com crime index weighs serious crimes and violent crimes more heavily. Higher means more crime, U.S. average is 246.1. It adjusts for the number of visitors and daily workers commuting into cities.
Crime rate in Ojai detailed stats: murders, rapes, robberies, assaults, burglaries, thefts, arson
Full-time law enforcement employees in 2015, including police officers: 1 (1 officers - 1 male; 0 female).
| Officers per 1,000 residents here: | 0.13 |
| California average: | 1.98 |
 Recent articles from our blog. Our writers, many of them Ph.D. graduates or candidates, create easy-to-read articles on a wide variety of topics.

 | Shaking in Ojai! (2 replies) |
| Moving to Ojai. Can we live in our RV until a home can be built on owned property? (3 replies) |
| Looking for quiet place in Ventura (9 replies) |
| Retiring in Ojai (3 replies) |
| Mira Monte Neighborhood in Ojai? (0 replies) |
| Question for tennis enthusiasts (8 replies) |
Latest news from Ojai, CA collected exclusively by city-data.com from local newspapers, TV, and radio stations
Ancestries: American (17.5%), European (8.1%), English (5.8%), Irish (3.5%), Italian (3.3%), Polish (3.1%).
Current Local Time: PST time zone
Elevation: 746 feet
Land area: 4.43 square miles.
Population density: 1,700 people per square mile (low).
1,301 residents are foreign born (11.0% Latin America, 3.1% Asia).
| This city: | 17.3% |
| California: | 26.5% |
Median real estate property taxes paid for housing units with mortgages in 2022: $8,260 (0.8%)
Median real estate property taxes paid for housing units with no mortgage in 2022: $5,938 (0.7%)
Nearest city with pop. 50,000+: Ventura, CA  (11.5 miles , pop. 106,197).
Nearest city with pop. 200,000+: Los Angeles, CA (55.7 miles , pop. 3,694,820).
Nearest cities:
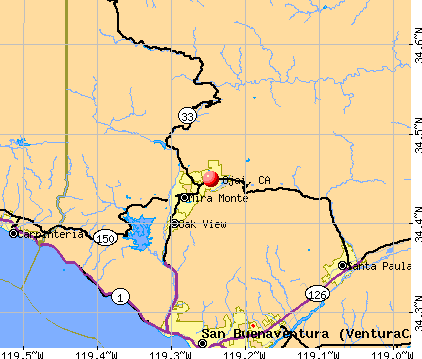
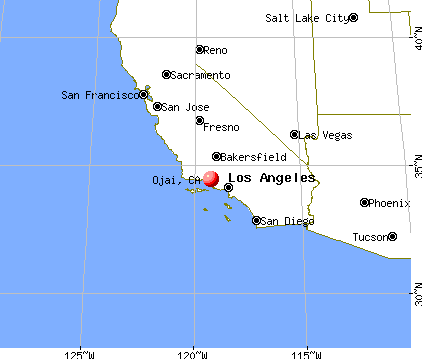
), ), ), ), )Latitude: 34.45 N, Longitude: 119.25 W
Daytime population change due to commuting: +2,332 (+31.0%)
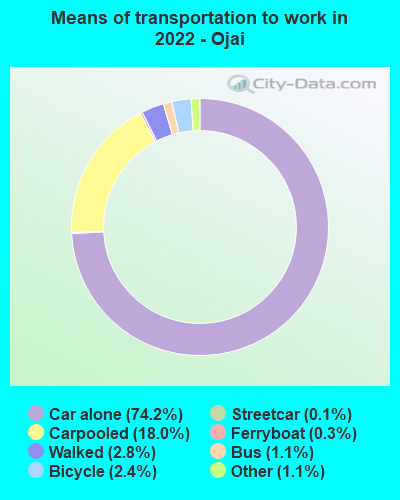
Workers who live and work in this city: 1,375 (43.7%)
Area code: 805
Ojai tourist attractions:
Ojai, California accommodation & food services, waste management - Economy and Business Data
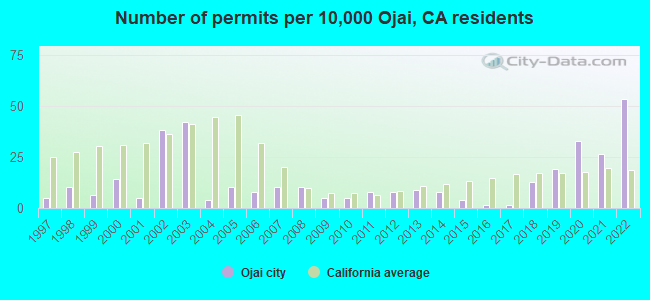
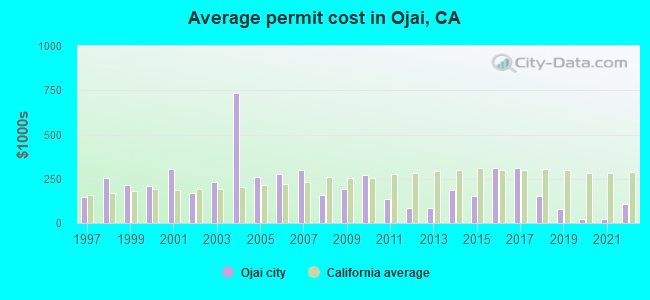
Single-family new house construction building permits:
- 2022: 42 buildings, average cost: $110,400
- 2021: 21 buildings, average cost: $23,300
- 2020: 26 buildings, average cost: $20,600
- 2019: 15 buildings, average cost: $78,600
- 2018: 10 buildings, average cost: $152,200
- 2017: 1 building, cost: $313,300
- 2016: 1 building, cost: $313,300
- 2015: 3 buildings, average cost: $152,000
- 2014: 6 buildings, average cost: $185,600
- 2013: 7 buildings, average cost: $81,600
- 2012: 6 buildings, average cost: $81,500
- 2011: 6 buildings, average cost: $133,700
- 2010: 4 buildings, average cost: $273,400
- 2009: 4 buildings, average cost: $191,200
- 2008: 8 buildings, average cost: $160,200
- 2007: 8 buildings, average cost: $298,300
- 2006: 6 buildings, average cost: $277,400
- 2005: 8 buildings, average cost: $259,400
- 2004: 3 buildings, average cost: $733,300
- 2003: 33 buildings, average cost: $231,900
- 2002: 30 buildings, average cost: $167,300
- 2001: 4 buildings, average cost: $302,900
- 2000: 11 buildings, average cost: $208,500
- 1999: 5 buildings, average cost: $216,800
- 1998: 8 buildings, average cost: $255,700
- 1997: 4 buildings, average cost: $147,800
| Here: | 4.7% |
| California: | 5.1% |
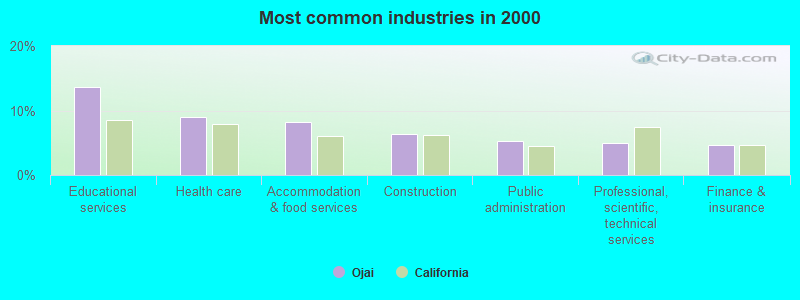
- Educational services (13.7%)
- Health care (9.0%)
- Accommodation & food services (8.2%)
- Construction (6.4%)
- Public administration (5.3%)
- Professional, scientific, technical services (5.0%)
- Finance & insurance (4.7%)
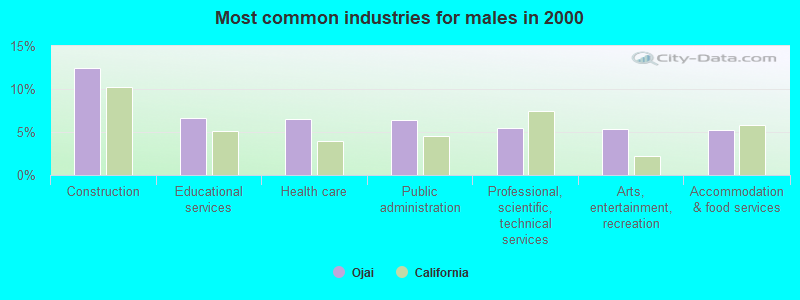
- Construction (12.4%)
- Educational services (6.6%)
- Health care (6.5%)
- Public administration (6.3%)
- Professional, scientific, technical services (5.5%)
- Arts, entertainment, recreation (5.4%)
- Accommodation & food services (5.2%)
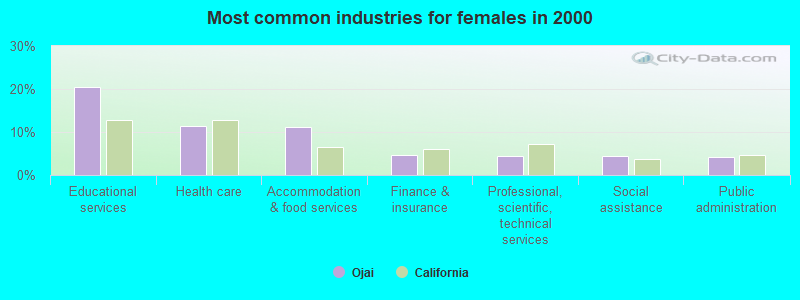
- Educational services (20.4%)
- Health care (11.4%)
- Accommodation & food services (11.1%)
- Finance & insurance (4.7%)
- Professional, scientific, technical services (4.5%)
- Social assistance (4.4%)
- Public administration (4.3%)
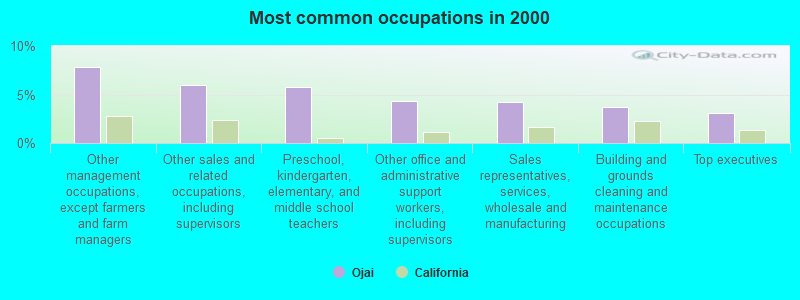
- Other management occupations, except farmers and farm managers (7.8%)
- Other sales and related occupations, including supervisors (5.9%)
- Preschool, kindergarten, elementary, and middle school teachers (5.8%)
- Other office and administrative support workers, including supervisors (4.4%)
- Sales representatives, services, wholesale and manufacturing (4.2%)
- Building and grounds cleaning and maintenance occupations (3.7%)
- Top executives (3.1%)
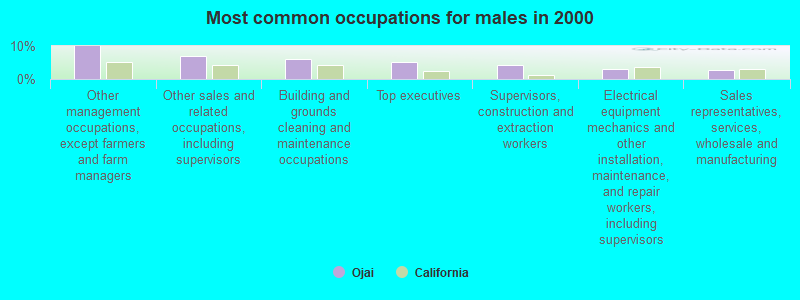
- Other management occupations, except farmers and farm managers (9.9%)
- Other sales and related occupations, including supervisors (7.1%)
- Building and grounds cleaning and maintenance occupations (6.1%)
- Top executives (5.2%)
- Supervisors, construction and extraction workers (4.1%)
- Electrical equipment mechanics and other installation, maintenance, and repair workers, including supervisors (3.1%)
- Sales representatives, services, wholesale and manufacturing (2.6%)
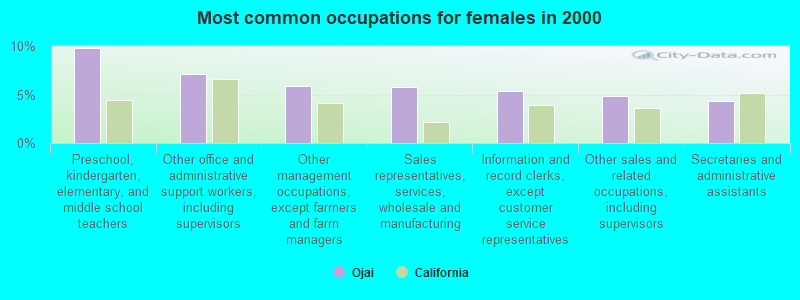
- Preschool, kindergarten, elementary, and middle school teachers (9.7%)
- Other office and administrative support workers, including supervisors (7.1%)
- Other management occupations, except farmers and farm managers (5.8%)
- Sales representatives, services, wholesale and manufacturing (5.8%)
- Information and record clerks, except customer service representatives (5.4%)
- Other sales and related occupations, including supervisors (4.8%)
- Secretaries and administrative assistants (4.3%)
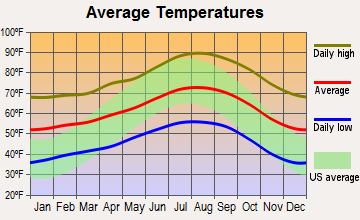
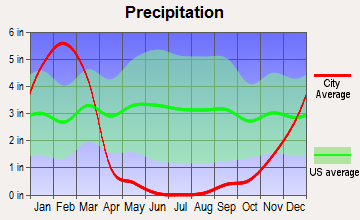
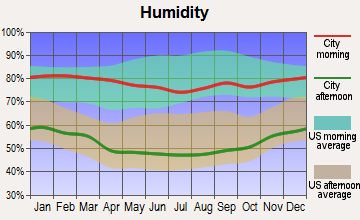
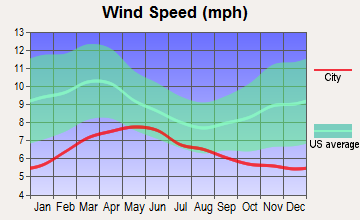
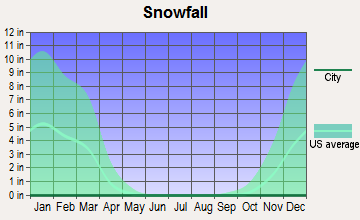
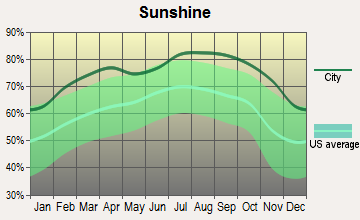
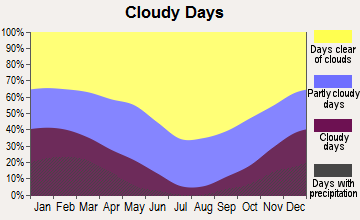
Average climate in Ojai, California
Based on data reported by over 4,000 weather stations
|
|

(lower is better)
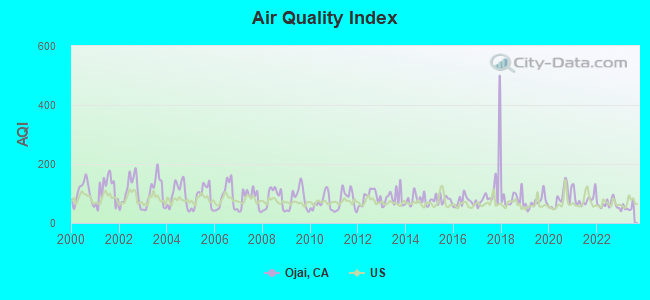
Air Quality Index (AQI) level in 2023 was 52.5. This is better than average.
| City: | 52.5 |
| U.S.: | 72.6 |
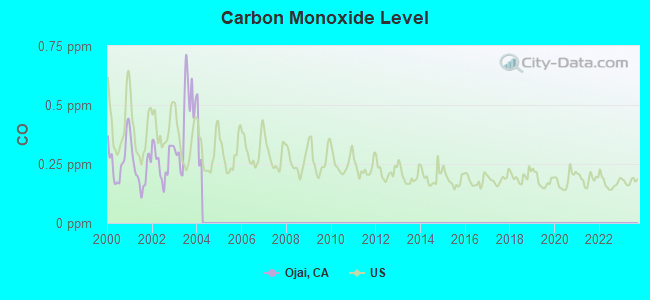
Carbon Monoxide (CO) [ppm] level in 2003 was 0.432. This is significantly worse than average. Closest monitor was 0.2 miles away from the city center.
| City: | 0.432 |
| U.S.: | 0.251 |
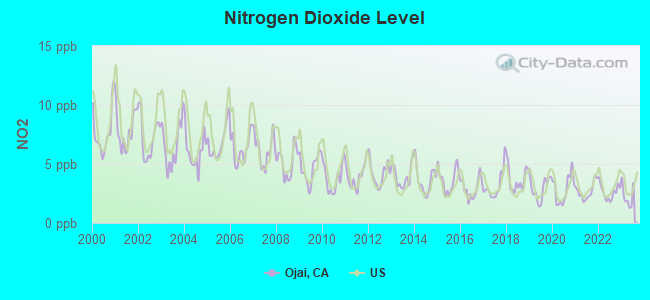
Nitrogen Dioxide (NO2) [ppb] level in 2023 was 2.27. This is significantly better than average. Closest monitor was 0.2 miles away from the city center.
| City: | 2.27 |
| U.S.: | 5.11 |
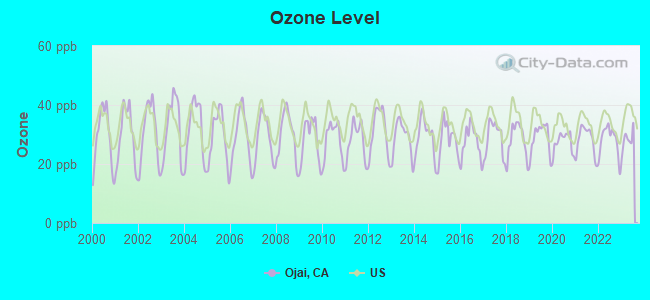
Ozone [ppb] level in 2023 was 28.1. This is about average. Closest monitor was 0.2 miles away from the city center.
| City: | 28.1 |
| U.S.: | 33.3 |
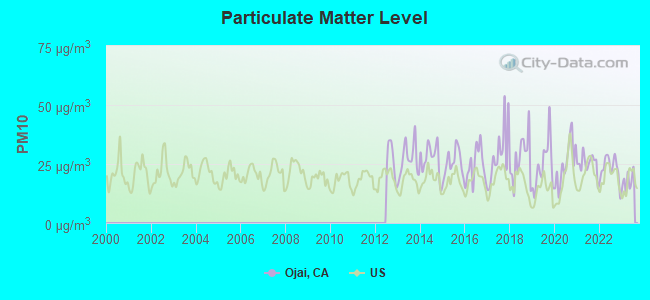
Particulate Matter (PM10) [µg/m3] level in 2023 was 17.8. This is about average. Closest monitor was 0.9 miles away from the city center.
| City: | 17.8 |
| U.S.: | 19.2 |
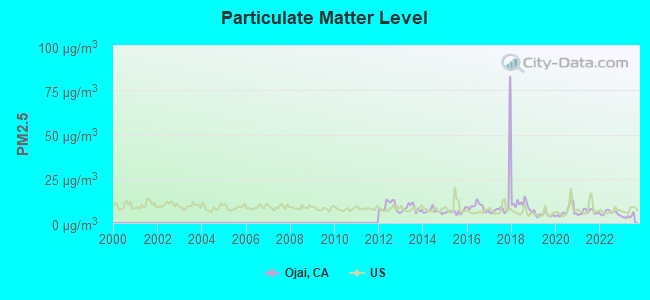
Particulate Matter (PM2.5) [µg/m3] level in 2023 was 3.81. This is significantly better than average. Closest monitor was 0.9 miles away from the city center.
| City: | 3.81 |
| U.S.: | 8.11 |
Earthquake activity:
Ojai-area historical earthquake activity is significantly above California state average. It is 6865% greater than the overall U.S. average.On 7/21/1952 at 11:52:14, a magnitude 7.7 (7.7 UK, Class: Major, Intensity: VIII - XII) earthquake occurred 40.6 miles away from Ojai center, causing $50,000,000 total damage
On 11/4/1927 at 13:51:53, a magnitude 7.5 (7.5 UK) earthquake occurred 106.5 miles away from Ojai center
On 6/28/1992 at 11:57:34, a magnitude 7.6 (6.2 MB, 7.6 MS, 7.3 MW, Depth: 0.7 mi) earthquake occurred 156.2 miles away from the city center, causing 3 deaths (1 shaking deaths, 2 other deaths) and 400 injuries, causing $100,000,000 total damage and $40,000,000 insured losses
On 10/16/1999 at 09:46:44, a magnitude 7.4 (6.3 MB, 7.4 MS, 7.2 MW, 7.3 ML) earthquake occurred 160.4 miles away from Ojai center
On 1/17/1994 at 12:30:55, a magnitude 6.8 (6.4 MB, 6.8 MS, 6.7 MW, Depth: 11.4 mi, Class: Strong, Intensity: VII - IX) earthquake occurred 43.4 miles away from the city center, causing 60 deaths (60 shaking deaths) and 7000 injuries
On 4/18/1906 at 13:12:21, a magnitude 7.9 (7.9 UK) earthquake occurred 322.7 miles away from Ojai center, causing $524,000,000 total damage
Magnitude types: body-wave magnitude (MB), local magnitude (ML), surface-wave magnitude (MS), moment magnitude (MW)
Natural disasters:
The number of natural disasters in Ventura County (36) is a lot greater than the US average (15).Major Disasters (Presidential) Declared: 24
Emergencies Declared: 2
Causes of natural disasters: Fires: 17, Floods: 16, Storms: 10, Landslides: 5, Mudslides: 4, Winter Storms: 4, Freezes: 2, Heavy Rains: 2, Earthquake: 1, Hurricane: 1, Snow: 1, Tornado: 1, Wind: 1, Other: 1 (Note: some incidents may be assigned to more than one category).
Hospitals and medical centers in Ojai:
Heliports located in Ojai:
Amtrak stations near Ojai:
- 13 miles: VENTURA (HARBOR BLVD. & FIGUEROA ST.) . Services: public payphones, call for taxi service.
- 13 miles: SANTA PAULA (245 S. PALM AVE.) - Bus Station . Services: fully wheelchair accessible, public payphones, full-service food facilities, public transit connection.
- 17 miles: CARPINTERIA (5TH ST. & LINDEN AVE.) . Services: fully wheelchair accessible, public payphones, full-service food facilities, free short-term parking, free long-term parking, call for taxi service.
Colleges/universities with over 2000 students nearest to Ojai:
- Ventura College (about 12 miles; Ventura, CA; Full-time enrollment: 8,460)
- Oxnard College (about 21 miles; Oxnard, CA; FT enrollment: 3,879)
- California State University-Channel Islands (about 23 miles; Camarillo, CA; FT enrollment: 4,163)
- Moorpark College (about 26 miles; Moorpark, CA; FT enrollment: 9,338)
- Santa Barbara City College (about 26 miles; Santa Barbara, CA; FT enrollment: 12,568)
- California Lutheran University (about 27 miles; Thousand Oaks, CA; FT enrollment: 4,103)
- University of California-Santa Barbara (about 35 miles; Santa Barbara, CA; FT enrollment: 22,806)
Public high schools in Ojai:
- NORDHOFF HIGH (Students: 712, Location: 1401 MARICOPA HWY., Grades: 9-12)
- VALLEY OAK CHARTER (Students: 51, Location: 907 EL CENTRO ST., Grades: KG-12, Charter school)
- CHAPARRAL HIGH (Students: 13, Location: 114 N. MONTGOMERY, Grades: 9-12)
Private high schools in Ojai:
- OAK MEADOW (Students: 564, Location: 885 OAKWOOD ST, Grades: KG-12)
- VILLANOVA PREPARATORY SCHOOL (Students: 280, Location: 12096 N VENTURA AVE, Grades: 9-12)
- THE THACHER SCHOOL (Students: 256, Location: 5025 THACHER RD, Grades: 9-12)
- OAK GROVE SCHOOL (Students: 194, Location: 220 W LOMITA AVE, Grades: PK-12)
- BESANT HILL SCHOOL OF HAPPY VALLEY (Students: 101, Location: 8585 OJAI - SANTA PAULA RD, Grades: 9-12)
- ST MONICA'S SCHOOL (Students: 6, Location: 214 FAIRVIEW RD, Grades: 1-11)
Public elementary/middle schools in Ojai:
- MATILIJA JUNIOR HIGH (Students: 516, Location: 703 EL PASEO RD., Grades: 7-8)
- TOPA TOPA ELEMENTARY (Students: 304, Location: 916 MOUNTAIN VIEW AVE., Grades: KG-6)
- MIRA MONTE ELEMENTARY (Students: 272, Location: 1216 LOMA DR., Grades: KG-6)
- MEINERS OAKS ELEMENTARY (Students: 251, Location: 400 S. LOMITA AVE., Grades: KG-6)
- SAN ANTONIO ELEMENTARY (Students: 126, Location: 650 CARNE RD., Grades: KG-6)
- SUMMIT ELEMENTARY (Students: 37, Location: 12525 OJAI/SANTA PAULA RD., Grades: 1-6)
Private elementary/middle schools in Ojai:
User-submitted facts and corrections:
- Ojai is one of the best small towns anywhere in California. This gem of a town has only 8200 residents and is filled with great restaurants, spas, shops, art galleries and is surrounded by the majestic Topa Topa mountains. If you like a small town feel with lots to do, Ojai is your place. There are many renowned festivals including the Ojai Music Festival, the Ojai Playwrights Conference, The Ojai Wine Festival, and the Ojai Lavendar Festival to name just a few. Between March and October there is something happening almost every weekend. You will never be in short supply of things to do here. Cooking classes, art classes, music concerts, theatre, and gorgeous hiking and biking trails are all plentiful in Ojai. And most importantly, the people in Ojai are warm, friendly, and very caring of their neighbors and fellow community members. I feel blessed to have found Ojai. added by Ojai Gal
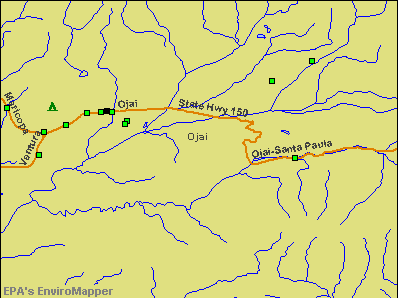
Points of interest:
Notable locations in Ojai: Soule Golf Course (A), Ojai District Ranger Station (B), Ojai Country Club (C), Ojai Valley Historical Museum (D), Ojai Valley Chamber of Commerce (E), Ojai Valley Center for the Arts (F), Ojai Unified School District Office (G), Ojai Community Center (H), Ojai City Hall (I), Ojai Branch Ventura County Library (J), Ventura County Fire Protection District Station 21 Ojai (K). Display/hide their locations on the map
Shopping Centers: The Arcade Shopping Center (1), Ojai Valley Shopping Center (2). Display/hide their locations on the map
Churches in Ojai include: The Church of Jesus Christ of Latter Day Saints (A), Friends Worship (B), Ojai Presbyterian Church (C), Ojai Valley Foursquare Church (D), Ojai United Methodist Church (E), Saint Andrews Episcopal Church (F), Science of Mind Church (G), Unitarian Universalist Fellowship of the Ojai Valley (H), First Church of Christ Scientist (I). Display/hide their locations on the map
Cemetery: Nordhoff Cemetery (1). Display/hide its location on the map
Creek: Thacher Creek (A). Display/hide its location on the map
Parks in Ojai include: Soule Recreation Area (1), Daly Ranch Park (2), Libbey Park (3), Sarzotti Park (4). Display/hide their locations on the map
Hotels: Best Western Casa Ojai (1302 East Ojai Avenue), Blue Iguana Inn (11794 North Ventura Avenue).
Birthplace of: Larry Linville - (1939-2000), actor, Cory Coffey - Bicycle motocross rider.
Drinking water stations with addresses in Ojai and their reported violations in the past:
CONSERVATION ENDOWMENT FUND (Population served: 100, Groundwater):Past monitoring violations:
- 2 routine major monitoring violations
| This city: | 2.3 people |
| California: | 2.9 people |
| This city: | 60.8% |
| Whole state: | 68.7% |
| This city: | 5.7% |
| Whole state: | 7.2% |
Likely homosexual households (counted as self-reported same-sex unmarried-partner households)
- Lesbian couples: 0.5% of all households
- Gay men: 0.3% of all households
People in group quarters in Ojai in 2010:
- 132 people in nursing facilities/skilled-nursing facilities
- 13 people in workers' group living quarters and job corps centers
- 12 people in other noninstitutional facilities
- 9 people in residential treatment centers for adults
- 8 people in emergency and transitional shelters (with sleeping facilities) for people experiencing homelessness
- 6 people in group homes intended for adults
People in group quarters in Ojai in 2000:
- 99 people in nursing homes
- 50 people in other noninstitutional group quarters
- 35 people in other group homes
- 6 people in residential treatment centers for emotionally disturbed children
Banks with branches in Ojai (2011 data):
- Wells Fargo Bank, National Association: Ojai Branch at 202 East Matilija Street, branch established on 1979/08/06. Info updated 2011/04/05: Bank assets: $1,161,490.0 mil, Deposits: $905,653.0 mil, headquarters in Sioux Falls, SD, positive income, 6395 total offices, Holding Company: Wells Fargo & Company
- Bank of America, National Association: Ojai Branch at 205 West Ojai Avenue, branch established on 1960/09/26. Info updated 2009/11/18: Bank assets: $1,451,969.3 mil, Deposits: $1,077,176.8 mil, headquarters in Charlotte, NC, positive income, 5782 total offices, Holding Company: Bank Of America Corporation
- Pacific Western Bank: Ojai Branch at 110 South Ventura Street, branch established on 2003/06/30. Info updated 2011/03/14: Bank assets: $5,513.1 mil, Deposits: $4,614.5 mil, headquarters in Los Angeles, CA, positive income, Commercial Lending Specialization, 78 total offices, Holding Company: Capgen Capital Group Ii Lp
- Rabobank, National Association: Ojai Valley Bank Branch at 1207 Maricopa Road, branch established on 1973/03/30. Info updated 2011/01/27: Bank assets: $11,745.0 mil, Deposits: $8,446.0 mil, headquarters in Roseville, CA, positive income, Agricultural Specialization, 124 total offices, Holding Company: Cooperatieve Centrale Raiffeisen-Boerenleenbank B.A., "rabobank Nederland
- JPMorgan Chase Bank, National Association: Ojai Branch at 1215 Maricopa Road, branch established on 1934/11/01. Info updated 2011/11/10: Bank assets: $1,811,678.0 mil, Deposits: $1,190,738.0 mil, headquarters in Columbus, OH, positive income, International Specialization, 5577 total offices, Holding Company: Jpmorgan Chase & Co.
- Ojai Community Bank: at 402 West Ojai Avenue, branch established on 2005/03/03. Info updated 2009/09/28: Bank assets: $128.3 mil, Deposits: $114.3 mil, local headquarters, positive income, Commercial Lending Specialization, 3 total offices
For population 15 years and over in Ojai:
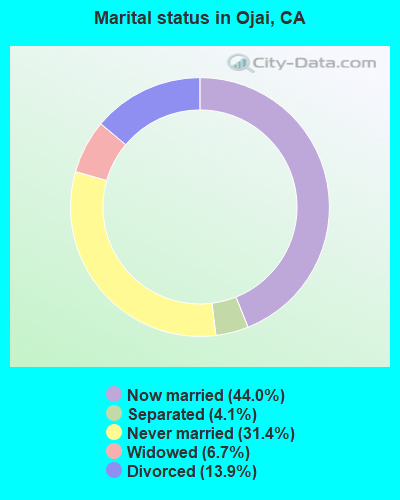
- Never married: 31.4%
- Now married: 44.0%
- Separated: 4.1%
- Widowed: 6.7%
- Divorced: 13.9%
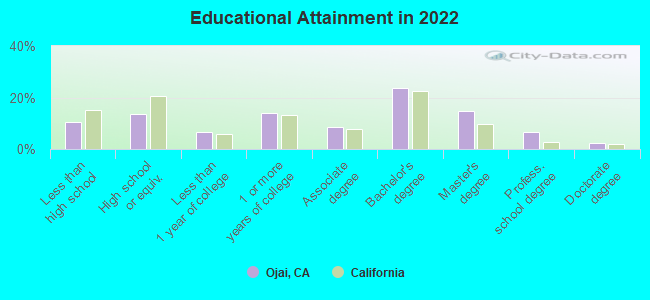
For population 25 years and over in Ojai:
- High school or higher: 89.6%
- Bachelor's degree or higher: 43.1%
- Graduate or professional degree: 21.1%
- Unemployed: 6.9%
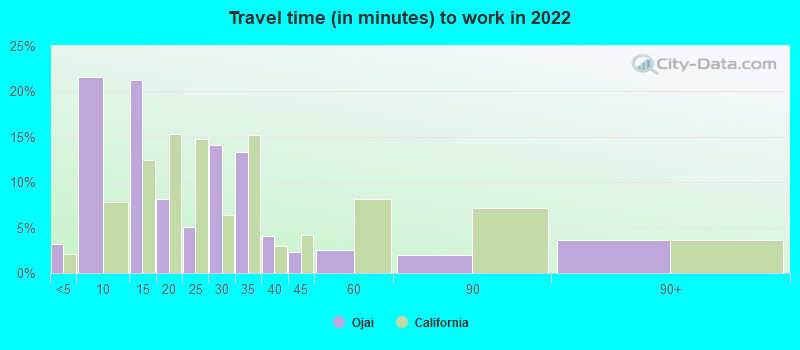
- Mean travel time to work (commute): 20.0 minutes
| Here: | 13.9 |
| California average: | 15.5 |
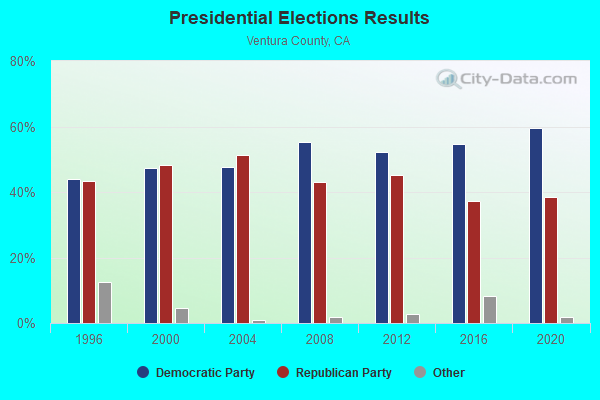
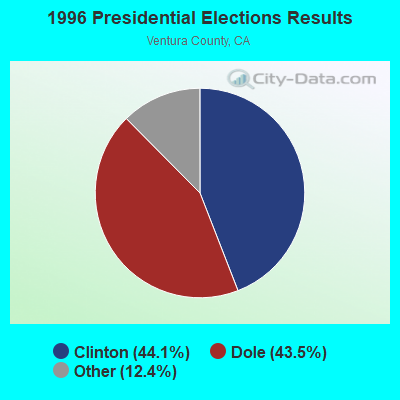
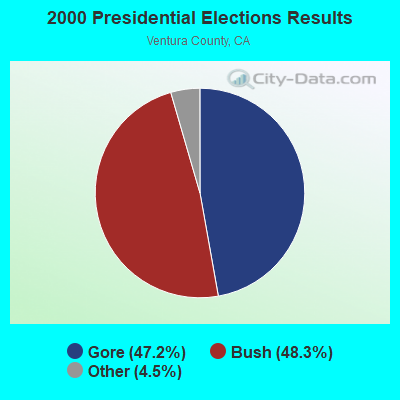
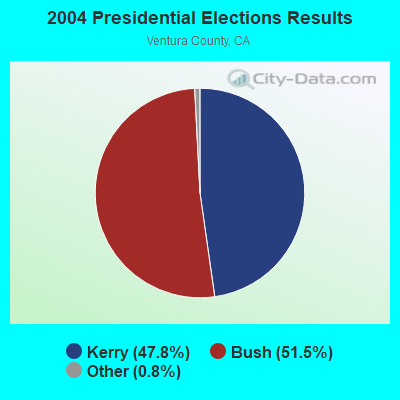
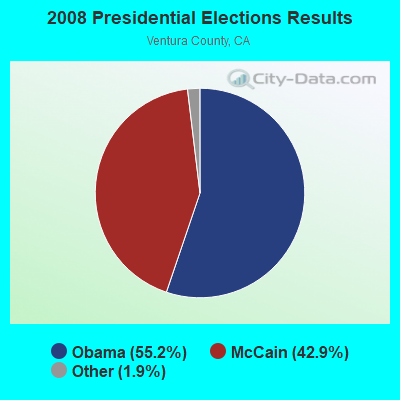
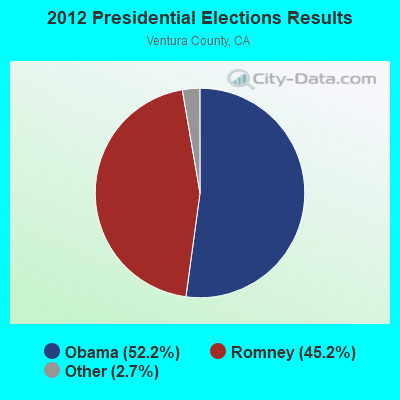
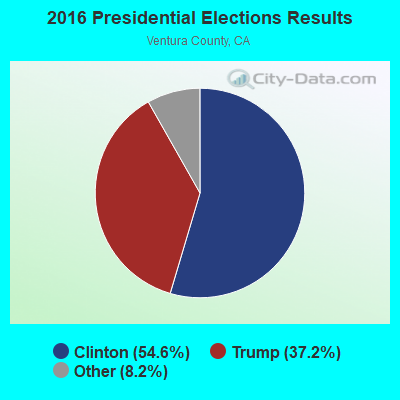
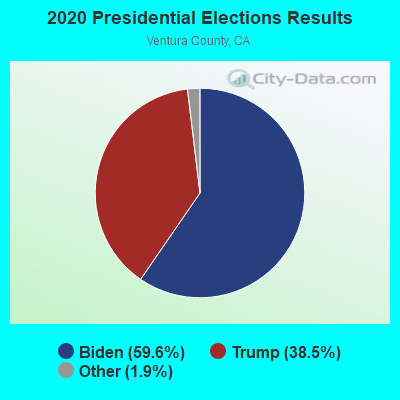
Graphs represent county-level data. Detailed 2008 Election Results
Religion statistics for Ojai, CA (based on Ventura County data)
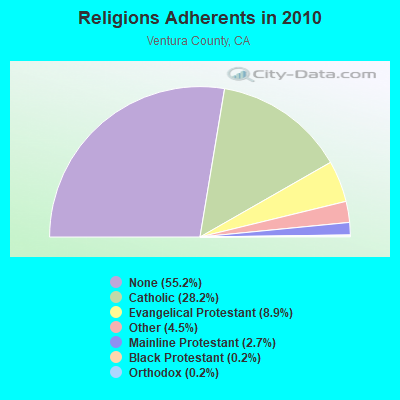
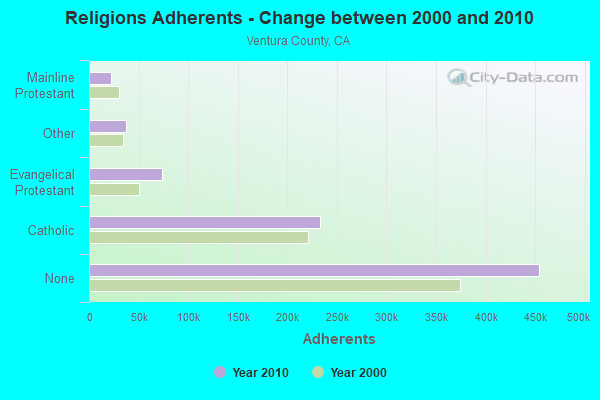
| Religion | Adherents | Congregations |
|---|---|---|
| Catholic | 232,571 | 20 |
| Evangelical Protestant | 73,341 | 268 |
| Other | 37,398 | 118 |
| Mainline Protestant | 22,006 | 65 |
| Black Protestant | 1,986 | 4 |
| Orthodox | 1,680 | 7 |
| None | 454,336 | - |
Food Environment Statistics:
| Ventura County: | 1.97 / 10,000 pop. |
| State: | 2.14 / 10,000 pop. |
| Ventura County: | 0.05 / 10,000 pop. |
| California: | 0.04 / 10,000 pop. |
| This county: | 0.57 / 10,000 pop. |
| California: | 0.62 / 10,000 pop. |
| This county: | 1.69 / 10,000 pop. |
| California: | 1.49 / 10,000 pop. |
| Ventura County: | 7.28 / 10,000 pop. |
| State: | 7.42 / 10,000 pop. |
| Ventura County: | 7.4% |
| California: | 7.3% |
| This county: | 23.1% |
| California: | 21.3% |
| This county: | 19.0% |
| State: | 17.9% |
Health and Nutrition:
| Here: | 51.3% |
| California: | 49.4% |
| Ojai: | 49.6% |
| California: | 48.0% |
| Ojai: | 28.5 |
| State: | 28.1 |
| Ojai: | 20.8% |
| California: | 20.2% |
| Ojai: | 9.3% |
| California: | 11.2% |
| Ojai: | 6.9 |
| California: | 6.8 |
| This city: | 34.7% |
| California: | 31.5% |
| Ojai: | 56.6% |
| California: | 56.4% |
| This city: | 78.0% |
| State: | 80.9% |
More about Health and Nutrition of Ojai, CA Residents
| Local government employment and payroll (March 2022) | |||||
| Function | Full-time employees | Monthly full-time payroll | Average yearly full-time wage | Part-time employees | Monthly part-time payroll |
|---|---|---|---|---|---|
| Parks and Recreation | 8 | $44,930 | $67,395 | 11 | $7,793 |
| Financial Administration | 5 | $34,960 | $83,904 | 1 | $350 |
| Other Government Administration | 5 | $43,545 | $104,508 | 5 | $8,414 |
| Streets and Highways | 4 | $28,671 | $86,013 | 0 | $0 |
| Housing and Community Development (Local) | 4 | $30,944 | $92,832 | 1 | $1,431 |
| Transit | 1 | $6,006 | $72,072 | 9 | $10,166 |
| Totals for Government | 27 | $189,056 | $84,025 | 27 | $28,154 |
Ojai government finances - Expenditure in 2017 (per resident):
- Construction - Housing and Community Development: $465,000 ($61.67)
Regular Highways: $191,000 ($25.33)
- Current Operations - Central Staff Services: $3,391,000 ($449.73)
Police Protection: $3,299,000 ($437.53)
Parks and Recreation: $1,640,000 ($217.51)
Transit Utilities: $1,503,000 ($199.34)
Financial Administration: $1,329,000 ($176.26)
Regular Highways: $507,000 ($67.24)
Protective Inspection and Regulation - Other: $353,000 ($46.82)
Libraries: $123,000 ($16.31)
Housing and Community Development: $116,000 ($15.38)
Health - Other: $32,000 ($4.24)
Miscellaneous Commercial Activities - Other: $11,000 ($1.46)
- General - Interest on Debt: $29,000 ($3.85)
- Other Capital Outlay - Transit Utilities: $585,000 ($77.59)
Parks and Recreation: $83,000 ($11.01)
Regular Highways: $65,000 ($8.62)
Central Staff Services: $37,000 ($4.91)
Police Protection: $12,000 ($1.59)
- Total Salaries and Wages: $318,000 ($42.18)
Ojai government finances - Revenue in 2017 (per resident):
- Charges - Parks and Recreation: $648,000 ($85.94)
Other: $634,000 ($84.08)
Regular Highways: $93,000 ($12.33)
Miscellaneous Commercial Activities: $22,000 ($2.92)
- Federal Intergovernmental - Transit Utilities: $754,000 ($100.00)
Housing and Community Development: $81,000 ($10.74)
- Local Intergovernmental - Transit Utilities: $421,000 ($55.84)
- Miscellaneous - General Revenue - Other: $306,000 ($40.58)
Interest Earnings: $65,000 ($8.62)
Donations From Private Sources: $44,000 ($5.84)
Fines and Forfeits: $28,000 ($3.71)
- Revenue - Transit Utilities: $152,000 ($20.16)
- State Intergovernmental - Other: $460,000 ($61.01)
Highways: $150,000 ($19.89)
General Local Government Support: $13,000 ($1.72)
- Tax - Other Selective Sales: $3,321,000 ($440.45)
Property: $2,635,000 ($349.47)
General Sales and Gross Receipts: $1,446,000 ($191.78)
Public Utilities Sales: $418,000 ($55.44)
Other License: $293,000 ($38.86)
Occupation and Business License - Other: $159,000 ($21.09)
Documentary and Stock Transfer: $102,000 ($13.53)
Ojai government finances - Debt in 2017 (per resident):
- Long Term Debt - Beginning Outstanding - Unspecified Public Purpose: $716,000 ($94.96)
Retired Unspecified Public Purpose: $645,000 ($85.54)
Outstanding Unspecified Public Purpose: $71,000 ($9.42)
Ojai government finances - Cash and Securities in 2017 (per resident):
- Bond Funds - Cash and Securities: $1,119,000 ($148.41)
- Other Funds - Cash and Securities: $4,328,000 ($574.01)
4.96% of this county's 2021 resident taxpayers lived in other counties in 2020 ($110,211 average adjusted gross income)
| Here: | 4.96% |
| California average: | 5.19% |
0.03% of residents moved from foreign countries ($345 average AGI)
Ventura County: 0.03% California average: 0.03%
Top counties from which taxpayers relocated into this county between 2020 and 2021:
| from Los Angeles County, CA | |
| from Santa Barbara County, CA | |
| from Orange County, CA |
5.51% of this county's 2020 resident taxpayers moved to other counties in 2021 ($95,405 average adjusted gross income)
| Here: | 5.51% |
| California average: | 6.14% |
0.02% of residents moved to foreign countries ($247 average AGI)
Ventura County: 0.02% California average: 0.02%
Top counties to which taxpayers relocated from this county between 2020 and 2021:
| to Los Angeles County, CA | |
| to San Diego County, CA | |
| to Santa Barbara County, CA |
| Businesses in Ojai, CA | ||||
| Name | Count | Name | Count | |
|---|---|---|---|---|
| Ace Hardware | 1 | McDonald's | 1 | |
| Baskin-Robbins | 1 | Rite Aid | 1 | |
| Blockbuster | 1 | Starbucks | 1 | |
| Circle K | 1 | Taco Bell | 1 | |
| Curves | 1 | True Value | 1 | |
| DHL | 1 | U-Haul | 2 | |
| Domino's Pizza | 1 | UPS | 3 | |
| FedEx | 3 | Vons | 1 | |
| H&R Block | 1 | Wendy's | 1 | |
| MasterBrand Cabinets | 4 | |||
Strongest AM radio stations in Ojai:
- KACD (850 AM; 25 kW; THOUSAND OAKS, CA; Owner: CITICASTERS LICENSES, L.P.)
- KOXR (910 AM; 5 kW; OXNARD, CA; Owner: LAZER BROADCASTING CORPORATION)
- KSPN (710 AM; 50 kW; LOS ANGELES, CA; Owner: KABC-AM RADIO, INC.)
- KVTA (1520 AM; 10 kW; PORT HUENEME, CA; Owner: GOLD COAST BROADCASTING LLC)
- KIRN (670 AM; 35 kW; SIMI VALLEY, CA; Owner: LOTUS OXNARD CORP.)
- KGDP (660 AM; 50 kW; ORCUTT, CA; Owner: RADIO REPRESENTATIVES, INC.)
- KUNX (1590 AM; 5 kW; VENTURA, CA; Owner: GOLD COAST BROADCASTING LLC)
- KLAC (570 AM; 50 kW; LOS ANGELES, CA; Owner: AMFM RADIO LICENSES, L.L.C.)
- KFWB (980 AM; 50 kW; LOS ANGELES, CA; Owner: INFINITY BROADCASTING OPERATIONS, INC.)
- KFI (640 AM; 50 kW; LOS ANGELES, CA; Owner: CAPSTAR TX LIMITED PARTNERSHIP)
- KNX (1070 AM; 50 kW; LOS ANGELES, CA; Owner: INFINITY BROADCASTING OPERATIONS, INC.)
- KSUR (1260 AM; 25 kW; BEVERLY HILLS, CA)
- KBLA (1580 AM; 50 kW; SANTA MONICA, CA)
Strongest FM radio stations in Ojai:
- KLFH (89.5 FM; OJAI, CA; Owner: SHEPHERD COMMUNICATIONS, INC.)
- KMRO (90.3 FM; CAMARILLO, CA; Owner: THE ASSOCIATION FOR COMMUNITY EDUCATION, INC.)
- KCPB (91.1 FM; THOUSAND OAKS, CA; Owner: UNIVERSITY OF SOUTHERN CALIFORNIA)
- KCAQ (104.7 FM; OXNARD, CA; Owner: GOLD COAST BROADCASTING LLC)
- KOCP (95.9 FM; CAMARILLO, CA; Owner: GOLD COAST BROADCASTING LLC)
- KFYV (105.5 FM; OJAI, CA; Owner: GOLD COAST BROADCASTING LLC)
- K271AC (102.1 FM; OJAI, CA; Owner: SANTA MONICA COMMUNITY COLLEGE DIST.)
- KHAY (100.7 FM; VENTURA, CA; Owner: CUMULUS LICENSING CORP.)
- KSSC (107.1 FM; VENTURA, CA; Owner: ENTRAVISION HOLDINGS, LLC)
- KDAR (98.3 FM; OXNARD, CA; Owner: ATEP RADIO, INC.)
- K210CH (89.9 FM; OAK VIEW, CA; Owner: LIFE ON THE WAY COMMUNICATIONS, INC.)
- KCZN (96.7 FM; SANTA PAULA, CA; Owner: LAZER BROADCASTING CORPORATION)
- K254AH (98.7 FM; ISLA VISTA, CA; Owner: PACIFICA FOUNDATION, INC.)
- K272DI (102.3 FM; FILLMORE, CA; Owner: SANTA MONICA COMMUNITY COLLEGE DIST.)
- K293AG (106.5 FM; TAFT, CA; Owner: CENTRO CRISTIANO DE FE, INC.)
- KMLA (103.7 FM; EL RIO, CA; Owner: GOLD COAST RADIO, L.L.C.)
- KRAZ (105.9 FM; SANTA YNEZ, CA; Owner: KNIGHT BROADCASTING, INC.)
- KRUZ (103.3 FM; SANTA BARBARA, CA; Owner: CUMULUS LICENSING CORP.)
- KSPE-FM (94.5 FM; ELLWOOD, CA; Owner: CITICASTERS LICENSES, L.P.)
- KMGQ (97.5 FM; SANTA BARBARA, CA; Owner: CUMULUS LICENSING CORP.)
TV broadcast stations around Ojai:
- KJLA (Channel 57; VENTURA, CA; Owner: KJLA, LLC)
- KTRO-LP (Channel 50; LANCASTER, CA; Owner: ROBERT D. ADELMAN)
- KADY-TV (Channel 63; OXNARD, CA; Owner: BILTMORE BROADCASTING, L.L.C.)
- National Bridge Inventory (NBI) Statistics
- 18Number of bridges
- 108ft / 32.7mTotal length
- 38,750Total average daily traffic
- 1,139Total average daily truck traffic
- 35,645Total future (year 2036) average daily traffic
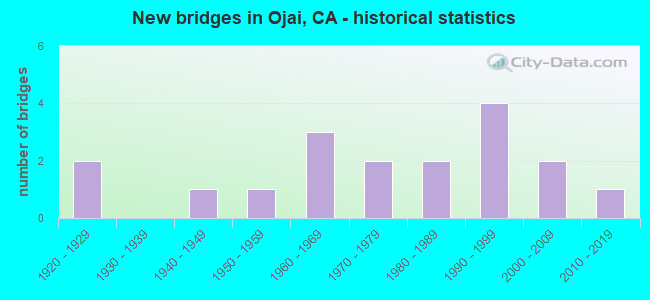
- New bridges - historical statistics
- 21920-1929
- 11940-1949
- 11950-1959
- 31960-1969
- 21970-1979
- 21980-1989
- 41990-1999
- 22000-2009
- 12010-2019
FCC Registered Antenna Towers: 27 (See the full list of FCC Registered Antenna Towers)
FCC Registered Broadcast Land Mobile Towers: 26 (See the full list of FCC Registered Broadcast Land Mobile Towers in Ojai, CA)
FCC Registered Microwave Towers: 28 (See the full list of FCC Registered Microwave Towers in this town)
FCC Registered Paging Towers: 1 (See the full list of FCC Registered Paging Towers)
FCC Registered Amateur Radio Licenses: 247 (See the full list of FCC Registered Amateur Radio Licenses in Ojai)
FAA Registered Aircraft: 63 (See the full list of FAA Registered Aircraft in Ojai)
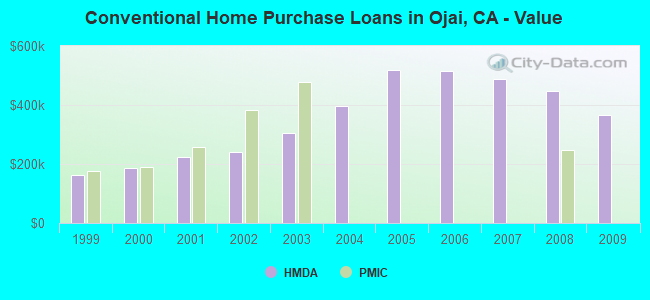
| Home Mortgage Disclosure Act Aggregated Statistics For Year 2009 (Based on 2 partial tracts) | ||||||||||||
| A) FHA, FSA/RHS & VA Home Purchase Loans | B) Conventional Home Purchase Loans | C) Refinancings | D) Home Improvement Loans | F) Non-occupant Loans on < 5 Family Dwellings (A B C & D) | G) Loans On Manufactured Home Dwelling (A B C & D) | |||||||
|---|---|---|---|---|---|---|---|---|---|---|---|---|
| Number | Average Value | Number | Average Value | Number | Average Value | Number | Average Value | Number | Average Value | Number | Average Value | |
| LOANS ORIGINATED | 3 | $338,833 | 10 | $366,113 | 46 | $345,066 | 1 | $338,380 | 8 | $335,835 | 1 | $41,700 |
| APPLICATIONS APPROVED, NOT ACCEPTED | 0 | $0 | 1 | $463,570 | 3 | $352,833 | 0 | $0 | 0 | $0 | 0 | $0 |
| APPLICATIONS DENIED | 1 | $316,230 | 2 | $269,490 | 19 | $440,858 | 0 | $0 | 3 | $464,077 | 1 | $132,490 |
| APPLICATIONS WITHDRAWN | 0 | $0 | 1 | $494,400 | 12 | $368,716 | 1 | $184,970 | 1 | $601,390 | 0 | $0 |
| FILES CLOSED FOR INCOMPLETENESS | 0 | $0 | 0 | $0 | 4 | $520,912 | 0 | $0 | 0 | $0 | 0 | $0 |
Detailed HMDA statistics for the following Tracts: 0009.01 , 0010.02
| Private Mortgage Insurance Companies Aggregated Statistics For Year 2008 (Based on 2 partial tracts) | ||
| A) Conventional Home Purchase Loans | ||
|---|---|---|
| Number | Average Value | |
| LOANS ORIGINATED | 2 | $248,035 |
| APPLICATIONS APPROVED, NOT ACCEPTED | 1 | $207,640 |
| APPLICATIONS DENIED | 0 | $0 |
| APPLICATIONS WITHDRAWN | 0 | $0 |
| FILES CLOSED FOR INCOMPLETENESS | 0 | $0 |
Detailed PMIC statistics for the following Tracts: 0009.01 , 0010.02

2005 - 2018 National Fire Incident Reporting System (NFIRS) incidents
- Fire incident types reported to NFIRS in Ojai, CA
- 14936.1%Outside Fires
- 13833.4%Structure Fires
- 8219.9%Other
- 4410.7%Mobile Property/Vehicle Fires
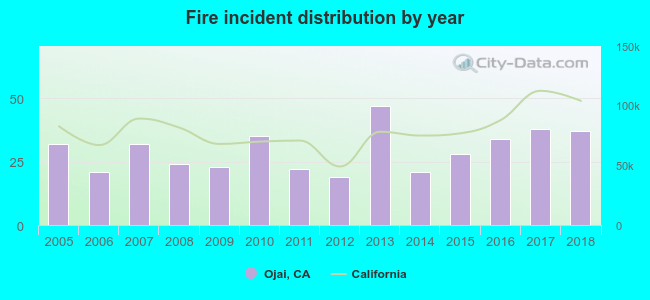 According to the data from the years 2005 - 2018 the average number of fire incidents per year is 30. The highest number of reported fires - 47 took place in 2013, and the least - 19 in 2012. The data has a rising trend.
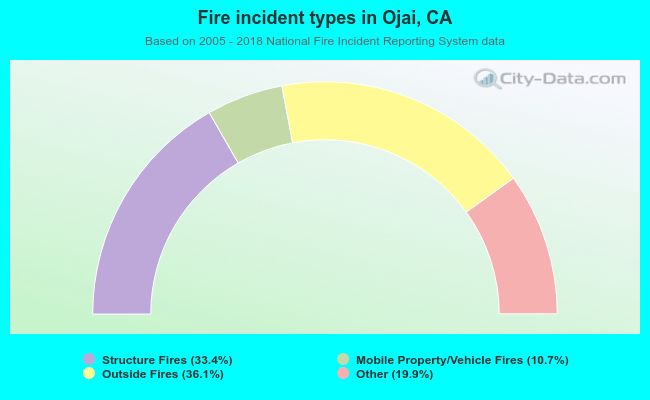 When looking into fire subcategories, the most reports belonged to: Outside Fires (36.1%), and Structure Fires (33.4%).
Fire-safe hotels and motels in Ojai, California:
- Casa Ojai Inn, 1302 E Ojai Ave, Ojai, California 93023 , Phone: (805) 646-8175, Fax: (805) 640-8193
- Capri Motel, 1180 E Ojai Ave, Ojai, California 93023 , Phone: (805) 646-4305
- Hummingbird Inn, 1208 E Ojai Ave, Ojai, California 93023 , Phone: (805) 646-4365, Fax: (805) 646-0625
| Most common first names in Ojai, CA among deceased individuals | ||
| Name | Count | Lived (average) |
|---|---|---|
| John | 169 | 76.5 years |
| William | 154 | 77.4 years |
| Mary | 143 | 81.6 years |
| Robert | 131 | 72.7 years |
| James | 122 | 74.9 years |
| Margaret | 89 | 82.1 years |
| Charles | 85 | 78.0 years |
| Helen | 79 | 81.6 years |
| Ruth | 78 | 81.2 years |
| George | 72 | 76.0 years |
| Most common last names in Ojai, CA among deceased individuals | ||
| Last name | Count | Lived (average) |
|---|---|---|
| Smith | 70 | 78.1 years |
| Brown | 42 | 77.2 years |
| Williams | 38 | 79.6 years |
| Johnson | 38 | 79.2 years |
| Miller | 37 | 79.1 years |
| Wilson | 29 | 76.2 years |
| Anderson | 27 | 80.5 years |
| Clark | 27 | 75.2 years |
| Young | 23 | 77.8 years |
| Thompson | 23 | 77.2 years |

- 85.5%Utility gas
- 8.0%Electricity
- 6.5%Solar energy
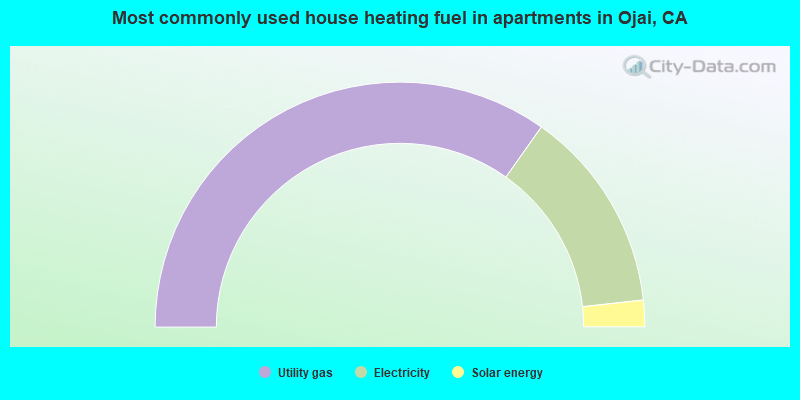
- 69.6%Utility gas
- 26.9%Electricity
- 3.5%Solar energy
Ojai compared to California state average:
- Unemployed percentage below state average.
- Black race population percentage significantly below state average.
- Hispanic race population percentage below state average.
- Median age significantly above state average.
- Foreign-born population percentage below state average.
- Length of stay since moving in significantly above state average.
- Number of college students below state average.
- Percentage of population with a bachelor's degree or higher above state average.
Ojai on our top lists:
- #32 on the list of "Top 101 cities with largest percentage of males in occupations: business and financial operations occupations (population 5,000+)"
- #78 on the list of "Top 100 cities with highest ratio of median house value to median household income (pop. 5,000+)"
- #84 on the list of "Top 101 cities with largest percentage of males in occupations: arts, design, entertainment, sports, and media occupations (population 5,000+)"
- #16 on the list of "Top 101 counties with the highest lead air pollution readings in 2012 (µg/m3)"
- #18 on the list of "Top 101 counties with the lowest lead air pollution readings in 2012 (µg/m3)"
- #38 on the list of "Top 101 counties with the highest Particulate Matter (PM10) Annual air pollution readings in 2012 (µg/m3)"
- #44 on the list of "Top 101 counties with the highest surface withdrawal of fresh water for public supply (pop. 50,000+)"
- #44 on the list of "Top 101 counties with the most Other congregations (pop. 50,000+)"

|
|
Total of 335 patent applications in 2008-2024.