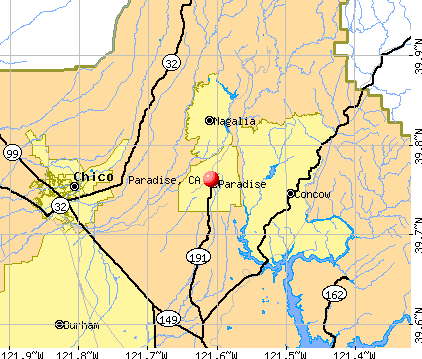
Paradise, California
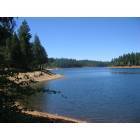
Paradise: Paradise Lake
Paradise: Paradise Lake
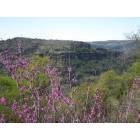
Paradise: Canyon on one side of Paradise
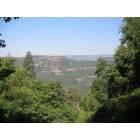
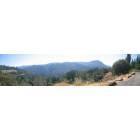
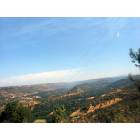
Paradise: view from Bille Park
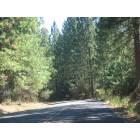
Paradise: On the way to Paradise Lake on Coutolenc Road.
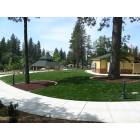
Paradise: Paradise Community Park-Restored Train Depot
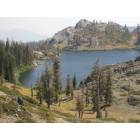
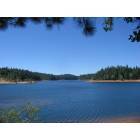
Paradise: Lotts Lake, one of the lakes above Paradise, CA
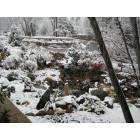
Paradise: Sometimes it snows in Paradise
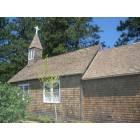
Paradise: Old Magalia Church
Paradise: Paradise
Paradise: The Ridge
- see
25
more - add
your
Submit your own pictures of this town and show them to the world
- OSM Map
- General Map
- Google Map
- MSN Map
Population change since 2000: -75.3%
 |
| Males: 3,453 | |
| Females: 3,063 |
| Median resident age: | 58.2 years |
| California median age: | 37.9 years |
Zip codes: 95969.
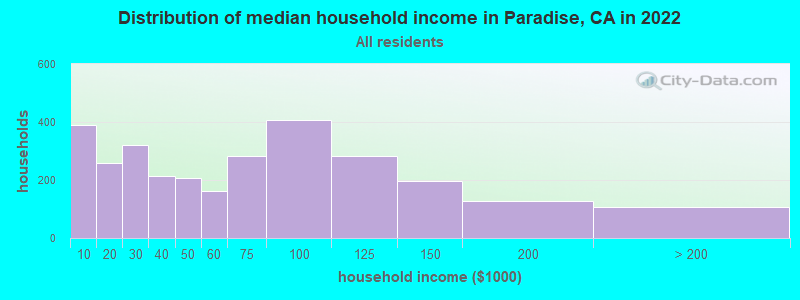
| Paradise: | $53,465 |
| CA: | $91,551 |
Estimated per capita income in 2022: $35,078 (it was $19,267 in 2000)
Paradise town income, earnings, and wages data
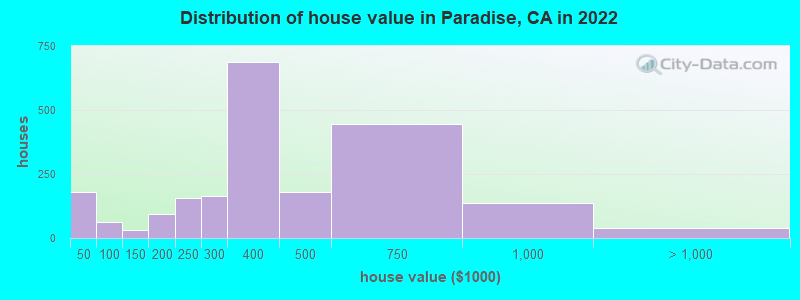
Estimated median house or condo value in 2022: $382,158 (it was $112,300 in 2000)
| Paradise: | $382,158 |
| CA: | $715,900 |
Mean prices in 2022: all housing units: $430,317; detached houses: $475,594; townhouses or other attached units: $396,127; in 5-or-more-unit structures: $542,659; mobile homes: $196,248; occupied boats, rvs, vans, etc.: $77,873
Median gross rent in 2022: $1,209.
(13.7% for White Non-Hispanic residents, 91.3% for Black residents, 11.0% for Hispanic or Latino residents, 27.3% for American Indian residents, 100.0% for Native Hawaiian and other Pacific Islander residents, 43.8% for two or more races residents)
Detailed information about poverty and poor residents in Paradise, CA


Compare current foreclosures near Paradise, CA:
| Photo | Address | Area | Beds / Baths | Price | Details |
|---|---|---|---|---|---|

|
#1
Pentz Rd
Paradise, CA 95969
|
1,620 sq. feet
|
2 baths 3 beds |
$365,000
|
show details |

|
#2
Crestwood Dr
Paradise, CA 95969
|
1,550 sq. feet
|
2 baths 3 beds |
show details | |

|
#3
Matell Rd
Paradise, CA 95969
|
1,270 sq. feet
|
1 baths 2 beds |
show details | |

|
#4
Highland Ln
Paradise, CA 95969
|
1,516 sq. feet
|
2 baths 3 beds |
show details | |

|
#5
Del Rio Way
Paradise, CA 95969
|
1,282 sq. feet
|
1 baths 2 beds |
show details | |

|
#6
Pearson Rd
Paradise, CA 95969
|
4,352 sq. feet
|
8 baths 8 beds |
show details | |

|
#7
Acorn Ridge Dr
Paradise, CA 95969
|
- sq. feet
|
3 baths 3 beds |
show details | |

|
#8
Chatham Ct
Magalia, CA 95954
|
1,215 sq. feet
|
2 baths 3 beds |
$244,900
|
show details |

|
#9
Virginia St
Chico, CA 95928
|
936 sq. feet
|
1 baths 2 beds |
$299,000
|
show details |

|
#10
Pearl Dr
Paradise, CA 95969
|
- sq. feet
|
- baths - beds |
show details |
| Photo | Address | Area | Beds / Baths | Price | Details |
|---|---|---|---|---|---|

|
#11
Capshaw Ct
Chico, CA 95926
|
1,845 sq. feet
|
2 baths 3 beds |
show details | |

|
#12
Durham Dayton Hwy
Durham, CA 95938
|
2,168 sq. feet
|
2 baths 5 beds |
show details | |

|
#13
W 5th St
Chico, CA 95928
|
- sq. feet
|
4 baths 8 beds |
show details | |

|
#14
Creek Hollow Dr
Chico, CA 95928
|
1,809 sq. feet
|
3 baths 4 beds |
show details | |

|
#15
2195 Robailey Drive
Chico, CA 95928
|
1,745 sq. feet
|
2 baths 4 beds |
show details | |

|
#16
Garden Park Dr
Chico, CA 95973
|
1,282 sq. feet
|
2 baths 3 beds |
show details | |

|
#17
Palmetto Ave
Chico, CA 95926
|
2,326 sq. feet
|
1 baths 2 beds |
show details | |

|
#18
Mathews Dr
Chico, CA 95926
|
1,440 sq. feet
|
2 baths 4 beds |
show details | |

|
#19
Kinswood Ln
Chico, CA 95973
|
1,570 sq. feet
|
2 baths 3 beds |
show details | |

|
#20
Acacia Ave
Oroville, CA 95966
|
2,076 sq. feet
|
2 baths 4 beds |
show details |
| Photo | Address | Area | Beds / Baths | Price | Details |
|---|---|---|---|---|---|

|
#21
Delta Ct
Magalia, CA 95954
|
1,280 sq. feet
|
2 baths 3 beds |
show details | |

|
#22
Dias Dr
Chico, CA 95926
|
2,520 sq. feet
|
3 baths 3 beds |
show details | |

|
#23
Algonkin Ave
Chico, CA 95926
|
1,392 sq. feet
|
2 baths 2 beds |
show details | |

|
#24
Filbert Ave
Chico, CA 95926
|
3,740 sq. feet
|
4 baths 4 beds |
show details | |

|
#25
Landmark Dr
Chico, CA 95973
|
1,935 sq. feet
|
2 baths 3 beds |
show details | |

|
#26
E 5th Ave
Chico, CA 95926
|
1,305 sq. feet
|
1 baths 3 beds |
show details | |

|
#27
E Lassen Ave Spc 541
Chico, CA 95973
|
800 sq. feet
|
2 baths 2 beds |
show details | |

|
#28
Peninsula Dr
Chico, CA 95928
|
1,653 sq. feet
|
2 baths 3 beds |
show details | |

|
#29
Benton Ave
Chico, CA 95973
|
1,522 sq. feet
|
2 baths 3 beds |
show details | |

|
#30
Glacier Peak Ln
Chico, CA 95973
|
1,248 sq. feet
|
2 baths 3 beds |
show details |
| Photo | Address | Area | Beds / Baths | Price | Details |
|---|---|---|---|---|---|

|
#31
Midway
Durham, CA 95938
|
2,299 sq. feet
|
4 baths 6 beds |
show details | |

|
#32
Carnegie Rd
Magalia, CA 95954
|
1,458 sq. feet
|
2 baths 3 beds |
show details | |

|
#33
Glenshire Ln
Chico, CA 95973
|
1,725 sq. feet
|
3 baths 4 beds |
show details | |

|
#34
Mathews Dr
Chico, CA 95926
|
1,440 sq. feet
|
2 baths 3 beds |
show details | |

|
#35
Adlar Ct
Chico, CA 95926
|
2,162 sq. feet
|
2 baths 4 beds |
show details | |

|
#36
Morseman Ave Spc 103
Chico, CA 95973
|
960 sq. feet
|
2 baths 2 beds |
show details | |

|
#37
Cyndi Cir
Chico, CA 95973
|
1,531 sq. feet
|
1 baths 3 beds |
show details | |

|
#38
Losse Way
Chico, CA 95926
|
1,296 sq. feet
|
1 baths 3 beds |
show details | |

|
#39
Morseman Ave Spc 119
Chico, CA 95973
|
720 sq. feet
|
2 baths 2 beds |
show details | |

|
#40
Orchard Way
Chico, CA 95928
|
1,199 sq. feet
|
2 baths 3 beds |
show details |
| Photo | Address | Area | Beds / Baths | Price | Details |
|---|---|---|---|---|---|

|
#41
Mefford Way
Chico, CA 95973
|
1,207 sq. feet
|
1 baths 3 beds |
show details | |

|
#42
Guynn Ave
Chico, CA 95973
|
1,963 sq. feet
|
2 baths 3 beds |
show details | |

|
#43
Aspen St
Chico, CA 95928
|
864 sq. feet
|
1 baths 3 beds |
show details | |

|
#44
Plumas Ave
Oroville, CA 95965
|
1,477 sq. feet
|
2 baths 3 beds |
show details | |

|
#45
Perkins Rd
Chico, CA 95928
|
1,324 sq. feet
|
1 baths 3 beds |
show details | |

|
#46
Fogg Ave
Oroville, CA 95965
|
1,536 sq. feet
|
2 baths 3 beds |
show details | |

|
#47
Arch Way
Chico, CA 95973
|
1,358 sq. feet
|
2 baths 3 beds |
show details | |

|
#48
Midway
Durham, CA 95938
|
1,505 sq. feet
|
1 baths 3 beds |
show details | |

|
#49
Plumas Ave
Oroville, CA 95965
|
1,477 sq. feet
|
2 baths 3 beds |
show details | |

|
Check over 1 million property listings on Foreclosure.com!
|
browse all offers | |||


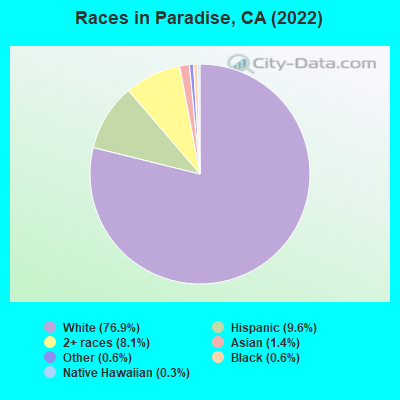
- 4,97576.9%White alone
- 6199.6%Hispanic
- 5278.1%Two or more races
- 911.4%Asian alone
- 410.6%Black alone
- 420.6%Other race alone
- 190.3%Native Hawaiian and Other
Pacific Islander alone - 60.09%American Indian alone
According to our research of California and other state lists, there were 33 registered sex offenders living in Paradise, California as of April 23, 2024.
The ratio of all residents to sex offenders in Paradise is 811 to 1.
The ratio of registered sex offenders to all residents in this city is near the state average.
Type |
2009 |
2010 |
2011 |
2012 |
2013 |
2014 |
2015 |
2016 |
2017 |
2018 |
2019 |
2020 |
2022 |
|---|---|---|---|---|---|---|---|---|---|---|---|---|---|
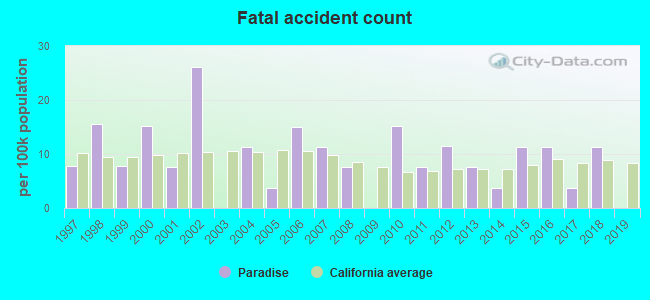
| Murders (per 100,000) | 1 (3.8) | 1 (3.8) | 0 (0.0) | 0 (0.0) | 1 (3.8) | 1 (3.8) | 1 (3.8) | 1 (3.8) | 0 (0.0) | 0 (0.0) | 0 (0.0) | 0 (0.0) | 0 (0.0) |
| Rapes (per 100,000) | 13 (49.1) | 11 (42.0) | 10 (37.7) | 5 (18.9) | 11 (41.9) | 4 (15.2) | 9 (33.9) | 7 (26.4) | 16 (60.1) | 15 (56.1) | 5 (18.6) | 2 (49.1) | 4 (68.3) |
| Robberies (per 100,000) | 10 (37.8) | 11 (42.0) | 14 (52.8) | 6 (22.6) | 7 (26.7) | 7 (26.6) | 11 (41.5) | 8 (30.2) | 9 (33.8) | 5 (18.7) | 1 (3.7) | 1 (24.6) | 0 (0.0) |
| Assaults (per 100,000) | 66 (249.3) | 81 (308.9) | 54 (203.6) | 55 (207.6) | 49 (186.9) | 40 (152.1) | 31 (116.9) | 29 (109.3) | 63 (236.8) | 45 (168.2) | 16 (59.5) | 14 (343.8) | 17 (290.1) |
| Burglaries (per 100,000) | 165 (623.3) | 174 (663.7) | 200 (754.0) | 241 (909.7) | 214 (816.1) | 257 (977.0) | 212 (799.6) | 250 (942.3) | 127 (477.3) | 109 (407.4) | 83 (308.8) | 35 (859.5) | 22 (375.4) |
| Thefts (per 100,000) | 539 (2,036) | 340 (1,297) | 220 (829.4) | 214 (807.8) | 242 (922.9) | 200 (760.3) | 245 (924.0) | 178 (670.9) | 131 (492.3) | 125 (467.2) | 51 (189.7) | 39 (957.8) | 45 (767.9) |
| Auto thefts (per 100,000) | 55 (207.8) | 32 (122.1) | 42 (158.3) | 24 (90.6) | 74 (282.2) | 59 (224.3) | 64 (241.4) | 74 (278.9) | 37 (139.0) | 45 (168.2) | 68 (253.0) | 25 (613.9) | 13 (221.8) |
| Arson (per 100,000) | 5 (18.9) | 2 (7.6) | 0 (0.0) | 0 (0.0) | 0 (0.0) | 2 (7.6) | 5 (18.9) | 3 (11.3) | 2 (7.5) | 0 (0.0) | 1 (3.7) | 0 (0.0) | 2 (34.1) |
| City-Data.com crime index | 249.7 | 223.7 | 185.3 | 166.7 | 203.2 | 174.9 | 182.8 | 174.7 | 169.8 | 144.8 | 77.3 | 263.0 | 187.4 |
The City-Data.com crime index weighs serious crimes and violent crimes more heavily. Higher means more crime, U.S. average is 246.1. It adjusts for the number of visitors and daily workers commuting into cities.
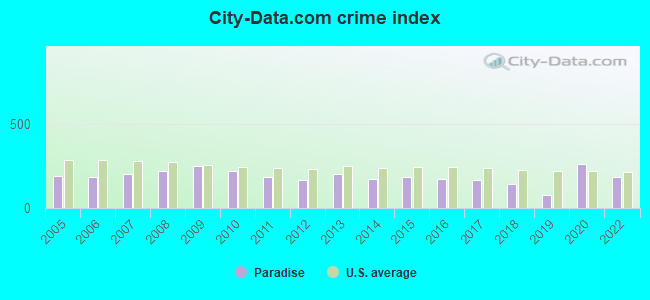
Crime rate in Paradise detailed stats: murders, rapes, robberies, assaults, burglaries, thefts, arson
Full-time law enforcement employees in 2021, including police officers: 24 (17 officers - 15 male; 2 female).
| Officers per 1,000 residents here: | 4.26 |
| California average: | 2.30 |
 Recent articles from our blog. Our writers, many of them Ph.D. graduates or candidates, create easy-to-read articles on a wide variety of topics.

 | FILMMAKERS ANALYZE PARADISE FIRE: Blame Residents for Town's Fire-Prone Location (48 replies) |
| The Paradise megafire - the future? (87 replies) |
| Paradise Strong - Butte County Recovers - what a joke (26 replies) |
| Fire In Paradise book (0 replies) |
| Retiring - Paradise , Chico or Magalia (45 replies) |
| Paradise CA any advice? (29 replies) |
Latest news from Paradise, CA collected exclusively by city-data.com from local newspapers, TV, and radio stations
Ancestries: American (22.1%), Irish (10.9%), English (9.6%), German (4.1%), European (3.9%), Italian (3.6%).
Current Local Time: PST time zone
Incorporated on 11/27/1979
Elevation: 1708 feet
Land area: 18.2 square miles.
Population density: 357 people per square mile (very low).
287 residents are foreign born (2.8% Latin America, 0.9% Asia, 0.5% Europe).
| This town: | 4.4% |
| California: | 26.5% |
Median real estate property taxes paid for housing units with mortgages in 2022: $2,841 (0.7%)
Median real estate property taxes paid for housing units with no mortgage in 2022: $2,402 (0.6%)
Nearest city with pop. 50,000+: Chico, CA  (12.2 miles , pop. 59,954).
Nearest city with pop. 200,000+: Sacramento, CA (83.8 miles , pop. 407,018).
Nearest city with pop. 1,000,000+: Los Angeles, CA (431.3 miles , pop. 3,694,820).
Nearest cities:
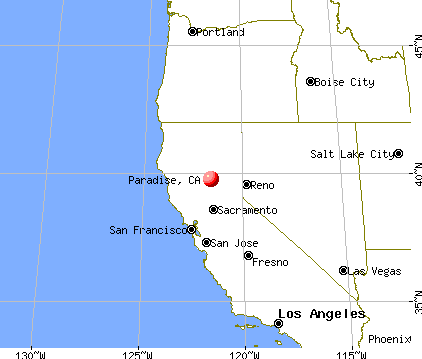
), ), ), ), ), Latitude: 39.76 N, Longitude: 121.61 W
Daytime population change due to commuting: +1,749 (+27.0%)
Workers who live and work in this town: 878 (46.4%)
Area code: 530
Paradise, California accommodation & food services, waste management - Economy and Business Data
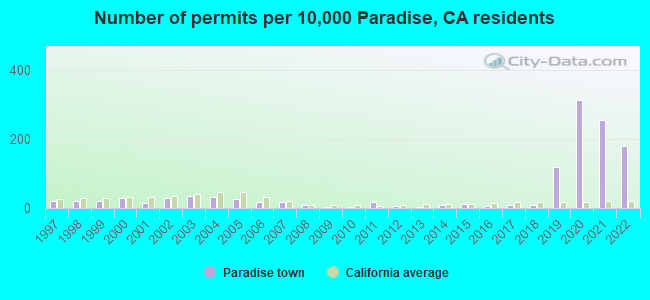
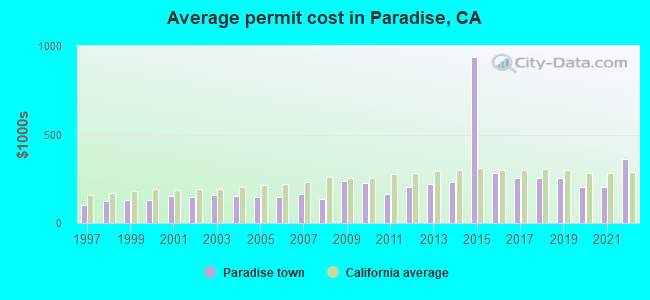
Single-family new house construction building permits:
- 2022: 471 buildings, average cost: $358,600
- 2021: 672 buildings, average cost: $205,200
- 2020: 826 buildings, average cost: $203,400
- 2019: 312 buildings, average cost: $251,800
- 2018: 26 buildings, average cost: $257,100
- 2017: 25 buildings, average cost: $257,100
- 2016: 18 buildings, average cost: $281,400
- 2015: 35 buildings, average cost: $938,000
- 2014: 22 buildings, average cost: $230,200
- 2013: 11 buildings, average cost: $223,200
- 2012: 18 buildings, average cost: $203,600
- 2011: 44 buildings, average cost: $163,200
- 2010: 5 buildings, average cost: $226,800
- 2009: 9 buildings, average cost: $237,500
- 2008: 27 buildings, average cost: $133,900
- 2007: 47 buildings, average cost: $164,700
- 2006: 43 buildings, average cost: $146,900
- 2005: 70 buildings, average cost: $146,200
- 2004: 83 buildings, average cost: $151,000
- 2003: 93 buildings, average cost: $155,500
- 2002: 74 buildings, average cost: $146,000
- 2001: 40 buildings, average cost: $150,700
- 2000: 74 buildings, average cost: $130,500
- 1999: 53 buildings, average cost: $128,100
- 1998: 53 buildings, average cost: $122,100
- 1997: 51 buildings, average cost: $101,900
| Here: | 8.7% |
| California: | 5.1% |
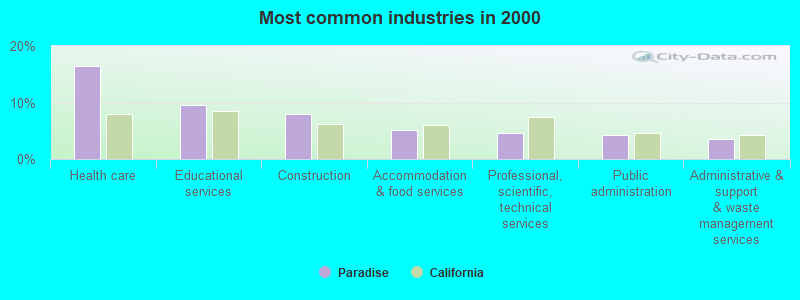
- Health care (16.5%)
- Educational services (9.6%)
- Construction (8.0%)
- Accommodation & food services (5.2%)
- Professional, scientific, technical services (4.6%)
- Public administration (4.2%)
- Administrative & support & waste management services (3.6%)
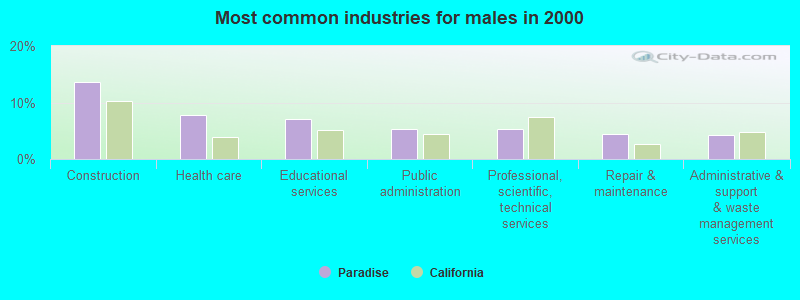
- Construction (13.6%)
- Health care (7.8%)
- Educational services (7.1%)
- Public administration (5.3%)
- Professional, scientific, technical services (5.3%)
- Repair & maintenance (4.4%)
- Administrative & support & waste management services (4.2%)
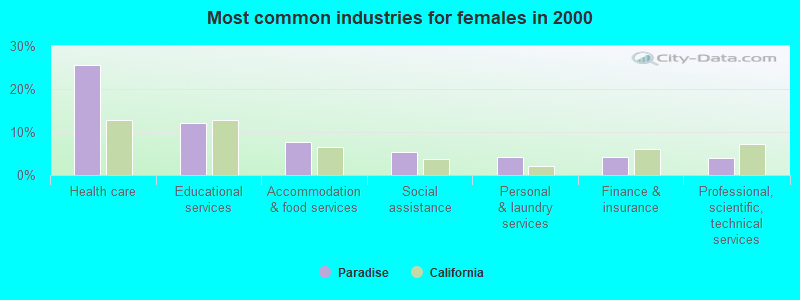
- Health care (25.7%)
- Educational services (12.1%)
- Accommodation & food services (7.6%)
- Social assistance (5.4%)
- Personal & laundry services (4.3%)
- Finance & insurance (4.2%)
- Professional, scientific, technical services (3.9%)
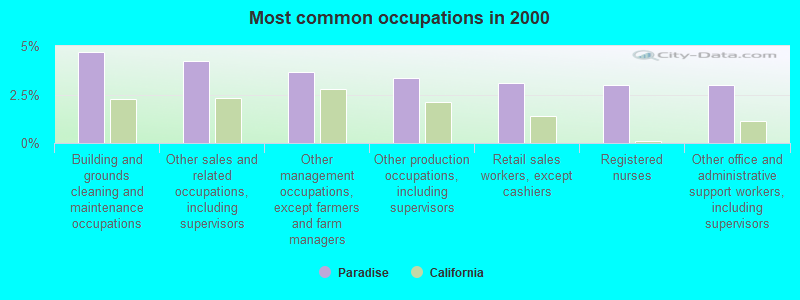
- Building and grounds cleaning and maintenance occupations (4.7%)
- Other sales and related occupations, including supervisors (4.2%)
- Other management occupations, except farmers and farm managers (3.7%)
- Other production occupations, including supervisors (3.3%)
- Retail sales workers, except cashiers (3.1%)
- Registered nurses (3.0%)
- Other office and administrative support workers, including supervisors (3.0%)
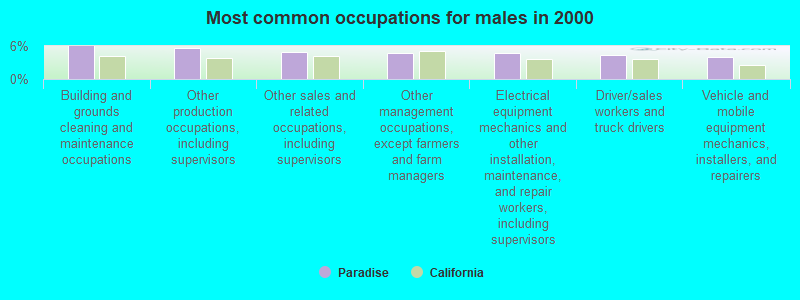
- Building and grounds cleaning and maintenance occupations (6.0%)
- Other production occupations, including supervisors (5.6%)
- Other sales and related occupations, including supervisors (4.9%)
- Other management occupations, except farmers and farm managers (4.8%)
- Electrical equipment mechanics and other installation, maintenance, and repair workers, including supervisors (4.6%)
- Driver/sales workers and truck drivers (4.3%)
- Vehicle and mobile equipment mechanics, installers, and repairers (4.0%)
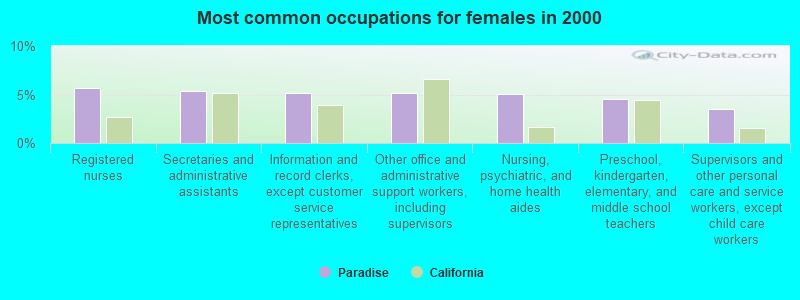
- Registered nurses (5.6%)
- Secretaries and administrative assistants (5.4%)
- Information and record clerks, except customer service representatives (5.2%)
- Other office and administrative support workers, including supervisors (5.2%)
- Nursing, psychiatric, and home health aides (5.0%)
- Preschool, kindergarten, elementary, and middle school teachers (4.5%)
- Supervisors and other personal care and service workers, except child care workers (3.5%)
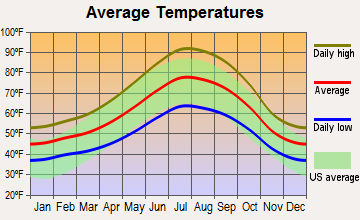
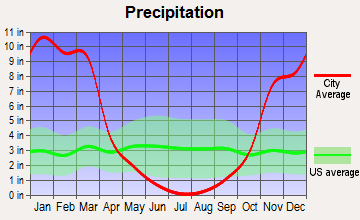
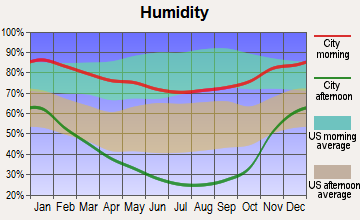
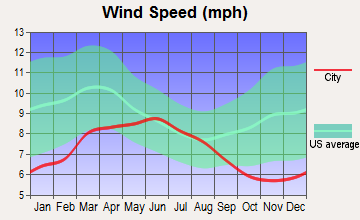
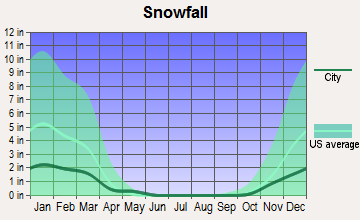
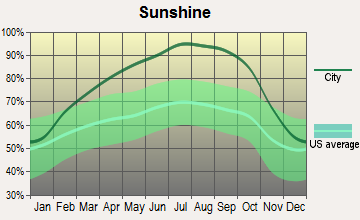
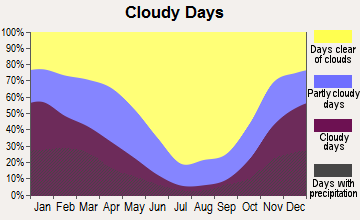
Average climate in Paradise, California
Based on data reported by over 4,000 weather stations
|
|

(lower is better)
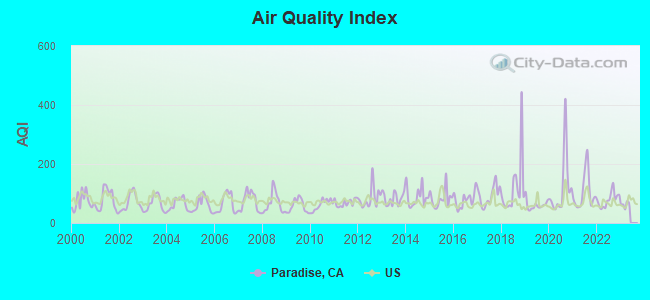
Air Quality Index (AQI) level in 2022 was 79.1. This is about average.
| City: | 79.1 |
| U.S.: | 72.6 |
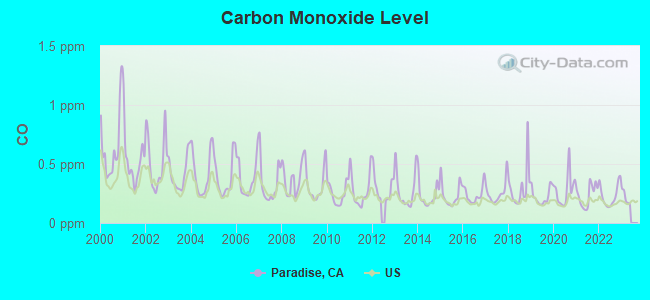
Carbon Monoxide (CO) [ppm] level in 2022 was 0.233. This is about average. Closest monitor was 12.3 miles away from the city center.
| City: | 0.233 |
| U.S.: | 0.251 |
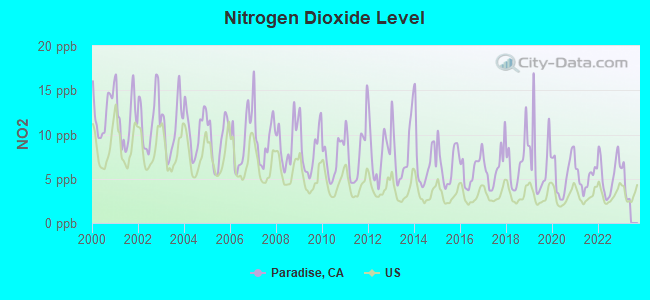
Nitrogen Dioxide (NO2) [ppb] level in 2022 was 5.46. This is about average. Closest monitor was 12.3 miles away from the city center.
| City: | 5.46 |
| U.S.: | 5.11 |
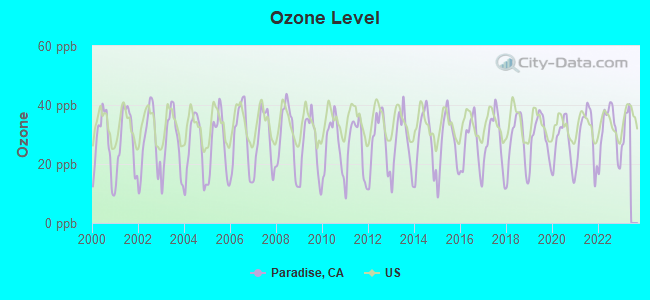
Ozone [ppb] level in 2022 was 31.0. This is about average. Closest monitor was 0.3 miles away from the city center.
| City: | 31.0 |
| U.S.: | 33.3 |
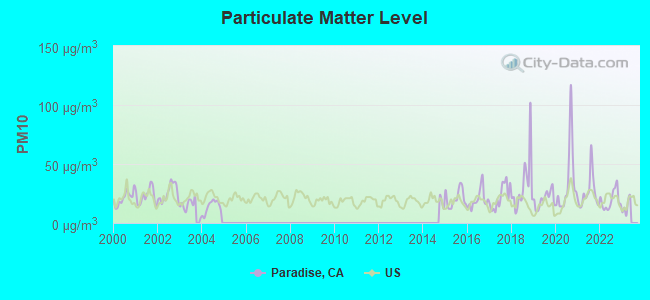
Particulate Matter (PM10) [µg/m3] level in 2022 was 19.2. This is about average. Closest monitor was 1.0 miles away from the city center.
| City: | 19.2 |
| U.S.: | 19.2 |
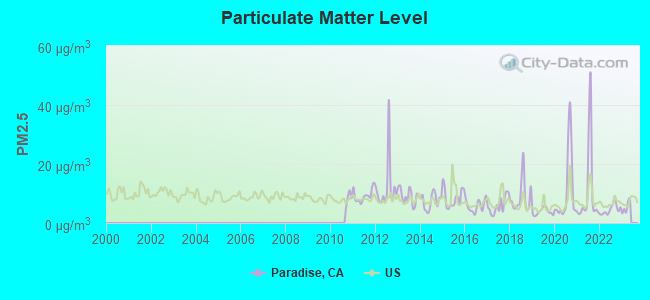
Particulate Matter (PM2.5) [µg/m3] level in 2022 was 4.58. This is significantly better than average. Closest monitor was 12.3 miles away from the city center.
| City: | 4.58 |
| U.S.: | 8.11 |
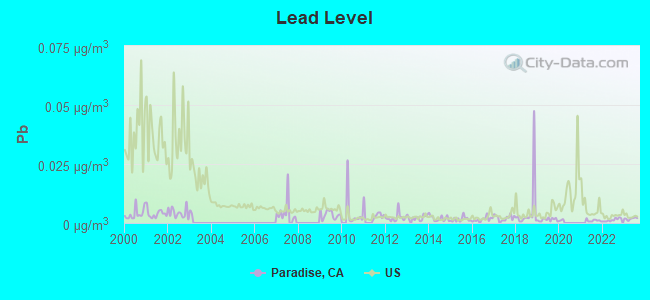
Lead (Pb) [µg/m3] level in 2023 was 0.00184. This is significantly better than average. Closest monitor was 12.3 miles away from the city center.
| City: | 0.00184 |
| U.S.: | 0.00931 |
Earthquake activity:
Paradise-area historical earthquake activity is significantly above California state average. It is 6545% greater than the overall U.S. average.On 4/18/1906 at 13:12:21, a magnitude 7.9 (7.9 UK, Class: Major, Intensity: VIII - XII) earthquake occurred 143.0 miles away from the city center, causing $524,000,000 total damage
On 1/31/1922 at 13:17:28, a magnitude 7.6 (7.6 UK) earthquake occurred 218.1 miles away from Paradise center
On 10/3/1915 at 06:52:48, a magnitude 7.6 (7.6 UK) earthquake occurred 223.2 miles away from the city center
On 4/25/1992 at 18:06:04, a magnitude 7.2 (6.3 MB, 7.1 MS, 7.2 MW, 7.1 MW, Depth: 9.4 mi) earthquake occurred 136.4 miles away from the city center, causing $75,000,000 total damage
On 11/8/1980 at 10:27:34, a magnitude 7.2 (6.2 MB, 7.2 MS, 7.2 MW, 7.0 ML) earthquake occurred 169.6 miles away from the city center
On 1/22/1923 at 09:04:18, a magnitude 7.2 (7.2 UK) earthquake occurred 202.8 miles away from the city center
Magnitude types: body-wave magnitude (MB), local magnitude (ML), surface-wave magnitude (MS), moment magnitude (MW)
Natural disasters:
The number of natural disasters in Butte County (25) is a lot greater than the US average (15).Major Disasters (Presidential) Declared: 11
Emergencies Declared: 4
Causes of natural disasters: Floods: 12, Fires: 9, Winter Storms: 6, Storms: 5, Landslides: 4, Mudslides: 4, Drought: 1, Freeze: 1, Heavy Rain: 1, Hurricane: 1, Tornado: 1, Other: 1 (Note: some incidents may be assigned to more than one category).

Hospitals and medical centers in Paradise:
- ALPINE HOME III, THE (5577 CARLI COURT)
- FEATHER RIVER HOSPITAL (Voluntary non-profit - Church, provides emergency services, 5974 PENTZ ROAD)
- CALIFORNIA HEALTH PROFESSIONALS (5910 CLARK ROAD SUITE T)
- FEATHER RIVER HHA (6626 CLARK ROAD, STE P)
- CYPRESS ACRES CONVALESCENT HOSPITAL (6900 CLARK RD)
- CYPRESS HEALTHCARE CENTER (1633 CYPRESS LANE)
- PARADISE LODGE (5374 EDGEWOOD LANE)
- PARADISE SKILLED NURSING (7419 SKYWAY)
- PINE VIEW CARE CENTER (8777 SKYWAY)
Airports located in Paradise:
- Paradise Skypark Airport (CA92) (Runways: 1, Air Taxi Ops: 500, Itinerant Ops: 4,800, Local Ops: 9,600)
Amtrak stations near Paradise:
- 13 miles: CHICO (W. 5TH & ORANGE STS.) . Services: partially wheelchair accessible, enclosed waiting area, public restrooms, public payphones, free short-term parking, free long-term parking, call for taxi service, intercity bus service, public transit connection.
- 17 miles: OROVILLE (GRANDE AVE. AT STATE HWY. 70) - Bus Station . Services: fully wheelchair accessible, free short-term parking, free long-term parking, call for taxi service.
Colleges/universities with over 2000 students nearest to Paradise:
- Butte College (about 9 miles; Oroville, CA; Full-time enrollment: 8,649)
- California State University-Chico (about 13 miles; Chico, CA; FT enrollment: 14,838)
- Yuba College (about 45 miles; Marysville, CA; FT enrollment: 4,737)
- Sierra College (about 71 miles; Rocklin, CA; FT enrollment: 11,488)
- Shasta College (about 71 miles; Redding, CA; FT enrollment: 5,645)
- Universal Technical Institute of Northern California Inc (about 78 miles; Sacramento, CA; FT enrollment: 3,193)
- American River College (about 79 miles; Sacramento, CA; FT enrollment: 20,452)
Public high schools in Paradise:
- PARADISE SENIOR HIGH (Students: 933, Location: 5911 MAXWELL DR., Grades: 9-12)
- HOMETECH CHARTER (Students: 61, Location: 7126 SKYWAY, Grades: KG-12, Charter school)
- HONEY RUN ACADEMY SECONDARY (Students: 10, Location: 622 PEARSON RD, Grades: 7-12)
- PARADISE ELEARNING ACADEMY (Location: 5911 MAXWELL DR., Grades: 9-12, Charter school)
- PARADISE HIGH - RISE (Location: 5911 MAXWELL DR., Grades: 9-12)
Private high schools in Paradise:
- PARADISE ADVENTIST ACADEMY (Students: 182, Location: 5699 ACADEMY DR, Grades: KG-12)
- YOUTH FOR CHANGE ED SERVICES (Students: 15, Location: 7204 SKYWAY, Grades: 2-12)
- PARADISE CHRISTIAN SCHOOL (Students: 14, Location: 1573 BILLE RD, Grades: KG-11)
Public elementary/middle schools in Paradise:
- PARADISE INTERMEDIATE (Students: 521, Location: 5657 RECREATION DR, Grades: 6-8)
- PARADISE CHARTER MIDDLE (Students: 371, Location: 6473 CLARK RD., Grades: 6-8, Charter school)
- PONDEROSA ELEMENTARY (Students: 326, Location: 6593 PENTZ RD, Grades: KG-5)
- CHILDREN'S COMMUNITY CHARTER (Students: 174, Location: 6830 PENTZ RD., Grades: KG-8, Charter school)
- ACHIEVE CHARTER SCHOOL OF PARADISE INC. (Students: 105, Location: 771 ELLIOTT RD., Grades: KG-8, Charter school)
- HONEY RUN ACADEMY ELEMENTARY (Students: 5, Location: 622 PEARSON RD., Grades: 4-6)
- PARADISE ELEMENTARY (Location: 588 PEARSON RD, Grades: KG-5)
- PARADISE INTERMEDIATE - RISE (Location: 5657 RECREATION DR., Grades: 6-8)
Private elementary/middle school in Paradise:
Points of interest:
Notable locations in Paradise: Paradise Camp (A), Veterans Memorial Hall (B), Paradise Branch Butte County Library (C), First Responder Emergency Medical Services Station 12 (D), First Responder Emergency Medical Services Station 14 (E), Paradise Fire Protection District (F), California Department of Forestry and Fire Protection Station 35 Paradise (G), Paradise Fire Department Station 2 (H), Paradise Fire Department Station 3 (I), Paradise Fire Department Station 1 (J). Display/hide their locations on the map
Churches in Paradise include: Calvary Baptist Church (A), Christian Center (B), The Church of Jesus Christ of Latter Day Saints (C), First Assembly of God Church (D), First Baptist Church (E), Foursquare Gospel Church (F), I Am Temple (G), Jubilee on the Ridge Church (H), New Life Apostolic Church (I). Display/hide their locations on the map
Parks in Paradise include: Rotary Grove Park (1), Bille Park (2), Paradise Memorial Park (3). Display/hide their locations on the map
Birthplace of: Tiffany Brissette - Actress.
| This town: | 2.2 people |
| California: | 2.9 people |
| This town: | 59.2% |
| Whole state: | 68.7% |
| This town: | 7.0% |
| Whole state: | 7.2% |
Likely homosexual households (counted as self-reported same-sex unmarried-partner households)
- Lesbian couples: 0.5% of all households
- Gay men: 0.3% of all households
People in group quarters in Paradise in 2010:
- 246 people in nursing facilities/skilled-nursing facilities
- 67 people in group homes intended for adults
- 40 people in workers' group living quarters and job corps centers
- 19 people in residential treatment centers for adults
- 17 people in group homes for juveniles (non-correctional)
- 13 people in other noninstitutional facilities
- 5 people in residential treatment centers for juveniles (non-correctional)
People in group quarters in Paradise in 2000:
- 287 people in nursing homes
- 133 people in homes for the mentally retarded
- 94 people in other noninstitutional group quarters
- 47 people in homes for the mentally ill
- 24 people in hospitals/wards and hospices for chronically ill
- 24 people in hospices or homes for chronically ill
- 20 people in other group homes
- 8 people in other nonhousehold living situations
- 6 people in unknown juvenile institutions
Banks with branches in Paradise (2011 data):
- Rabobank, National Association: Paradise Clark Road Branch at 6653 Clark Road, branch established on 2003/07/01; Paradise Branch Office at 672 Pearson Raod, branch established on 2001/09/01. Info updated 2011/01/27: Bank assets: $11,745.0 mil, Deposits: $8,446.0 mil, headquarters in Roseville, CA, positive income, Agricultural Specialization, 124 total offices, Holding Company: Cooperatieve Centrale Raiffeisen-Boerenleenbank B.A., "rabobank Nederland
- U.S. Bank National Association: Paradise Branch at 6817 Skyway, branch established on 1926/01/01. Info updated 2012/01/30: Bank assets: $330,470.8 mil, Deposits: $236,091.5 mil, headquarters in Cincinnati, OH, positive income, 3121 total offices, Holding Company: U.S. Bancorp
- Bank of the West: Paradise Branch at 6405 Clark Road, branch established on 1974/01/02. Info updated 2009/11/16: Bank assets: $62,408.3 mil, Deposits: $43,995.2 mil, headquarters in San Francisco, CA, positive income, 647 total offices, Holding Company: Bnp Paribas
- Tri Counties Bank: Paradise at 6848 Q Skyway, branch established on 2000/08/14. Info updated 2011/09/26: Bank assets: $2,554.4 mil, Deposits: $2,191.2 mil, headquarters in Chico, CA, positive income, Commercial Lending Specialization, 71 total offices, Holding Company: Trico Bancshares
- JPMorgan Chase Bank, National Association: Paradise Branch at 6669 Clark Road, branch established on 1889/01/01. Info updated 2011/11/10: Bank assets: $1,811,678.0 mil, Deposits: $1,190,738.0 mil, headquarters in Columbus, OH, positive income, International Specialization, 5577 total offices, Holding Company: Jpmorgan Chase & Co.
- Bank of America, National Association: Paradise Branch at 6295 Skyway Highway, branch established on 1946/07/29. Info updated 2009/11/18: Bank assets: $1,451,969.3 mil, Deposits: $1,077,176.8 mil, headquarters in Charlotte, NC, positive income, 5782 total offices, Holding Company: Bank Of America Corporation
- Wells Fargo Bank, National Association: Paradise Branch at 6930 Skyway Boulevard, branch established on 2000/05/19. Info updated 2011/04/05: Bank assets: $1,161,490.0 mil, Deposits: $905,653.0 mil, headquarters in Sioux Falls, SD, positive income, 6395 total offices, Holding Company: Wells Fargo & Company
For population 15 years and over in Paradise:
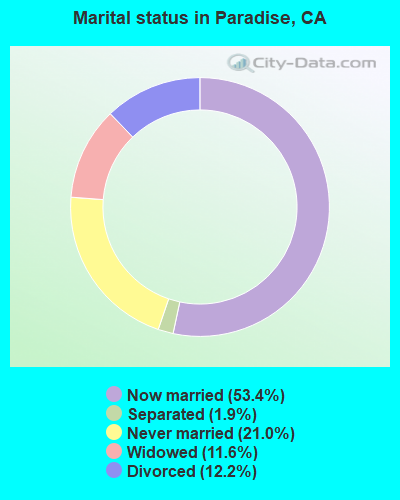
- Never married: 21.0%
- Now married: 53.4%
- Separated: 1.9%
- Widowed: 11.6%
- Divorced: 12.2%
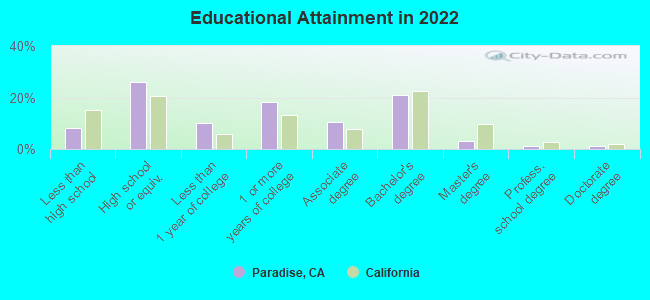
For population 25 years and over in Paradise:
- High school or higher: 92.6%
- Bachelor's degree or higher: 24.5%
- Graduate or professional degree: 5.0%
- Unemployed: 6.8%
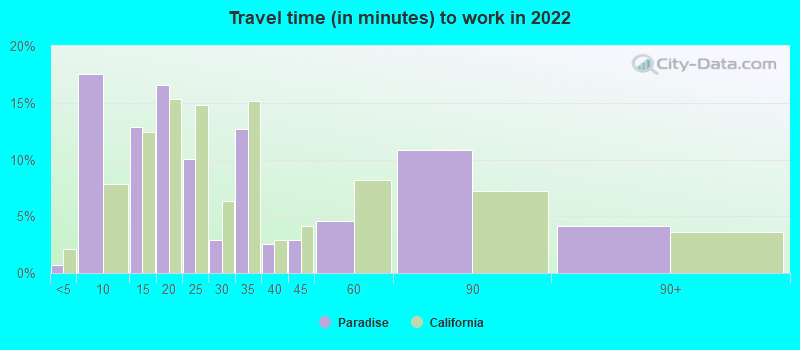
- Mean travel time to work (commute): 87.2 minutes
| Here: | 10.9 |
| California average: | 15.5 |
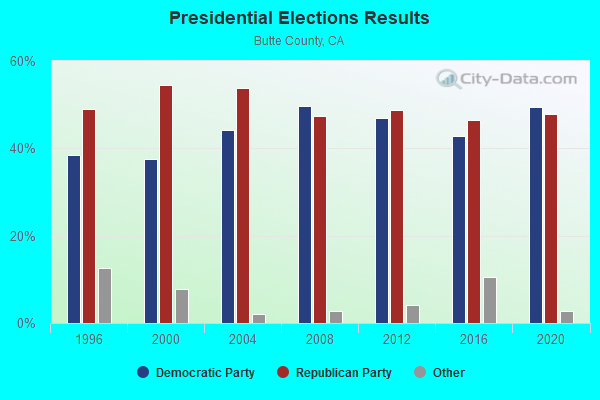
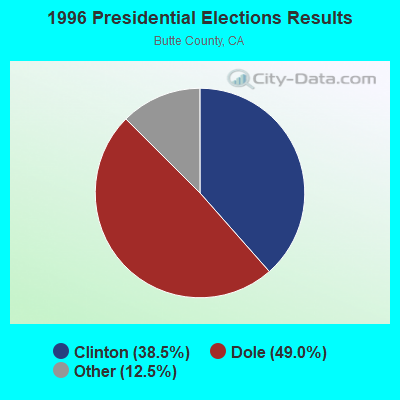
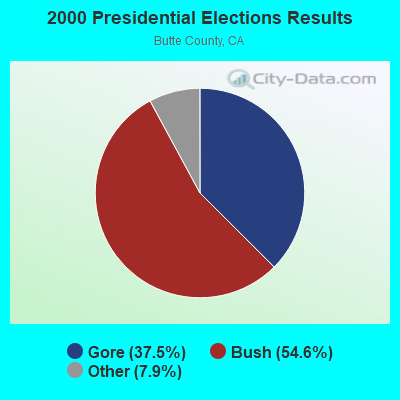
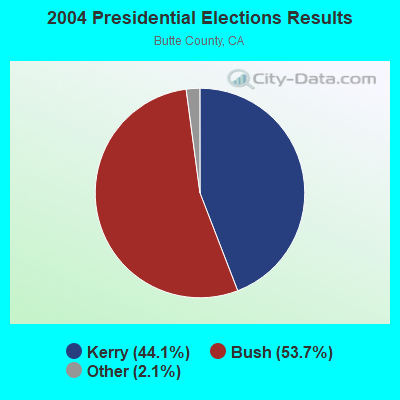
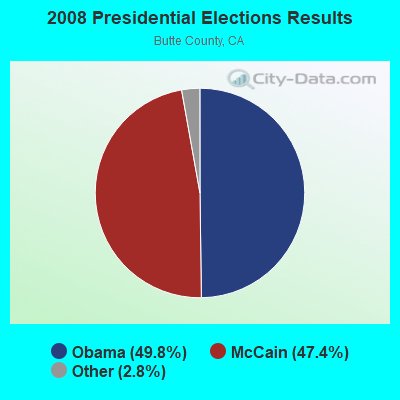
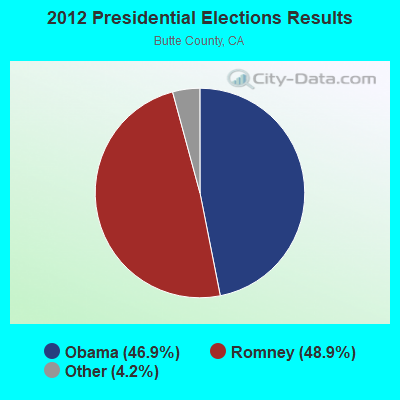
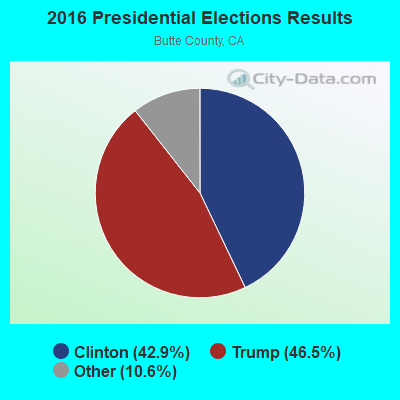
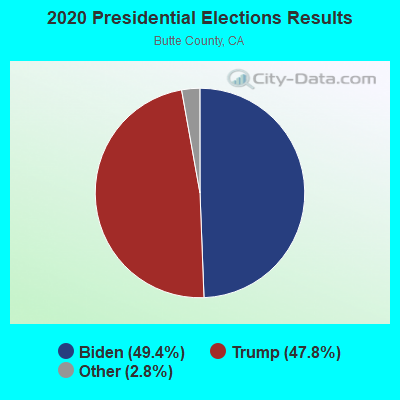
Graphs represent county-level data. Detailed 2008 Election Results
Religion statistics for Paradise, CA (based on Butte County data)
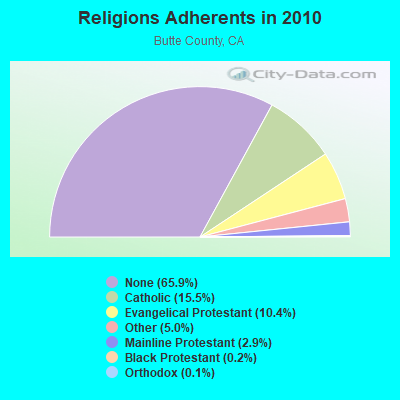
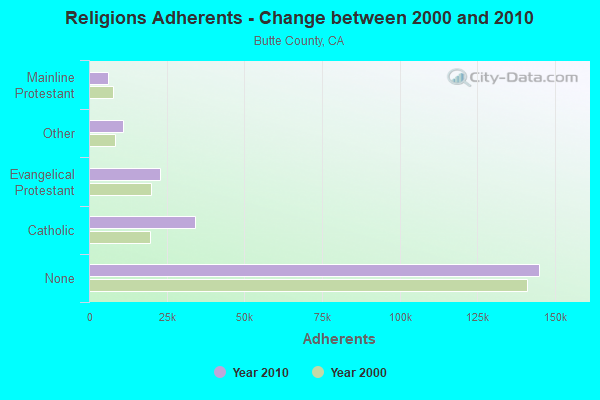
| Religion | Adherents | Congregations |
|---|---|---|
| Catholic | 34,101 | 7 |
| Evangelical Protestant | 22,822 | 129 |
| Other | 11,031 | 36 |
| Mainline Protestant | 6,272 | 24 |
| Black Protestant | 475 | 4 |
| Orthodox | 280 | 2 |
| None | 145,019 | - |
Food Environment Statistics:
| Here: | 2.29 / 10,000 pop. |
| California: | 2.14 / 10,000 pop. |
| Butte County: | 0.09 / 10,000 pop. |
| California: | 0.04 / 10,000 pop. |
| Here: | 0.82 / 10,000 pop. |
| California: | 0.62 / 10,000 pop. |
| Here: | 2.25 / 10,000 pop. |
| State: | 1.49 / 10,000 pop. |
| Butte County: | 6.10 / 10,000 pop. |
| California: | 7.42 / 10,000 pop. |
| Butte County: | 9.0% |
| California: | 7.3% |
| This county: | 25.1% |
| California: | 21.3% |
| Butte County: | 12.3% |
| State: | 17.9% |
Health and Nutrition:
| This city: | 53.5% |
| California: | 49.4% |
| This city: | 50.6% |
| California: | 48.0% |
| This city: | 28.7 |
| California: | 28.1 |
| This city: | 19.3% |
| California: | 20.2% |
| Paradise: | 11.3% |
| California: | 11.2% |
| This city: | 6.9 |
| California: | 6.8 |
| Paradise: | 36.2% |
| State: | 31.5% |
| Paradise: | 57.5% |
| California: | 56.4% |
| Here: | 76.0% |
| California: | 80.9% |
More about Health and Nutrition of Paradise, CA Residents
| Local government employment and payroll (March 2022) | |||||
| Function | Full-time employees | Monthly full-time payroll | Average yearly full-time wage | Part-time employees | Monthly part-time payroll |
|---|---|---|---|---|---|
| Police Protection - Officers | 14 | $134,872 | $115,605 | 1 | $5,421 |
| Sewerage | 13 | $137,463 | $126,889 | 2 | $6,107 |
| Other and Unallocable | 10 | $77,239 | $92,687 | 0 | $0 |
| Other Government Administration | 8 | $65,837 | $98,756 | 5 | $2,159 |
| Housing and Community Development (Local) | 8 | $55,793 | $83,690 | 0 | $0 |
| Police - Other | 7 | $62,472 | $107,095 | 0 | $0 |
| Streets and Highways | 6 | $35,716 | $71,432 | 0 | $0 |
| Financial Administration | 5 | $40,316 | $96,758 | 0 | $0 |
| Health | 2 | $17,750 | $106,500 | 1 | $3,749 |
| Fire - Other | 0 | $0 | 1 | $3,098 | |
| Totals for Government | 73 | $627,458 | $103,144 | 10 | $20,533 |
Paradise government finances - Expenditure in 2017 (per resident):
- Construction - Regular Highways: $533,000 ($81.80)
- Current Operations - Central Staff Services: $4,458,000 ($684.16)
Police Protection: $4,355,000 ($668.35)
Local Fire Protection: $3,546,000 ($544.20)
Regular Highways: $1,731,000 ($265.65)
Health - Other: $172,000 ($26.40)
General - Other: $108,000 ($16.57)
- General - Interest on Debt: $701,000 ($107.58)
- Intergovernmental to Local - Other - Local Fire Protection: $3,211,000 ($492.79)
Other - Transit Utilities: $797,000 ($122.31)
- Total Salaries and Wages: $3,000 ($0.46)
Paradise government finances - Revenue in 2017 (per resident):
- Charges - Other: $375,000 ($57.55)
Parks and Recreation: $21,000 ($3.22)
- Federal Intergovernmental - Other: $668,000 ($102.52)
Housing and Community Development: $186,000 ($28.55)
- Local Intergovernmental - Other: $1,669,000 ($256.14)
- Miscellaneous - General Revenue - Other: $511,000 ($78.42)
Fines and Forfeits: $92,000 ($14.12)
Interest Earnings: $30,000 ($4.60)
- State Intergovernmental - Other: $2,705,000 ($415.13)
Highways: $517,000 ($79.34)
General Local Government Support: $67,000 ($10.28)
- Tax - Property: $7,107,000 ($1090.70)
General Sales and Gross Receipts: $3,192,000 ($489.87)
Public Utilities Sales: $976,000 ($149.79)
Other License: $963,000 ($147.79)
Other Selective Sales: $211,000 ($32.38)
Documentary and Stock Transfer: $88,000 ($13.51)
Paradise government finances - Debt in 2017 (per resident):
- Long Term Debt - Beginning Outstanding - Unspecified Public Purpose: $17,389,000 ($2668.66)
Outstanding Unspecified Public Purpose: $15,606,000 ($2395.03)
Retired Unspecified Public Purpose: $2,010,000 ($308.47)
Issue, Unspecified Public Purpose: $227,000 ($34.84)
Paradise government finances - Cash and Securities in 2017 (per resident):
- Bond Funds - Cash and Securities: $289,000 ($44.35)
- Other Funds - Cash and Securities: $16,694,000 ($2562.00)
| Businesses in Paradise, CA | ||||
| Name | Count | Name | Count | |
|---|---|---|---|---|
| AT&T | 1 | Kmart | 1 | |
| Ace Hardware | 1 | Lane Furniture | 1 | |
| AutoZone | 1 | Little Caesars Pizza | 1 | |
| Baskin-Robbins | 1 | McDonald's | 1 | |
| Big O Tires | 1 | Quiznos | 1 | |
| Burger King | 1 | RadioShack | 1 | |
| CVS | 1 | Rite Aid | 1 | |
| Comfort Inn | 1 | Sears | 1 | |
| Curves | 1 | T-Mobile | 1 | |
| FedEx | 4 | Taco Bell | 1 | |
| GNC | 1 | U-Haul | 3 | |
| H&R Block | 1 | UPS | 5 | |
| Jack In The Box | 1 | Vans | 1 | |
| Jones New York | 1 | Vons | 1 | |
| KFC | 1 | Walgreens | 1 | |
Strongest AM radio stations in Paradise:
- KKXX (930 AM; 1 kW; PARADISE, CA; Owner: BUTTE BROADCASTING COMPANY, INC.)
- KPAY (1290 AM; 5 kW; CHICO, CA; Owner: CAPSTAR TX LIMITED PARTNERSHIP)
- KFBK (1530 AM; 50 kW; SACRAMENTO, CA; Owner: AMFM RADIO LICENSES, L.L.C.)
- KFIA (710 AM; 25 kW; CARMICHAEL, CA; Owner: VISTA BROADCASTING INC.)
- KKOH (780 AM; 50 kW; RENO, NV; Owner: CITADEL BROADCASTING COMPANY)
- KHTK (1140 AM; 50 kW; SACRAMENTO, CA; Owner: INFINITY RADIO SUBSIDIARY OPERATIONS INC.)
- KSTE (650 AM; 25 kW; RANCHO CORDOVA, CA; Owner: AMFM RADIO LICENSES, L.L.C.)
- KCBS (740 AM; 50 kW; SAN FRANCISCO, CA; Owner: INFINITY BROADCASTING OPERATIONS, INC.)
- KCBC (770 AM; 50 kW; RIVERBANK, CA; Owner: KIERTRON, INC.)
- KTRB (860 AM; 50 kW; MODESTO, CA; Owner: PAPPAS RADIO OF CALIFORNIA, A CALIFORNIA LIMITED PARTNERSHIP)
- KNBR (680 AM; 50 kW; SAN FRANCISCO, CA; Owner: KNBR LICO, INC.)
- KEWE (1340 AM; 1 kW; OROVILLE, CA; Owner: CLEAR CHANNEL BROADCASTING LICENSES, INC.)
- KGO (810 AM; 50 kW; SAN FRANCISCO, CA; Owner: KGO-AM RADIO, INC.)
Strongest FM radio stations in Paradise:
- KLRS (92.7 FM; CHICO, CA; Owner: RESULTS RADIO LICENSEE, LLC)
- KZFR (90.1 FM; CHICO, CA; Owner: GOLDEN VALLEY COMMUNITY BROADCASTERS)
- KHAP (89.1 FM; CHICO, CA; Owner: FAMILY STATIONS, INC.)
- KYIX (104.9 FM; SOUTH OROVILLE, CA; Owner: BUTTE BROADCASTING COMPANY, INC.)
- K258AQ (99.5 FM; YANKEE HILL, CA; Owner: CALVARY CHAPEL OF TWIN FALLS, INC.)
- K216CF (91.1 FM; CHICO, CA; Owner: YOUR CHRISTIAN COMPANION NETWORK, INC.)
- KLVC (88.3 FM; MAGALIA, CA; Owner: EDUCATIONAL MEDIA FOUNDATION)
- KZAP (96.7 FM; PARADISE, CA; Owner: REGENT LICENSEE OF CHICO, INC.)
- KHSL-FM (103.5 FM; PARADISE, CA; Owner: CAPSTAR TX LIMITED PARTNERSHIP)
- KMXI (95.1 FM; CHICO, CA; Owner: CAPSTAR TX LIMITED PARTNERSHIP)
- KCHO (91.7 FM; CHICO, CA; Owner: UNIV. FOUNDATION/CA. ST. UNIV. CHICO)
- KFMF (93.9 FM; CHICO, CA; Owner: REGENT LICENSEE OF CHICO, INC)
- KHHZ (97.7 FM; OROVILLE, CA; Owner: CLEAR CHANNEL BROADCASTING LICENSES, INC.)
- KHGQ (100.3 FM; QUINCY, CA; Owner: KEILY MILLER)
- K205EJ (88.9 FM; CHESTER, CA; Owner: CALVARY CHAPEL OF TWIN FALLS, INC.)
- KRCX-FM (99.9 FM; MARYSVILLE, CA; Owner: ENTRAVISION HOLDINGS, LLC)
- KTOR (99.7 FM; WESTWOOD, CA; Owner: SIERRA RADIO, INC.)
- KBNF (98.9 FM; CHESTER, CA; Owner: CAROUSEL BROADCASTING, INC.)
- K209AY (89.7 FM; CHESTER, CA; Owner: THE UNIV. FOUND. CA STATE UNIVERSITY)
- KMJE (101.5 FM; GRIDLEY, CA; Owner: RESULTS RADIO LICENSEE, LLC)
TV broadcast stations around Paradise:
- KCVU (Channel 30; PARADISE, CA; Owner: SAINTE PARTNERS II, L.P.)
- K53FT (Channel 53; CHICO, CA; Owner: TRINITY BROADCASTING NETWORK)
- K02OA (Channel 2; CHICO, CA; Owner: FAMILY STATIONS, INC.)
- KNVN (Channel 24; CHICO, CA; Owner: CHICO LICENSE, L.L.C.)
- K05EM (Channel 5; PARADISE, CA; Owner: CALIFORNIA BROADCASTING, INC.)
- K18AO (Channel 18; OROVILLE/PARADISE, CA; Owner: CHICO LICENSE, L.L.C.)
- KHSL-TV (Channel 12; CHICO, CA; Owner: CATAMOUNT BROADCASTING OF CHICO-REDDING, INC.)
- KKPM-CA (Channel 28; CHICO, CA; Owner: PAUL STRIEBY & MATT TUTER)
- KZVU-LP (Channel 22; CHICO, CA; Owner: SAINTE PARTNERS II, L.P.)
- K49CT (Channel 49; PARADISE, CA; Owner: CATAMOUNT BROADCASTING OF CHICO-REDDING, INC.)
- K15CX (Channel 15; OROVILLE, CA; Owner: CALIFORNIA BROADCASTING, INC.)
FCC Registered Antenna Towers: 50 (See the full list of FCC Registered Antenna Towers)
FCC Registered Commercial Land Mobile Towers: 3 (See the full list of FCC Registered Commercial Land Mobile Towers in Paradise, CA)
FCC Registered Private Land Mobile Towers: 1 (See the full list of FCC Registered Private Land Mobile Towers)
FCC Registered Broadcast Land Mobile Towers: 18 (See the full list of FCC Registered Broadcast Land Mobile Towers)
FCC Registered Microwave Towers: 22 (See the full list of FCC Registered Microwave Towers in this town)
FCC Registered Paging Towers: 1 (See the full list of FCC Registered Paging Towers)
FCC Registered Maritime Coast & Aviation Ground Towers: 1 (See the full list of FCC Registered Maritime Coast & Aviation Ground Towers)
FCC Registered Amateur Radio Licenses: 296 (See the full list of FCC Registered Amateur Radio Licenses in Paradise)
FAA Registered Aircraft Manufacturers and Dealers: 5 (See the full list of FAA Registered Manufacturers and Dealers in Paradise)
FAA Registered Aircraft: 32 (See the full list of FAA Registered Aircraft)
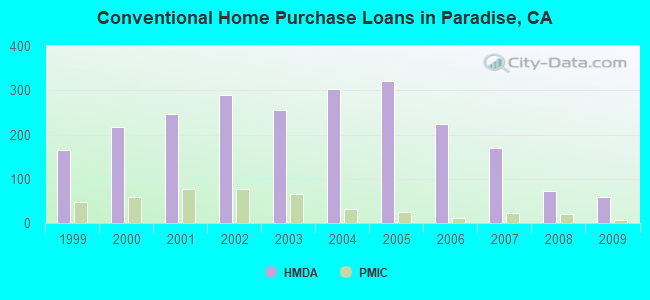
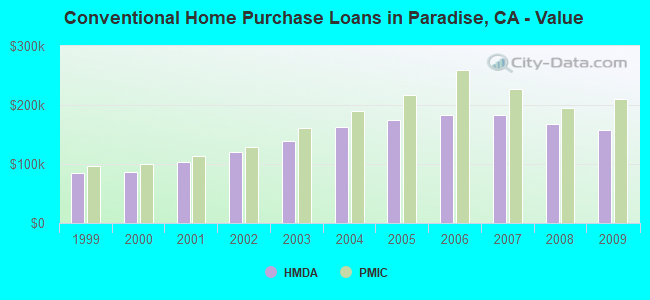
| Home Mortgage Disclosure Act Aggregated Statistics For Year 2009 (Based on 1 full and 4 partial tracts) | ||||||||||||||
| A) FHA, FSA/RHS & VA Home Purchase Loans | B) Conventional Home Purchase Loans | C) Refinancings | D) Home Improvement Loans | E) Loans on Dwellings For 5+ Families | F) Non-occupant Loans on < 5 Family Dwellings (A B C & D) | G) Loans On Manufactured Home Dwelling (A B C & D) | ||||||||
|---|---|---|---|---|---|---|---|---|---|---|---|---|---|---|
| Number | Average Value | Number | Average Value | Number | Average Value | Number | Average Value | Number | Average Value | Number | Average Value | Number | Average Value | |
| LOANS ORIGINATED | 61 | $179,024 | 59 | $156,897 | 218 | $182,038 | 14 | $131,899 | 1 | $132,720 | 29 | $125,469 | 8 | $117,981 |
| APPLICATIONS APPROVED, NOT ACCEPTED | 3 | $160,533 | 12 | $163,441 | 32 | $183,428 | 3 | $19,027 | 0 | $0 | 6 | $182,510 | 0 | $0 |
| APPLICATIONS DENIED | 12 | $173,787 | 10 | $130,598 | 93 | $202,787 | 7 | $64,116 | 0 | $0 | 15 | $133,138 | 7 | $71,576 |
| APPLICATIONS WITHDRAWN | 7 | $223,143 | 12 | $162,757 | 66 | $188,847 | 4 | $50,150 | 0 | $0 | 9 | $127,574 | 3 | $136,823 |
| FILES CLOSED FOR INCOMPLETENESS | 1 | $96,410 | 1 | $75,530 | 16 | $165,832 | 1 | $85,560 | 0 | $0 | 2 | $136,875 | 0 | $0 |
Detailed HMDA statistics for the following Tracts: 0018.00 , 0019.00, 0020.00, 0021.00, 0023.00
| Private Mortgage Insurance Companies Aggregated Statistics For Year 2009 (Based on 1 full and 4 partial tracts) | ||||||
| A) Conventional Home Purchase Loans | B) Refinancings | C) Non-occupant Loans on < 5 Family Dwellings (A & B) | ||||
|---|---|---|---|---|---|---|
| Number | Average Value | Number | Average Value | Number | Average Value | |
| LOANS ORIGINATED | 6 | $210,252 | 0 | $0 | 1 | $291,120 |
| APPLICATIONS APPROVED, NOT ACCEPTED | 1 | $174,350 | 3 | $338,577 | 0 | $0 |
| APPLICATIONS DENIED | 2 | $81,725 | 5 | $190,562 | 0 | $0 |
| APPLICATIONS WITHDRAWN | 2 | $192,625 | 1 | $192,010 | 0 | $0 |
| FILES CLOSED FOR INCOMPLETENESS | 0 | $0 | 1 | $167,220 | 0 | $0 |
Detailed PMIC statistics for the following Tracts: 0018.00 , 0019.00, 0020.00, 0021.00, 0023.00
2003 - 2018 National Fire Incident Reporting System (NFIRS) incidents
- Fire incident types reported to NFIRS in Paradise, CA
- 38251.1%Structure Fires
- 23331.1%Outside Fires
- 10013.4%Mobile Property/Vehicle Fires
- 334.4%Other
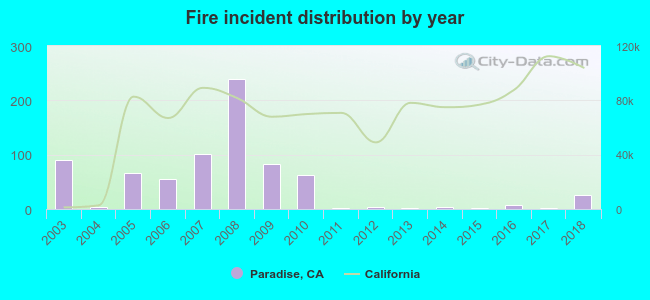 Based on the data from the years 2003 - 2018 the average number of fires per year is 47. The highest number of fires - 240 took place in 2008, and the least - 1 in 2015. The data has a dropping trend.
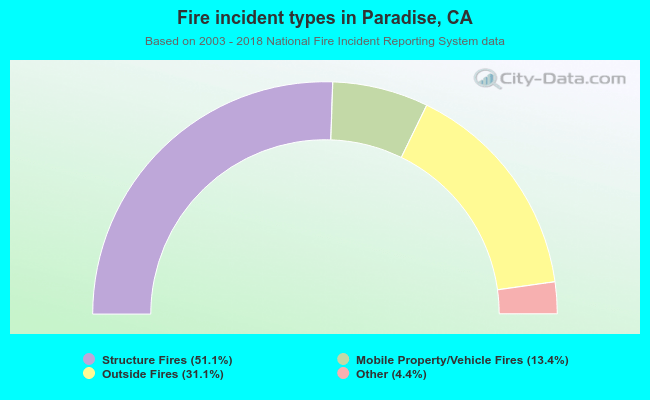 When looking into fire subcategories, the most incidents belonged to: Structure Fires (51.1%), and Outside Fires (31.1%).
| Most common first names in Paradise, CA among deceased individuals | ||
| Name | Count | Lived (average) |
|---|---|---|
| John | 356 | 76.0 years |
| William | 333 | 78.4 years |
| Robert | 302 | 74.8 years |
| Charles | 230 | 77.9 years |
| Mary | 225 | 82.7 years |
| James | 216 | 75.8 years |
| George | 186 | 79.7 years |
| Dorothy | 146 | 80.1 years |
| Helen | 143 | 81.9 years |
| Frank | 136 | 78.9 years |
| Most common last names in Paradise, CA among deceased individuals | ||
| Last name | Count | Lived (average) |
|---|---|---|
| Smith | 160 | 81.1 years |
| Johnson | 96 | 76.9 years |
| Jones | 83 | 78.4 years |
| Williams | 80 | 77.2 years |
| Anderson | 75 | 77.8 years |
| Miller | 69 | 78.7 years |
| Wilson | 69 | 79.9 years |
| Davis | 66 | 80.2 years |
| Moore | 64 | 79.5 years |
| White | 51 | 78.8 years |
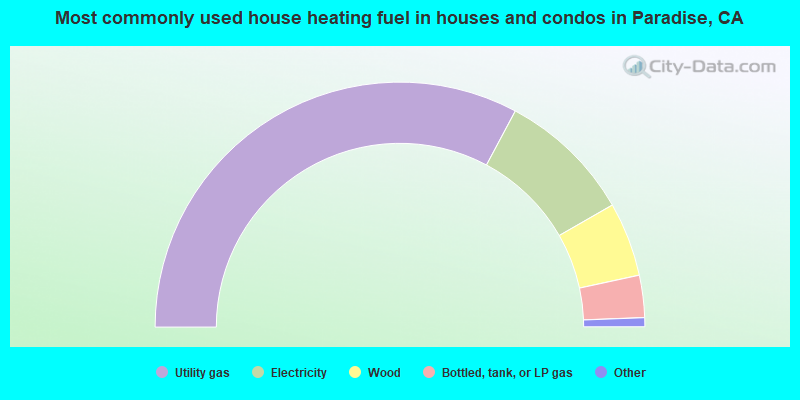
- 65.7%Utility gas
- 17.8%Electricity
- 9.8%Wood
- 5.6%Bottled, tank, or LP gas
- 0.9%No fuel used
- 0.2%Solar energy
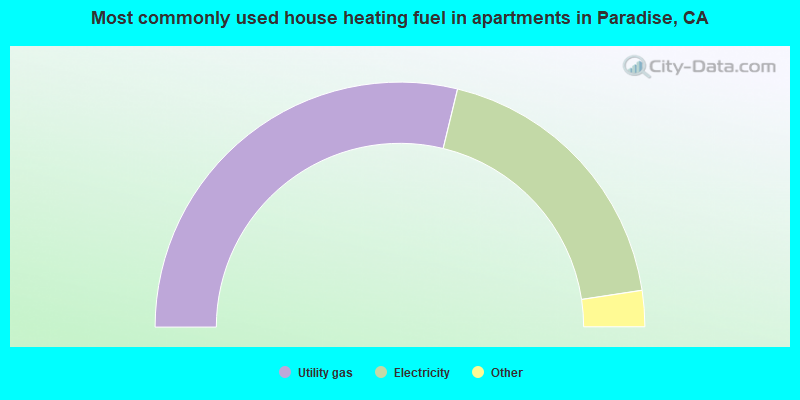
- 57.7%Utility gas
- 37.7%Electricity
- 2.3%Wood
- 1.8%Bottled, tank, or LP gas
- 0.6%Solar energy
Paradise compared to California state average:
- Median household income below state average.
- Median house value below state average.
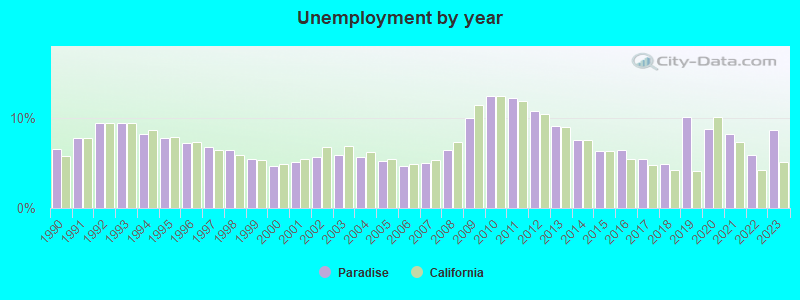
- Unemployed percentage below state average.
- Black race population percentage significantly below state average.
- Hispanic race population percentage significantly below state average.
- Median age significantly above state average.
- Foreign-born population percentage significantly below state average.
- House age below state average.
- Number of college students significantly below state average.
Paradise on our top lists:
- #31 on the list of "Top 101 cities with largest percentage of males in occupations: health technologists and technicians (population 5,000+)"
- #32 on the list of "Top 101 cities with largest percentage of males in industries: health care and social assistance (population 5,000+)"
- #46 on the list of "Top 101 cities with largest percentage of females in industries: health care and social assistance (population 5,000+)"
- #66 on the list of "Top 101 cities with the largest percentage of people in hospices or homes for chronically ill (population 1,000+)"
- #83 on the list of "Top 101 cities with the lowest number of police officers per 1000 residents (population 5,000+)"
- #12 on the list of "Top 101 counties with the lowest lead air pollution readings in 2012 (µg/m3)"
- #15 on the list of "Top 101 counties with the highest carbon monoxide air pollution readings in 2012 (ppm)"
- #17 on the list of "Top 101 counties with the highest lead air pollution readings in 2012 (µg/m3)"
- #18 on the list of "Top 101 counties with highest percentage of residents voting for 3rd party candidates in the 2012 Presidential Election (pop. 50,000+)"
- #37 on the list of "Top 101 counties with the lowest percentage of residents relocating to foreign countries in 2011"

|
|
Total of 30 patent applications in 2008-2024.