Pauma Valley, California
Submit your own pictures of this place and show them to the world
- OSM Map
- General Map
- Google Map
- MSN Map

| Males: 3,866 | |
| Females: 3,609 |
| Median resident age: | 31.5 years |
| California median age: | 33.3 years |
Zip code: 92082
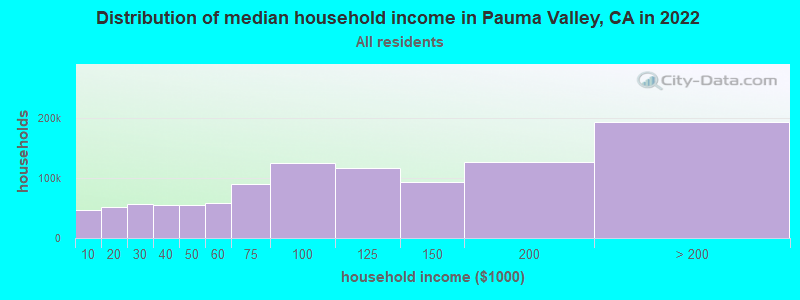
| Pauma Valley: | $89,772 |
| CA: | $91,551 |
Estimated per capita income in 2022: $35,803 (it was $17,009 in 2000)
Pauma Valley CCD income, earnings, and wages data
Estimated median house or condo value in 2022: $817,049 (it was $204,600 in 2000)
| Pauma Valley: | $817,049 |
| CA: | $715,900 |
Mean prices in 2022: all housing units: over $1,000,000; detached houses: over $1,000,000; townhouses or other attached units: $769,037; in 2-unit structures: over $1,000,000; in 3-to-4-unit structures: $948,790; in 5-or-more-unit structures: $697,244; mobile homes: $174,850; occupied boats, rvs, vans, etc.: $27,331
Detailed information about poverty and poor residents in Pauma Valley, CA

Compare current foreclosures near Pauma Valley, CA:
| Photo | Address | Area | Beds / Baths | Price | Details |
|---|---|---|---|---|---|

|
#1
Pebble Brook Cir
Temecula, CA 92592
|
3,573 sq. feet
|
3 baths 4 beds |
$977,600
|
show details |

|
#2
Lyndie Ln Unit 2
Temecula, CA 92591
|
1,004 sq. feet
|
2 baths 2 beds |
show details | |

|
#3
Diamond Way Apt 249
Vista, CA 92083
|
878 sq. feet
|
2 baths 2 beds |
show details | |

|
#4
Calle Lumina
Temecula, CA 92592
|
- sq. feet
|
2 baths 5 beds |
show details | |

|
#5
Mira Loma Dr
Temecula, CA 92592
|
1,645 sq. feet
|
1 baths 4 beds |
show details | |

|
#6
Capricho Cir
Temecula, CA 92590
|
3,248 sq. feet
|
3 baths 4 beds |
show details | |

|
#7
Alehzon Cir
Temecula, CA 92592
|
2,685 sq. feet
|
2 baths 5 beds |
show details | |

|
#8
Us Highway 371
Aguanga, CA 92536
|
1,440 sq. feet
|
2 baths 2 beds |
show details | |

|
#9
Oakville Ct
Temecula, CA 92592
|
2,895 sq. feet
|
2 baths 3 beds |
show details | |

|
#10
Cottonwood St
Murrieta, CA 92563
|
2,797 sq. feet
|
3 baths 4 beds |
show details |
| Photo | Address | Area | Beds / Baths | Price | Details |
|---|---|---|---|---|---|

|
#11
La Morre Rd #11
San Marcos, CA 92078
|
1,792 sq. feet
|
2 baths 3 beds |
show details | |

|
#12
Citracado Pkwy
Escondido, CA 92029
|
- sq. feet
|
2 baths 3 beds |
show details | |

|
#13
Tierra Robles Pl
Temecula, CA 92592
|
1,645 sq. feet
|
1 baths 4 beds |
show details | |

|
#14
Amparo Dr
Escondido, CA 92025
|
4,084 sq. feet
|
4 baths 5 beds |
show details | |

|
#15
Lisbon Pl
Escondido, CA 92029
|
1,696 sq. feet
|
2 baths 3 beds |
show details | |

|
#16
Nancy St
Escondido, CA 92027
|
1,360 sq. feet
|
2 baths 3 beds |
show details | |

|
#17
Paul St
Escondido, CA 92027
|
1,280 sq. feet
|
2 baths 3 beds |
show details | |

|
#18
Tuscan Creek Way
Temecula, CA 92592
|
3,335 sq. feet
|
3 baths 5 beds |
show details | |

|
#19
Idaho Ave
Escondido, CA 92027
|
4,040 sq. feet
|
3 baths 3 beds |
show details | |

|
#20
Calle Arevalo
Temecula, CA 92592
|
1,940 sq. feet
|
2 baths 2 beds |
show details |
| Photo | Address | Area | Beds / Baths | Price | Details |
|---|---|---|---|---|---|

|
#21
Dartmoor Cir
Oceanside, CA 92057
|
2,136 sq. feet
|
3 baths 4 beds |
show details | |

|
#22
Harriet St
Oceanside, CA 92056
|
1,612 sq. feet
|
2 baths 3 beds |
show details | |

|
#23
Fieldgate Rd
Oceanside, CA 92056
|
1,658 sq. feet
|
2 baths 3 beds |
show details | |

|
#24
Longfellow Ct
Oceanside, CA 92057
|
2,394 sq. feet
|
2 baths 3 beds |
show details | |

|
#25
Bronco Cir
Temecula, CA 92592
|
1,537 sq. feet
|
2 baths 3 beds |
show details | |

|
#26
Stanley Ct
Escondido, CA 92026
|
1,203 sq. feet
|
2 baths 3 beds |
show details | |

|
#27
Portland Ct
Temecula, CA 92591
|
1,670 sq. feet
|
2 baths 3 beds |
show details | |

|
#28
Montage Rd
Oceanside, CA 92057
|
1,957 sq. feet
|
2 baths 4 beds |
show details | |

|
#29
Parkview Dr
Oceanside, CA 92057
|
3,014 sq. feet
|
4 baths 4 beds |
show details | |

|
#30
Valley Center Rd
Valley Center, CA 92082
|
2,460 sq. feet
|
3 baths 3 beds |
show details |
| Photo | Address | Area | Beds / Baths | Price | Details |
|---|---|---|---|---|---|

|
#31
Via Oeste Dr
Fallbrook, CA 92028
|
4,650 sq. feet
|
3 baths 5 beds |
show details | |

|
#32
Rancho Vista Rd
Vista, CA 92083
|
1,504 sq. feet
|
2 baths 5 beds |
show details | |

|
#33
Milano Rd
Temecula, CA 92591
|
2,198 sq. feet
|
3 baths 4 beds |
show details | |

|
#34
Mar Vista Dr
Vista, CA 92083
|
1,923 sq. feet
|
2 baths 4 beds |
show details | |

|
#35
Casita Ln
San Marcos, CA 92069
|
2,852 sq. feet
|
3 baths 4 beds |
show details | |

|
#36
Tanager Cir
Temecula, CA 92591
|
1,834 sq. feet
|
2 baths 3 beds |
show details | |

|
#37
Salinas Dr
Murrieta, CA 92563
|
2,160 sq. feet
|
3 baths 4 beds |
show details | |

|
#38
Rancheros Dr Spc 27
San Marcos, CA 92069
|
1,152 sq. feet
|
2 baths 3 beds |
show details | |

|
#39
Pecan Ct
Vista, CA 92083
|
1,450 sq. feet
|
2 baths 3 beds |
show details | |

|
#40
Jon Christian Pl
Temecula, CA 92591
|
1,487 sq. feet
|
2 baths 3 beds |
show details |
| Photo | Address | Area | Beds / Baths | Price | Details |
|---|---|---|---|---|---|

|
#41
Greenway Rd
Oceanside, CA 92057
|
3,300 sq. feet
|
4 baths 4 beds |
show details | |

|
#42
Darwin Dr
Oceanside, CA 92056
|
1,763 sq. feet
|
2 baths 4 beds |
show details | |

|
#43
Valpreda Rd
San Marcos, CA 92069
|
1,897 sq. feet
|
2 baths 3 beds |
show details | |

|
#44
Palmera Dr
Oceanside, CA 92056
|
2,057 sq. feet
|
2 baths 4 beds |
show details | |

|
#45
Casita Ln
San Marcos, CA 92069
|
3,035 sq. feet
|
3 baths 3 beds |
show details | |

|
#46
La Moree Rd Spc 11
San Marcos, CA 92078
|
1,792 sq. feet
|
2 baths 3 beds |
show details | |

|
#47
Idaho Ave
Escondido, CA 92027
|
4,040 sq. feet
|
3 baths 3 beds |
show details | |

|
#48
W 2nd Ave Unit 1108
Escondido, CA 92025
|
1,864 sq. feet
|
2 baths 3 beds |
show details | |

|
#49
E 3rd Ave
Escondido, CA 92025
|
1,393 sq. feet
|
2 baths 3 beds |
show details | |

|
Check over 1 million property listings on Foreclosure.com!
|
browse all offers | |||

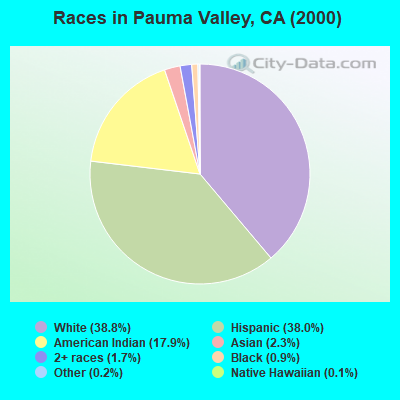
- 2,75538.8%White alone
- 2,70038.0%Hispanic
- 1,27317.9%American Indian alone
- 1602.3%Asian alone
- 1211.7%Two or more races
- 650.9%Black alone
- 140.2%Other race alone
- 90.1%Native Hawaiian and Other
Pacific Islander alone
According to our research of California and other state lists, there were 6 registered sex offenders living in Pauma Valley, California as of April 23, 2024.
The ratio of all residents to sex offenders in Pauma Valley is 1,246 to 1.
The ratio of registered sex offenders to all residents in this city is lower than the state average.
 Recent articles from our blog. Our writers, many of them Ph.D. graduates or candidates, create easy-to-read articles on a wide variety of topics.
Current Local Time: PST time zone
Elevation: 800 feet
Land area: 96.5 square miles.
Population density: 77 people per square mile (very low).

| Pauma Valley CCD: | 0.8% ($1,722) |
| California: | 0.8% ($1,564) |
Nearest city with pop. 50,000+: Temecula, CA  (12.5 miles , pop. 57,716).
Nearest city with pop. 200,000+: San Diego, CA (38.9 miles , pop. 1,223,400).
Nearest cities:
), Latitude: 33.34 N, Longitude: 117.04 W
Area code: 760

Pauma Valley tourist attractions:
| Here: | 4.3% |
| California: | 5.1% |
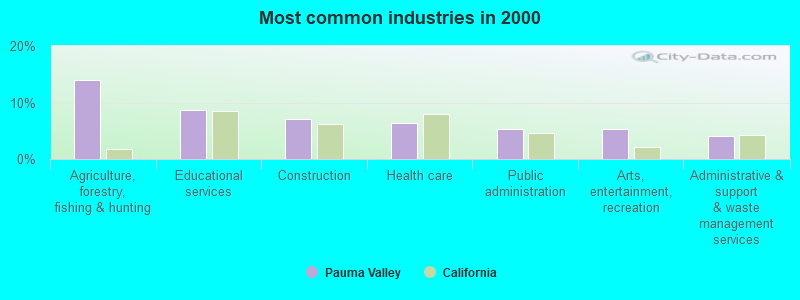
- Agriculture, forestry, fishing & hunting (14.0%)
- Educational services (8.8%)
- Construction (7.0%)
- Health care (6.4%)
- Public administration (5.3%)
- Arts, entertainment, recreation (5.3%)
- Administrative & support & waste management services (4.1%)
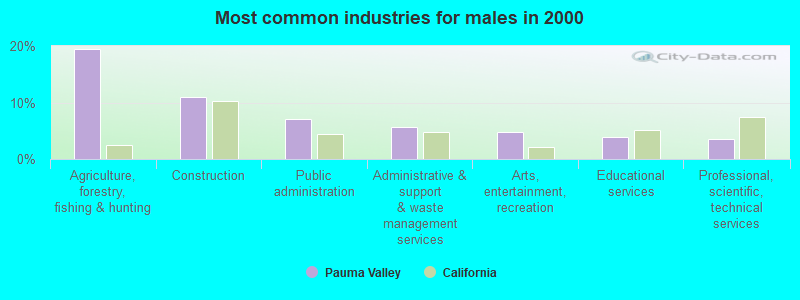
- Agriculture, forestry, fishing & hunting (19.5%)
- Construction (11.0%)
- Public administration (7.0%)
- Administrative & support & waste management services (5.7%)
- Arts, entertainment, recreation (4.9%)
- Educational services (3.9%)
- Professional, scientific, technical services (3.6%)
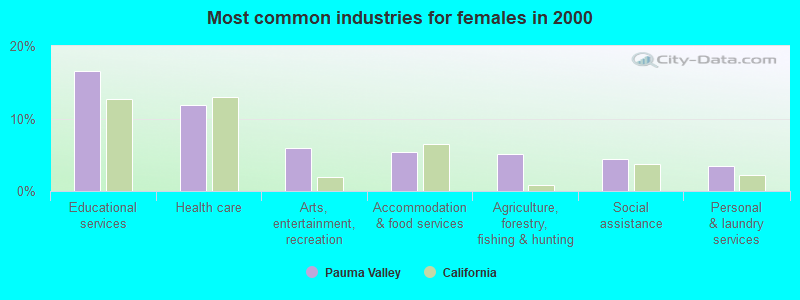
- Educational services (16.6%)
- Health care (11.8%)
- Arts, entertainment, recreation (6.0%)
- Accommodation & food services (5.4%)
- Agriculture, forestry, fishing & hunting (5.1%)
- Social assistance (4.4%)
- Personal & laundry services (3.4%)

- Agricultural workers, including supervisors (10.1%)
- Building and grounds cleaning and maintenance occupations (6.0%)
- Other management occupations, except farmers and farm managers (4.2%)
- Other production occupations, including supervisors (4.0%)
- Farmers and farm managers (3.0%)
- Material recording, scheduling, dispatching, and distributing workers (2.9%)
- Computer specialists (2.9%)
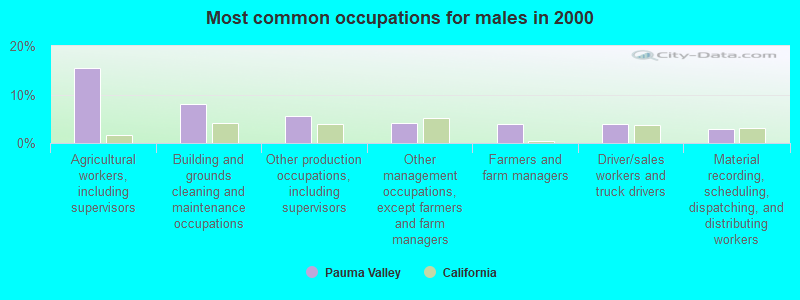
- Agricultural workers, including supervisors (15.5%)
- Building and grounds cleaning and maintenance occupations (8.1%)
- Other production occupations, including supervisors (5.6%)
- Other management occupations, except farmers and farm managers (4.2%)
- Farmers and farm managers (4.0%)
- Driver/sales workers and truck drivers (3.9%)
- Material recording, scheduling, dispatching, and distributing workers (3.0%)
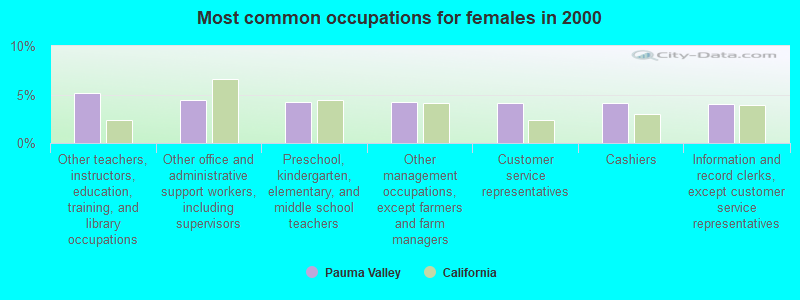
- Other teachers, instructors, education, training, and library occupations (5.2%)
- Other office and administrative support workers, including supervisors (4.4%)
- Preschool, kindergarten, elementary, and middle school teachers (4.2%)
- Other management occupations, except farmers and farm managers (4.2%)
- Customer service representatives (4.1%)
- Cashiers (4.1%)
- Information and record clerks, except customer service representatives (4.0%)
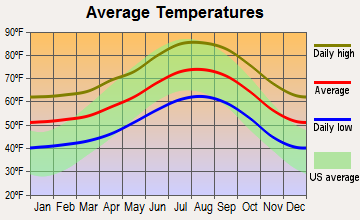
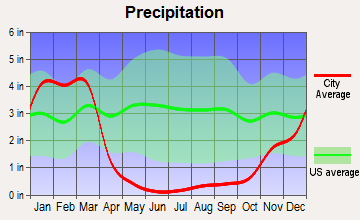
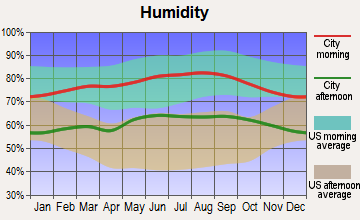
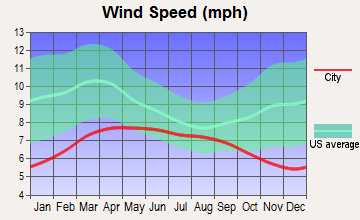
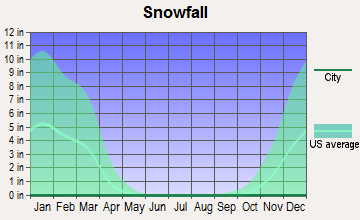
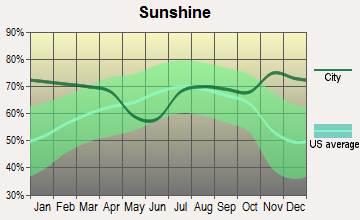
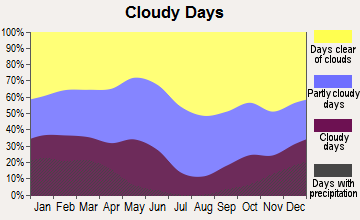
Average climate in Pauma Valley, California
Based on data reported by over 4,000 weather stations
(lower is better)
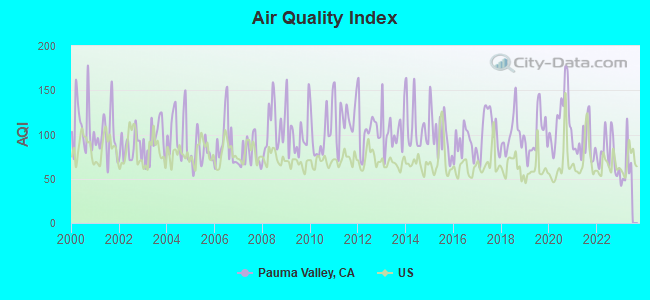
Air Quality Index (AQI) level in 2022 was 78.3. This is about average.
| City: | 78.3 |
| U.S.: | 72.6 |
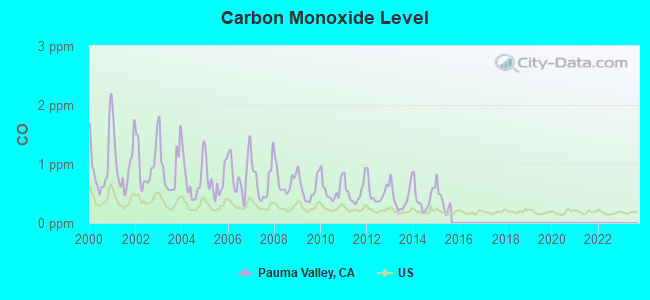
Carbon Monoxide (CO) [ppm] level in 2015 was 0.391. This is significantly worse than average. Closest monitor was 12.3 miles away from the city center.
| City: | 0.391 |
| U.S.: | 0.251 |
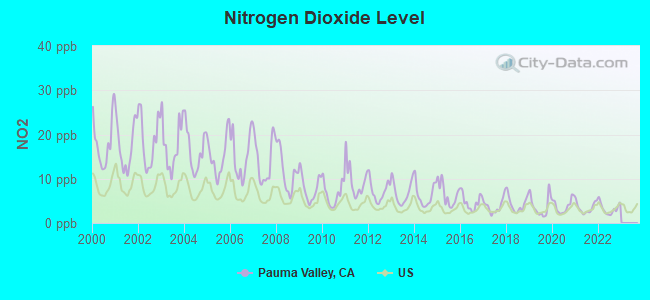
Nitrogen Dioxide (NO2) [ppb] level in 2022 was 3.23. This is significantly better than average. Closest monitor was 8.2 miles away from the city center.
| City: | 3.23 |
| U.S.: | 5.11 |
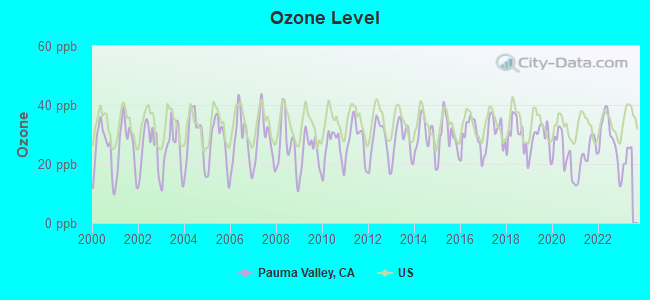
Ozone [ppb] level in 2022 was 29.1. This is about average. Closest monitor was 3.3 miles away from the city center.
| City: | 29.1 |
| U.S.: | 33.3 |
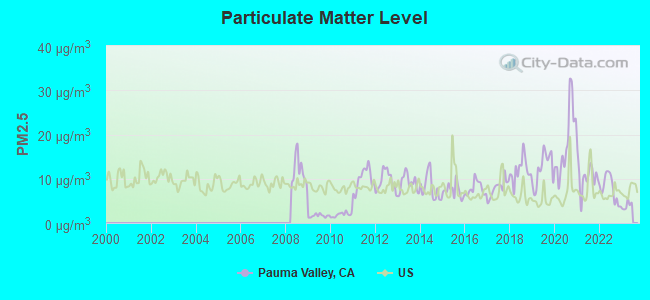
Particulate Matter (PM2.5) [µg/m3] level in 2022 was 7.76. This is about average. Closest monitor was 3.3 miles away from the city center.
| City: | 7.76 |
| U.S.: | 8.11 |
Earthquake activity:
Pauma Valley-area historical earthquake activity is significantly above California state average. It is 6567% greater than the overall U.S. average.On 6/28/1992 at 11:57:34, a magnitude 7.6 (6.2 MB, 7.6 MS, 7.3 MW, Depth: 0.7 mi, Class: Major, Intensity: VIII - XII) earthquake occurred 65.6 miles away from the city center, causing 3 deaths (1 shaking deaths, 2 other deaths) and 400 injuries, causing $100,000,000 total damage and $40,000,000 insured losses
On 7/21/1952 at 11:52:14, a magnitude 7.7 (7.7 UK) earthquake occurred 160.6 miles away from Pauma Valley center, causing $50,000,000 total damage
On 10/16/1999 at 09:46:44, a magnitude 7.4 (6.3 MB, 7.4 MS, 7.2 MW, 7.3 ML) earthquake occurred 88.7 miles away from Pauma Valley center
On 5/19/1940 at 04:36:40, a magnitude 7.2 (7.2 UK) earthquake occurred 78.2 miles away from the city center, causing $33,000,000 total damage
On 12/31/1934 at 18:45:56, a magnitude 7.1 (7.1 UK) earthquake occurred 86.9 miles away from the city center
On 10/15/1979 at 23:16:54, a magnitude 7.0 (5.7 MB, 6.9 MS, 7.0 ML, 6.4 MW) earthquake occurred 89.0 miles away from Pauma Valley center
Magnitude types: body-wave magnitude (MB), local magnitude (ML), surface-wave magnitude (MS), moment magnitude (MW)
Natural disasters:
The number of natural disasters in San Diego County (39) is a lot greater than the US average (15).Major Disasters (Presidential) Declared: 21
Emergencies Declared: 2
Causes of natural disasters: Fires: 21, Floods: 17, Storms: 9, Winter Storms: 6, Landslides: 5, Mudslides: 4, Freeze: 1, Heavy Rain: 1, Hurricane: 1, Tornado: 1, Other: 1 (Note: some incidents may be assigned to more than one category).
Hospitals and medical centers near Pauma Valley:
- FALLBROOK HOSPITAL DISTRICT SKILLED NURSING FACILI (Nursing Home, about 12 miles away; FALLBROOK, CA)
- FALLBROOK HOSPITAL Acute Care Hospitals (about 13 miles away; FALLBROOK, CA)
- FALLBROOK HOSPITAL'S DISTRICT HOMECARE/HOSPICE (Hospital, about 13 miles away; FALLBROOK, CA)
- FALLBROOK HOME HEALTH AND HOSPICE (Home Health Center, about 13 miles away; FALLBROOK, CA)
- CASA DEL NORTE (Nursing Home, about 14 miles away; ESCODIDO, CA)
- RANCHO VISTA (Nursing Home, about 14 miles away; VISTA, CA)
- RANCHO VISTA HEALTH CENTER (Nursing Home, about 14 miles away; VISTA, CA)
Airports located in Pauma Valley:
- Pauma Valley Air Park Airport (CL33) (Runways: 1)
Colleges/universities with over 2000 students nearest to Pauma Valley:
- Palomar College (about 16 miles; San Marcos, CA; Full-time enrollment: 15,037)
- California State University-San Marcos (about 16 miles; San Marcos, CA; FT enrollment: 8,070)
- MiraCosta College (about 19 miles; Oceanside, CA; FT enrollment: 11,189)
- San Diego Miramar College (about 30 miles; San Diego, CA; FT enrollment: 5,128)
- Alliant International University (about 31 miles; San Diego, CA; FT enrollment: 3,155)
- National University (about 32 miles; La Jolla, CA; FT enrollment: 24,215)
- Mt San Jacinto Community College District (about 33 miles; San Jacinto, CA; FT enrollment: 8,426)
Public elementary/middle school in Pauma Valley:
- PAUMA ELEMENTARY (Students: 196, Location: 33158 COLE GRADE RD., Grades: KG-8)
Points of interest:
Notable locations in Pauma Valley: Agua Tibia Ranch (A), Rancho Viejo (B), La Jolla Recreation Site (C), Lilac Oaks Campground (D), Oak Knoll Campground (E), Pala Reservation Fire Department (F), Pauma Reservation Fire Department (G), California Department of Forestry and Fire Protection Station 70 Rincon (H), La Jolla Indian Reservation Station (I). Display/hide their locations on the map
Churches in Pauma Valley include: Pauma Mission (A), Asistencia de San Antonio de Pala (B). Display/hide their locations on the map
Cemeteries: Pauma Valley Cemetery (1), Indian Cemetery (2), Saint Bartholomew Cemetery (3), Indian Cemetery (4). Display/hide their locations on the map
Creeks: Magee Creek (A), Jaybird Creek (B), Bubble-up Creek (C), Trujillo Creek (D), Gomez Creek (E), Frey Creek (F), Agua Tibia Creek (G), Plaisted Creek (H), Pauma Creek (I). Display/hide their locations on the map
Park in Pauma Valley: Wilderness Gardens Park (1). Display/hide its location on the map
Drinking water stations with addresses in Pauma Valley and their reported violations in the past:
OAK KNOLL VILLAGE (Population served: 205, Groundwater):Past monitoring violations:
- 2 routine major monitoring violations
- One regular monitoring violation
| This place: | 3.1 people |
| California: | 2.9 people |
| This place: | 79.2% |
| Whole state: | 68.7% |
| This place: | 6.5% |
| Whole state: | 7.2% |
Likely homosexual households (counted as self-reported same-sex unmarried-partner households)
- Lesbian couples: 0.6% of all households
- Gay men: 0.3% of all households
| This place: | 17.7% |
| Whole state: | 14.2% |
| This place: | 8.8% |
| Whole state: | 6.3% |
103 people in state prisons in 2000
3 people in other group homes in 2000
For population 15 years and over in Pauma Valley:
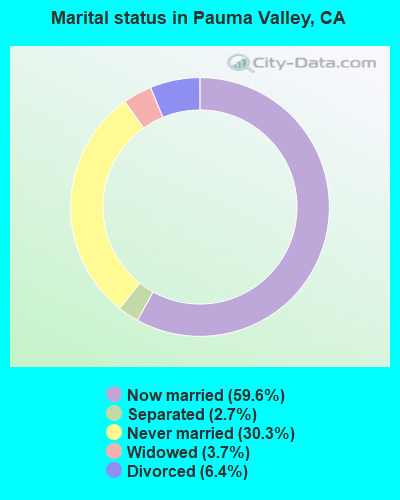
- Never married: 30.3%
- Now married: 59.6%
- Separated: 2.7%
- Widowed: 3.7%
- Divorced: 6.4%
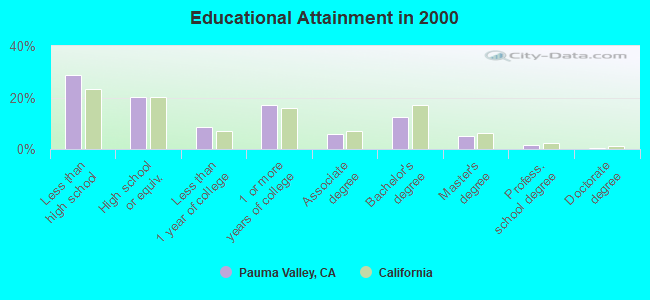
For population 25 years and over in Pauma Valley:
- High school or higher: 71.3%
- Bachelor's degree or higher: 19.4%
- Graduate or professional degree: 6.9%
- Unemployed: 5.4%
- Mean travel time to work (commute): 28.9 minutes
| Here: | 18.7 |
| California average: | 16.1 |
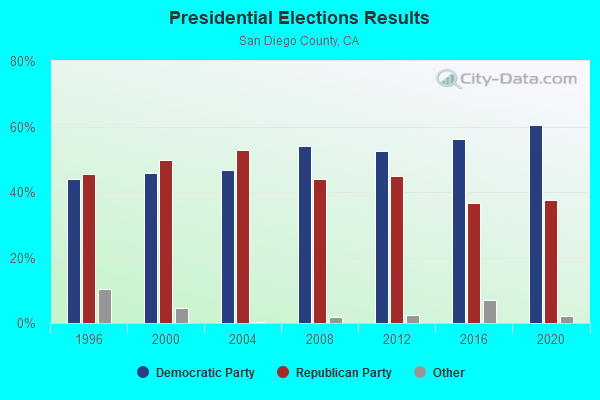
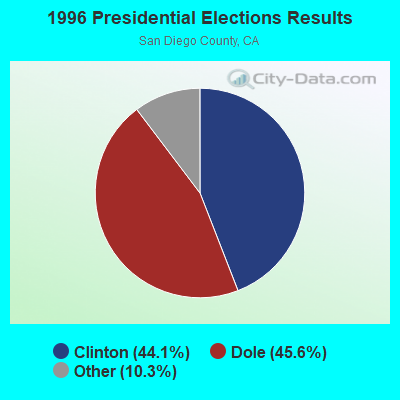
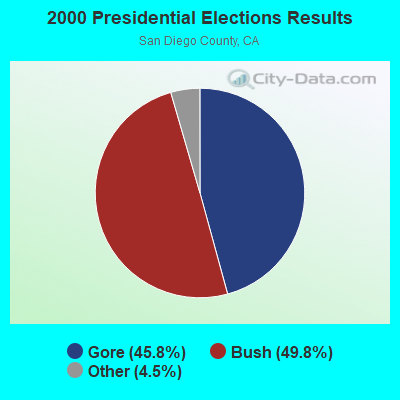
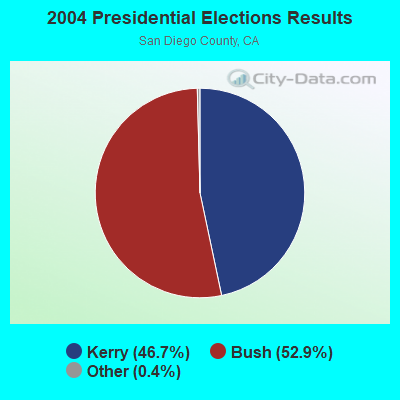
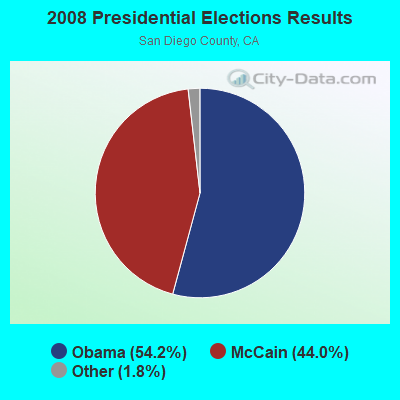
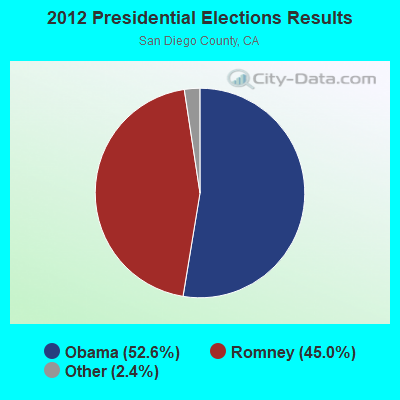
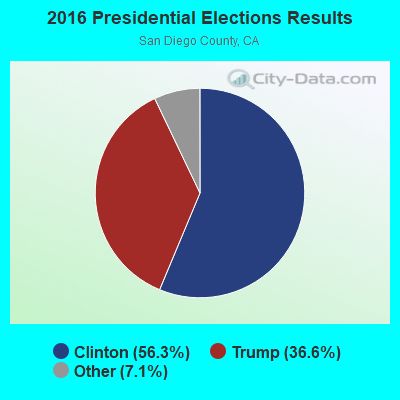
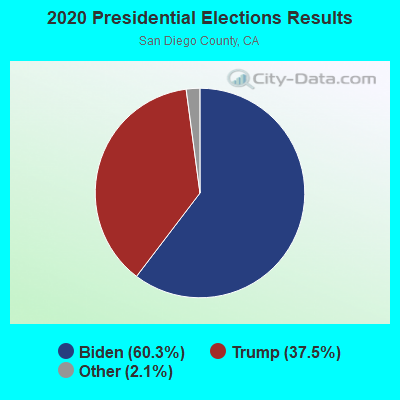
Graphs represent county-level data. Detailed 2008 Election Results
Religion statistics for Pauma Valley, CA (based on San Diego County data)
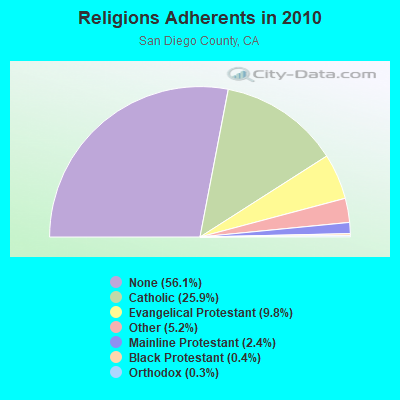
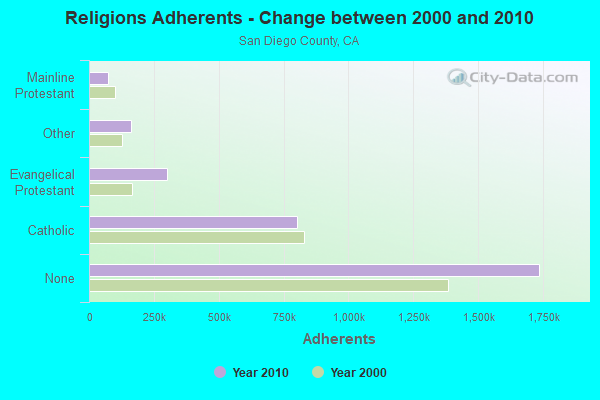
| Religion | Adherents | Congregations |
|---|---|---|
| Catholic | 801,850 | 115 |
| Evangelical Protestant | 302,320 | 974 |
| Other | 161,530 | 349 |
| Mainline Protestant | 74,992 | 211 |
| Black Protestant | 10,857 | 52 |
| Orthodox | 7,828 | 19 |
| None | 1,735,936 | - |
Food Environment Statistics:
| This county: | 1.94 / 10,000 pop. |
| California: | 2.14 / 10,000 pop. |
| San Diego County: | 0.06 / 10,000 pop. |
| California: | 0.04 / 10,000 pop. |
| San Diego County: | 0.77 / 10,000 pop. |
| State: | 0.62 / 10,000 pop. |
| Here: | 1.65 / 10,000 pop. |
| State: | 1.49 / 10,000 pop. |
| This county: | 7.56 / 10,000 pop. |
| State: | 7.42 / 10,000 pop. |
| San Diego County: | 6.5% |
| California: | 7.3% |
| San Diego County: | 22.2% |
| State: | 21.3% |
| This county: | 16.0% |
| California: | 17.9% |
5.18% of this county's 2021 resident taxpayers lived in other counties in 2020 ($90,734 average adjusted gross income)
| Here: | 5.18% |
| California average: | 5.19% |
0.14% of residents moved from foreign countries ($1,493 average AGI)
San Diego County: 0.14% California average: 0.03%
Top counties from which taxpayers relocated into this county between 2020 and 2021:
| from Los Angeles County, CA | |
| from Riverside County, CA | |
| from Orange County, CA |
5.71% of this county's 2020 resident taxpayers moved to other counties in 2021 ($83,556 average adjusted gross income)
| Here: | 5.71% |
| California average: | 6.14% |
0.09% of residents moved to foreign countries ($1,067 average AGI)
San Diego County: 0.09% California average: 0.02%
Top counties to which taxpayers relocated from this county between 2020 and 2021:
| to Riverside County, CA | |
| to Los Angeles County, CA | |
| to Orange County, CA |
Strongest AM radio stations in Pauma Valley:
- KFMB (760 AM; 50 kW; SAN DIEGO, CA; Owner: MIDWEST TELEVISION, INC.)
- KPRZ (1210 AM; 20 kW; SAN MARCOS, CA; Owner: RADIO 1210, INC.)
- KCBQ (1170 AM; 50 kW; SAN DIEGO, CA; Owner: RADIO 1210, INC.)
- KPLS (830 AM; 50 kW; ORANGE, CA; Owner: CRN LICENSES, LLC)
- KFI (640 AM; 50 kW; LOS ANGELES, CA; Owner: CAPSTAR TX LIMITED PARTNERSHIP)
- KLAC (570 AM; 50 kW; LOS ANGELES, CA; Owner: AMFM RADIO LICENSES, L.L.C.)
- KCEO (1000 AM; 2 kW; VISTA, CA; Owner: NORTH COUNTY BROADCASTING CORPORATIO)
- KTNQ (1020 AM; 50 kW; LOS ANGELES, CA; Owner: KTNQ-AM LICENSE CORP.)
- KXTA (1150 AM; 50 kW; LOS ANGELES, CA; Owner: CITICASTERS LICENSES, L.P.)
- KSDO (1130 AM; 10 kW; SAN DIEGO, CA; Owner: HI-FAVOR BROADCASTING, LLC)
- KDIS (1110 AM; 50 kW; PASADENA, CA; Owner: ABC,INC.)
- KFWB (980 AM; 50 kW; LOS ANGELES, CA; Owner: INFINITY BROADCASTING OPERATIONS, INC.)
- KSPN (710 AM; 50 kW; LOS ANGELES, CA; Owner: KABC-AM RADIO, INC.)
Strongest FM radio stations in Pauma Valley:
- KRTM (88.9 FM; TEMECULA, CA; Owner: PENFOLD COMMUNICATIONS, INC.)
- KWVE (107.9 FM; SAN CLEMENTE, CA; Owner: CALVARY CHAPEL OF COSTA MESA)
- KLVJ (100.1 FM; JULIAN, CA; Owner: EDUCATIONAL MEDIA FOUNDATION)
- K252BF (98.3 FM; TEMECULA, CA; Owner: ENTRAVISION HOLDINGS, LLC)
- KGBB (103.3 FM; TEMECULA, CA; Owner: CLEAR CHANNEL BROADCASTING LICENSES, INC.)
- KMYT (94.5 FM; TEMECULA, CA; Owner: CLEAR CHANNEL BROADCASTING LICENSES, INC.)
- KFSD-FM (92.1 FM; ESCONDIDO, CA; Owner: NORTH COUNTY BROADCASTING CORP.)
- KLRD (90.1 FM; YUCAIPA, CA; Owner: EDUCATIONAL MEDIA FOUNDATION)
- KPRI (102.1 FM; ENCINITAS, CA; Owner: COMPASS RADIO OF SAN DIEGO, INC.)
- KATY-FM (101.3 FM; IDYLLWILD, CA; Owner: ALL PRO BROADCASTING, INC.)
- KPBS-FM (89.5 FM; SAN DIEGO, CA; Owner: THE BD. OF TRUSTEES, CALIFORNIA STATE UNIVERSITY)
- KSSD (107.1 FM; FALLBROOK, CA; Owner: ENTRAVISION HOLDINGS, LLC)
- KLQV (102.9 FM; SAN DIEGO, CA; Owner: HBC LICENSE CORPORATION)
- KUOR-FM (89.1 FM; REDLANDS, CA; Owner: UNIVERSITY OF REDLANDS)
- KXRS (105.7 FM; HEMET, CA; Owner: LAZER BROADCASTING CORPORATION)
- KWRP (96.1 FM; SAN JACINTO, CA; Owner: MAGIC BROADCASTING, INC.)
- K201AR (88.1 FM; BANNING, CA; Owner: KSGN, INC.)
- K232CX (94.3 FM; DESERT HOT SPRINGS, CA; Owner: MCC RADIO, LLC)
- KPLM-FM2 (106.1 FM; SAN JACINTO, CA; Owner: RM BROADCASTING L.L.C.)
- KXFG (92.9 FM; SUN CITY, CA; Owner: INFINITY RADIO OPERATIONS INC.)
TV broadcast stations around Pauma Valley:
- KSZZ-LP (Channel 19; SAN DIEGO, CA; Owner: ENTRAVISION HOLDINGS, LLC)
- KDIG-LP (Channel 67; ENCINITAS, CA; Owner: STEPHEN M. CILURZO tr/as BRIMARC BROADCASTING)
- K26FA (Channel 26; VISTA, CA; Owner: RICK D'AMICO)
FCC Registered Antenna Towers:
1- 13510 Mc Nally Rd (Lat: 33.295278 Lon: -117.045833), Type: 10.3, Overall height: 9.1 m, Registrant: Pacific Bell, Washi-ngton, Phone: (202) 383-6430
FCC Registered Broadcast Land Mobile Towers:
15 (See the full list of FCC Registered Broadcast Land Mobile Towers in Pauma Valley, CA)FCC Registered Microwave Towers:
16 (See the full list of FCC Registered Microwave Towers in this town)FCC Registered Maritime Coast & Aviation Ground Towers:
1 (See the full list of FCC Registered Maritime Coast & Aviation Ground Towers)FCC Registered Amateur Radio Licenses:
28 (See the full list of FCC Registered Amateur Radio Licenses in Pauma Valley)FAA Registered Aircraft:
8 (See the full list of FAA Registered Aircraft in Pauma Valley)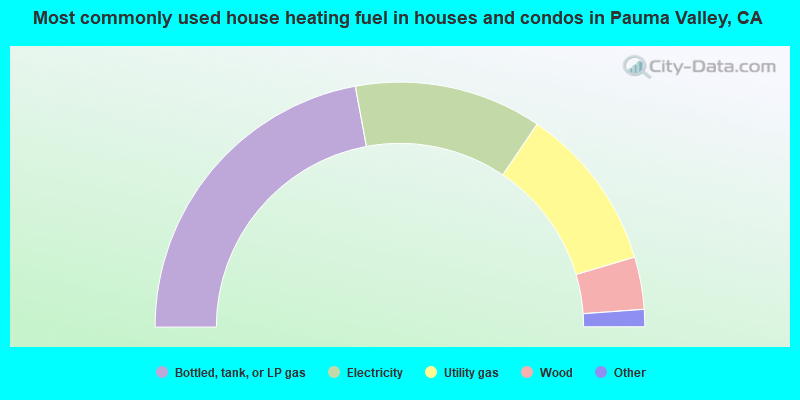
- 44.2%Bottled, tank, or LP gas
- 24.8%Electricity
- 21.9%Utility gas
- 6.9%Wood
- 1.0%Other fuel
- 0.8%Solar energy
- 0.4%No fuel used
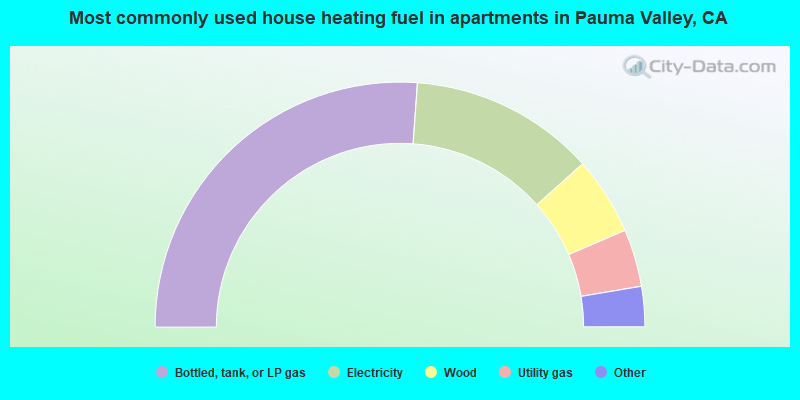
- 52.3%Bottled, tank, or LP gas
- 24.5%Electricity
- 10.3%Wood
- 7.6%Utility gas
- 3.2%No fuel used
- 1.0%Fuel oil, kerosene, etc.
- 0.7%Other fuel
- 0.3%Solar energy
Pauma Valley compared to California state average:
- Unemployed percentage below state average.
- Black race population percentage significantly below state average.
- Foreign-born population percentage significantly below state average.
- Renting percentage below state average.
- Length of stay since moving in significantly above state average.
- Number of rooms per house significantly below state average.
- House age significantly below state average.
Pauma Valley on our top lists:
- #6 on the list of "Top 101 cities with largest percentage of females in industries: building material and garden equipment and supplies dealers (population 5,000+)"
- #13 on the list of "Top 101 cities with largest percentage of males in occupations: agricultural workers including supervisors (population 5,000+)"
- #19 on the list of "Top 101 cities with largest percentage of males in industries: miscellaneous nondurable goods merchant wholesalers (population 5,000+)"
- #19 on the list of "Top 101 cities with largest percentage of females in industries: u. s. postal service (population 5,000+)"
- #32 on the list of "Top 101 cities with largest percentage of males in occupations: personal appearance workers (population 5,000+)"
- #33 on the list of "Top 101 cities with largest percentage of females in occupations: other teachers and instructors, education, training, and library occupations (population 5,000+)"
- #38 on the list of "Top 101 cities with largest percentage of males in industries: beverage and tobacco products (population 5,000+)"
- #42 on the list of "Top 101 cities with largest percentage of females in occupations: media and communication equipment workers (population 5,000+)"
- #54 on the list of "Top 101 cities with largest percentage of females in occupations: farmers and farm managers (population 5,000+)"
- #56 on the list of "Top 101 cities with largest percentage of females in industries: health and personal care, except drug, stores (population 5,000+)"
- #57 on the list of "Top 101 cities with largest percentage of males in occupations: farmers and farm managers (population 5,000+)"
- #62 on the list of "Top 101 cities with largest percentage of males in industries: leather and allied products (population 5,000+)"
- #69 on the list of "Top 101 cities with largest percentage of females in industries: private households (population 5,000+)"
- #70 on the list of "Top 101 cities with largest percentage of females in industries: plastics and rubber products (population 5,000+)"
- #86 on the list of "Top 101 cities with largest percentage of females in industries: radio, tv, and computer stores (population 5,000+)"
- #87 on the list of "Top 101 cities with largest percentage of females in industries: furniture and related product manufacturing (population 5,000+)"
- #90 on the list of "Top 101 cities with largest percentage of females in industries: electrical and electronic goods merchant wholesalers (population 5,000+)"
- #91 on the list of "Top 101 cities with largest percentage of males in industries: agriculture, forestry, fishing and hunting (population 5,000+)"
- #96 on the list of "Top 101 cities with largest percentage of females in industries: miscellaneous manufacturing (population 5,000+)"
- #100 on the list of "Top 101 cities with largest percentage of females in industries: apparel (population 5,000+)"
- #80 (92082) on the list of "Top 101 zip codes with the most casinos in 2005"
- #4 on the list of "Top 101 counties with the most Catholic adherents"
- #4 on the list of "Top 101 counties with the highest lead air pollution readings in 2012 (µg/m3)"
- #7 on the list of "Top 101 counties with the most Evangelical Protestant congregations"
- #7 on the list of "Top 101 counties with the most Catholic congregations"
- #7 on the list of "Top 101 counties with the highest surface withdrawal of fresh water for public supply (pop. 50,000+)"

|
|
Total of 7 patent applications in 2008-2024.