Phoenix Lake-Cedar Ridge, California
Submit your own pictures of this place and show them to the world
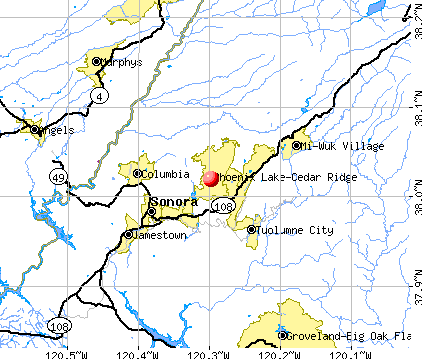
- OSM Map
- General Map
- Google Map
- MSN Map
| Males: 2,565 | |
| Females: 2,654 |
| Median resident age: | 46.3 years |
| California median age: | 33.3 years |
Zip codes: 95370.
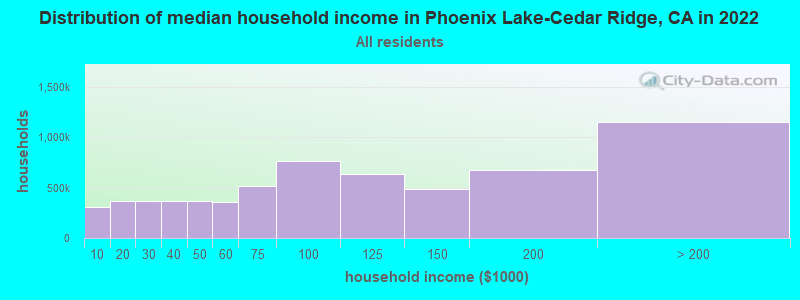
| Phoenix Lake-Cedar Ridge: | $80,984 |
| CA: | $91,551 |
Estimated per capita income in 2022: $44,625 (it was $22,853 in 2000)
Phoenix Lake-Cedar Ridge CDP income, earnings, and wages data
Estimated median house or condo value in 2022: $485,238 (it was $169,900 in 2000)
| Phoenix Lake-Cedar Ridge: | $485,238 |
| CA: | $715,900 |
Phoenix Lake-Cedar Ridge, CA residents, houses, and apartments details
Detailed information about poverty and poor residents in Phoenix Lake-Cedar Ridge, CA
Compare current foreclosures near your location:
| Photo | Address | Area | Beds / Baths | Price | Details |
|---|---|---|---|---|---|

|
#1
N Rhodes St
Pretty Prairie, KS 67570
|
1,725 sq. feet
|
2 baths 4 beds |
show details | |

|
#2
S Goddard Rd
Goddard, KS 67052
|
1,054 sq. feet
|
2 baths 2 beds |
show details | |

|
#3
W 21st St N
Cheney, KS 67025
|
3,190 sq. feet
|
3 baths 5 beds |
show details | |

|
#4
E Winterset St
Goddard, KS 67052
|
816 sq. feet
|
1 baths 2 beds |
show details | |

|
#5
NE Waterloo Ave
Murdock, KS 67111
|
1,220 sq. feet
|
1 baths 3 beds |
show details | |

|
#6
W 39th St S
Goddard, KS 67052
|
4,221 sq. feet
|
3 baths 3 beds |
show details | |

|
#7
E Arlington Rd
Haven, KS 67543
|
960 sq. feet
|
1 baths 2 beds |
show details | |

|
#8
S 391st St W
Cheney, KS 67025
|
2,558 sq. feet
|
3 baths 3 beds |
show details | |

|
#9
SE Viney Ave
Murdock, KS 67111
|
- sq. feet
|
- baths - beds |
show details | |

|
#10
W Main St
Mount Hope, KS 67108
|
- sq. feet
|
- baths - beds |
show details |
| Photo | Address | Area | Beds / Baths | Price | Details |
|---|---|---|---|---|---|

|
#11
N 189th Cir W
Colwich, KS 67030
|
- sq. feet
|
- baths - beds |
show details | |

|
#12
N Main St
Goddard, KS 67052
|
- sq. feet
|
- baths - beds |
show details | |

|
#13
Martens Ct
Goddard, KS 67052
|
- sq. feet
|
- baths - beds |
show details | |

|
#14
E 4th Ave Apt 1
Cheney, KS 67025
|
- sq. feet
|
- baths - beds |
show details | |

|
#15
W Maple St Lot D
Goddard, KS 67052
|
- sq. feet
|
- baths - beds |
show details | |

|
#16
W 47th St S
Garden Plain, KS 67050
|
- sq. feet
|
- baths - beds |
show details | |

|
#17
S 339th St W
Cheney, KS 67025
|
- sq. feet
|
- baths - beds |
show details | |

|
#18
E Casey Dr
Goddard, KS 67052
|
- sq. feet
|
- baths - beds |
show details | |

|
Check over 1 million property listings on Foreclosure.com!
|
browse all offers | |||

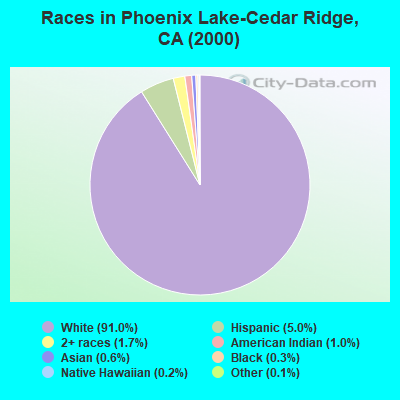
- 4,66491.0%White alone
- 2565.0%Hispanic
- 891.7%Two or more races
- 521.0%American Indian alone
- 330.6%Asian alone
- 150.3%Black alone
- 80.2%Native Hawaiian and Other
Pacific Islander alone - 60.1%Other race alone
 Recent articles from our blog. Our writers, many of them Ph.D. graduates or candidates, create easy-to-read articles on a wide variety of topics.

Ancestries: Irish (18.7%), German (18.6%), English (18.3%), Italian (6.4%), Scotch-Irish (4.2%), French (4.1%).
Current Local Time: PST time zone
Land area: 25.2 square miles.
Population density: 207 people per square mile (very low).
204 residents are foreign born (1.8% Europe, 1.3% Asia).
| This place: | 4.0% |
| California: | 26.2% |
| Phoenix Lake-Cedar Ridge CDP: | 0.8% ($1,282) |
| California: | 0.8% ($1,564) |
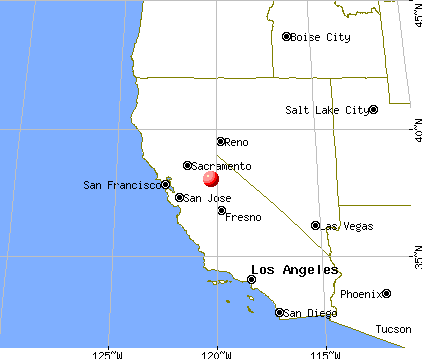
Nearest city with pop. 50,000+: Modesto, CA  (45.4 miles , pop. 188,856).
Nearest city with pop. 200,000+: Stockton, CA (54.8 miles , pop. 243,771).
Nearest city with pop. 1,000,000+: Los Angeles, CA (292.5 miles , pop. 3,694,820).
Nearest cities:
), ), ), ), ), Latitude: 38.02 N, Longitude: 120.30 W

| Here: | 5.3% |
| California: | 5.1% |
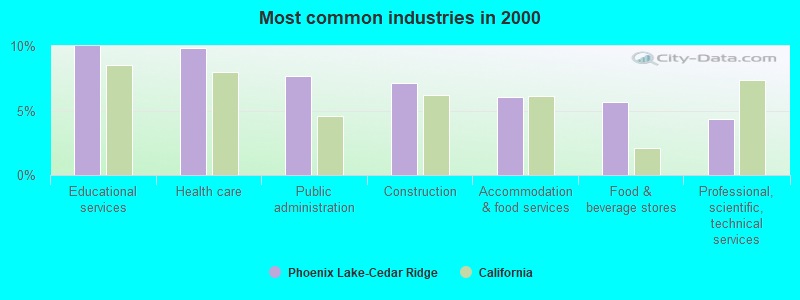
- Educational services (10.0%)
- Health care (9.8%)
- Public administration (7.6%)
- Construction (7.1%)
- Accommodation & food services (6.1%)
- Food & beverage stores (5.6%)
- Professional, scientific, technical services (4.4%)
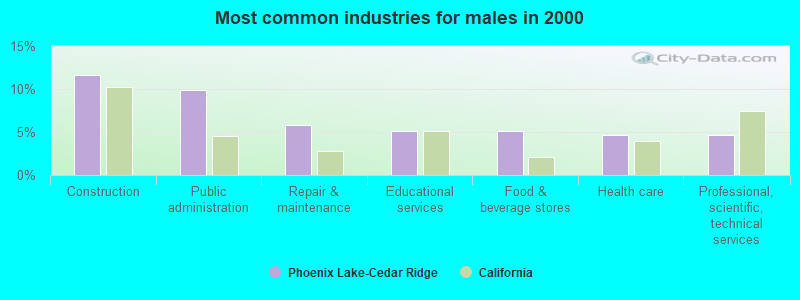
- Construction (11.6%)
- Public administration (9.9%)
- Repair & maintenance (5.8%)
- Educational services (5.1%)
- Food & beverage stores (5.1%)
- Health care (4.7%)
- Professional, scientific, technical services (4.7%)
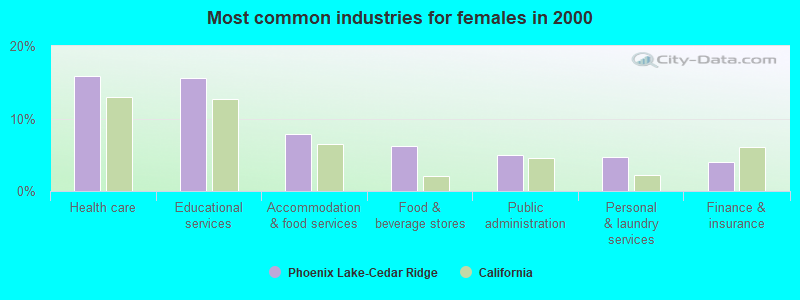
- Health care (15.8%)
- Educational services (15.6%)
- Accommodation & food services (7.9%)
- Food & beverage stores (6.3%)
- Public administration (5.0%)
- Personal & laundry services (4.7%)
- Finance & insurance (4.0%)
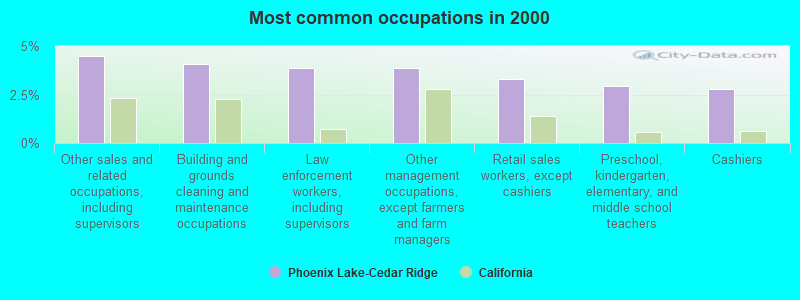
- Other sales and related occupations, including supervisors (4.5%)
- Building and grounds cleaning and maintenance occupations (4.1%)
- Law enforcement workers, including supervisors (3.9%)
- Other management occupations, except farmers and farm managers (3.8%)
- Retail sales workers, except cashiers (3.3%)
- Preschool, kindergarten, elementary, and middle school teachers (2.9%)
- Cashiers (2.8%)
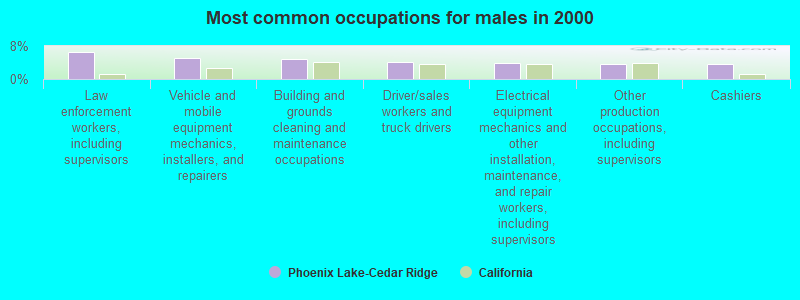
- Law enforcement workers, including supervisors (6.6%)
- Vehicle and mobile equipment mechanics, installers, and repairers (5.0%)
- Building and grounds cleaning and maintenance occupations (4.9%)
- Driver/sales workers and truck drivers (4.2%)
- Electrical equipment mechanics and other installation, maintenance, and repair workers, including supervisors (3.9%)
- Other production occupations, including supervisors (3.6%)
- Cashiers (3.6%)
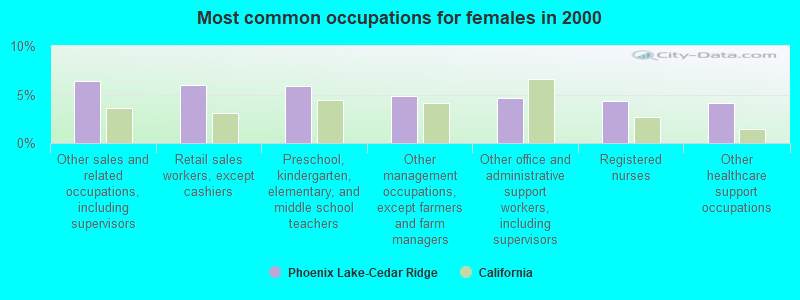
- Other sales and related occupations, including supervisors (6.4%)
- Retail sales workers, except cashiers (6.0%)
- Preschool, kindergarten, elementary, and middle school teachers (5.9%)
- Other management occupations, except farmers and farm managers (4.8%)
- Other office and administrative support workers, including supervisors (4.6%)
- Registered nurses (4.3%)
- Other healthcare support occupations (4.1%)
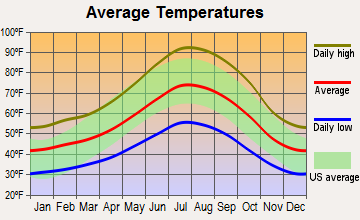
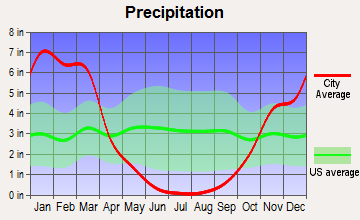
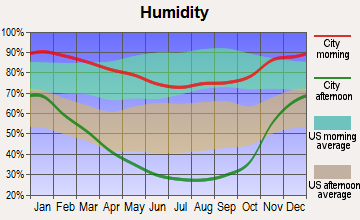
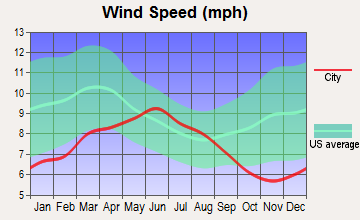
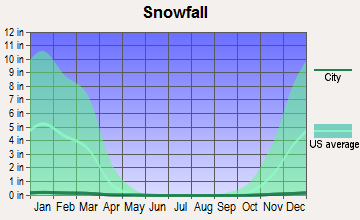
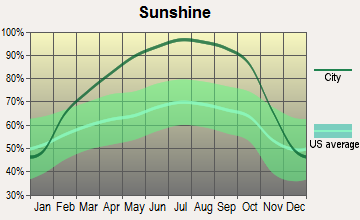
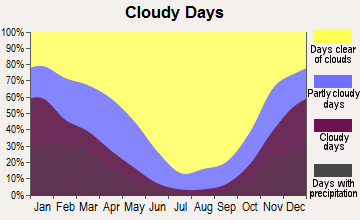
Average climate in Phoenix Lake-Cedar Ridge, California
Based on data reported by over 4,000 weather stations
(lower is better)
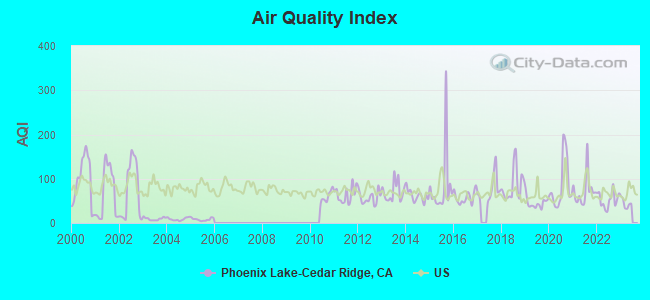
Air Quality Index (AQI) level in 2022 was 52.6. This is better than average.
| City: | 52.6 |
| U.S.: | 72.6 |
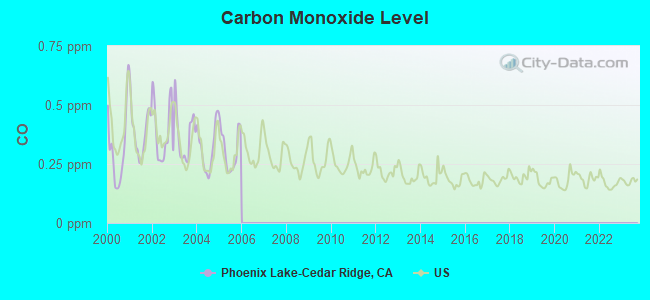
Carbon Monoxide (CO) [ppm] level in 2005 was 0.311. This is worse than average. Closest monitor was 5.1 miles away from the city center.
| City: | 0.311 |
| U.S.: | 0.251 |
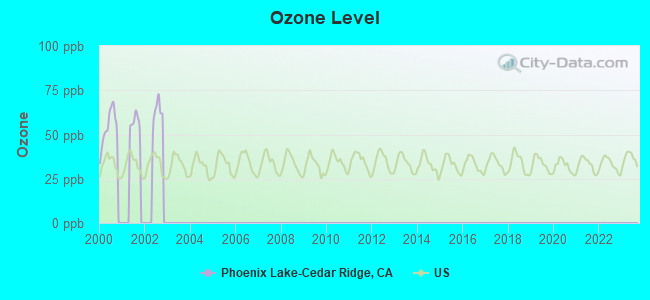
Ozone [ppb] level in 2000 was 53.7. This is significantly worse than average. Closest monitor was 2.1 miles away from the city center.
| City: | 53.7 |
| U.S.: | 33.3 |
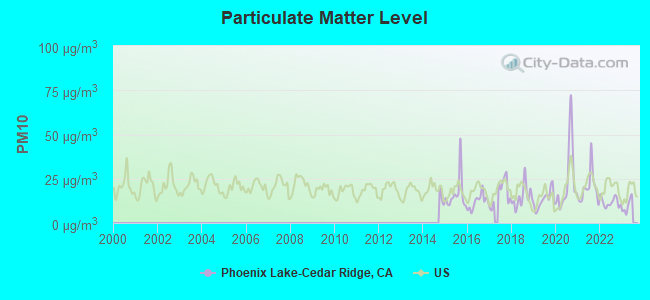
Particulate Matter (PM10) [µg/m3] level in 2022 was 11.8. This is significantly better than average. Closest monitor was 24.3 miles away from the city center.
| City: | 11.8 |
| U.S.: | 19.2 |
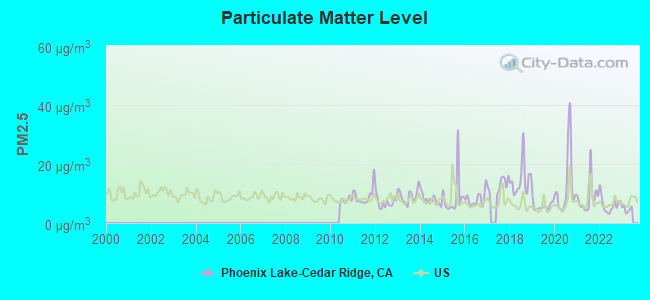
Particulate Matter (PM2.5) [µg/m3] level in 2022 was 6.27. This is better than average. Closest monitor was 24.3 miles away from the city center.
| City: | 6.27 |
| U.S.: | 8.11 |
Earthquake activity:
Phoenix Lake-Cedar Ridge-area historical earthquake activity is significantly above California state average. It is 8156% greater than the overall U.S. average.On 4/18/1906 at 13:12:21, a magnitude 7.9 (7.9 UK, Class: Major, Intensity: VIII - XII) earthquake occurred 147.3 miles away from the city center, causing $524,000,000 total damage
On 7/21/1952 at 11:52:14, a magnitude 7.7 (7.7 UK) earthquake occurred 221.0 miles away from Phoenix Lake-Cedar Ridge center, causing $50,000,000 total damage
On 12/21/1932 at 06:10:09, a magnitude 7.2 (7.2 UK) earthquake occurred 124.9 miles away from the city center
On 10/18/1989 at 00:04:15, a magnitude 7.1 (6.5 MB, 7.1 MS, 6.9 MW, 7.0 ML) earthquake occurred 102.3 miles away from Phoenix Lake-Cedar Ridge center, causing 62 deaths (62 shaking deaths) and 3757 injuries, causing $1,305,032,704 total damage
On 10/3/1915 at 06:52:48, a magnitude 7.6 (7.6 UK) earthquake occurred 227.8 miles away from the city center
On 11/4/1927 at 13:51:53, a magnitude 7.5 (7.5 UK) earthquake occurred 218.6 miles away from Phoenix Lake-Cedar Ridge center
Magnitude types: body-wave magnitude (MB), local magnitude (ML), surface-wave magnitude (MS), moment magnitude (MW)
Natural disasters:
The number of natural disasters in Tuolumne County (16) is near the US average (15).Major Disasters (Presidential) Declared: 7
Emergencies Declared: 3
Causes of natural disasters: Floods: 10, Mudslides: 5, Winter Storms: 5, Storms: 4, Fires: 3, Landslides: 3, Drought: 1, Heavy Rain: 1, Hurricane: 1, Other: 1 (Note: some incidents may be assigned to more than one category).
Hospitals and medical centers near Phoenix Lake-Cedar Ridge:
- SONORA REGIONAL HOME HEALTH (Home Health Center, about 5 miles away; SONORA, CA)
- VISITING NURSE ASSOCIATION (Hospital, about 5 miles away; SONORA, CA)
- SONORA REGIONAL MEDICAL CENTER Acute Care Hospitals (about 5 miles away; SONORA, CA)
- AVALON CARE CENTER-SONORA (Nursing Home, about 5 miles away; SONORA, CA)
- SATELLITE DIALYSIS SONORA (Dialysis Facility, about 6 miles away; SONORA, CA)
- TUOLUMNE GENERAL HOSPITAL (Hospital, about 6 miles away; SONORA, CA)
- SONORA REGIONAL MEDICAL CENTER D/P SNF (Nursing Home, about 6 miles away; SONORA, CA)
Colleges/universities with over 2000 students nearest to Phoenix Lake-Cedar Ridge:
- California State University-Stanislaus (about 46 miles; Turlock, CA; Full-time enrollment: 7,054)
- University of California-Merced (about 46 miles; Merced, CA; FT enrollment: 5,981)
- Modesto Junior College (about 47 miles; Modesto, CA; FT enrollment: 10,635)
- Merced College (about 49 miles; Merced, CA; FT enrollment: 6,973)
- University of the Pacific (about 56 miles; Stockton, CA; FT enrollment: 4,999)
- San Joaquin Delta College (about 56 miles; Stockton, CA; FT enrollment: 12,167)
- Folsom Lake College (about 64 miles; Folsom, CA; FT enrollment: 5,308)
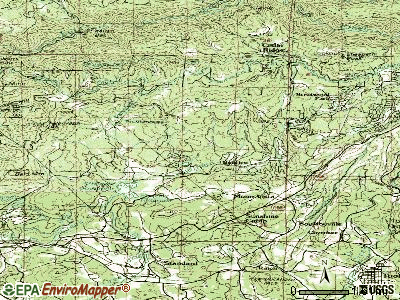
Points of interest:
Notable locations in Phoenix Lake-Cedar Ridge: Five Mile Regional Center (A), Phoenix Lake Golf Course (B), Italian Bar (C), Italian Ranch (D), Old Oak Ranch (E), Phoenix Powerhouse (F), Tuolumne County Fire Department Station 58 Cedar Ridge (G), Tuolumne County Fire Department Station 57 Crystal Falls (H). Display/hide their locations on the map
Reservoir: Phoenix Reservoir (A). Display/hide its location on the map
Creek: Deer Creek (A). Display/hide its location on the map
| This place: | 2.5 people |
| California: | 2.9 people |
| This place: | 77.3% |
| Whole state: | 69.4% |
| This place: | 4.8% |
| Whole state: | 5.9% |
Likely homosexual households (counted as self-reported same-sex unmarried-partner households)
- Lesbian couples: 0.2% of all households
- Gay men: 0.3% of all households
| This place: | 7.5% |
| Whole state: | 14.2% |
| This place: | 3.6% |
| Whole state: | 6.3% |
For population 15 years and over in Phoenix Lake-Cedar Ridge:
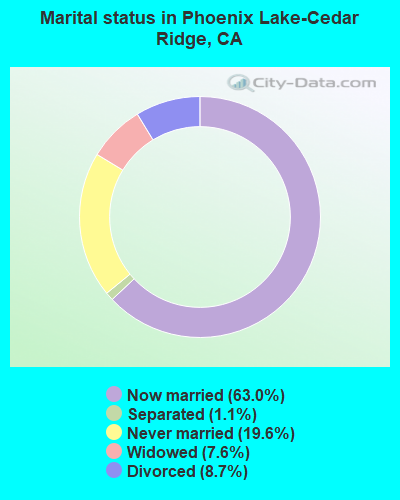
- Never married: 19.6%
- Now married: 63.0%
- Separated: 1.1%
- Widowed: 7.6%
- Divorced: 8.7%
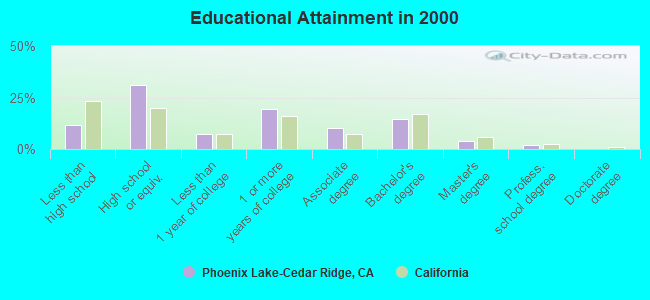
For population 25 years and over in Phoenix Lake-Cedar Ridge:
- High school or higher: 88.4%
- Bachelor's degree or higher: 20.6%
- Graduate or professional degree: 6.2%
- Unemployed: 6.1%
- Mean travel time to work (commute): 27.8 minutes
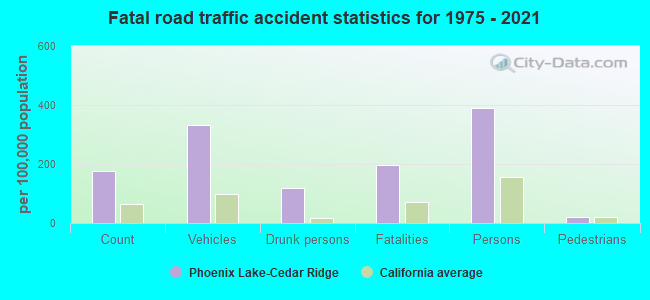
| Here: | 9.5 |
| California average: | 16.1 |
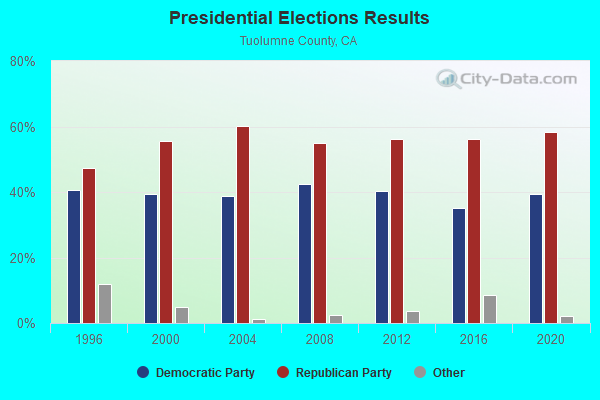
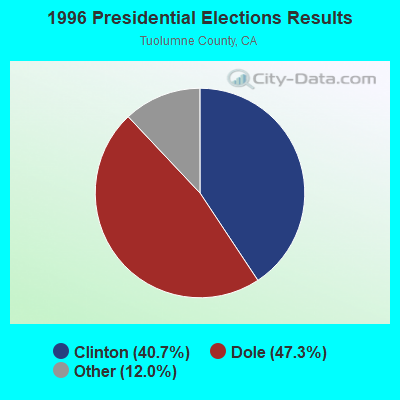
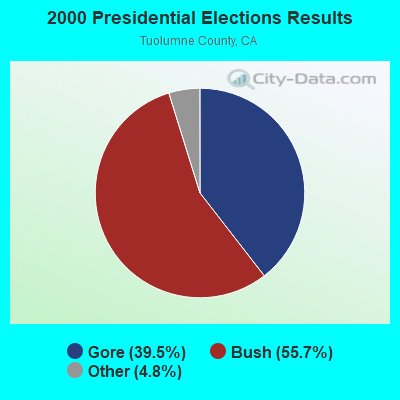
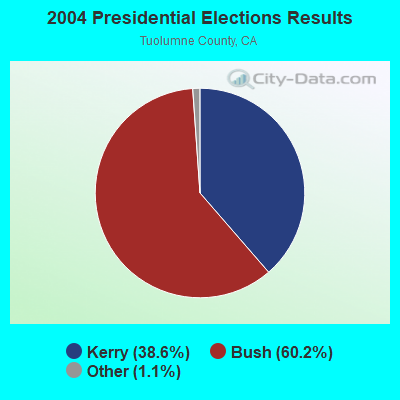
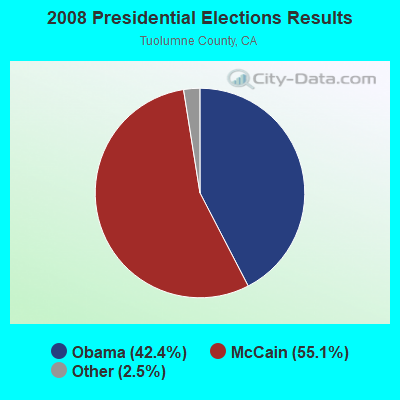
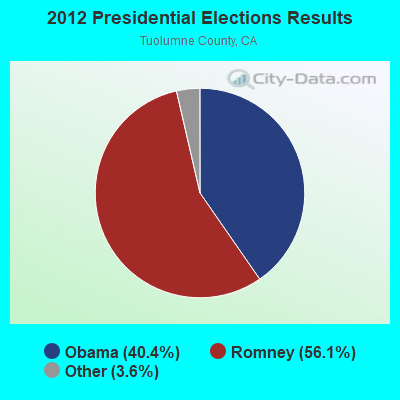
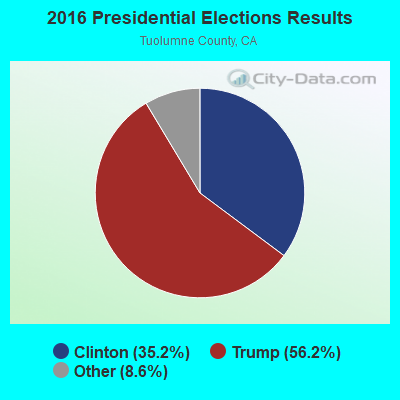
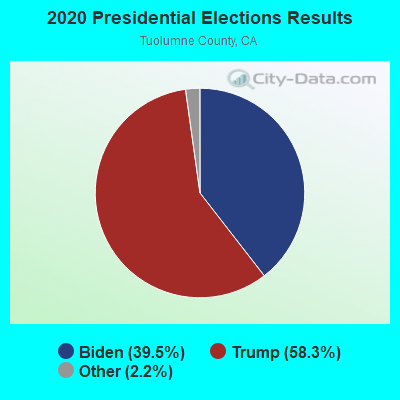
Graphs represent county-level data. Detailed 2008 Election Results
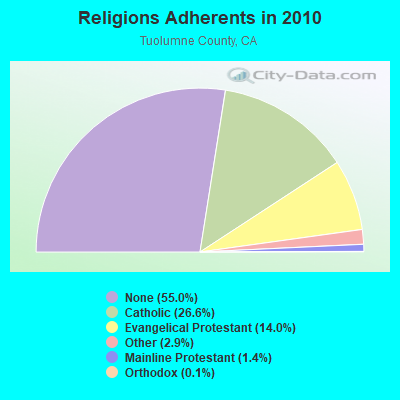
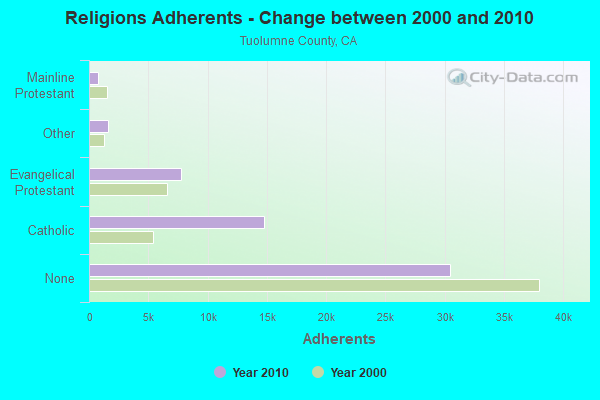
Religion statistics for Phoenix Lake-Cedar Ridge, CA (based on Tuolumne County data)
| Religion | Adherents | Congregations |
|---|---|---|
| Catholic | 14,728 | 5 |
| Evangelical Protestant | 7,727 | 41 |
| Other | 1,597 | 10 |
| Mainline Protestant | 796 | 9 |
| Orthodox | 59 | 1 |
| None | 30,458 | - |
Food Environment Statistics:
| This county: | 2.51 / 10,000 pop. |
| California: | 2.14 / 10,000 pop. |
| This county: | 1.26 / 10,000 pop. |
| State: | 0.62 / 10,000 pop. |
| This county: | 3.77 / 10,000 pop. |
| California: | 1.49 / 10,000 pop. |
| Here: | 12.02 / 10,000 pop. |
| California: | 7.42 / 10,000 pop. |
| Tuolumne County: | 7.3% |
| California: | 7.3% |
| Tuolumne County: | 22.8% |
| California: | 21.3% |
| This county: | 14.3% |
| State: | 17.9% |
Strongest AM radio stations in Phoenix Lake-Cedar Ridge:
- KVML (1450 AM; 1 kW; SONORA, CA; Owner: CLARKE BROADCASTING CORPORATION)
- KCBC (770 AM; 50 kW; RIVERBANK, CA; Owner: KIERTRON, INC.)
- KHTK (1140 AM; 50 kW; SACRAMENTO, CA; Owner: INFINITY RADIO SUBSIDIARY OPERATIONS INC.)
- KSTE (650 AM; 25 kW; RANCHO CORDOVA, CA; Owner: AMFM RADIO LICENSES, L.L.C.)
- KMJ (580 AM; 50 kW; FRESNO, CA; Owner: INFINITY RADIO OPERATIONS INC.)
- KNBR (680 AM; 50 kW; SAN FRANCISCO, CA; Owner: KNBR LICO, INC.)
- KGO (810 AM; 50 kW; SAN FRANCISCO, CA; Owner: KGO-AM RADIO, INC.)
- KFIA (710 AM; 25 kW; CARMICHAEL, CA; Owner: VISTA BROADCASTING INC.)
- KTRB (860 AM; 50 kW; MODESTO, CA; Owner: PAPPAS RADIO OF CALIFORNIA, A CALIFORNIA LIMITED PARTNERSHIP)
- KLOK (1170 AM; 50 kW; SAN JOSE, CA; Owner: ENTRAVISION HOLDINGS, LLC)
- KFBK (1530 AM; 50 kW; SACRAMENTO, CA; Owner: AMFM RADIO LICENSES, L.L.C.)
- KKOH (780 AM; 50 kW; RENO, NV; Owner: CITADEL BROADCASTING COMPANY)
- KCBS (740 AM; 50 kW; SAN FRANCISCO, CA; Owner: INFINITY BROADCASTING OPERATIONS, INC.)
Strongest FM radio stations in Phoenix Lake-Cedar Ridge:
- KCVR-FM (98.9 FM; COLUMBIA, CA; Owner: ENTRAVISION HOLDINGS, LLC)
- KKBN (93.5 FM; TWAIN HARTE, CA; Owner: CLARKE BROADCASTING CORPORATION)
- KXSR (91.7 FM; GROVELAND, CA; Owner: CALIFORNIA STATE UNIVERSITY, SACRAMENTO)
- KZSQ-FM (92.7 FM; SONORA, CA; Owner: CLARKE BROADCASTING CORPORATION)
- KHOP (95.1 FM; OAKDALE, CA; Owner: CITADEL BROADCASTING COMPANY)
- KEFR (89.9 FM; LE GRAND, CA; Owner: FAMILY STATIONS, INC.)
- KUBB (96.3 FM; MARIPOSA, CA; Owner: BUCKLEY BROADCASTING CORP. OF MONTEREY INC)
- KCIV (99.9 FM; MOUNT BULLION, CA; Owner: BOTT COMMUNICATIONS, INC.)
- KMPO (88.7 FM; MODESTO, CA; Owner: RADIO BILINGUE, INC.)
- K214CT (90.7 FM; MARIPOSA, CA; Owner: CALVARY CHAPEL OF TWIN FALLS, INC.)
- KDJK (103.9 FM; MARIPOSA, CA; Owner: CITADEL BROADCASTING COMPANY)
- KAMB (101.5 FM; MERCED, CA; Owner: CENTRAL VALLEY BROADCASTING CO. INC.)
- KBYN (95.9 FM; ARNOLD, CA; Owner: KBYN, INC.)
- KRVR (105.5 FM; COPPEROPOLIS, CA; Owner: THRESHOLD COMMUNICATIONS)
- KCFA (106.1 FM; ARNOLD, CA; Owner: KCFA, INC.)
- KSVL (92.3 FM; SMITH, NV; Owner: DONEGAL ENTERPRISES)
- KWYL (102.9 FM; SOUTH LAKE TAHOE, CA; Owner: CITADEL BROADCASTING COMPANY)
- KOSL (94.3 FM; JACKSON, CA; Owner: HBC LICENSE CORPORATION)
- K238AC (95.5 FM; SALIDA, CA; Owner: FAMILY STATIONS, INC.)
- KHTN (104.7 FM; LOS BANOS, CA; Owner: BUCKLEY COMMUNICATIONS, INC.)
TV broadcast stations around Phoenix Lake-Cedar Ridge:
- KMMK-LP (Channel 14; SACRAMENTO, CA; Owner: CABALLERO TELEVISION TEXAS, L.L.C.)
- National Bridge Inventory (NBI) Statistics
- 6Number of bridges
- 135ft / 40.6mTotal length
- 48,616Total average daily traffic
- 1,106Total average daily truck traffic
- 77,989Total future (year 2039) average daily traffic
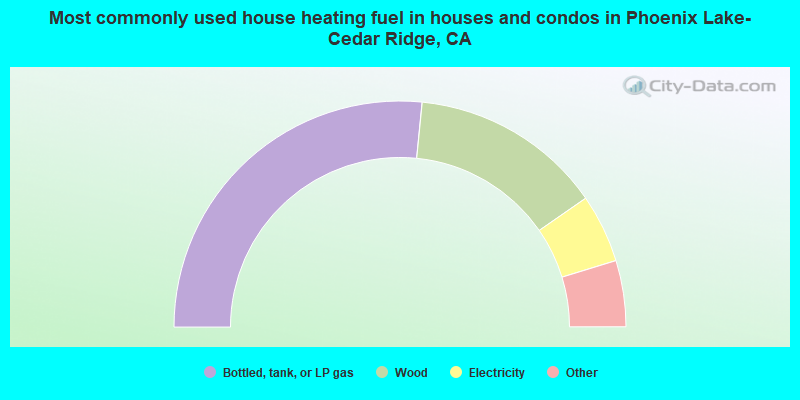
- 53.2%Bottled, tank, or LP gas
- 27.6%Wood
- 9.8%Electricity
- 3.7%Fuel oil, kerosene, etc.
- 3.3%Other fuel
- 1.9%Utility gas
- 0.3%Solar energy
- 0.2%No fuel used
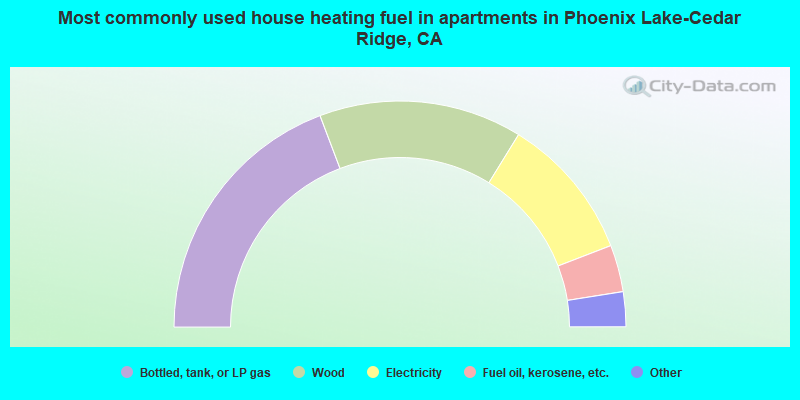
- 38.5%Bottled, tank, or LP gas
- 29.1%Wood
- 20.7%Electricity
- 6.7%Fuel oil, kerosene, etc.
- 2.8%Other fuel
- 2.2%Utility gas
Phoenix Lake-Cedar Ridge compared to California state average:
- Unemployed percentage below state average.
- Black race population percentage significantly below state average.
- Hispanic race population percentage significantly below state average.
- Median age significantly above state average.
- Foreign-born population percentage significantly below state average.
- Renting percentage significantly below state average.
- Length of stay since moving in significantly above state average.
- Number of rooms per house significantly below state average.
- House age significantly below state average.
Phoenix Lake-Cedar Ridge on our top lists:
- #5 on the list of "Top 101 cities with largest percentage of females in occupations: architects, surveyors, and cartographers (population 5,000+)"
- #6 on the list of "Top 101 cities with largest percentage of males in occupations: cashiers (population 5,000+)"
- #6 on the list of "Top 101 cities with largest percentage of females in occupations: other healthcare support occupations (population 5,000+)"
- #11 on the list of "Top 101 cities with largest percentage of females in occupations: physicians and surgeons (population 5,000+)"
- #18 on the list of "Top 101 cities with largest percentage of males in occupations: woodworkers (population 5,000+)"
- #24 on the list of "Top 101 cities with largest percentage of females in industries: personal and laundry services (population 5,000+)"
- #26 on the list of "Top 101 cities with largest percentage of females in industries: other direct selling establishments (population 5,000+)"
- #26 on the list of "Top 101 cities with largest percentage of males in occupations: painters and paperhangers (population 5,000+)"
- #29 on the list of "Top 101 cities with largest percentage of males in industries: food and beverage stores (population 5,000+)"
- #36 on the list of "Top 101 cities with largest percentage of males in industries: repair and maintenance (population 5,000+)"
- #40 on the list of "Top 101 cities with largest percentage of males in industries: lumber and other construction materials merchant wholesalers (population 5,000+)"
- #41 on the list of "Top 101 cities with largest percentage of males in industries: pharmacies and drug stores (population 5,000+)"
- #42 on the list of "Top 101 cities with largest percentage of females in industries: food and beverage stores (population 5,000+)"
- #44 on the list of "Top 101 cities with largest percentage of females in industries: electrical and electronic goods merchant wholesalers (population 5,000+)"
- #63 on the list of "Top 101 cities with largest percentage of males in industries: used merchandise, gift, novelty, and souvenir, and other miscellaneous stores (population 5,000+)"
- #64 on the list of "Top 101 cities with largest percentage of males in industries: religious, grantmaking, civic, professional, and similar organizations (population 5,000+)"
- #65 on the list of "Top 101 cities with largest percentage of males in industries: wood products (population 5,000+)"
- #66 on the list of "Top 101 cities with largest percentage of females in industries: repair and maintenance (population 5,000+)"
- #68 on the list of "Top 101 cities with largest percentage of males in industries: alcoholic beverages merchant wholesalers (population 5,000+)"
- #75 on the list of "Top 101 cities with largest percentage of males in industries: motor vehicle and parts dealers (population 5,000+)"
- #40 on the list of "Top 101 counties with highest percentage of residents voting for 3rd party candidates in the 2012 Presidential Election (pop. 50,000+)"