Piney Green, North Carolina Submit your own pictures of this place and show them to the world
OSM Map
General Map
Google Map
MSN Map
OSM Map
General Map
Google Map
MSN Map
OSM Map
General Map
Google Map
MSN Map
OSM Map
General Map
Google Map
MSN Map
Please wait while loading the map...
Population in 2010: 13,293. Population change since 2000: +14.0%Males: 6,904 Females: 6,389
March 2022 cost of living index in Piney Green: 87.8 (less than average, U.S. average is 100) Percentage of residents living in poverty in 2022: 11.9%for White Non-Hispanic residents , 15.9% for Black residents , 19.3% for Hispanic or Latino residents , 44.3% for other race residents , 12.2% for two or more races residents )Business Search - 14 Million verified businesses
Data:
Median household income ($)
Median household income (% change since 2000)
Household income diversity
Ratio of average income to average house value (%)
Ratio of average income to average rent
Median household income ($) - White
Median household income ($) - Black or African American
Median household income ($) - Asian
Median household income ($) - Hispanic or Latino
Median household income ($) - American Indian and Alaska Native
Median household income ($) - Multirace
Median household income ($) - Other Race
Median household income for houses/condos with a mortgage ($)
Median household income for apartments without a mortgage ($)
Races - White alone (%)
Races - White alone (% change since 2000)
Races - Black alone (%)
Races - Black alone (% change since 2000)
Races - American Indian alone (%)
Races - American Indian alone (% change since 2000)
Races - Asian alone (%)
Races - Asian alone (% change since 2000)
Races - Hispanic (%)
Races - Hispanic (% change since 2000)
Races - Native Hawaiian and Other Pacific Islander alone (%)
Races - Native Hawaiian and Other Pacific Islander alone (% change since 2000)
Races - Two or more races (%)
Races - Two or more races (% change since 2000)
Races - Other race alone (%)
Races - Other race alone (% change since 2000)
Racial diversity
Unemployment (%)
Unemployment (% change since 2000)
Unemployment (%) - White
Unemployment (%) - Black or African American
Unemployment (%) - Asian
Unemployment (%) - Hispanic or Latino
Unemployment (%) - American Indian and Alaska Native
Unemployment (%) - Multirace
Unemployment (%) - Other Race
Population density (people per square mile)
Population - Males (%)
Population - Females (%)
Population - Males (%) - White
Population - Males (%) - Black or African American
Population - Males (%) - Asian
Population - Males (%) - Hispanic or Latino
Population - Males (%) - American Indian and Alaska Native
Population - Males (%) - Multirace
Population - Males (%) - Other Race
Population - Females (%) - White
Population - Females (%) - Black or African American
Population - Females (%) - Asian
Population - Females (%) - Hispanic or Latino
Population - Females (%) - American Indian and Alaska Native
Population - Females (%) - Multirace
Population - Females (%) - Other Race
Coronavirus confirmed cases (Apr 23, 2024)
Deaths caused by coronavirus (Apr 23, 2024)
Coronavirus confirmed cases (per 100k population) (Apr 23, 2024)
Deaths caused by coronavirus (per 100k population) (Apr 23, 2024)
Daily increase in number of cases (Apr 23, 2024)
Weekly increase in number of cases (Apr 23, 2024)
Cases doubled (in days) (Apr 23, 2024)
Hospitalized patients (Apr 18, 2022)
Negative test results (Apr 18, 2022)
Total test results (Apr 18, 2022)
COVID Vaccine doses distributed (per 100k population) (Sep 19, 2023)
COVID Vaccine doses administered (per 100k population) (Sep 19, 2023)
COVID Vaccine doses distributed (Sep 19, 2023)
COVID Vaccine doses administered (Sep 19, 2023)
Likely homosexual households (%)
Likely homosexual households (% change since 2000)
Likely homosexual households - Lesbian couples (%)
Likely homosexual households - Lesbian couples (% change since 2000)
Likely homosexual households - Gay men (%)
Likely homosexual households - Gay men (% change since 2000)
Cost of living index
Median gross rent ($)
Median contract rent ($)
Median monthly housing costs ($)
Median house or condo value ($)
Median house or condo value ($ change since 2000)
Mean house or condo value by units in structure - 1, detached ($)
Mean house or condo value by units in structure - 1, attached ($)
Mean house or condo value by units in structure - 2 ($)
Mean house or condo value by units in structure by units in structure - 3 or 4 ($)
Mean house or condo value by units in structure - 5 or more ($)
Mean house or condo value by units in structure - Boat, RV, van, etc. ($)
Mean house or condo value by units in structure - Mobile home ($)
Median house or condo value ($) - White
Median house or condo value ($) - Black or African American
Median house or condo value ($) - Asian
Median house or condo value ($) - Hispanic or Latino
Median house or condo value ($) - American Indian and Alaska Native
Median house or condo value ($) - Multirace
Median house or condo value ($) - Other Race
Median resident age
Resident age diversity
Median resident age - Males
Median resident age - Females
Median resident age - White
Median resident age - Black or African American
Median resident age - Asian
Median resident age - Hispanic or Latino
Median resident age - American Indian and Alaska Native
Median resident age - Multirace
Median resident age - Other Race
Median resident age - Males - White
Median resident age - Males - Black or African American
Median resident age - Males - Asian
Median resident age - Males - Hispanic or Latino
Median resident age - Males - American Indian and Alaska Native
Median resident age - Males - Multirace
Median resident age - Males - Other Race
Median resident age - Females - White
Median resident age - Females - Black or African American
Median resident age - Females - Asian
Median resident age - Females - Hispanic or Latino
Median resident age - Females - American Indian and Alaska Native
Median resident age - Females - Multirace
Median resident age - Females - Other Race
Commute - mean travel time to work (minutes)
Travel time to work - Less than 5 minutes (%)
Travel time to work - Less than 5 minutes (% change since 2000)
Travel time to work - 5 to 9 minutes (%)
Travel time to work - 5 to 9 minutes (% change since 2000)
Travel time to work - 10 to 19 minutes (%)
Travel time to work - 10 to 19 minutes (% change since 2000)
Travel time to work - 20 to 29 minutes (%)
Travel time to work - 20 to 29 minutes (% change since 2000)
Travel time to work - 30 to 39 minutes (%)
Travel time to work - 30 to 39 minutes (% change since 2000)
Travel time to work - 40 to 59 minutes (%)
Travel time to work - 40 to 59 minutes (% change since 2000)
Travel time to work - 60 to 89 minutes (%)
Travel time to work - 60 to 89 minutes (% change since 2000)
Travel time to work - 90 or more minutes (%)
Travel time to work - 90 or more minutes (% change since 2000)
Marital status - Never married (%)
Marital status - Now married (%)
Marital status - Separated (%)
Marital status - Widowed (%)
Marital status - Divorced (%)
Median family income ($)
Median family income (% change since 2000)
Median non-family income ($)
Median non-family income (% change since 2000)
Median per capita income ($)
Median per capita income (% change since 2000)
Median family income ($) - White
Median family income ($) - Black or African American
Median family income ($) - Asian
Median family income ($) - Hispanic or Latino
Median family income ($) - American Indian and Alaska Native
Median family income ($) - Multirace
Median family income ($) - Other Race
Median year house/condo built
Median year apartment built
Year house built - Built 2005 or later (%)
Year house built - Built 2000 to 2004 (%)
Year house built - Built 1990 to 1999 (%)
Year house built - Built 1980 to 1989 (%)
Year house built - Built 1970 to 1979 (%)
Year house built - Built 1960 to 1969 (%)
Year house built - Built 1950 to 1959 (%)
Year house built - Built 1940 to 1949 (%)
Year house built - Built 1939 or earlier (%)
Average household size
Household density (households per square mile)
Average household size - White
Average household size - Black or African American
Average household size - Asian
Average household size - Hispanic or Latino
Average household size - American Indian and Alaska Native
Average household size - Multirace
Average household size - Other Race
Occupied housing units (%)
Vacant housing units (%)
Owner occupied housing units (%)
Renter occupied housing units (%)
Vacancy status - For rent (%)
Vacancy status - For sale only (%)
Vacancy status - Rented or sold, not occupied (%)
Vacancy status - For seasonal, recreational, or occasional use (%)
Vacancy status - For migrant workers (%)
Vacancy status - Other vacant (%)
Residents with income below the poverty level (%)
Residents with income below 50% of the poverty level (%)
Children below poverty level (%)
Poor families by family type - Married-couple family (%)
Poor families by family type - Male, no wife present (%)
Poor families by family type - Female, no husband present (%)
Poverty status for native-born residents (%)
Poverty status for foreign-born residents (%)
Poverty among high school graduates not in families (%)
Poverty among people who did not graduate high school not in families (%)
Residents with income below the poverty level (%) - White
Residents with income below the poverty level (%) - Black or African American
Residents with income below the poverty level (%) - Asian
Residents with income below the poverty level (%) - Hispanic or Latino
Residents with income below the poverty level (%) - American Indian and Alaska Native
Residents with income below the poverty level (%) - Multirace
Residents with income below the poverty level (%) - Other Race
Air pollution - Air Quality Index (AQI)
Air pollution - CO
Air pollution - NO2
Air pollution - SO2
Air pollution - Ozone
Air pollution - PM10
Air pollution - PM25
Air pollution - Pb
Crime - Murders per 100,000 population
Crime - Rapes per 100,000 population
Crime - Robberies per 100,000 population
Crime - Assaults per 100,000 population
Crime - Burglaries per 100,000 population
Crime - Thefts per 100,000 population
Crime - Auto thefts per 100,000 population
Crime - Arson per 100,000 population
Crime - City-data.com crime index
Crime - Violent crime index
Crime - Property crime index
Crime - Murders per 100,000 population (5 year average)
Crime - Rapes per 100,000 population (5 year average)
Crime - Robberies per 100,000 population (5 year average)
Crime - Assaults per 100,000 population (5 year average)
Crime - Burglaries per 100,000 population (5 year average)
Crime - Thefts per 100,000 population (5 year average)
Crime - Auto thefts per 100,000 population (5 year average)
Crime - Arson per 100,000 population (5 year average)
Crime - City-data.com crime index (5 year average)
Crime - Violent crime index (5 year average)
Crime - Property crime index (5 year average)
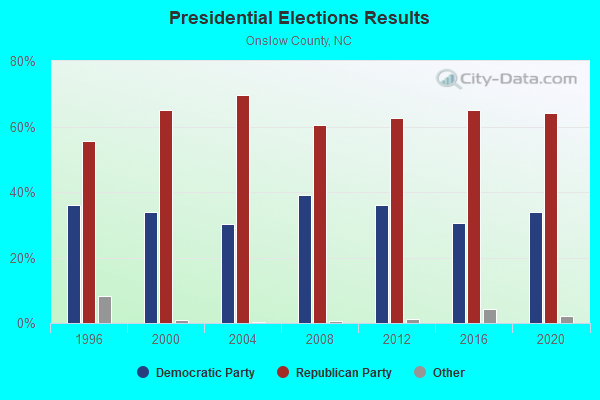
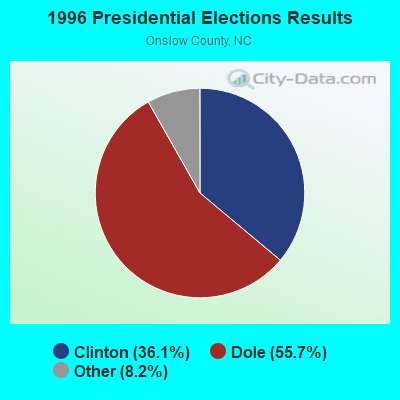
1996 Presidential Elections Results (%) - Democratic Party (Clinton)
1996 Presidential Elections Results (%) - Republican Party (Dole)
1996 Presidential Elections Results (%) - Other
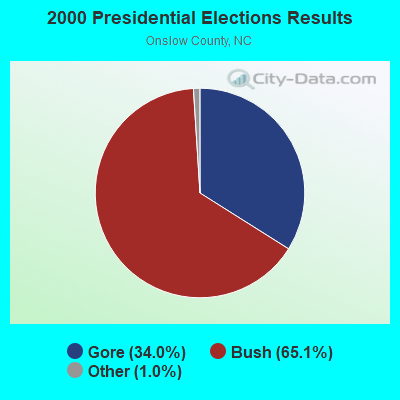
2000 Presidential Elections Results (%) - Democratic Party (Gore)
2000 Presidential Elections Results (%) - Republican Party (Bush)
2000 Presidential Elections Results (%) - Other
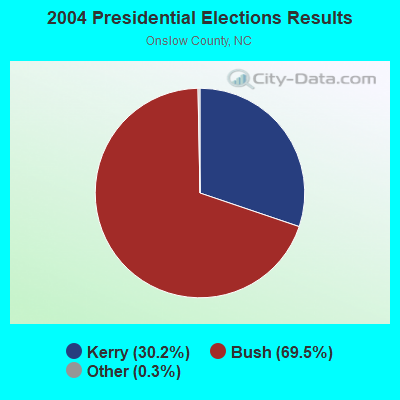
2004 Presidential Elections Results (%) - Democratic Party (Kerry)
2004 Presidential Elections Results (%) - Republican Party (Bush)
2004 Presidential Elections Results (%) - Other
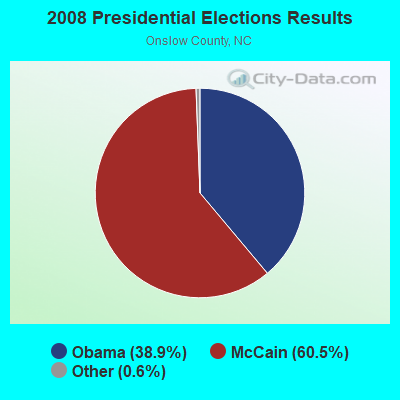
2008 Presidential Elections Results (%) - Democratic Party (Obama)
2008 Presidential Elections Results (%) - Republican Party (McCain)
2008 Presidential Elections Results (%) - Other
2012 Presidential Elections Results (%) - Democratic Party (Obama)
2012 Presidential Elections Results (%) - Republican Party (Romney)
2012 Presidential Elections Results (%) - Other
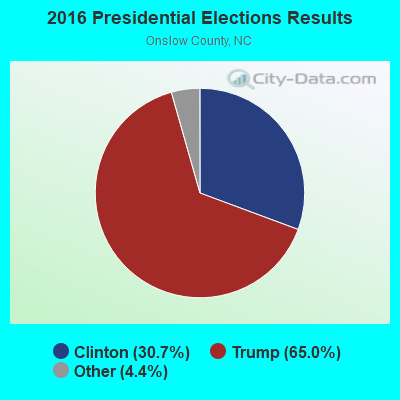
2016 Presidential Elections Results (%) - Democratic Party (Clinton)
2016 Presidential Elections Results (%) - Republican Party (Trump)
2016 Presidential Elections Results (%) - Other
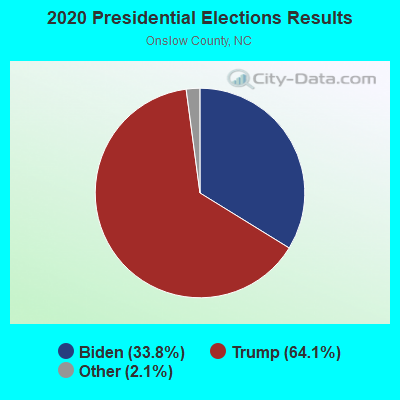
2020 Presidential Elections Results (%) - Democratic Party (Biden)
2020 Presidential Elections Results (%) - Republican Party (Trump)
2020 Presidential Elections Results (%) - Other
Ancestries Reported - Arab (%)
Ancestries Reported - Czech (%)
Ancestries Reported - Danish (%)
Ancestries Reported - Dutch (%)
Ancestries Reported - English (%)
Ancestries Reported - French (%)
Ancestries Reported - French Canadian (%)
Ancestries Reported - German (%)
Ancestries Reported - Greek (%)
Ancestries Reported - Hungarian (%)
Ancestries Reported - Irish (%)
Ancestries Reported - Italian (%)
Ancestries Reported - Lithuanian (%)
Ancestries Reported - Norwegian (%)
Ancestries Reported - Polish (%)
Ancestries Reported - Portuguese (%)
Ancestries Reported - Russian (%)
Ancestries Reported - Scotch-Irish (%)
Ancestries Reported - Scottish (%)
Ancestries Reported - Slovak (%)
Ancestries Reported - Subsaharan African (%)
Ancestries Reported - Swedish (%)
Ancestries Reported - Swiss (%)
Ancestries Reported - Ukrainian (%)
Ancestries Reported - United States (%)
Ancestries Reported - Welsh (%)
Ancestries Reported - West Indian (%)
Ancestries Reported - Other (%)
Educational Attainment - No schooling completed (%)
Educational Attainment - Less than high school (%)
Educational Attainment - High school or equivalent (%)
Educational Attainment - Less than 1 year of college (%)
Educational Attainment - 1 or more years of college (%)
Educational Attainment - Associate degree (%)
Educational Attainment - Bachelor's degree (%)
Educational Attainment - Master's degree (%)
Educational Attainment - Professional school degree (%)
Educational Attainment - Doctorate degree (%)
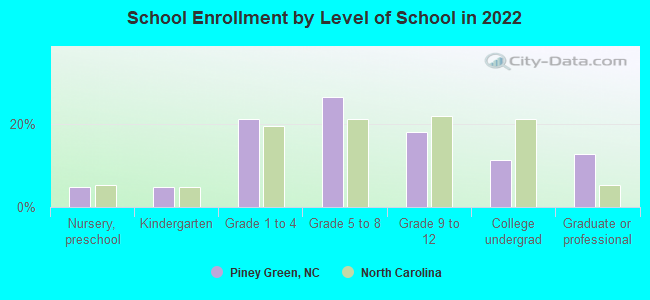
School Enrollment - Nursery, preschool (%)
School Enrollment - Kindergarten (%)
School Enrollment - Grade 1 to 4 (%)
School Enrollment - Grade 5 to 8 (%)
School Enrollment - Grade 9 to 12 (%)
School Enrollment - College undergrad (%)
School Enrollment - Graduate or professional (%)
School Enrollment - Not enrolled in school (%)
School enrollment - Public schools (%)
School enrollment - Private schools (%)
School enrollment - Not enrolled (%)
Median number of rooms in houses and condos
Median number of rooms in apartments
Housing units lacking complete plumbing facilities (%)
Housing units lacking complete kitchen facilities (%)
Density of houses
Urban houses (%)
Rural houses (%)
Households with people 60 years and over (%)
Households with people 65 years and over (%)
Households with people 75 years and over (%)
Households with one or more nonrelatives (%)
Households with no nonrelatives (%)
Population in households (%)
Family households (%)
Nonfamily households (%)
Population in families (%)
Family households with own children (%)
Median number of bedrooms in owner occupied houses
Mean number of bedrooms in owner occupied houses
Median number of bedrooms in renter occupied houses
Mean number of bedrooms in renter occupied houses
Median number of vehichles in owner occupied houses
Mean number of vehichles in owner occupied houses
Median number of vehichles in renter occupied houses
Mean number of vehichles in renter occupied houses
Mortgage status - with mortgage (%)
Mortgage status - with second mortgage (%)
Mortgage status - with home equity loan (%)
Mortgage status - with both second mortgage and home equity loan (%)
Mortgage status - without a mortgage (%)
Average family size
Average family size - White
Average family size - Black or African American
Average family size - Asian
Average family size - Hispanic or Latino
Average family size - American Indian and Alaska Native
Average family size - Multirace
Average family size - Other Race
Geographical mobility - Same house 1 year ago (%)
Geographical mobility - Moved within same county (%)
Geographical mobility - Moved from different county within same state (%)
Geographical mobility - Moved from different state (%)
Geographical mobility - Moved from abroad (%)
Place of birth - Born in state of residence (%)
Place of birth - Born in other state (%)
Place of birth - Native, outside of US (%)
Place of birth - Foreign born (%)
Housing units in structures - 1, detached (%)
Housing units in structures - 1, attached (%)
Housing units in structures - 2 (%)
Housing units in structures - 3 or 4 (%)
Housing units in structures - 5 to 9 (%)
Housing units in structures - 10 to 19 (%)
Housing units in structures - 20 to 49 (%)
Housing units in structures - 50 or more (%)
Housing units in structures - Mobile home (%)
Housing units in structures - Boat, RV, van, etc. (%)
House/condo owner moved in on average (years ago)
Renter moved in on average (years ago)
Year householder moved into unit - Moved in 1999 to March 2000 (%)
Year householder moved into unit - Moved in 1995 to 1998 (%)
Year householder moved into unit - Moved in 1990 to 1994 (%)
Year householder moved into unit - Moved in 1980 to 1989 (%)
Year householder moved into unit - Moved in 1970 to 1979 (%)
Year householder moved into unit - Moved in 1969 or earlier (%)
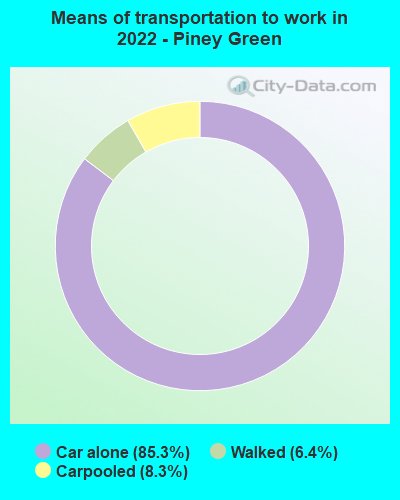
Means of transportation to work - Drove car alone (%)
Means of transportation to work - Carpooled (%)
Means of transportation to work - Public transportation (%)
Means of transportation to work - Bus or trolley bus (%)
Means of transportation to work - Streetcar or trolley car (%)
Means of transportation to work - Subway or elevated (%)
Means of transportation to work - Railroad (%)
Means of transportation to work - Ferryboat (%)
Means of transportation to work - Taxicab (%)
Means of transportation to work - Motorcycle (%)
Means of transportation to work - Bicycle (%)
Means of transportation to work - Walked (%)
Means of transportation to work - Other means (%)
Working at home (%)
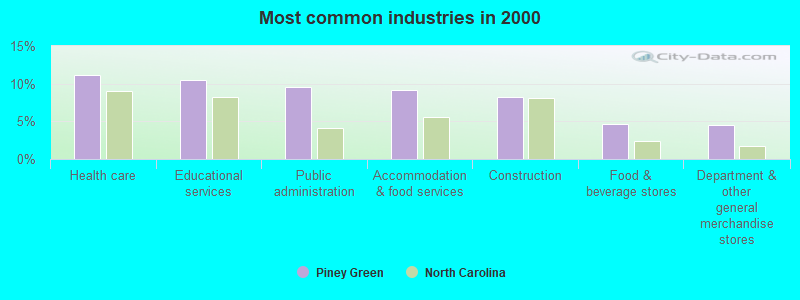
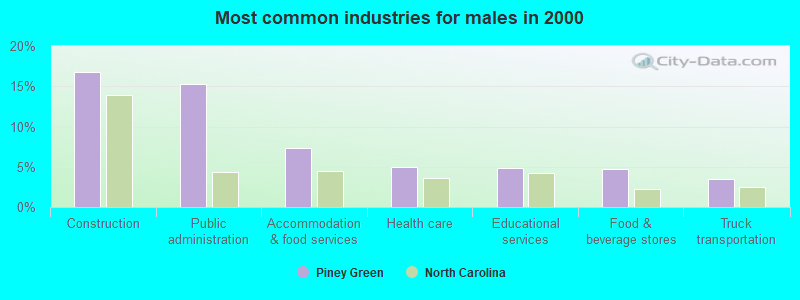
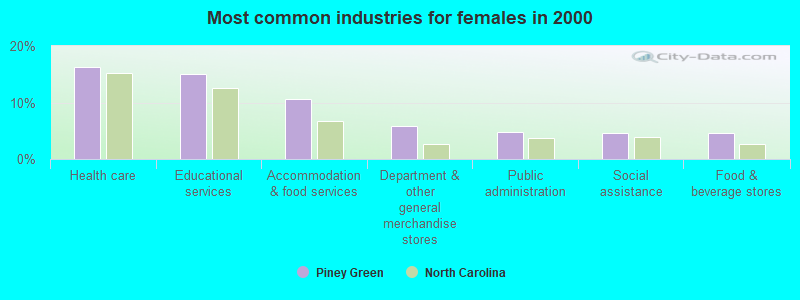
Industry diversity
Most Common Industries - Agriculture, forestry, fishing and hunting, and mining (%)
Most Common Industries - Agriculture, forestry, fishing and hunting (%)
Most Common Industries - Mining, quarrying, and oil and gas extraction (%)
Most Common Industries - Construction (%)
Most Common Industries - Manufacturing (%)
Most Common Industries - Wholesale trade (%)
Most Common Industries - Retail trade (%)
Most Common Industries - Transportation and warehousing, and utilities (%)
Most Common Industries - Transportation and warehousing (%)
Most Common Industries - Utilities (%)
Most Common Industries - Information (%)
Most Common Industries - Finance and insurance, and real estate and rental and leasing (%)
Most Common Industries - Finance and insurance (%)
Most Common Industries - Real estate and rental and leasing (%)
Most Common Industries - Professional, scientific, and management, and administrative and waste management services (%)
Most Common Industries - Professional, scientific, and technical services (%)
Most Common Industries - Management of companies and enterprises (%)
Most Common Industries - Administrative and support and waste management services (%)
Most Common Industries - Educational services, and health care and social assistance (%)
Most Common Industries - Educational services (%)
Most Common Industries - Health care and social assistance (%)
Most Common Industries - Arts, entertainment, and recreation, and accommodation and food services (%)
Most Common Industries - Arts, entertainment, and recreation (%)
Most Common Industries - Accommodation and food services (%)
Most Common Industries - Other services, except public administration (%)
Most Common Industries - Public administration (%)
Occupation diversity
Most Common Occupations - Management, business, science, and arts occupations (%)
Most Common Occupations - Management, business, and financial occupations (%)
Most Common Occupations - Management occupations (%)
Most Common Occupations - Business and financial operations occupations (%)
Most Common Occupations - Computer, engineering, and science occupations (%)
Most Common Occupations - Computer and mathematical occupations (%)
Most Common Occupations - Architecture and engineering occupations (%)
Most Common Occupations - Life, physical, and social science occupations (%)
Most Common Occupations - Education, legal, community service, arts, and media occupations (%)
Most Common Occupations - Community and social service occupations (%)
Most Common Occupations - Legal occupations (%)
Most Common Occupations - Education, training, and library occupations (%)
Most Common Occupations - Arts, design, entertainment, sports, and media occupations (%)
Most Common Occupations - Healthcare practitioners and technical occupations (%)
Most Common Occupations - Health diagnosing and treating practitioners and other technical occupations (%)
Most Common Occupations - Health technologists and technicians (%)
Most Common Occupations - Service occupations (%)
Most Common Occupations - Healthcare support occupations (%)
Most Common Occupations - Protective service occupations (%)
Most Common Occupations - Fire fighting and prevention, and other protective service workers including supervisors (%)
Most Common Occupations - Law enforcement workers including supervisors (%)
Most Common Occupations - Food preparation and serving related occupations (%)
Most Common Occupations - Building and grounds cleaning and maintenance occupations (%)
Most Common Occupations - Personal care and service occupations (%)
Most Common Occupations - Sales and office occupations (%)
Most Common Occupations - Sales and related occupations (%)
Most Common Occupations - Office and administrative support occupations (%)
Most Common Occupations - Natural resources, construction, and maintenance occupations (%)
Most Common Occupations - Farming, fishing, and forestry occupations (%)
Most Common Occupations - Construction and extraction occupations (%)
Most Common Occupations - Installation, maintenance, and repair occupations (%)
Most Common Occupations - Production, transportation, and material moving occupations (%)
Most Common Occupations - Production occupations (%)
Most Common Occupations - Transportation occupations (%)
Most Common Occupations - Material moving occupations (%)
People in Group quarters - Institutionalized population (%)
People in Group quarters - Correctional institutions (%)
People in Group quarters - Federal prisons and detention centers (%)
People in Group quarters - Halfway houses (%)
People in Group quarters - Local jails and other confinement facilities (including police lockups) (%)
People in Group quarters - Military disciplinary barracks (%)
People in Group quarters - State prisons (%)
People in Group quarters - Other types of correctional institutions (%)
People in Group quarters - Nursing homes (%)
People in Group quarters - Hospitals/wards, hospices, and schools for the handicapped (%)
People in Group quarters - Hospitals/wards and hospices for chronically ill (%)
People in Group quarters - Hospices or homes for chronically ill (%)
People in Group quarters - Military hospitals or wards for chronically ill (%)
People in Group quarters - Other hospitals or wards for chronically ill (%)
People in Group quarters - Hospitals or wards for drug/alcohol abuse (%)
People in Group quarters - Mental (Psychiatric) hospitals or wards (%)
People in Group quarters - Schools, hospitals, or wards for the mentally retarded (%)
People in Group quarters - Schools, hospitals, or wards for the physically handicapped (%)
People in Group quarters - Institutions for the deaf (%)
People in Group quarters - Institutions for the blind (%)
People in Group quarters - Orthopedic wards and institutions for the physically handicapped (%)
People in Group quarters - Wards in general hospitals for patients who have no usual home elsewhere (%)
People in Group quarters - Wards in military hospitals for patients who have no usual home elsewhere (%)
People in Group quarters - Juvenile institutions (%)
People in Group quarters - Long-term care (%)
People in Group quarters - Homes for abused, dependent, and neglected children (%)
People in Group quarters - Residential treatment centers for emotionally disturbed children (%)
People in Group quarters - Training schools for juvenile delinquents (%)
People in Group quarters - Short-term care, detention or diagnostic centers for delinquent children (%)
People in Group quarters - Type of juvenile institution unknown (%)
People in Group quarters - Noninstitutionalized population (%)
People in Group quarters - College dormitories (includes college quarters off campus) (%)
People in Group quarters - Military quarters (%)
People in Group quarters - On base (%)
People in Group quarters - Barracks, unaccompanied personnel housing (UPH), (Enlisted/Officer), ;and similar group living quarters for military personnel (%)
People in Group quarters - Transient quarters for temporary residents (%)
People in Group quarters - Military ships (%)
People in Group quarters - Group homes (%)
People in Group quarters - Homes or halfway houses for drug/alcohol abuse (%)
People in Group quarters - Homes for the mentally ill (%)
People in Group quarters - Homes for the mentally retarded (%)
People in Group quarters - Homes for the physically handicapped (%)
People in Group quarters - Other group homes (%)
People in Group quarters - Religious group quarters (%)
People in Group quarters - Dormitories (%)
People in Group quarters - Agriculture workers' dormitories on farms (%)
People in Group quarters - Job Corps and vocational training facilities (%)
People in Group quarters - Other workers' dormitories (%)
People in Group quarters - Crews of maritime vessels (%)
People in Group quarters - Other nonhousehold living situations (%)
People in Group quarters - Other noninstitutional group quarters (%)
Residents speaking English at home (%)
Residents speaking English at home - Born in the United States (%)
Residents speaking English at home - Native, born elsewhere (%)
Residents speaking English at home - Foreign born (%)
Residents speaking Spanish at home (%)
Residents speaking Spanish at home - Born in the United States (%)
Residents speaking Spanish at home - Native, born elsewhere (%)
Residents speaking Spanish at home - Foreign born (%)
Residents speaking other language at home (%)
Residents speaking other language at home - Born in the United States (%)
Residents speaking other language at home - Native, born elsewhere (%)
Residents speaking other language at home - Foreign born (%)
Class of Workers - Employee of private company (%)
Class of Workers - Self-employed in own incorporated business (%)
Class of Workers - Private not-for-profit wage and salary workers (%)
Class of Workers - Local government workers (%)
Class of Workers - State government workers (%)
Class of Workers - Federal government workers (%)
Class of Workers - Self-employed workers in own not incorporated business and Unpaid family workers (%)
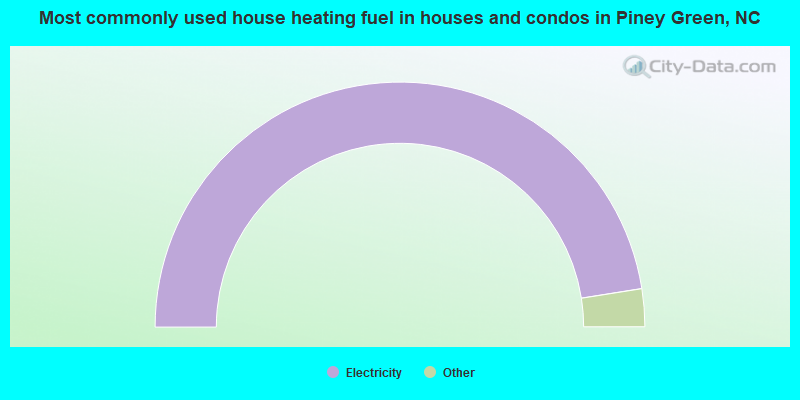
House heating fuel used in houses and condos - Utility gas (%)
House heating fuel used in houses and condos - Bottled, tank, or LP gas (%)
House heating fuel used in houses and condos - Electricity (%)
House heating fuel used in houses and condos - Fuel oil, kerosene, etc. (%)
House heating fuel used in houses and condos - Coal or coke (%)
House heating fuel used in houses and condos - Wood (%)
House heating fuel used in houses and condos - Solar energy (%)
House heating fuel used in houses and condos - Other fuel (%)
House heating fuel used in houses and condos - No fuel used (%)
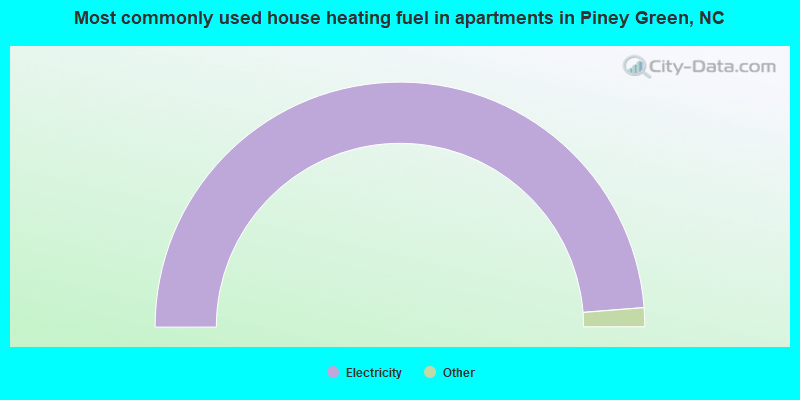
House heating fuel used in apartments - Utility gas (%)
House heating fuel used in apartments - Bottled, tank, or LP gas (%)
House heating fuel used in apartments - Electricity (%)
House heating fuel used in apartments - Fuel oil, kerosene, etc. (%)
House heating fuel used in apartments - Coal or coke (%)
House heating fuel used in apartments - Wood (%)
House heating fuel used in apartments - Solar energy (%)
House heating fuel used in apartments - Other fuel (%)
House heating fuel used in apartments - No fuel used (%)
Armed forces status - In Armed Forces (%)
Armed forces status - Civilian (%)
Armed forces status - Civilian - Veteran (%)
Armed forces status - Civilian - Nonveteran (%)
Fatal accidents locations in years 2005-2021
Fatal accidents locations in 2005
Fatal accidents locations in 2006
Fatal accidents locations in 2007
Fatal accidents locations in 2008
Fatal accidents locations in 2009
Fatal accidents locations in 2010
Fatal accidents locations in 2011
Fatal accidents locations in 2012
Fatal accidents locations in 2013
Fatal accidents locations in 2014
Fatal accidents locations in 2015
Fatal accidents locations in 2016
Fatal accidents locations in 2017
Fatal accidents locations in 2018
Fatal accidents locations in 2019
Fatal accidents locations in 2020
Fatal accidents locations in 2021
Alcohol use - People drinking some alcohol every month (%)
Alcohol use - People not drinking at all (%)
Alcohol use - Average days/month drinking alcohol
Alcohol use - Average drinks/week
Alcohol use - Average days/year people drink much
Audiometry - Average condition of hearing (%)
Audiometry - People that can hear a whisper from across a quiet room (%)
Audiometry - People that can hear normal voice from across a quiet room (%)
Audiometry - Ears ringing, roaring, buzzing (%)
Audiometry - Had a job exposure to loud noise (%)
Audiometry - Had off-work exposure to loud noise (%)
Blood Pressure & Cholesterol - Has high blood pressure (%)
Blood Pressure & Cholesterol - Checking blood pressure at home (%)
Blood Pressure & Cholesterol - Frequently checking blood cholesterol (%)
Blood Pressure & Cholesterol - Has high cholesterol level (%)
Consumer Behavior - Money monthly spent on food at supermarket/grocery store
Consumer Behavior - Money monthly spent on food at other stores
Consumer Behavior - Money monthly spent on eating out
Consumer Behavior - Money monthly spent on carryout/delivered foods
Consumer Behavior - Income spent on food at supermarket/grocery store (%)
Consumer Behavior - Income spent on food at other stores (%)
Consumer Behavior - Income spent on eating out (%)
Consumer Behavior - Income spent on carryout/delivered foods (%)
Current Health Status - General health condition (%)
Current Health Status - Blood donors (%)
Current Health Status - Has blood ever tested for HIV virus (%)
Current Health Status - Left-handed people (%)
Dermatology - People using sunscreen (%)
Diabetes - Diabetics (%)
Diabetes - Had a blood test for high blood sugar (%)
Diabetes - People taking insulin (%)
Diet Behavior & Nutrition - Diet health (%)
Diet Behavior & Nutrition - Milk product consumption (# of products/month)
Diet Behavior & Nutrition - Meals not home prepared (#/week)
Diet Behavior & Nutrition - Meals from fast food or pizza place (#/week)
Diet Behavior & Nutrition - Ready-to-eat foods (#/month)
Diet Behavior & Nutrition - Frozen meals/pizza (#/month)
Drug Use - People that ever used marijuana or hashish (%)
Drug Use - Ever used hard drugs (%)
Drug Use - Ever used any form of cocaine (%)
Drug Use - Ever used heroin (%)
Drug Use - Ever used methamphetamine (%)
Health Insurance - People covered by health insurance (%)
Kidney Conditions-Urology - Avg. # of times urinating at night
Medical Conditions - People with asthma (%)
Medical Conditions - People with anemia (%)
Medical Conditions - People with psoriasis (%)
Medical Conditions - People with overweight (%)
Medical Conditions - Elderly people having difficulties in thinking or remembering (%)
Medical Conditions - People who ever received blood transfusion (%)
Medical Conditions - People having trouble seeing even with glass/contacts (%)
Medical Conditions - People with arthritis (%)
Medical Conditions - People with gout (%)
Medical Conditions - People with congestive heart failure (%)
Medical Conditions - People with coronary heart disease (%)
Medical Conditions - People with angina pectoris (%)
Medical Conditions - People who ever had heart attack (%)
Medical Conditions - People who ever had stroke (%)
Medical Conditions - People with emphysema (%)
Medical Conditions - People with thyroid problem (%)
Medical Conditions - People with chronic bronchitis (%)
Medical Conditions - People with any liver condition (%)
Medical Conditions - People who ever had cancer or malignancy (%)
Mental Health - People who have little interest in doing things (%)
Mental Health - People feeling down, depressed, or hopeless (%)
Mental Health - People who have trouble sleeping or sleeping too much (%)
Mental Health - People feeling tired or having little energy (%)
Mental Health - People with poor appetite or overeating (%)
Mental Health - People feeling bad about themself (%)
Mental Health - People who have trouble concentrating on things (%)
Mental Health - People moving or speaking slowly or too fast (%)
Mental Health - People having thoughts they would be better off dead (%)
Oral Health - Average years since last visit a dentist
Oral Health - People embarrassed because of mouth (%)
Oral Health - People with gum disease (%)
Oral Health - General health of teeth and gums (%)
Oral Health - Average days a week using dental floss/device
Oral Health - Average days a week using mouthwash for dental problem
Oral Health - Average number of teeth
Pesticide Use - Households using pesticides to control insects (%)
Pesticide Use - Households using pesticides to kill weeds (%)
Physical Activity - People doing vigorous-intensity work activities (%)
Physical Activity - People doing moderate-intensity work activities (%)
Physical Activity - People walking or bicycling (%)
Physical Activity - People doing vigorous-intensity recreational activities (%)
Physical Activity - People doing moderate-intensity recreational activities (%)
Physical Activity - Average hours a day doing sedentary activities
Physical Activity - Average hours a day watching TV or videos
Physical Activity - Average hours a day using computer
Physical Functioning - People having limitations keeping them from working (%)
Physical Functioning - People limited in amount of work they can do (%)
Physical Functioning - People that need special equipment to walk (%)
Physical Functioning - People experiencing confusion/memory problems (%)
Physical Functioning - People requiring special healthcare equipment (%)
Prescription Medications - Average number of prescription medicines taking
Preventive Aspirin Use - Adults 40+ taking low-dose aspirin (%)
Reproductive Health - Vaginal deliveries (%)
Reproductive Health - Cesarean deliveries (%)
Reproductive Health - Deliveries resulted in a live birth (%)
Reproductive Health - Pregnancies resulted in a delivery (%)
Reproductive Health - Women breastfeeding newborns (%)
Reproductive Health - Women that had a hysterectomy (%)
Reproductive Health - Women that had both ovaries removed (%)
Reproductive Health - Women that have ever taken birth control pills (%)
Reproductive Health - Women taking birth control pills (%)
Reproductive Health - Women that have ever used Depo-Provera or injectables (%)
Reproductive Health - Women that have ever used female hormones (%)
Sexual Behavior - People 18+ that ever had sex (vaginal, anal, or oral) (%)
Sexual Behavior - Males 18+ that ever had vaginal sex with a woman (%)
Sexual Behavior - Males 18+ that ever performed oral sex on a woman (%)
Sexual Behavior - Males 18+ that ever had anal sex with a woman (%)
Sexual Behavior - Males 18+ that ever had any sex with a man (%)
Sexual Behavior - Females 18+ that ever had vaginal sex with a man (%)
Sexual Behavior - Females 18+ that ever performed oral sex on a man (%)
Sexual Behavior - Females 18+ that ever had anal sex with a man (%)
Sexual Behavior - Females 18+ that ever had any kind of sex with a woman (%)
Sexual Behavior - Average age people first had sex
Sexual Behavior - Average number of female sex partners in lifetime (males 18+)
Sexual Behavior - Average number of female vaginal sex partners in lifetime (males 18+)
Sexual Behavior - Average age people first performed oral sex on a woman (18+)
Sexual Behavior - Average number of woman performed oral sex on in lifetime (18+)
Sexual Behavior - Average number of male sex partners in lifetime (males 18+)
Sexual Behavior - Average number of male anal sex partners in lifetime (males 18+)
Sexual Behavior - Average age people first performed oral sex on a man (18+)
Sexual Behavior - Average number of male oral sex partners in lifetime (18+)
Sexual Behavior - People using protection when performing oral sex (%)
Sexual Behavior - Average number of times people have vaginal or anal sex a year
Sexual Behavior - People having sex without condom (%)
Sexual Behavior - Average number of male sex partners in lifetime (females 18+)
Sexual Behavior - Average number of male vaginal sex partners in lifetime (females 18+)
Sexual Behavior - Average number of female sex partners in lifetime (females 18+)
Sexual Behavior - Circumcised males 18+ (%)
Sleep Disorders - Average hours sleeping at night
Sleep Disorders - People that has trouble sleeping (%)
Smoking-Cigarette Use - People smoking cigarettes (%)
Taste & Smell - People 40+ having problems with smell (%)
Taste & Smell - People 40+ having problems with taste (%)
Taste & Smell - People 40+ that ever had wisdom teeth removed (%)
Taste & Smell - People 40+ that ever had tonsils teeth removed (%)
Taste & Smell - People 40+ that ever had a loss of consciousness because of a head injury (%)
Taste & Smell - People 40+ that ever had a broken nose or other serious injury to face or skull (%)
Taste & Smell - People 40+ that ever had two or more sinus infections (%)
Weight - Average height (inches)
Weight - Average weight (pounds)
Weight - Average BMI
Weight - People that are obese (%)
Weight - People that ever were obese (%)
Weight - People trying to lose weight (%)
Latest news from Piney Green, NC collected exclusively by city-data.com from local newspapers, TV, and radio stations
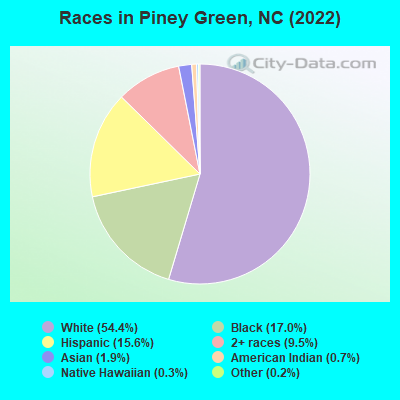
Ancestries: English (6.9%), German (6.5%), Irish (5.6%), American (3.5%), Scandinavian (3.2%), Nigerian (2.0%).
Current Local Time:
Land area: 13.4 square miles.
Population density: 991 people per square mile (low).
676 residents are foreign born (1.8% Asia , 1.8% Latin America ).
This place:
4.5%North Carolina:
8.3%
Median real estate property taxes paid for housing units with mortgages in 2022: $1,136 (0.5%)Median real estate property taxes paid for housing units with no mortgage in 2022: $1,019 (0.5%)
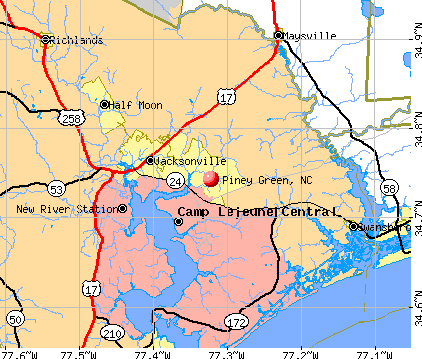
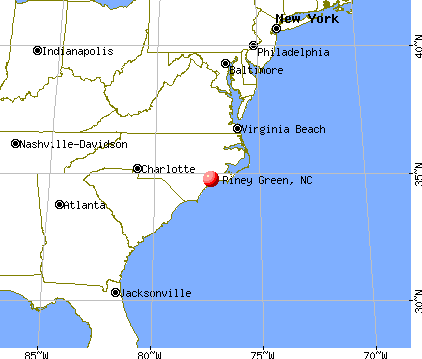
Nearest city with pop. 50,000+: Jacksonville, NC
Nearest city with pop. 200,000+: Raleigh, NC
Nearest city with pop. 1,000,000+: Philadelphia, PA
Nearest cities:
Latitude: 34.74 N, Longitude: 77.32 W
Daytime population change due to commuting: -6,237 (-41.5%)Workers who live and work in this place: 824 (11.0%)
Area code commonly used in this area: 910
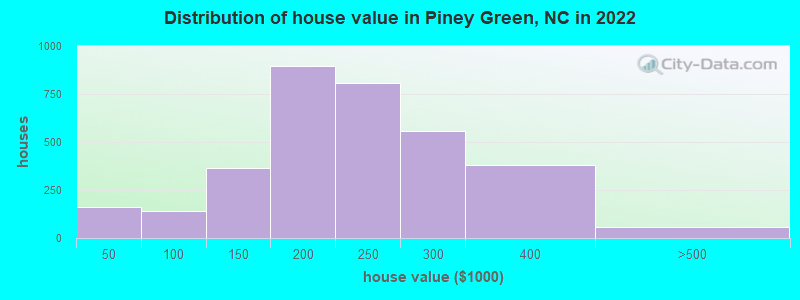
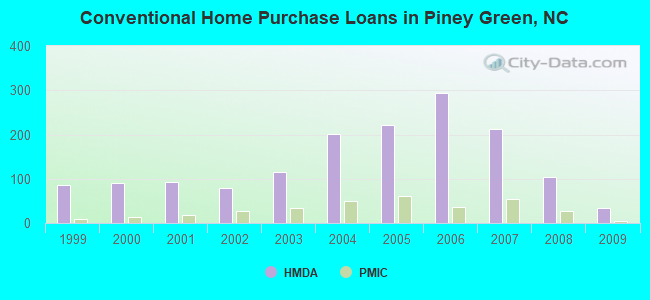
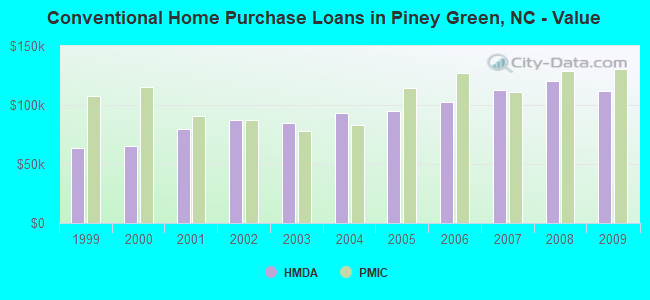
Property values in Piney Green, NC
Unemployment in December 2023: Here:
3.7%North Carolina:
3.2%
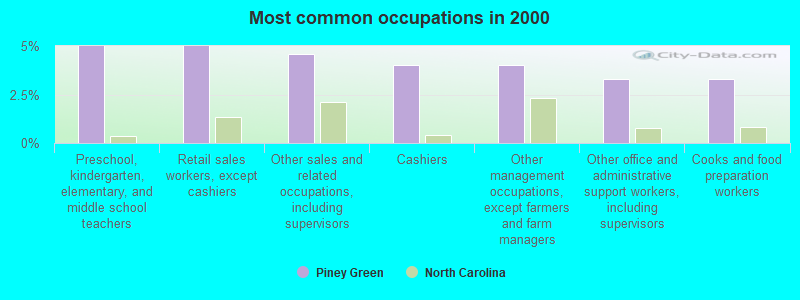
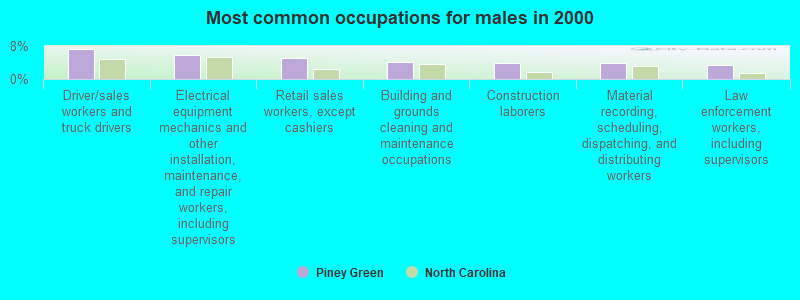
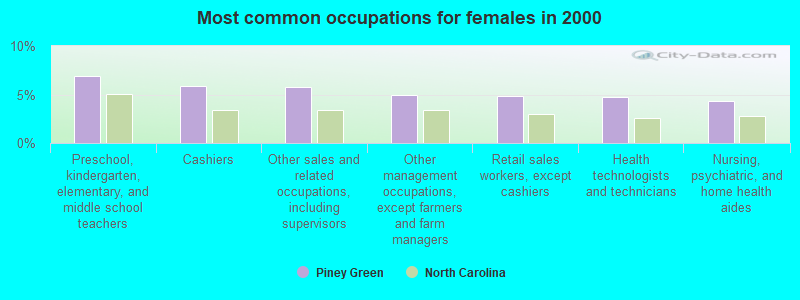
Most common occupations in Piney Green, NC (%)
Both Males Females
Preschool, kindergarten, elementary, and middle school teachers (5.0%)
Retail sales workers, except cashiers (5.0%)
Other sales and related occupations, including supervisors (4.6%)
Cashiers (4.0%)
Other management occupations, except farmers and farm managers (4.0%)
Other office and administrative support workers, including supervisors (3.3%)
Cooks and food preparation workers (3.3%)
Driver/sales workers and truck drivers (7.2%)
Electrical equipment mechanics and other installation, maintenance, and repair workers, including supervisors (5.9%)
Retail sales workers, except cashiers (5.2%)
Building and grounds cleaning and maintenance occupations (4.2%)
Construction laborers (4.0%)
Material recording, scheduling, dispatching, and distributing workers (3.8%)
Law enforcement workers, including supervisors (3.5%)
Preschool, kindergarten, elementary, and middle school teachers (7.0%)
Cashiers (5.9%)
Other sales and related occupations, including supervisors (5.8%)
Other management occupations, except farmers and farm managers (4.9%)
Retail sales workers, except cashiers (4.8%)
Health technologists and technicians (4.7%)
Nursing, psychiatric, and home health aides (4.3%)
Tornado activity:
Piney Green-area historical tornado activity is near North Carolina state average. It is 18% smaller than the overall U.S. average.
On 3/17/1965, a category F3 (max. wind speeds 158-206 mph) tornado 18.7 miles away from the Piney Green place center killed 2 people and injured 85 people and caused between $500,000 and $5,000,000 in damages.
On 3/28/1984, a category F4 (max. wind speeds 207-260 mph) tornado 48.2 miles away from the place center killed 16 people and injured 153 people and caused between $5,000,000 and $50,000,000 in damages.
Earthquake activity:
Piney Green-area historical earthquake activity is significantly above North Carolina state average. It is 66% smaller than the overall U.S. average. On 8/23/2011 at 17:51:04, a magnitude 5.8 (5.8 MW, Depth: 3.7 mi, Class: Moderate, Intensity: VI - VII) earthquake occurred 221.7 miles away from the city center On 8/9/2020 at 12:07:37, a magnitude 5.1 (5.1 MW, Depth: 4.7 mi) earthquake occurred 243.6 miles away from the city center On 11/22/1974 at 05:25:55, a magnitude 4.7 (4.7 MB, Class: Light, Intensity: IV - V) earthquake occurred 206.3 miles away from the city center On 8/6/1994 at 19:54:09, a magnitude 3.8 (3.6 LG, 3.8 LG, Depth: 3.1 mi, Class: Light, Intensity: II - III) earthquake occurred 39.4 miles away from the city center On 12/9/2003 at 20:59:14, a magnitude 4.5 (4.5 MB, 4.5 LG) earthquake occurred 199.4 miles away from the city center On 12/9/2003 at 20:59:18, a magnitude 4.5 (4.5 ML, Depth: 6.2 mi) earthquake occurred 214.1 miles away from Piney Green center Magnitude types: regional Lg-wave magnitude (LG), body-wave magnitude (MB), local magnitude (ML), moment magnitude (MW) Natural disasters: The number of natural disasters in Onslow County (21) is greater than the US average (15).Major Disasters (Presidential) Declared: 10Emergencies Declared: 7Hurricanes: 18, Floods: 2, Storms: 2, Tornado: 1, Tropical Storm: 1, Wind: 1, Other: 1 (Note: some incidents may be assigned to more than one category). Hospitals and medical centers near Piney Green: ONSLOW COUNTY HOME HLTH AND HOSP (Home Health Center, about 3 miles away; JACKSONVILLE, NC)
BRYNN MARR HOSP (Hospital, about 3 miles away; JACKSONVILLE, NC)
SOUTHEASTERN DIALYSIS CENTER (Dialysis Facility, about 4 miles away; JACKSONVILLE, NC)
ONSLOW MEMORIAL HOSPITAL (about 4 miles away; JACKSONVILLE, NC)
SURGERY CENTER,THE (Hospital, about 4 miles away; JACKSONVILLE, NC)
PREMIER NURSING AND REHABILITATION CENTER (Nursing Home, about 4 miles away; JACKSONVILLE, NC)
ONSLOW HOME HEALTH AND HOSPICE (Hospital, about 5 miles away; JACKSONVILLE, NC)
Colleges/universities with over 2000 students nearest to Piney Green:
Coastal Carolina Community College (about 5 miles; Jacksonville, NC ; Full-time enrollment: 4,502)
Craven Community College (about 29 miles; New Bern, NC ; FT enrollment: 2,712)
Lenoir Community College (about 37 miles; Kinston, NC ; FT enrollment: 2,555)
University of North Carolina Wilmington (about 48 miles; Wilmington, NC ; FT enrollment: 13,112)
Miller-Motte College-Wilmington (about 48 miles; Wilmington, NC ; FT enrollment: 2,395)
Cape Fear Community College (about 50 miles; Wilmington, NC ; FT enrollment: 8,372)
Mount Olive College (about 54 miles; Mount Olive, NC ; FT enrollment: 3,097)
Public elementary/middle school in Piney Green:
See full list of schools located in Piney Green Onslow County has a predicted average indoor radon screening level less than 2 pCi/L (pico curies per liter) - Low Potential Average household size: This place:
2.7 peopleNorth Carolina:
2.5 people
Percentage of family households: This place:
74.4%Whole state:
66.7%
Percentage of households with unmarried partners: This place:
5.9%Whole state:
5.9%
Likely homosexual households (counted as self-reported same-sex unmarried-partner households)
Lesbian couples: 0.3% of all households Gay men: 0.2% of all households
28 people in group homes intended for adults in 2010people in other noninstitutional group quarters in 2000
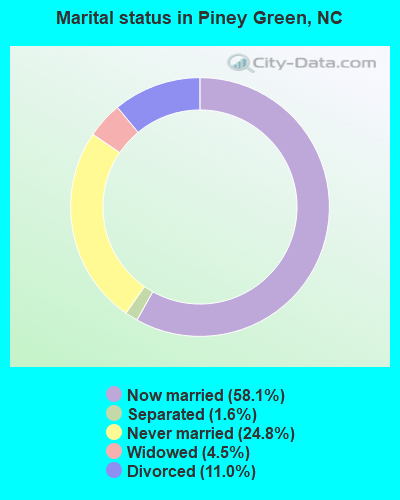
For population 15 years and over in Piney Green:
Never married: 24.8%Now married: 58.1%Separated: 1.6%Widowed: 4.5%Divorced: 11.0% For population 25 years and over in Piney Green:
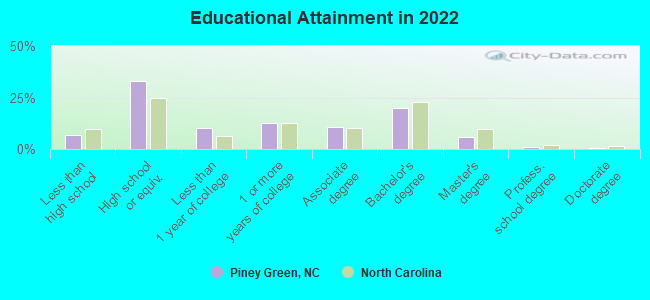
High school or higher: 92.4%Bachelor's degree or higher: 24.1%Graduate or professional degree: 6.4%Unemployed: 7.2%Mean travel time to work (commute): 19.9 minutes
Education Gini index (Inequality in education) Here:
9.5North Carolina average:
11.7
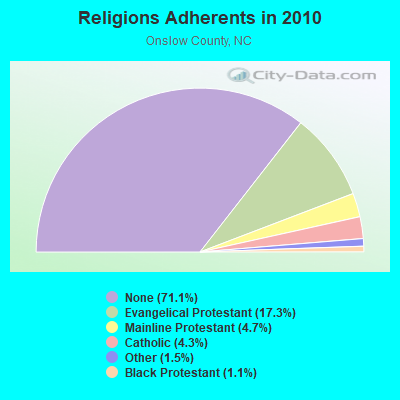
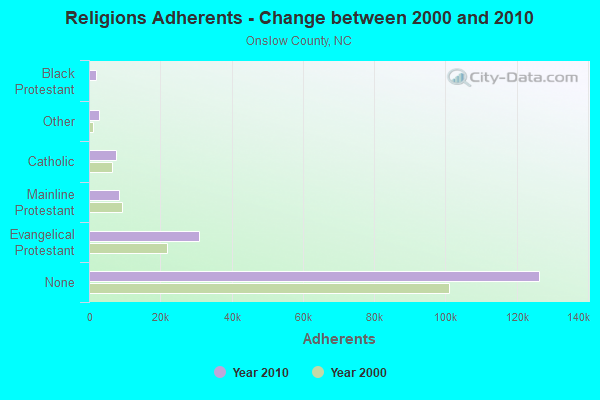
Religion statistics for Piney Green, NC (based on Onslow County data)
Religion Adherents Congregations Evangelical Protestant 30,825 110 Mainline Protestant 8,398 22 Catholic 7,579 2 Other 2,704 7 Black Protestant 1,891 17 None 126,375 -
Source: Clifford Grammich, Kirk Hadaway, Richard Houseal, Dale E.Jones, Alexei Krindatch, Richie Stanley and Richard H.Taylor. 2012. 2010 U.S.Religion Census: Religious Congregations & Membership Study. Association of Statisticians of American Religious Bodies. Jones, Dale E., et al. 2002. Congregations and Membership in the United States 2000. Nashville, TN: Glenmary Research Center. Graphs represent county-level data
Food Environment Statistics: Number of grocery stores : 22Onslow County :
1.35 / 10,000 pop.North Carolina :
2.05 / 10,000 pop.
Number of supercenters and club stores : 2Here :
0.12 / 10,000 pop.North Carolina :
0.14 / 10,000 pop.
Number of convenience stores (no gas) : 13Onslow County :
0.80 / 10,000 pop.North Carolina :
0.92 / 10,000 pop.
Number of convenience stores (with gas) : 60Here :
3.67 / 10,000 pop.North Carolina :
4.75 / 10,000 pop.
Number of full-service restaurants : 89Here :
5.45 / 10,000 pop.North Carolina :
7.57 / 10,000 pop.
Low-income preschool obesity rate : Onslow County :
10.9%North Carolina :
15.6%
Health and Nutrition: Healthy diet rate : Piney Green:
49.7%North Carolina:
48.9%
Average overall health of teeth and gums : Here:
49.1%North Carolina:
46.1%
Average BMI : Here:
28.5North Carolina:
28.8
People feeling badly about themselves : Piney Green:
19.3%North Carolina:
20.7%
People not drinking alcohol at all : Piney Green:
11.0%North Carolina:
10.7%
Average hours sleeping at night : Piney Green:
6.8North Carolina:
6.8
Overweight people : Piney Green:
30.6%North Carolina:
33.7%
General health condition : Piney Green:
58.8%North Carolina:
55.8%
Average condition of hearing : More about Health and Nutrition of Piney Green, NC Residents
15.53% of this county's 2021 resident taxpayers lived in other counties in 2020 ($50,909 average adjusted gross income )
Here:
15.53%North Carolina average:
8.85%
0.53% of residents moved from foreign countries ($2,593 average AGI )Onslow County:
0.53%North Carolina average:
0.04%
Top counties from which taxpayers relocated into this county between 2020 and 2021:
15.26% of this county's 2020 resident taxpayers moved to other counties in 2021 ($47,219 average adjusted gross income )
Here:
15.26%North Carolina average:
7.89%
0.45% of residents moved to foreign countries ($1,814 average AGI )Onslow County:
0.45%North Carolina average:
0.03%
Top counties to which taxpayers relocated from this county between 2020 and 2021: Strongest AM radio stations in Piney Green:
WSMO (1120 AM; 20 kW; CAMP LEJEUNE, NC; Owner: CTC MEDIA GROUP, INC.)
WJCV (1290 AM; 5 kW; JACKSONVILLE, NC; Owner: DOWN EAST BROADCASTING CO INC.)
WSTK (910 AM; 5 kW; JACKSONVILLE, NC; Owner: EASTERN BROADCASTING, INC.)
WJNC (1240 AM; 1 kW; JACKSONVILLE, NC; Owner: HERITAGE BROADCASTING, LLC)
WPTF (680 AM; 50 kW; RALEIGH, NC; Owner: FIRST STATE COMMUNICATIONS)
WRNS (960 AM; 5 kW; KINSTON, NC; Owner: NM LICENSING, LLC)
WFTK (1030 AM; daytime; 50 kW; WAKE FOREST, NC; Owner: POSITIVE RADIO GROUP, INC.)
WNCT (1070 AM; 10 kW; GREENVILLE, NC; Owner: WNCT LICENSE LIMITED PARTNERSHIP)
WDJS (1430 AM; 10 kW; MOUNT OLIVE, NC; Owner: MOUNT OLIVE BROADCASTING CO.)
WMYT (1180 AM; daytime; 10 kW; CAROLINA BEACH, NC; Owner: FAMILY RADIO NETWORK, INC.)
WTAR (850 AM; 50 kW; NORFOLK, VA; Owner: SINCLAIR COMMUNICATIONS)
WAAV (980 AM; 5 kW; LELAND, NC; Owner: CUMULUS LICENSING CORP.)
WCKO (1110 AM; daytime; 50 kW; NORFOLK, VA; Owner: WORD BROADCASTING NETWORK, INC.)
Strongest FM radio stations in Piney Green:
WKOO (98.7 FM; JACKSONVILLE, NC; Owner: NM LICENSING, LLC)
WXQR-FM (105.5 FM; JACKSONVILLE, NC; Owner: NM LICENSING, LLC)
WSFL-FM (106.5 FM; NEW BERN, NC; Owner: WSFL LICENSE LIMITED PARTNERSHIP)
WQSL (92.3 FM; JACKSONVILLE, NC; Owner: NM LICENSING, LLC)
WERO (93.3 FM; WASHINGTON, NC; Owner: NM LICENSING, LLC)
WNCT-FM (107.9 FM; GREENVILLE, NC; Owner: WNCT LICENSE LIMITED PARTNERSHIP)
WRNS-FM (95.1 FM; KINSTON, NC; Owner: NM LICENSING, LLC)
WIKS (101.9 FM; NEW BERN, NC; Owner: WIKS LICENSE LIMITED PARTNERSHIP)
WMGV (103.3 FM; NEWPORT, NC; Owner: WMGV LICENSE LIMITED PARTNERSHIP)
WXNR (99.5 FM; GRIFTON, NC; Owner: WXNR LICENSE LIMITED PARTNERSHIP)
WNBR (94.1 FM; ORIENTAL, NC; Owner: ABG NORTH CAROLINA, LLC)
WRHT (96.3 FM; MOREHEAD CITY, NC; Owner: ABG NORTH CAROLINA, LLC)
WLGP (100.3 FM; HARKERS ISLAND, NC; Owner: BARINOWSKI INVESTMENT COMPANY)
WOTJ (90.7 FM; MOREHEAD CITY, NC; Owner: GRACE CHRISTIAN SCHOOL)
WTEB (89.3 FM; NEW BERN, NC; Owner: CRAVEN COMMUNITY COLLEGE)
WANG-FM (105.1 FM; HAVELOCK, NC; Owner: NM LICENSING, LLC)
WBJD (91.5 FM; ATLANTIC BEACH, NC; Owner: CRAVEN COMMUNITY COLLEGE)
WWTB (103.9 FM; TOPSAIL BEACH, NC; Owner: JACKSONVILLE-TOPSAIL RADIO LLC)
TV broadcast stations around Piney Green:
WCTI-TV (Channel 12; NEW BERN, NC; Owner: EASTERN NORTH CAROLINA BROADCASTING CORPORATION)
WUNM-TV (Channel 19; JACKSONVILLE, NC; Owner: UNIVERSITY OF NORTH CAROLINA)
WPXU-TV (Channel 35; JACKSONVILLE, NC; Owner: PAXSON JACKSONVILLE LICENSE, INC.)
WITN-TV (Channel 7; WASHINGTON, NC; Owner: WITN LICENSEE CORP.)
WNCT-TV (Channel 9; GREENVILLE, NC; Owner: MEDIA GENERAL COMMUNICATIONS, INC.)
National Bridge Inventory (NBI) Statistics 4 Number of bridges30ft / 9.4m Total length15,100 Total average daily traffic999 Total average daily truck traffic30,200 Total future (year 2040) average daily traffic
FCC Registered Microwave Towers: 1
CLFAY00173A, 200 Toni Drive (Lat: 34.757583 Lon: -77.339750), Type: Mast, Structure height: 57.9 m, Overall height: 58.5 m, Call Sign: WRXY653, Assigned Frequencies: 19575.0 MHz, 19575.0 MHz, 19575.0 MHz, 19575.0 MHz, 19575.0 MHz, 19575.0 MHz, 19575.0 MHz, 19575.0 MHz, 19575.0 MHz, 19575.0 MHz, 19575.0 MHz, 19575.0 MHz, Grant Date: 07/11/2023, Expiration Date: 07/11/2033, Certifier: Alison A Minea, Registrant: Dish Wireless L.L.C., 9601 S Meridan Blvd, Englewood, CO 80112, Phone: (202) 463-3709, Email:
Home Mortgage Disclosure Act Aggregated Statistics For Year 2009(Based on 2 full and 1 partial tracts) A) FHA, FSA/RHS & VA B) Conventional C) Refinancings D) Home Improvement Loans F) Non-occupant Loans on G) Loans On Manufactured Number Average Value Number Average Value Number Average Value Number Average Value Number Average Value Number Average Value
LOANS ORIGINATED 226 $166,718 34 $112,224 256 $139,041 15 $29,934 50 $91,269 6 $85,425 APPLICATIONS APPROVED, NOT ACCEPTED 7 $166,264 2 $186,530 32 $124,790 1 $131,840 7 $105,009 1 $80,440 APPLICATIONS DENIED 24 $158,202 7 $119,700 90 $119,135 17 $31,504 9 $83,921 4 $51,205 APPLICATIONS WITHDRAWN 15 $154,205 5 $101,434 72 $132,515 6 $56,867 12 $73,594 1 $206,300 FILES CLOSED FOR INCOMPLETENESS 3 $159,717 0 $0 14 $111,943 3 $74,733 0 $0 1 $85,410
Aggregated Statistics For Year 2008(Based on 2 full and 1 partial tracts) A) FHA, FSA/RHS & VA B) Conventional C) Refinancings D) Home Improvement Loans F) Non-occupant Loans on G) Loans On Manufactured Number Average Value Number Average Value Number Average Value Number Average Value Number Average Value Number Average Value
LOANS ORIGINATED 232 $145,766 104 $120,517 226 $117,687 42 $36,307 70 $77,797 14 $80,179 APPLICATIONS APPROVED, NOT ACCEPTED 16 $128,390 8 $119,144 25 $117,712 3 $57,523 6 $92,640 1 $89,380 APPLICATIONS DENIED 15 $151,807 21 $102,730 122 $116,177 58 $53,337 24 $111,006 7 $67,989 APPLICATIONS WITHDRAWN 20 $144,981 11 $121,705 76 $127,361 16 $96,445 14 $99,375 0 $0 FILES CLOSED FOR INCOMPLETENESS 2 $119,685 0 $0 9 $120,992 0 $0 0 $0 1 $93,350
Aggregated Statistics For Year 2007(Based on 2 full and 1 partial tracts) A) FHA, FSA/RHS & VA B) Conventional C) Refinancings D) Home Improvement Loans F) Non-occupant Loans on G) Loans On Manufactured Number Average Value Number Average Value Number Average Value Number Average Value Number Average Value Number Average Value
LOANS ORIGINATED 190 $141,542 212 $112,875 199 $99,589 57 $45,088 87 $73,094 9 $77,254 APPLICATIONS APPROVED, NOT ACCEPTED 7 $106,746 23 $105,367 43 $103,199 16 $22,207 15 $65,914 1 $37,740 APPLICATIONS DENIED 16 $136,056 35 $108,974 118 $97,549 53 $44,186 21 $54,423 14 $55,332 APPLICATIONS WITHDRAWN 12 $137,780 23 $144,655 60 $106,738 10 $84,236 3 $108,687 2 $74,750 FILES CLOSED FOR INCOMPLETENESS 0 $0 2 $94,835 16 $142,124 1 $44,690 2 $76,290 1 $100,000
Aggregated Statistics For Year 2006(Based on 2 full and 1 partial tracts) A) FHA, FSA/RHS & VA B) Conventional C) Refinancings D) Home Improvement Loans F) Non-occupant Loans on G) Loans On Manufactured Number Average Value Number Average Value Number Average Value Number Average Value Number Average Value Number Average Value
LOANS ORIGINATED 214 $138,784 294 $102,562 181 $89,982 61 $31,154 148 $72,787 9 $70,821 APPLICATIONS APPROVED, NOT ACCEPTED 7 $152,309 33 $81,861 27 $86,343 3 $55,990 19 $62,366 3 $56,493 APPLICATIONS DENIED 21 $122,439 75 $94,390 133 $90,630 55 $45,002 24 $59,260 24 $52,580 APPLICATIONS WITHDRAWN 25 $141,294 43 $105,252 69 $85,794 9 $105,466 12 $66,774 1 $72,500 FILES CLOSED FOR INCOMPLETENESS 1 $185,000 5 $73,432 20 $96,171 2 $73,205 0 $0 0 $0
Aggregated Statistics For Year 2005(Based on 2 full and 1 partial tracts) A) FHA, FSA/RHS & VA B) Conventional C) Refinancings D) Home Improvement Loans F) Non-occupant Loans on G) Loans On Manufactured Number Average Value Number Average Value Number Average Value Number Average Value Number Average Value Number Average Value
LOANS ORIGINATED 166 $117,301 221 $95,020 170 $75,257 50 $33,229 110 $59,657 7 $82,411 APPLICATIONS APPROVED, NOT ACCEPTED 9 $99,004 16 $92,597 43 $79,473 4 $32,078 12 $53,435 4 $54,595 APPLICATIONS DENIED 13 $110,671 38 $87,311 158 $90,280 56 $34,003 25 $54,562 11 $55,489 APPLICATIONS WITHDRAWN 12 $126,808 41 $113,320 85 $91,406 14 $141,421 20 $65,724 2 $73,975 FILES CLOSED FOR INCOMPLETENESS 0 $0 4 $61,400 33 $93,498 1 $67,630 2 $47,650 1 $59,590
Aggregated Statistics For Year 2004(Based on 2 full and 1 partial tracts) A) FHA, FSA/RHS & VA B) Conventional C) Refinancings D) Home Improvement Loans F) Non-occupant Loans on G) Loans On Manufactured Number Average Value Number Average Value Number Average Value Number Average Value Number Average Value Number Average Value
LOANS ORIGINATED 206 $104,506 201 $93,308 222 $81,965 43 $31,733 114 $64,733 12 $50,690 APPLICATIONS APPROVED, NOT ACCEPTED 4 $104,225 26 $61,438 25 $81,425 13 $19,112 17 $49,805 7 $31,473 APPLICATIONS DENIED 11 $87,560 34 $77,809 148 $80,376 49 $26,350 20 $55,248 14 $51,229 APPLICATIONS WITHDRAWN 23 $109,517 31 $84,107 102 $85,129 3 $37,547 13 $68,338 1 $82,210 FILES CLOSED FOR INCOMPLETENESS 1 $155,770 1 $168,830 22 $97,269 0 $0 3 $67,900 0 $0
Aggregated Statistics For Year 2003(Based on 2 full and 1 partial tracts) A) FHA, FSA/RHS & VA B) Conventional C) Refinancings D) Home Improvement Loans F) Non-occupant Loans on Number Average Value Number Average Value Number Average Value Number Average Value Number Average Value
LOANS ORIGINATED 174 $101,055 116 $85,007 486 $84,028 33 $14,245 112 $56,744 APPLICATIONS APPROVED, NOT ACCEPTED 7 $70,864 16 $85,074 44 $77,434 4 $7,498 10 $55,544 APPLICATIONS DENIED 11 $86,455 36 $58,472 171 $76,295 22 $19,205 25 $59,033 APPLICATIONS WITHDRAWN 17 $108,580 17 $80,915 120 $73,230 8 $27,624 18 $52,109 FILES CLOSED FOR INCOMPLETENESS 1 $196,540 3 $63,987 18 $85,925 0 $0 3 $64,470
Aggregated Statistics For Year 2002(Based on 2 full and 1 partial tracts) A) FHA, FSA/RHS & VA B) Conventional C) Refinancings D) Home Improvement Loans F) Non-occupant Loans on Number Average Value Number Average Value Number Average Value Number Average Value Number Average Value
LOANS ORIGINATED 161 $94,433 79 $86,877 304 $72,814 36 $13,260 69 $54,457 APPLICATIONS APPROVED, NOT ACCEPTED 7 $95,449 24 $56,451 36 $68,796 6 $12,160 7 $53,657 APPLICATIONS DENIED 10 $68,942 56 $50,356 149 $69,180 36 $10,608 12 $71,405 APPLICATIONS WITHDRAWN 10 $104,320 11 $84,988 92 $68,371 6 $27,553 9 $64,796 FILES CLOSED FOR INCOMPLETENESS 3 $95,870 2 $106,550 19 $59,507 0 $0 2 $47,580
Aggregated Statistics For Year 2001(Based on 2 full and 1 partial tracts) A) FHA, FSA/RHS & VA B) Conventional C) Refinancings D) Home Improvement Loans E) Loans on Dwellings For 5+ Families F) Non-occupant Loans on Number Average Value Number Average Value Number Average Value Number Average Value Number Average Value Number Average Value
LOANS ORIGINATED 173 $93,724 93 $79,484 230 $75,198 38 $12,818 1 $79,450 52 $54,877 APPLICATIONS APPROVED, NOT ACCEPTED 4 $71,102 36 $42,059 19 $68,571 13 $7,773 0 $0 1 $35,710 APPLICATIONS DENIED 13 $89,475 76 $42,850 97 $63,733 36 $7,799 0 $0 12 $45,836 APPLICATIONS WITHDRAWN 9 $109,228 15 $88,441 97 $67,940 8 $28,201 0 $0 8 $64,700 FILES CLOSED FOR INCOMPLETENESS 3 $63,563 1 $60,000 19 $92,196 0 $0 0 $0 2 $44,385
Aggregated Statistics For Year 2000(Based on 2 full and 1 partial tracts) A) FHA, FSA/RHS & VA B) Conventional C) Refinancings D) Home Improvement Loans F) Non-occupant Loans on Number Average Value Number Average Value Number Average Value Number Average Value Number Average Value
LOANS ORIGINATED 203 $86,660 90 $65,002 70 $57,406 63 $9,795 32 $51,064 APPLICATIONS APPROVED, NOT ACCEPTED 15 $54,151 32 $44,989 21 $56,421 17 $12,201 4 $59,995 APPLICATIONS DENIED 36 $53,239 154 $42,147 104 $50,182 51 $13,773 9 $49,580 APPLICATIONS WITHDRAWN 17 $82,991 10 $43,446 50 $58,798 5 $11,462 1 $42,620 FILES CLOSED FOR INCOMPLETENESS 3 $56,780 2 $64,300 4 $46,555 0 $0 1 $64,340
Aggregated Statistics For Year 1999(Based on 2 full and 1 partial tracts) A) FHA, FSA/RHS & VA B) Conventional C) Refinancings D) Home Improvement Loans F) Non-occupant Loans on Number Average Value Number Average Value Number Average Value Number Average Value Number Average Value
LOANS ORIGINATED 219 $86,189 87 $63,348 150 $61,742 62 $10,030 32 $43,058 APPLICATIONS APPROVED, NOT ACCEPTED 3 $102,053 58 $46,638 50 $53,251 14 $14,091 4 $47,200 APPLICATIONS DENIED 13 $74,237 203 $43,448 120 $58,312 35 $17,683 16 $59,209 APPLICATIONS WITHDRAWN 20 $82,604 16 $59,434 77 $59,531 7 $10,924 7 $35,927 FILES CLOSED FOR INCOMPLETENESS 6 $61,527 4 $58,392 20 $58,072 0 $0 4 $46,085
Detailed HMDA statistics for the following Tracts:
0021.00
, 0023.00 , 0024.00
Private Mortgage Insurance Companies Aggregated Statistics For Year 2009(Based on 2 full and 1 partial tracts) A) Conventional B) Refinancings C) Non-occupant Loans on Number Average Value Number Average Value Number Average Value
LOANS ORIGINATED 5 $130,258 2 $216,190 0 $0 APPLICATIONS APPROVED, NOT ACCEPTED 1 $187,700 2 $178,965 1 $187,700 APPLICATIONS DENIED 0 $0 0 $0 0 $0 APPLICATIONS WITHDRAWN 0 $0 1 $138,000 0 $0 FILES CLOSED FOR INCOMPLETENESS 0 $0 0 $0 0 $0
Aggregated Statistics For Year 2008(Based on 2 full and 1 partial tracts) A) Conventional B) Refinancings C) Non-occupant Loans on Number Average Value Number Average Value Number Average Value
LOANS ORIGINATED 27 $128,779 13 $177,836 8 $97,929 APPLICATIONS APPROVED, NOT ACCEPTED 7 $98,817 3 $139,323 3 $85,920 APPLICATIONS DENIED 1 $187,700 0 $0 1 $187,700 APPLICATIONS WITHDRAWN 2 $89,380 0 $0 2 $89,380 FILES CLOSED FOR INCOMPLETENESS 7 $99,214 0 $0 6 $108,580
Aggregated Statistics For Year 2007(Based on 2 full and 1 partial tracts) A) Conventional B) Refinancings C) Non-occupant Loans on D) Loans On Manufactured Number Average Value Number Average Value Number Average Value Number Average Value
LOANS ORIGINATED 54 $111,352 18 $127,586 14 $90,633 2 $67,265 APPLICATIONS APPROVED, NOT ACCEPTED 6 $112,683 2 $146,710 1 $46,640 0 $0 APPLICATIONS DENIED 0 $0 1 $111,780 0 $0 0 $0 APPLICATIONS WITHDRAWN 1 $103,000 1 $164,850 1 $164,850 0 $0 FILES CLOSED FOR INCOMPLETENESS 0 $0 1 $164,850 1 $164,850 0 $0
Aggregated Statistics For Year 2006(Based on 2 full and 1 partial tracts) A) Conventional B) Refinancings C) Non-occupant Loans on Number Average Value Number Average Value Number Average Value
LOANS ORIGINATED 36 $126,821 15 $118,745 9 $73,650 APPLICATIONS APPROVED, NOT ACCEPTED 6 $99,098 2 $134,595 4 $61,790 APPLICATIONS DENIED 2 $80,565 1 $123,140 2 $80,565 APPLICATIONS WITHDRAWN 1 $178,040 1 $46,680 1 $46,680 FILES CLOSED FOR INCOMPLETENESS 0 $0 1 $104,000 0 $0
Aggregated Statistics For Year 2005(Based on 2 full and 1 partial tracts) A) Conventional B) Refinancings C) Non-occupant Loans on Number Average Value Number Average Value Number Average Value
LOANS ORIGINATED 61 $114,366 7 $89,713 21 $59,832 APPLICATIONS APPROVED, NOT ACCEPTED 4 $69,132 5 $118,486 5 $71,288 APPLICATIONS DENIED 0 $0 0 $0 0 $0 APPLICATIONS WITHDRAWN 2 $82,585 0 $0 0 $0 FILES CLOSED FOR INCOMPLETENESS 0 $0 0 $0 0 $0
Aggregated Statistics For Year 2004(Based on 2 full and 1 partial tracts) A) Conventional B) Refinancings C) Non-occupant Loans on D) Loans On Manufactured Number Average Value Number Average Value Number Average Value Number Average Value
LOANS ORIGINATED 50 $83,004 9 $109,927 29 $59,814 1 $104,000 APPLICATIONS APPROVED, NOT ACCEPTED 4 $83,485 6 $101,617 1 $38,600 0 $0 APPLICATIONS DENIED 2 $58,300 1 $105,000 2 $58,300 0 $0 APPLICATIONS WITHDRAWN 0 $0 0 $0 0 $0 0 $0 FILES CLOSED FOR INCOMPLETENESS 0 $0 0 $0 0 $0 0 $0
Aggregated Statistics For Year 2003(Based on 2 full and 1 partial tracts) A) Conventional B) Refinancings C) Non-occupant Loans on Number Average Value Number Average Value Number Average Value
LOANS ORIGINATED 34 $78,164 27 $108,055 17 $56,981 APPLICATIONS APPROVED, NOT ACCEPTED 3 $91,053 6 $120,317 0 $0 APPLICATIONS DENIED 0 $0 2 $83,785 1 $124,300 APPLICATIONS WITHDRAWN 1 $179,340 0 $0 0 $0 FILES CLOSED FOR INCOMPLETENESS 0 $0 0 $0 0 $0
Aggregated Statistics For Year 2002(Based on 2 full and 1 partial tracts) A) Conventional B) Refinancings C) Non-occupant Loans on Number Average Value Number Average Value Number Average Value
LOANS ORIGINATED 26 $87,622 27 $97,503 13 $63,792 APPLICATIONS APPROVED, NOT ACCEPTED 4 $91,092 5 $97,326 0 $0 APPLICATIONS DENIED 1 $74,000 0 $0 1 $74,000 APPLICATIONS WITHDRAWN 0 $0 0 $0 0 $0 FILES CLOSED FOR INCOMPLETENESS 0 $0 1 $128,110 1 $128,110
Aggregated Statistics For Year 2001(Based on 2 full and 1 partial tracts) A) Conventional B) Refinancings C) Non-occupant Loans on Number Average Value Number Average Value Number Average Value
LOANS ORIGINATED 17 $90,804 13 $89,643 8 $54,772 APPLICATIONS APPROVED, NOT ACCEPTED 1 $190,680 4 $85,980 0 $0 APPLICATIONS DENIED 0 $0 0 $0 0 $0 APPLICATIONS WITHDRAWN 0 $0 2 $116,365 0 $0 FILES CLOSED FOR INCOMPLETENESS 0 $0 1 $89,380 0 $0
Aggregated Statistics For Year 2000(Based on 2 full and 1 partial tracts) A) Conventional B) Refinancings C) Non-occupant Loans on Number Average Value Number Average Value Number Average Value
LOANS ORIGINATED 13 $115,338 4 $69,650 4 $45,422 APPLICATIONS APPROVED, NOT ACCEPTED 1 $125,460 0 $0 0 $0 APPLICATIONS DENIED 0 $0 0 $0 0 $0 APPLICATIONS WITHDRAWN 1 $83,230 0 $0 1 $83,230 FILES CLOSED FOR INCOMPLETENESS 0 $0 0 $0 0 $0
Aggregated Statistics For Year 1999(Based on 2 full and 1 partial tracts) A) Conventional B) Refinancings C) Non-occupant Loans on Number Average Value Number Average Value Number Average Value
LOANS ORIGINATED 10 $107,401 5 $61,800 2 $45,840 APPLICATIONS APPROVED, NOT ACCEPTED 2 $91,620 0 $0 0 $0 APPLICATIONS DENIED 0 $0 0 $0 0 $0 APPLICATIONS WITHDRAWN 0 $0 0 $0 0 $0 FILES CLOSED FOR INCOMPLETENESS 0 $0 0 $0 0 $0
Detailed PMIC statistics for the following Tracts:
0021.00
, 0023.00 , 0024.00 Piney Green compared to North Carolina state average:
Unemployed percentage below state average. Hispanic race population percentage above state average. Median age significantly below state average. Length of stay since moving in significantly above state average.


 Recent articles from our blog. Our writers, many of them Ph.D. graduates or candidates, create easy-to-read articles on a wide variety of topics.

 (5.1 miles
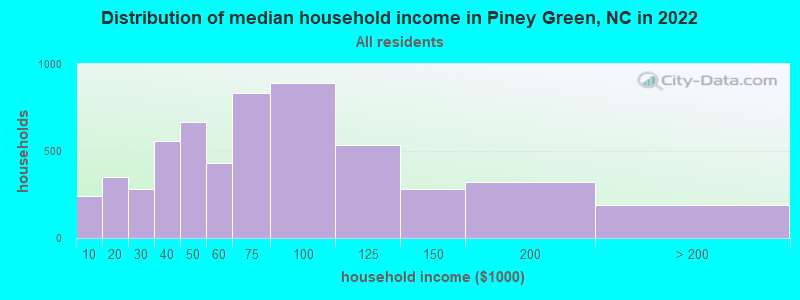

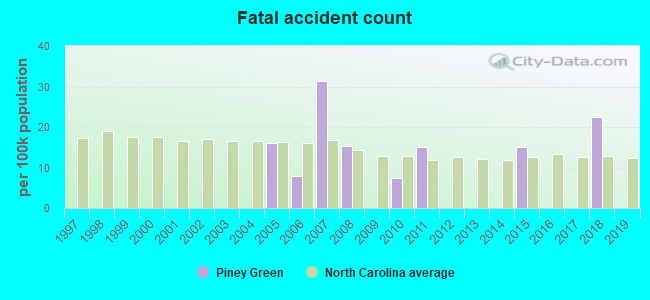
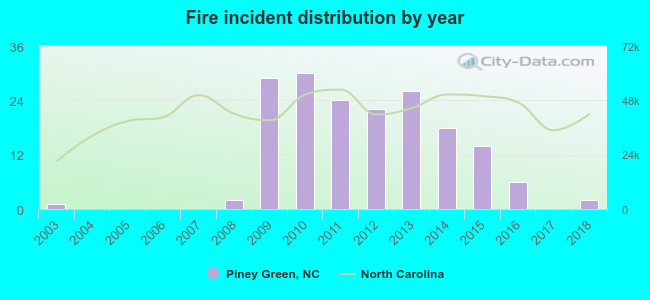 Based on the data from the years 2003 - 2018 the average number of fires per year is 11. The highest number of fires - 30 took place in 2010, and the least - 0 in 2004. The data has an increasing trend.
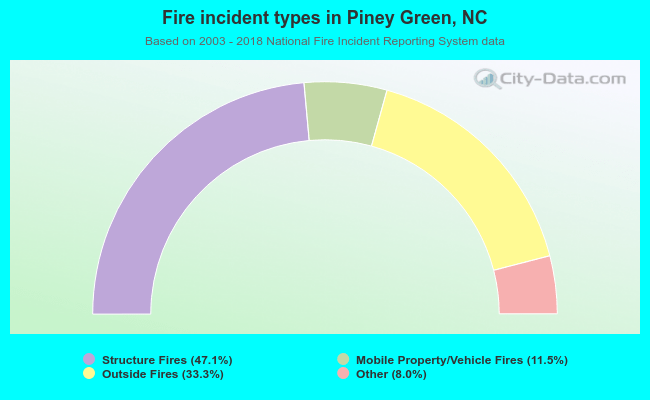 When looking into fire subcategories, the most reports belonged to: Structure Fires (47.1%), and Outside Fires (33.3%).