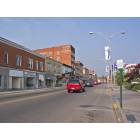
Princeton, West Virginia Submit your own pictures of this city and show them to the world
OSM Map
General Map
Google Map
MSN Map
OSM Map
General Map
Google Map
MSN Map
OSM Map
General Map
Google Map
MSN Map
OSM Map
General Map
Google Map
MSN Map
Please wait while loading the map...
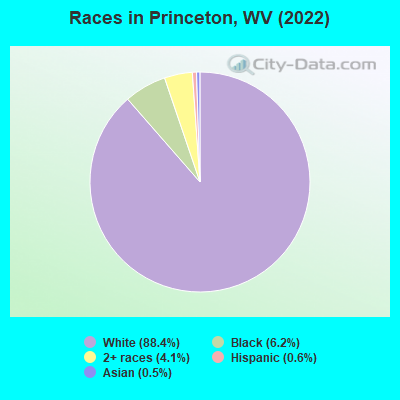
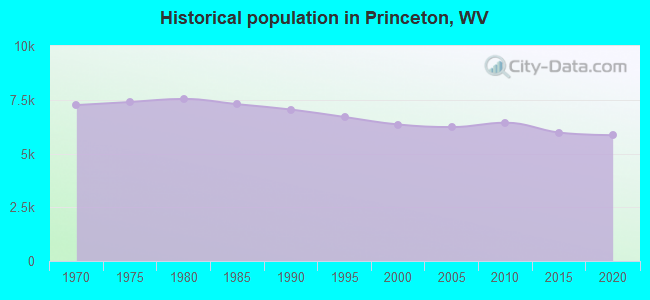
Population in 2022: 5,724 (100% urban, 0% rural). Population change since 2000: -9.8%Males: 2,813 Females: 2,911
March 2022 cost of living index in Princeton: 80.9 (low, U.S. average is 100) Percentage of residents living in poverty in 2022: 18.9%for White Non-Hispanic residents , 4.9% for Black residents , 11.2% for two or more races residents )Business Search - 14 Million verified businesses
Data:
Median household income ($)
Median household income (% change since 2000)
Household income diversity
Ratio of average income to average house value (%)
Ratio of average income to average rent
Median household income ($) - White
Median household income ($) - Black or African American
Median household income ($) - Asian
Median household income ($) - Hispanic or Latino
Median household income ($) - American Indian and Alaska Native
Median household income ($) - Multirace
Median household income ($) - Other Race
Median household income for houses/condos with a mortgage ($)
Median household income for apartments without a mortgage ($)
Races - White alone (%)
Races - White alone (% change since 2000)
Races - Black alone (%)
Races - Black alone (% change since 2000)
Races - American Indian alone (%)
Races - American Indian alone (% change since 2000)
Races - Asian alone (%)
Races - Asian alone (% change since 2000)
Races - Hispanic (%)
Races - Hispanic (% change since 2000)
Races - Native Hawaiian and Other Pacific Islander alone (%)
Races - Native Hawaiian and Other Pacific Islander alone (% change since 2000)
Races - Two or more races (%)
Races - Two or more races (% change since 2000)
Races - Other race alone (%)
Races - Other race alone (% change since 2000)
Racial diversity
Unemployment (%)
Unemployment (% change since 2000)
Unemployment (%) - White
Unemployment (%) - Black or African American
Unemployment (%) - Asian
Unemployment (%) - Hispanic or Latino
Unemployment (%) - American Indian and Alaska Native
Unemployment (%) - Multirace
Unemployment (%) - Other Race
Population density (people per square mile)
Population - Males (%)
Population - Females (%)
Population - Males (%) - White
Population - Males (%) - Black or African American
Population - Males (%) - Asian
Population - Males (%) - Hispanic or Latino
Population - Males (%) - American Indian and Alaska Native
Population - Males (%) - Multirace
Population - Males (%) - Other Race
Population - Females (%) - White
Population - Females (%) - Black or African American
Population - Females (%) - Asian
Population - Females (%) - Hispanic or Latino
Population - Females (%) - American Indian and Alaska Native
Population - Females (%) - Multirace
Population - Females (%) - Other Race
Coronavirus confirmed cases (Apr 25, 2024)
Deaths caused by coronavirus (Apr 25, 2024)
Coronavirus confirmed cases (per 100k population) (Apr 25, 2024)
Deaths caused by coronavirus (per 100k population) (Apr 25, 2024)
Daily increase in number of cases (Apr 25, 2024)
Weekly increase in number of cases (Apr 25, 2024)
Cases doubled (in days) (Apr 25, 2024)
Hospitalized patients (Apr 18, 2022)
Negative test results (Apr 18, 2022)
Total test results (Apr 18, 2022)
COVID Vaccine doses distributed (per 100k population) (Sep 19, 2023)
COVID Vaccine doses administered (per 100k population) (Sep 19, 2023)
COVID Vaccine doses distributed (Sep 19, 2023)
COVID Vaccine doses administered (Sep 19, 2023)
Likely homosexual households (%)
Likely homosexual households (% change since 2000)
Likely homosexual households - Lesbian couples (%)
Likely homosexual households - Lesbian couples (% change since 2000)
Likely homosexual households - Gay men (%)
Likely homosexual households - Gay men (% change since 2000)
Cost of living index
Median gross rent ($)
Median contract rent ($)
Median monthly housing costs ($)
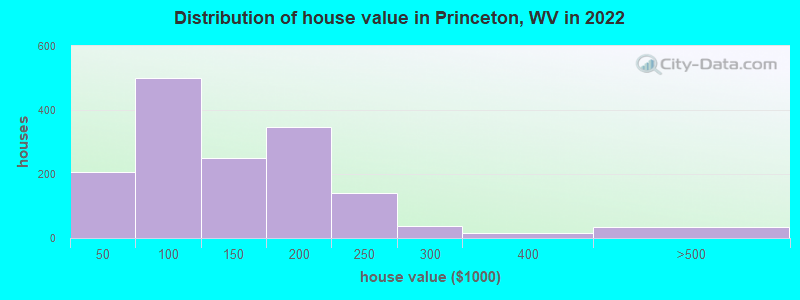
Median house or condo value ($)
Median house or condo value ($ change since 2000)
Mean house or condo value by units in structure - 1, detached ($)
Mean house or condo value by units in structure - 1, attached ($)
Mean house or condo value by units in structure - 2 ($)
Mean house or condo value by units in structure by units in structure - 3 or 4 ($)
Mean house or condo value by units in structure - 5 or more ($)
Mean house or condo value by units in structure - Boat, RV, van, etc. ($)
Mean house or condo value by units in structure - Mobile home ($)
Median house or condo value ($) - White
Median house or condo value ($) - Black or African American
Median house or condo value ($) - Asian
Median house or condo value ($) - Hispanic or Latino
Median house or condo value ($) - American Indian and Alaska Native
Median house or condo value ($) - Multirace
Median house or condo value ($) - Other Race
Median resident age
Resident age diversity
Median resident age - Males
Median resident age - Females
Median resident age - White
Median resident age - Black or African American
Median resident age - Asian
Median resident age - Hispanic or Latino
Median resident age - American Indian and Alaska Native
Median resident age - Multirace
Median resident age - Other Race
Median resident age - Males - White
Median resident age - Males - Black or African American
Median resident age - Males - Asian
Median resident age - Males - Hispanic or Latino
Median resident age - Males - American Indian and Alaska Native
Median resident age - Males - Multirace
Median resident age - Males - Other Race
Median resident age - Females - White
Median resident age - Females - Black or African American
Median resident age - Females - Asian
Median resident age - Females - Hispanic or Latino
Median resident age - Females - American Indian and Alaska Native
Median resident age - Females - Multirace
Median resident age - Females - Other Race
Commute - mean travel time to work (minutes)
Travel time to work - Less than 5 minutes (%)
Travel time to work - Less than 5 minutes (% change since 2000)
Travel time to work - 5 to 9 minutes (%)
Travel time to work - 5 to 9 minutes (% change since 2000)
Travel time to work - 10 to 19 minutes (%)
Travel time to work - 10 to 19 minutes (% change since 2000)
Travel time to work - 20 to 29 minutes (%)
Travel time to work - 20 to 29 minutes (% change since 2000)
Travel time to work - 30 to 39 minutes (%)
Travel time to work - 30 to 39 minutes (% change since 2000)
Travel time to work - 40 to 59 minutes (%)
Travel time to work - 40 to 59 minutes (% change since 2000)
Travel time to work - 60 to 89 minutes (%)
Travel time to work - 60 to 89 minutes (% change since 2000)
Travel time to work - 90 or more minutes (%)
Travel time to work - 90 or more minutes (% change since 2000)
Marital status - Never married (%)
Marital status - Now married (%)
Marital status - Separated (%)
Marital status - Widowed (%)
Marital status - Divorced (%)
Median family income ($)
Median family income (% change since 2000)
Median non-family income ($)
Median non-family income (% change since 2000)
Median per capita income ($)
Median per capita income (% change since 2000)
Median family income ($) - White
Median family income ($) - Black or African American
Median family income ($) - Asian
Median family income ($) - Hispanic or Latino
Median family income ($) - American Indian and Alaska Native
Median family income ($) - Multirace
Median family income ($) - Other Race
Median year house/condo built
Median year apartment built
Year house built - Built 2005 or later (%)
Year house built - Built 2000 to 2004 (%)
Year house built - Built 1990 to 1999 (%)
Year house built - Built 1980 to 1989 (%)
Year house built - Built 1970 to 1979 (%)
Year house built - Built 1960 to 1969 (%)
Year house built - Built 1950 to 1959 (%)
Year house built - Built 1940 to 1949 (%)
Year house built - Built 1939 or earlier (%)
Average household size
Household density (households per square mile)
Average household size - White
Average household size - Black or African American
Average household size - Asian
Average household size - Hispanic or Latino
Average household size - American Indian and Alaska Native
Average household size - Multirace
Average household size - Other Race
Occupied housing units (%)
Vacant housing units (%)
Owner occupied housing units (%)
Renter occupied housing units (%)
Vacancy status - For rent (%)
Vacancy status - For sale only (%)
Vacancy status - Rented or sold, not occupied (%)
Vacancy status - For seasonal, recreational, or occasional use (%)
Vacancy status - For migrant workers (%)
Vacancy status - Other vacant (%)
Residents with income below the poverty level (%)
Residents with income below 50% of the poverty level (%)
Children below poverty level (%)
Poor families by family type - Married-couple family (%)
Poor families by family type - Male, no wife present (%)
Poor families by family type - Female, no husband present (%)
Poverty status for native-born residents (%)
Poverty status for foreign-born residents (%)
Poverty among high school graduates not in families (%)
Poverty among people who did not graduate high school not in families (%)
Residents with income below the poverty level (%) - White
Residents with income below the poverty level (%) - Black or African American
Residents with income below the poverty level (%) - Asian
Residents with income below the poverty level (%) - Hispanic or Latino
Residents with income below the poverty level (%) - American Indian and Alaska Native
Residents with income below the poverty level (%) - Multirace
Residents with income below the poverty level (%) - Other Race
Air pollution - Air Quality Index (AQI)
Air pollution - CO
Air pollution - NO2
Air pollution - SO2
Air pollution - Ozone
Air pollution - PM10
Air pollution - PM25
Air pollution - Pb
Crime - Murders per 100,000 population
Crime - Rapes per 100,000 population
Crime - Robberies per 100,000 population
Crime - Assaults per 100,000 population
Crime - Burglaries per 100,000 population
Crime - Thefts per 100,000 population
Crime - Auto thefts per 100,000 population
Crime - Arson per 100,000 population
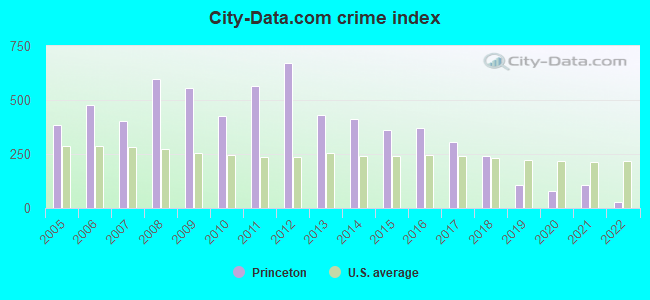
Crime - City-data.com crime index
Crime - Violent crime index
Crime - Property crime index
Crime - Murders per 100,000 population (5 year average)
Crime - Rapes per 100,000 population (5 year average)
Crime - Robberies per 100,000 population (5 year average)
Crime - Assaults per 100,000 population (5 year average)
Crime - Burglaries per 100,000 population (5 year average)
Crime - Thefts per 100,000 population (5 year average)
Crime - Auto thefts per 100,000 population (5 year average)
Crime - Arson per 100,000 population (5 year average)
Crime - City-data.com crime index (5 year average)
Crime - Violent crime index (5 year average)
Crime - Property crime index (5 year average)
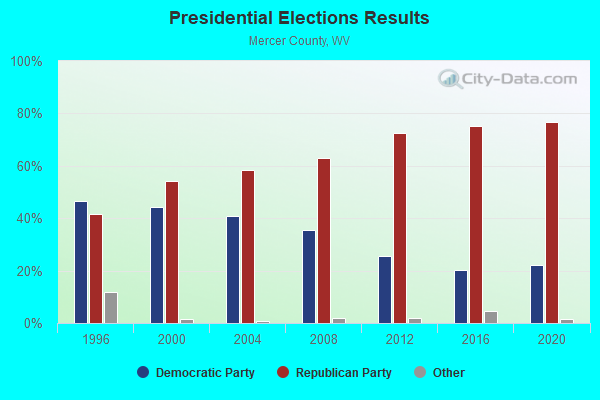
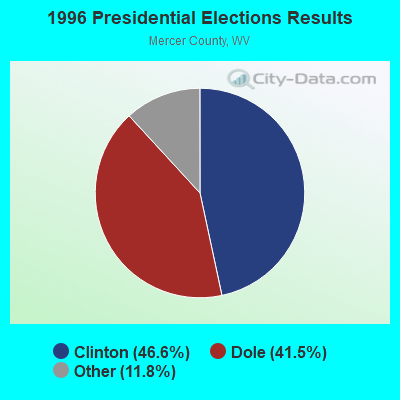
1996 Presidential Elections Results (%) - Democratic Party (Clinton)
1996 Presidential Elections Results (%) - Republican Party (Dole)
1996 Presidential Elections Results (%) - Other
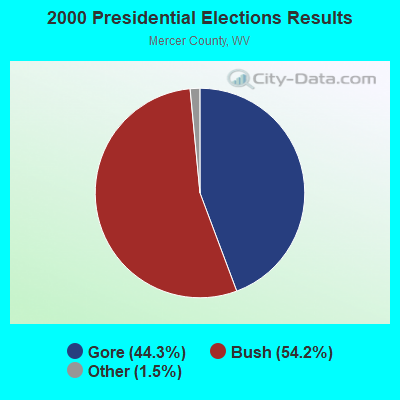
2000 Presidential Elections Results (%) - Democratic Party (Gore)
2000 Presidential Elections Results (%) - Republican Party (Bush)
2000 Presidential Elections Results (%) - Other
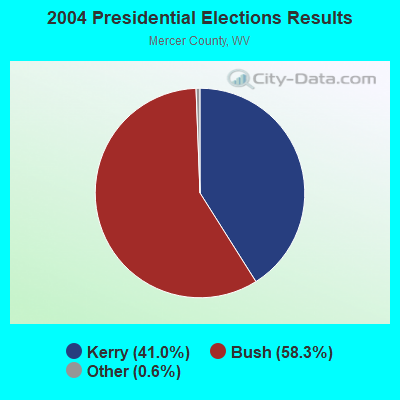
2004 Presidential Elections Results (%) - Democratic Party (Kerry)
2004 Presidential Elections Results (%) - Republican Party (Bush)
2004 Presidential Elections Results (%) - Other
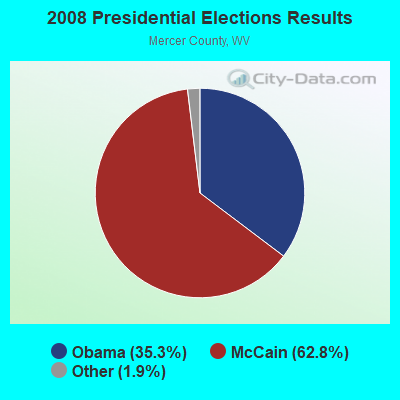
2008 Presidential Elections Results (%) - Democratic Party (Obama)
2008 Presidential Elections Results (%) - Republican Party (McCain)
2008 Presidential Elections Results (%) - Other
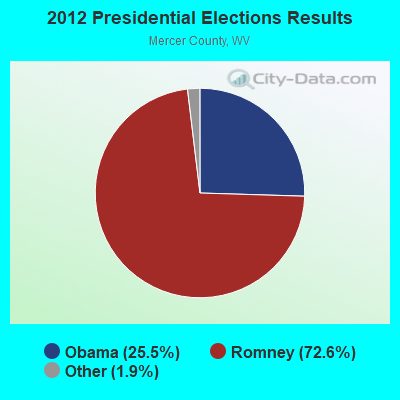
2012 Presidential Elections Results (%) - Democratic Party (Obama)
2012 Presidential Elections Results (%) - Republican Party (Romney)
2012 Presidential Elections Results (%) - Other
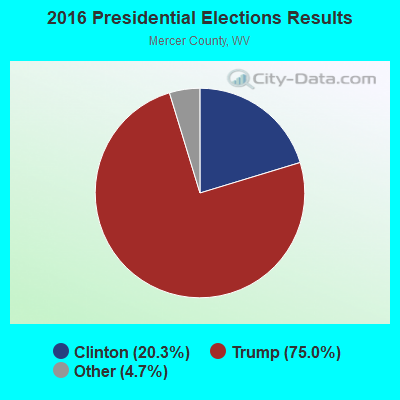
2016 Presidential Elections Results (%) - Democratic Party (Clinton)
2016 Presidential Elections Results (%) - Republican Party (Trump)
2016 Presidential Elections Results (%) - Other
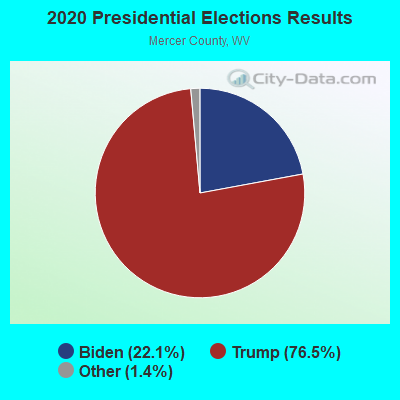
2020 Presidential Elections Results (%) - Democratic Party (Biden)
2020 Presidential Elections Results (%) - Republican Party (Trump)
2020 Presidential Elections Results (%) - Other
Ancestries Reported - Arab (%)
Ancestries Reported - Czech (%)
Ancestries Reported - Danish (%)
Ancestries Reported - Dutch (%)
Ancestries Reported - English (%)
Ancestries Reported - French (%)
Ancestries Reported - French Canadian (%)
Ancestries Reported - German (%)
Ancestries Reported - Greek (%)
Ancestries Reported - Hungarian (%)
Ancestries Reported - Irish (%)
Ancestries Reported - Italian (%)
Ancestries Reported - Lithuanian (%)
Ancestries Reported - Norwegian (%)
Ancestries Reported - Polish (%)
Ancestries Reported - Portuguese (%)
Ancestries Reported - Russian (%)
Ancestries Reported - Scotch-Irish (%)
Ancestries Reported - Scottish (%)
Ancestries Reported - Slovak (%)
Ancestries Reported - Subsaharan African (%)
Ancestries Reported - Swedish (%)
Ancestries Reported - Swiss (%)
Ancestries Reported - Ukrainian (%)
Ancestries Reported - United States (%)
Ancestries Reported - Welsh (%)
Ancestries Reported - West Indian (%)
Ancestries Reported - Other (%)
Educational Attainment - No schooling completed (%)
Educational Attainment - Less than high school (%)
Educational Attainment - High school or equivalent (%)
Educational Attainment - Less than 1 year of college (%)
Educational Attainment - 1 or more years of college (%)
Educational Attainment - Associate degree (%)
Educational Attainment - Bachelor's degree (%)
Educational Attainment - Master's degree (%)
Educational Attainment - Professional school degree (%)
Educational Attainment - Doctorate degree (%)
School Enrollment - Nursery, preschool (%)
School Enrollment - Kindergarten (%)
School Enrollment - Grade 1 to 4 (%)
School Enrollment - Grade 5 to 8 (%)
School Enrollment - Grade 9 to 12 (%)
School Enrollment - College undergrad (%)
School Enrollment - Graduate or professional (%)
School Enrollment - Not enrolled in school (%)
School enrollment - Public schools (%)
School enrollment - Private schools (%)
School enrollment - Not enrolled (%)
Median number of rooms in houses and condos
Median number of rooms in apartments
Housing units lacking complete plumbing facilities (%)
Housing units lacking complete kitchen facilities (%)
Density of houses
Urban houses (%)
Rural houses (%)
Households with people 60 years and over (%)
Households with people 65 years and over (%)
Households with people 75 years and over (%)
Households with one or more nonrelatives (%)
Households with no nonrelatives (%)
Population in households (%)
Family households (%)
Nonfamily households (%)
Population in families (%)
Family households with own children (%)
Median number of bedrooms in owner occupied houses
Mean number of bedrooms in owner occupied houses
Median number of bedrooms in renter occupied houses
Mean number of bedrooms in renter occupied houses
Median number of vehichles in owner occupied houses
Mean number of vehichles in owner occupied houses
Median number of vehichles in renter occupied houses
Mean number of vehichles in renter occupied houses
Mortgage status - with mortgage (%)
Mortgage status - with second mortgage (%)
Mortgage status - with home equity loan (%)
Mortgage status - with both second mortgage and home equity loan (%)
Mortgage status - without a mortgage (%)
Average family size
Average family size - White
Average family size - Black or African American
Average family size - Asian
Average family size - Hispanic or Latino
Average family size - American Indian and Alaska Native
Average family size - Multirace
Average family size - Other Race
Geographical mobility - Same house 1 year ago (%)
Geographical mobility - Moved within same county (%)
Geographical mobility - Moved from different county within same state (%)
Geographical mobility - Moved from different state (%)
Geographical mobility - Moved from abroad (%)
Place of birth - Born in state of residence (%)
Place of birth - Born in other state (%)
Place of birth - Native, outside of US (%)
Place of birth - Foreign born (%)
Housing units in structures - 1, detached (%)
Housing units in structures - 1, attached (%)
Housing units in structures - 2 (%)
Housing units in structures - 3 or 4 (%)
Housing units in structures - 5 to 9 (%)
Housing units in structures - 10 to 19 (%)
Housing units in structures - 20 to 49 (%)
Housing units in structures - 50 or more (%)
Housing units in structures - Mobile home (%)
Housing units in structures - Boat, RV, van, etc. (%)
House/condo owner moved in on average (years ago)
Renter moved in on average (years ago)
Year householder moved into unit - Moved in 1999 to March 2000 (%)
Year householder moved into unit - Moved in 1995 to 1998 (%)
Year householder moved into unit - Moved in 1990 to 1994 (%)
Year householder moved into unit - Moved in 1980 to 1989 (%)
Year householder moved into unit - Moved in 1970 to 1979 (%)
Year householder moved into unit - Moved in 1969 or earlier (%)
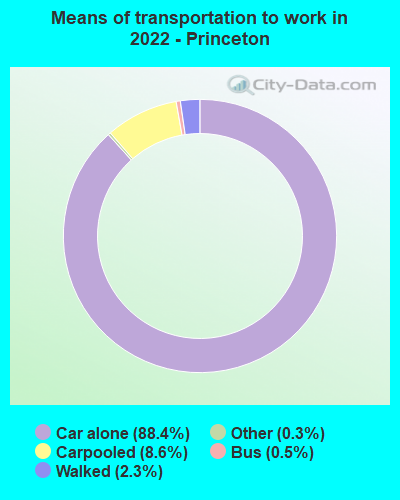
Means of transportation to work - Drove car alone (%)
Means of transportation to work - Carpooled (%)
Means of transportation to work - Public transportation (%)
Means of transportation to work - Bus or trolley bus (%)
Means of transportation to work - Streetcar or trolley car (%)
Means of transportation to work - Subway or elevated (%)
Means of transportation to work - Railroad (%)
Means of transportation to work - Ferryboat (%)
Means of transportation to work - Taxicab (%)
Means of transportation to work - Motorcycle (%)
Means of transportation to work - Bicycle (%)
Means of transportation to work - Walked (%)
Means of transportation to work - Other means (%)
Working at home (%)
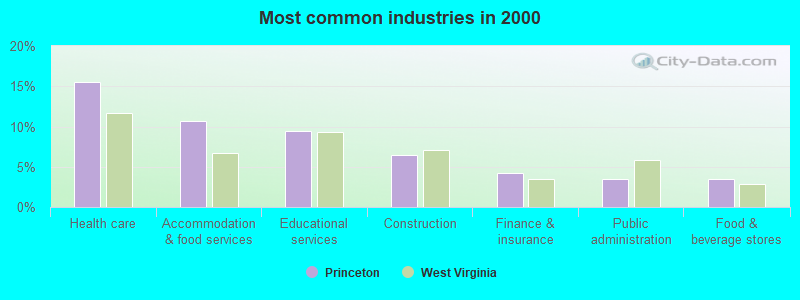
Industry diversity
Most Common Industries - Agriculture, forestry, fishing and hunting, and mining (%)
Most Common Industries - Agriculture, forestry, fishing and hunting (%)
Most Common Industries - Mining, quarrying, and oil and gas extraction (%)
Most Common Industries - Construction (%)
Most Common Industries - Manufacturing (%)
Most Common Industries - Wholesale trade (%)
Most Common Industries - Retail trade (%)
Most Common Industries - Transportation and warehousing, and utilities (%)
Most Common Industries - Transportation and warehousing (%)
Most Common Industries - Utilities (%)
Most Common Industries - Information (%)
Most Common Industries - Finance and insurance, and real estate and rental and leasing (%)
Most Common Industries - Finance and insurance (%)
Most Common Industries - Real estate and rental and leasing (%)
Most Common Industries - Professional, scientific, and management, and administrative and waste management services (%)
Most Common Industries - Professional, scientific, and technical services (%)
Most Common Industries - Management of companies and enterprises (%)
Most Common Industries - Administrative and support and waste management services (%)
Most Common Industries - Educational services, and health care and social assistance (%)
Most Common Industries - Educational services (%)
Most Common Industries - Health care and social assistance (%)
Most Common Industries - Arts, entertainment, and recreation, and accommodation and food services (%)
Most Common Industries - Arts, entertainment, and recreation (%)
Most Common Industries - Accommodation and food services (%)
Most Common Industries - Other services, except public administration (%)
Most Common Industries - Public administration (%)
Occupation diversity
Most Common Occupations - Management, business, science, and arts occupations (%)
Most Common Occupations - Management, business, and financial occupations (%)
Most Common Occupations - Management occupations (%)
Most Common Occupations - Business and financial operations occupations (%)
Most Common Occupations - Computer, engineering, and science occupations (%)
Most Common Occupations - Computer and mathematical occupations (%)
Most Common Occupations - Architecture and engineering occupations (%)
Most Common Occupations - Life, physical, and social science occupations (%)
Most Common Occupations - Education, legal, community service, arts, and media occupations (%)
Most Common Occupations - Community and social service occupations (%)
Most Common Occupations - Legal occupations (%)
Most Common Occupations - Education, training, and library occupations (%)
Most Common Occupations - Arts, design, entertainment, sports, and media occupations (%)
Most Common Occupations - Healthcare practitioners and technical occupations (%)
Most Common Occupations - Health diagnosing and treating practitioners and other technical occupations (%)
Most Common Occupations - Health technologists and technicians (%)
Most Common Occupations - Service occupations (%)
Most Common Occupations - Healthcare support occupations (%)
Most Common Occupations - Protective service occupations (%)
Most Common Occupations - Fire fighting and prevention, and other protective service workers including supervisors (%)
Most Common Occupations - Law enforcement workers including supervisors (%)
Most Common Occupations - Food preparation and serving related occupations (%)
Most Common Occupations - Building and grounds cleaning and maintenance occupations (%)
Most Common Occupations - Personal care and service occupations (%)
Most Common Occupations - Sales and office occupations (%)
Most Common Occupations - Sales and related occupations (%)
Most Common Occupations - Office and administrative support occupations (%)
Most Common Occupations - Natural resources, construction, and maintenance occupations (%)
Most Common Occupations - Farming, fishing, and forestry occupations (%)
Most Common Occupations - Construction and extraction occupations (%)
Most Common Occupations - Installation, maintenance, and repair occupations (%)
Most Common Occupations - Production, transportation, and material moving occupations (%)
Most Common Occupations - Production occupations (%)
Most Common Occupations - Transportation occupations (%)
Most Common Occupations - Material moving occupations (%)
People in Group quarters - Institutionalized population (%)
People in Group quarters - Correctional institutions (%)
People in Group quarters - Federal prisons and detention centers (%)
People in Group quarters - Halfway houses (%)
People in Group quarters - Local jails and other confinement facilities (including police lockups) (%)
People in Group quarters - Military disciplinary barracks (%)
People in Group quarters - State prisons (%)
People in Group quarters - Other types of correctional institutions (%)
People in Group quarters - Nursing homes (%)
People in Group quarters - Hospitals/wards, hospices, and schools for the handicapped (%)
People in Group quarters - Hospitals/wards and hospices for chronically ill (%)
People in Group quarters - Hospices or homes for chronically ill (%)
People in Group quarters - Military hospitals or wards for chronically ill (%)
People in Group quarters - Other hospitals or wards for chronically ill (%)
People in Group quarters - Hospitals or wards for drug/alcohol abuse (%)
People in Group quarters - Mental (Psychiatric) hospitals or wards (%)
People in Group quarters - Schools, hospitals, or wards for the mentally retarded (%)
People in Group quarters - Schools, hospitals, or wards for the physically handicapped (%)
People in Group quarters - Institutions for the deaf (%)
People in Group quarters - Institutions for the blind (%)
People in Group quarters - Orthopedic wards and institutions for the physically handicapped (%)
People in Group quarters - Wards in general hospitals for patients who have no usual home elsewhere (%)
People in Group quarters - Wards in military hospitals for patients who have no usual home elsewhere (%)
People in Group quarters - Juvenile institutions (%)
People in Group quarters - Long-term care (%)
People in Group quarters - Homes for abused, dependent, and neglected children (%)
People in Group quarters - Residential treatment centers for emotionally disturbed children (%)
People in Group quarters - Training schools for juvenile delinquents (%)
People in Group quarters - Short-term care, detention or diagnostic centers for delinquent children (%)
People in Group quarters - Type of juvenile institution unknown (%)
People in Group quarters - Noninstitutionalized population (%)
People in Group quarters - College dormitories (includes college quarters off campus) (%)
People in Group quarters - Military quarters (%)
People in Group quarters - On base (%)
People in Group quarters - Barracks, unaccompanied personnel housing (UPH), (Enlisted/Officer), ;and similar group living quarters for military personnel (%)
People in Group quarters - Transient quarters for temporary residents (%)
People in Group quarters - Military ships (%)
People in Group quarters - Group homes (%)
People in Group quarters - Homes or halfway houses for drug/alcohol abuse (%)
People in Group quarters - Homes for the mentally ill (%)
People in Group quarters - Homes for the mentally retarded (%)
People in Group quarters - Homes for the physically handicapped (%)
People in Group quarters - Other group homes (%)
People in Group quarters - Religious group quarters (%)
People in Group quarters - Dormitories (%)
People in Group quarters - Agriculture workers' dormitories on farms (%)
People in Group quarters - Job Corps and vocational training facilities (%)
People in Group quarters - Other workers' dormitories (%)
People in Group quarters - Crews of maritime vessels (%)
People in Group quarters - Other nonhousehold living situations (%)
People in Group quarters - Other noninstitutional group quarters (%)
Residents speaking English at home (%)
Residents speaking English at home - Born in the United States (%)
Residents speaking English at home - Native, born elsewhere (%)
Residents speaking English at home - Foreign born (%)
Residents speaking Spanish at home (%)
Residents speaking Spanish at home - Born in the United States (%)
Residents speaking Spanish at home - Native, born elsewhere (%)
Residents speaking Spanish at home - Foreign born (%)
Residents speaking other language at home (%)
Residents speaking other language at home - Born in the United States (%)
Residents speaking other language at home - Native, born elsewhere (%)
Residents speaking other language at home - Foreign born (%)
Class of Workers - Employee of private company (%)
Class of Workers - Self-employed in own incorporated business (%)
Class of Workers - Private not-for-profit wage and salary workers (%)
Class of Workers - Local government workers (%)
Class of Workers - State government workers (%)
Class of Workers - Federal government workers (%)
Class of Workers - Self-employed workers in own not incorporated business and Unpaid family workers (%)
House heating fuel used in houses and condos - Utility gas (%)
House heating fuel used in houses and condos - Bottled, tank, or LP gas (%)
House heating fuel used in houses and condos - Electricity (%)
House heating fuel used in houses and condos - Fuel oil, kerosene, etc. (%)
House heating fuel used in houses and condos - Coal or coke (%)
House heating fuel used in houses and condos - Wood (%)
House heating fuel used in houses and condos - Solar energy (%)
House heating fuel used in houses and condos - Other fuel (%)
House heating fuel used in houses and condos - No fuel used (%)
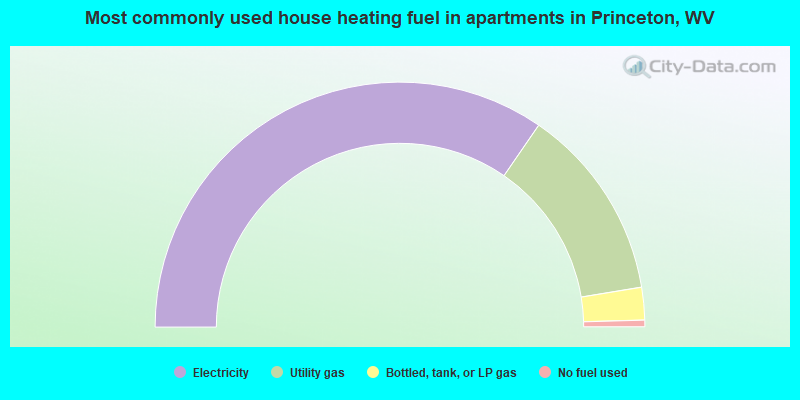
House heating fuel used in apartments - Utility gas (%)
House heating fuel used in apartments - Bottled, tank, or LP gas (%)
House heating fuel used in apartments - Electricity (%)
House heating fuel used in apartments - Fuel oil, kerosene, etc. (%)
House heating fuel used in apartments - Coal or coke (%)
House heating fuel used in apartments - Wood (%)
House heating fuel used in apartments - Solar energy (%)
House heating fuel used in apartments - Other fuel (%)
House heating fuel used in apartments - No fuel used (%)
Armed forces status - In Armed Forces (%)
Armed forces status - Civilian (%)
Armed forces status - Civilian - Veteran (%)
Armed forces status - Civilian - Nonveteran (%)
Fatal accidents locations in years 2005-2021
Fatal accidents locations in 2005
Fatal accidents locations in 2006
Fatal accidents locations in 2007
Fatal accidents locations in 2008
Fatal accidents locations in 2009
Fatal accidents locations in 2010
Fatal accidents locations in 2011
Fatal accidents locations in 2012
Fatal accidents locations in 2013
Fatal accidents locations in 2014
Fatal accidents locations in 2015
Fatal accidents locations in 2016
Fatal accidents locations in 2017
Fatal accidents locations in 2018
Fatal accidents locations in 2019
Fatal accidents locations in 2020
Fatal accidents locations in 2021
Alcohol use - People drinking some alcohol every month (%)
Alcohol use - People not drinking at all (%)
Alcohol use - Average days/month drinking alcohol
Alcohol use - Average drinks/week
Alcohol use - Average days/year people drink much
Audiometry - Average condition of hearing (%)
Audiometry - People that can hear a whisper from across a quiet room (%)
Audiometry - People that can hear normal voice from across a quiet room (%)
Audiometry - Ears ringing, roaring, buzzing (%)
Audiometry - Had a job exposure to loud noise (%)
Audiometry - Had off-work exposure to loud noise (%)
Blood Pressure & Cholesterol - Has high blood pressure (%)
Blood Pressure & Cholesterol - Checking blood pressure at home (%)
Blood Pressure & Cholesterol - Frequently checking blood cholesterol (%)
Blood Pressure & Cholesterol - Has high cholesterol level (%)
Consumer Behavior - Money monthly spent on food at supermarket/grocery store
Consumer Behavior - Money monthly spent on food at other stores
Consumer Behavior - Money monthly spent on eating out
Consumer Behavior - Money monthly spent on carryout/delivered foods
Consumer Behavior - Income spent on food at supermarket/grocery store (%)
Consumer Behavior - Income spent on food at other stores (%)
Consumer Behavior - Income spent on eating out (%)
Consumer Behavior - Income spent on carryout/delivered foods (%)
Current Health Status - General health condition (%)
Current Health Status - Blood donors (%)
Current Health Status - Has blood ever tested for HIV virus (%)
Current Health Status - Left-handed people (%)
Dermatology - People using sunscreen (%)
Diabetes - Diabetics (%)
Diabetes - Had a blood test for high blood sugar (%)
Diabetes - People taking insulin (%)
Diet Behavior & Nutrition - Diet health (%)
Diet Behavior & Nutrition - Milk product consumption (# of products/month)
Diet Behavior & Nutrition - Meals not home prepared (#/week)
Diet Behavior & Nutrition - Meals from fast food or pizza place (#/week)
Diet Behavior & Nutrition - Ready-to-eat foods (#/month)
Diet Behavior & Nutrition - Frozen meals/pizza (#/month)
Drug Use - People that ever used marijuana or hashish (%)
Drug Use - Ever used hard drugs (%)
Drug Use - Ever used any form of cocaine (%)
Drug Use - Ever used heroin (%)
Drug Use - Ever used methamphetamine (%)
Health Insurance - People covered by health insurance (%)
Kidney Conditions-Urology - Avg. # of times urinating at night
Medical Conditions - People with asthma (%)
Medical Conditions - People with anemia (%)
Medical Conditions - People with psoriasis (%)
Medical Conditions - People with overweight (%)
Medical Conditions - Elderly people having difficulties in thinking or remembering (%)
Medical Conditions - People who ever received blood transfusion (%)
Medical Conditions - People having trouble seeing even with glass/contacts (%)
Medical Conditions - People with arthritis (%)
Medical Conditions - People with gout (%)
Medical Conditions - People with congestive heart failure (%)
Medical Conditions - People with coronary heart disease (%)
Medical Conditions - People with angina pectoris (%)
Medical Conditions - People who ever had heart attack (%)
Medical Conditions - People who ever had stroke (%)
Medical Conditions - People with emphysema (%)
Medical Conditions - People with thyroid problem (%)
Medical Conditions - People with chronic bronchitis (%)
Medical Conditions - People with any liver condition (%)
Medical Conditions - People who ever had cancer or malignancy (%)
Mental Health - People who have little interest in doing things (%)
Mental Health - People feeling down, depressed, or hopeless (%)
Mental Health - People who have trouble sleeping or sleeping too much (%)
Mental Health - People feeling tired or having little energy (%)
Mental Health - People with poor appetite or overeating (%)
Mental Health - People feeling bad about themself (%)
Mental Health - People who have trouble concentrating on things (%)
Mental Health - People moving or speaking slowly or too fast (%)
Mental Health - People having thoughts they would be better off dead (%)
Oral Health - Average years since last visit a dentist
Oral Health - People embarrassed because of mouth (%)
Oral Health - People with gum disease (%)
Oral Health - General health of teeth and gums (%)
Oral Health - Average days a week using dental floss/device
Oral Health - Average days a week using mouthwash for dental problem
Oral Health - Average number of teeth
Pesticide Use - Households using pesticides to control insects (%)
Pesticide Use - Households using pesticides to kill weeds (%)
Physical Activity - People doing vigorous-intensity work activities (%)
Physical Activity - People doing moderate-intensity work activities (%)
Physical Activity - People walking or bicycling (%)
Physical Activity - People doing vigorous-intensity recreational activities (%)
Physical Activity - People doing moderate-intensity recreational activities (%)
Physical Activity - Average hours a day doing sedentary activities
Physical Activity - Average hours a day watching TV or videos
Physical Activity - Average hours a day using computer
Physical Functioning - People having limitations keeping them from working (%)
Physical Functioning - People limited in amount of work they can do (%)
Physical Functioning - People that need special equipment to walk (%)
Physical Functioning - People experiencing confusion/memory problems (%)
Physical Functioning - People requiring special healthcare equipment (%)
Prescription Medications - Average number of prescription medicines taking
Preventive Aspirin Use - Adults 40+ taking low-dose aspirin (%)
Reproductive Health - Vaginal deliveries (%)
Reproductive Health - Cesarean deliveries (%)
Reproductive Health - Deliveries resulted in a live birth (%)
Reproductive Health - Pregnancies resulted in a delivery (%)
Reproductive Health - Women breastfeeding newborns (%)
Reproductive Health - Women that had a hysterectomy (%)
Reproductive Health - Women that had both ovaries removed (%)
Reproductive Health - Women that have ever taken birth control pills (%)
Reproductive Health - Women taking birth control pills (%)
Reproductive Health - Women that have ever used Depo-Provera or injectables (%)
Reproductive Health - Women that have ever used female hormones (%)
Sexual Behavior - People 18+ that ever had sex (vaginal, anal, or oral) (%)
Sexual Behavior - Males 18+ that ever had vaginal sex with a woman (%)
Sexual Behavior - Males 18+ that ever performed oral sex on a woman (%)
Sexual Behavior - Males 18+ that ever had anal sex with a woman (%)
Sexual Behavior - Males 18+ that ever had any sex with a man (%)
Sexual Behavior - Females 18+ that ever had vaginal sex with a man (%)
Sexual Behavior - Females 18+ that ever performed oral sex on a man (%)
Sexual Behavior - Females 18+ that ever had anal sex with a man (%)
Sexual Behavior - Females 18+ that ever had any kind of sex with a woman (%)
Sexual Behavior - Average age people first had sex
Sexual Behavior - Average number of female sex partners in lifetime (males 18+)
Sexual Behavior - Average number of female vaginal sex partners in lifetime (males 18+)
Sexual Behavior - Average age people first performed oral sex on a woman (18+)
Sexual Behavior - Average number of woman performed oral sex on in lifetime (18+)
Sexual Behavior - Average number of male sex partners in lifetime (males 18+)
Sexual Behavior - Average number of male anal sex partners in lifetime (males 18+)
Sexual Behavior - Average age people first performed oral sex on a man (18+)
Sexual Behavior - Average number of male oral sex partners in lifetime (18+)
Sexual Behavior - People using protection when performing oral sex (%)
Sexual Behavior - Average number of times people have vaginal or anal sex a year
Sexual Behavior - People having sex without condom (%)
Sexual Behavior - Average number of male sex partners in lifetime (females 18+)
Sexual Behavior - Average number of male vaginal sex partners in lifetime (females 18+)
Sexual Behavior - Average number of female sex partners in lifetime (females 18+)
Sexual Behavior - Circumcised males 18+ (%)
Sleep Disorders - Average hours sleeping at night
Sleep Disorders - People that has trouble sleeping (%)
Smoking-Cigarette Use - People smoking cigarettes (%)
Taste & Smell - People 40+ having problems with smell (%)
Taste & Smell - People 40+ having problems with taste (%)
Taste & Smell - People 40+ that ever had wisdom teeth removed (%)
Taste & Smell - People 40+ that ever had tonsils teeth removed (%)
Taste & Smell - People 40+ that ever had a loss of consciousness because of a head injury (%)
Taste & Smell - People 40+ that ever had a broken nose or other serious injury to face or skull (%)
Taste & Smell - People 40+ that ever had two or more sinus infections (%)
Weight - Average height (inches)
Weight - Average weight (pounds)
Weight - Average BMI
Weight - People that are obese (%)
Weight - People that ever were obese (%)
Weight - People trying to lose weight (%)
Officers per 1,000 residents here:
3.60West Virginia average:
1.95
Latest news from Princeton, WV collected exclusively by city-data.com from local newspapers, TV, and radio stations
Ancestries: English (18.6%), American (13.1%), Irish (10.5%), Scotch-Irish (6.8%), Moroccan (6.5%), German (4.8%).
Current Local Time:
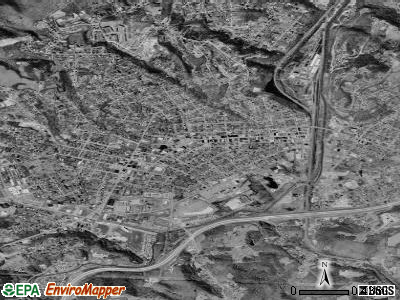
Land area: 3.00 square miles.
Population density: 1,909 people per square mile (low).
66 residents are foreign born
This city:
1.1%West Virginia:
1.6%
Median real estate property taxes paid for housing units with mortgages in 2022: $592 (0.6%)Median real estate property taxes paid for housing units with no mortgage in 2022: $598 (0.4%)
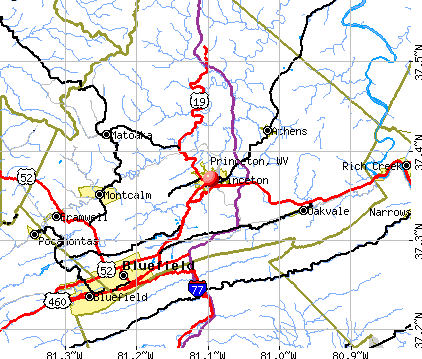
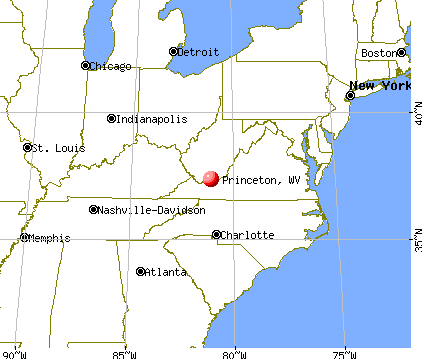
Nearest city with pop. 50,000+: Roanoke, VA
Nearest city with pop. 200,000+: Greensboro, NC
Nearest city with pop. 1,000,000+: Philadelphia, PA
Nearest cities:
Oakvale, WV (2.7 miles),
Latitude: 37.37 N, Longitude: 81.10 W
Daytime population change due to commuting: +6,127 (+106.1%)Workers who live and work in this city: 1,038 (43.2%)
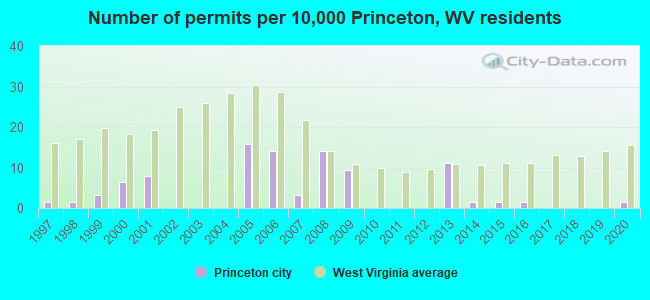
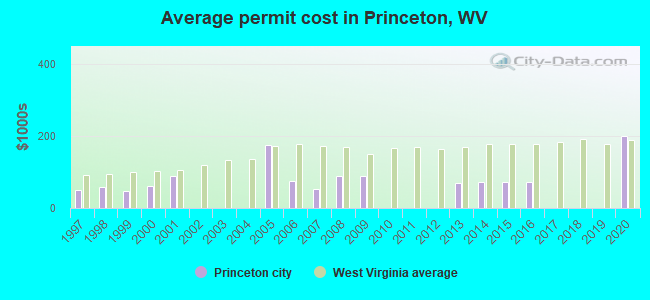
Single-family new house construction building permits:
2020: 1 building , cost: $200,0002016: 1 building , cost: $72,0002015: 1 building , cost: $72,0002014: 1 building , cost: $72,0002013: 7 buildings , average cost: $69,3002009: 6 buildings , average cost: $90,1002008: 9 buildings , average cost: $90,1002007: 2 buildings , average cost: $52,5002006: 9 buildings , average cost: $75,9002005: 10 buildings , average cost: $175,2002001: 5 buildings , average cost: $88,6002000: 4 buildings , average cost: $61,4001999: 2 buildings , average cost: $46,8001998: 1 building , cost: $58,0001997: 1 building , cost: $50,000Unemployment in December 2023: Here:
4.3%West Virginia:
4.0%
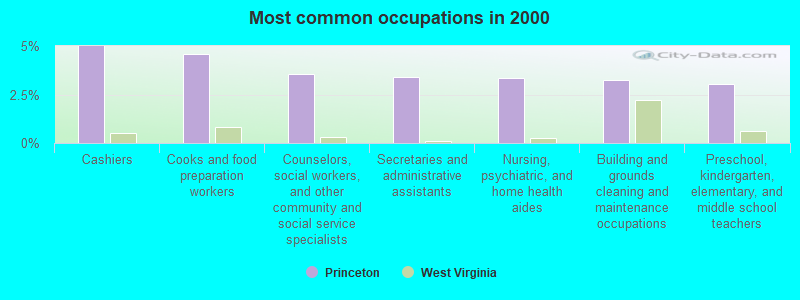
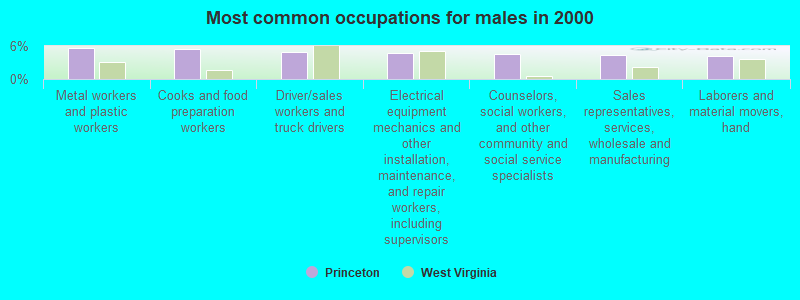
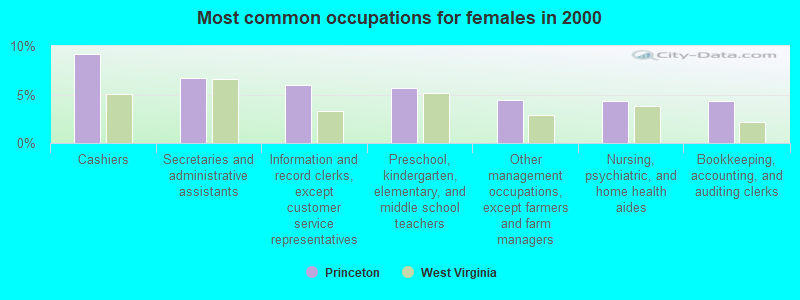
Most common occupations in Princeton, WV (%)
Both Males Females
Cashiers (5.0%)
Cooks and food preparation workers (4.6%)
Counselors, social workers, and other community and social service specialists (3.6%)
Secretaries and administrative assistants (3.4%)
Nursing, psychiatric, and home health aides (3.3%)
Building and grounds cleaning and maintenance occupations (3.2%)
Preschool, kindergarten, elementary, and middle school teachers (3.0%)
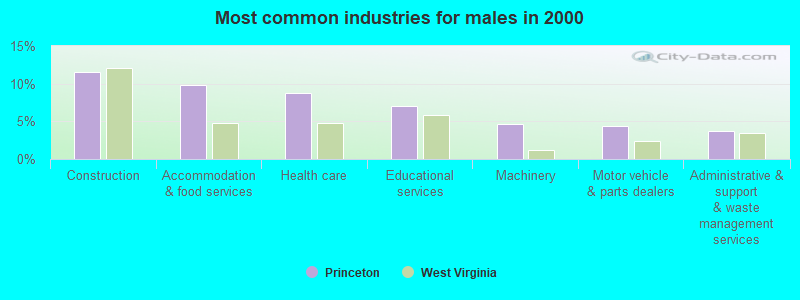
Metal workers and plastic workers (5.6%)
Cooks and food preparation workers (5.5%)
Driver/sales workers and truck drivers (5.0%)
Electrical equipment mechanics and other installation, maintenance, and repair workers, including supervisors (4.8%)
Counselors, social workers, and other community and social service specialists (4.5%)
Sales representatives, services, wholesale and manufacturing (4.3%)
Laborers and material movers, hand (4.2%)
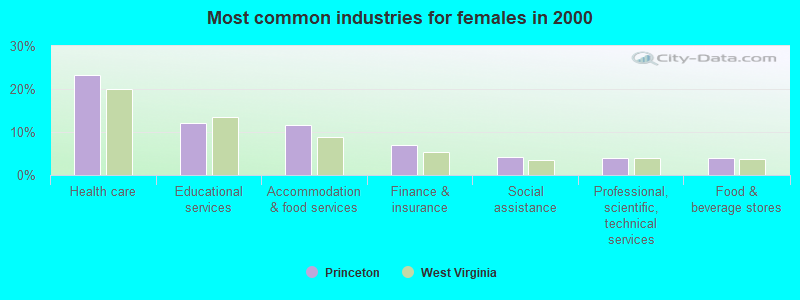
Cashiers (9.2%)
Secretaries and administrative assistants (6.7%)
Information and record clerks, except customer service representatives (6.0%)
Preschool, kindergarten, elementary, and middle school teachers (5.6%)
Other management occupations, except farmers and farm managers (4.4%)
Nursing, psychiatric, and home health aides (4.3%)
Bookkeeping, accounting, and auditing clerks (4.3%)
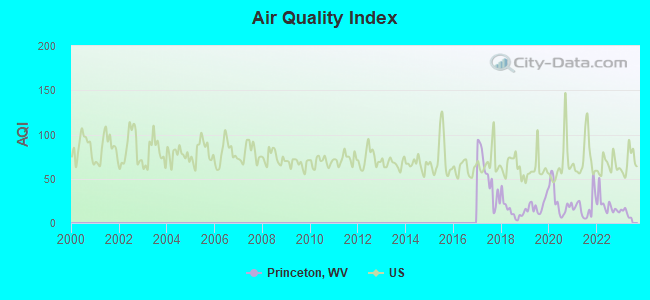
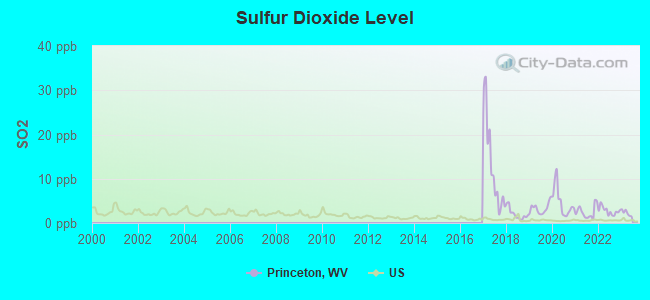
Air pollution and air quality trends(lower is better)
AQI SO2
Tornado activity:
Princeton-area historical tornado activity is below West Virginia state average. It is 80% smaller than the overall U.S. average.
On 4/4/1974, a category F3 (max. wind speeds 158-206 mph) tornado 23.0 miles away from the Princeton city center injured 12 people and caused between $500,000 and $5,000,000 in damages.
On 4/4/1974, a category F3 tornado 30.2 miles away from the city center killed one person and injured 11 people and caused between $500,000 and $5,000,000 in damages.
Earthquake activity:
Princeton-area historical earthquake activity is significantly above West Virginia state average. It is 11% smaller than the overall U.S. average. On 8/23/2011 at 17:51:04, a magnitude 5.8 (5.8 MW, Depth: 3.7 mi, Class: Moderate, Intensity: VI - VII) earthquake occurred 177.0 miles away from the city center On 8/9/2020 at 12:07:37, a magnitude 5.1 (5.1 MW, Depth: 4.7 mi) earthquake occurred 61.7 miles away from Princeton center On 7/27/1980 at 18:52:21, a magnitude 5.2 (5.1 MB, 4.7 MS, 5.0 UK, 5.2 UK) earthquake occurred 166.0 miles away from the city center On 11/2/2006 at 17:53:02, a magnitude 4.3 (4.3 MB, Depth: 0.6 mi, Class: Light, Intensity: IV - V) earthquake occurred 46.8 miles away from Princeton center On 11/23/2006 at 10:42:57, a magnitude 4.3 (4.3 MB) earthquake occurred 50.6 miles away from the city center On 6/29/1996 at 19:30:42, a magnitude 4.1 (4.1 MB, 3.9 LG, Depth: 0.6 mi) earthquake occurred 48.7 miles away from Princeton center Magnitude types: regional Lg-wave magnitude (LG), body-wave magnitude (MB), surface-wave magnitude (MS), moment magnitude (MW) Natural disasters: The number of natural disasters in Mercer County (23) is greater than the US average (15).Major Disasters (Presidential) Declared: 17Emergencies Declared: 5Floods: 12, Storms: 10, Landslides: 6, Mudslides: 4, Winter Storms: 4, Hurricanes: 2, Blizzard: 1, Drought: 1, Fire: 1, Heavy Rain: 1, Snowfall: 1, Snowstorm: 1, Wind: 1, Other: 1 (Note: some incidents may be assigned to more than one category). Hospitals in Princeton: CHURCH LANE GROUP HOME (226 CHURCH LANE) H/S SOUTHERN HILLS REGIONAL REHAB (120 12TH ST) OLD BLUEFIELD GROUP HOME (226 OLD BLUEFIELD ROAD) PRINCETON COMMUNITY HOSPITAL (Government - Local, 122 12TH STREET) THOMPSON GROUP HOME ("ROUTE 6, BOX 365") VALLEY VIEW GROUP HOME (129 VALLEY VIEW DRIVE) Nursing Homes in Princeton: GLEN WOOD PARK, INC. (1924 GLEN WOOD PARK RD.) PRINCETON HEALTH CARE CENTER (315 COURTHOUSE RD.) PRINCETON SPECIAL CARE SERVICE (PRINCETON COMMUNITY HOSPITAL) Dialysis Facilities in Princeton: FMC - MERCER COUNTY (160 SPRINGHAVEN DR) Home Health Centers in Princeton: MOUNTAINEER HOME NURSING, INC (P O BOX 5469) PCH HOME HEALTH (203 12TH STREET, EXT) Heliports located in Princeton:
Colleges/Universities in Princeton: Mercer County Technical Education Center Full-time enrollment: 154; Location: 1397 Stafford Dr; Public; Website: www.edline.net/pages/mercer_county_technical_education_center)
Valley College-Princeton Full-time enrollment: 114; Location: 616 Harrison St; Private, for-profit; Website: www.valley.edu)
Colleges/universities with over 2000 students nearest to Princeton:
Concord University (about 7 miles; Athens, WV ; Full-time enrollment: 2,698)
Wytheville Community College (about 29 miles; Wytheville, VA ; FT enrollment: 2,193)
New River Community College (about 29 miles; Dublin, VA ; FT enrollment: 3,007)
New River Community and Technical College (about 31 miles; Beckley, WV ; FT enrollment: 2,234)
Radford University (about 35 miles; Radford, VA ; FT enrollment: 9,426)
Virginia Polytechnic Institute and State University (about 39 miles; Blacksburg, VA ; FT enrollment: 30,984)
Roanoke College (about 58 miles; Salem, VA ; FT enrollment: 2,316)
Public high schools in Princeton: PRINCETON SENIOR HIGH SCHOOL Students: 1,023, Location: 1321 STAFFORD DRIVE, Grades: 9-12)PIKEVIEW HIGH SCHOOL Students: 643, Location: 3566 EADS MILL ROAD, Grades: 9-12)SAM PERDUE JUVENILE CENTER Location: 843 SHELTER ROAD, Grades: 8-12)
MERCER COUNTY TECHNICAL EDUCATION CENTER Location: 1397 STAFFORD DRIVE, Grades: PK-12)
Private high school in Princeton: MERCER CHRISTIAN ACADEMY Students: 156, Location: 314A OAKVALE RD, Grades: PK-12)
Public elementary/middle schools in Princeton: GLENWOOD SCHOOL Students: 720, Location: 1734 GLENWOOD PARK ROAD, Grades: KG-8)PRINCETON MIDDLE SCHOOL Students: 622, Location: 300 N JOHNSTON ST, Grades: 6-8)MERCER ELEMENTARY SCHOOL Students: 328, Location: 1200 MERCER STREET, Grades: 3-5)STRALEY ELEMENTARY SCHOOL Students: 207, Location: 810 STRALEY AVENUE, Grades: 3-5)MELROSE ELEMENTARY SCHOOL Students: 198, Location: 2121 ATHENS ROAD, Grades: KG-5)OAKVALE SCHOOL Location: 2503 GOODWINS CHAPEL RD, Grades: PK-5)
PRINCETON PRIMARY SCHOOL Location: 180 TIGER DRIVE, Grades: KG-2)
PIKEVIEW MIDDLE SCHOOL Location: 3550 EADS MILL ROAD, Grades: 6-8)
See full list of schools located in Princeton Library in Princeton: PRINCETON PUBLIC LIBRARY Operating income: $257,554; Location: 205 CENTER STREET; 104,606 books ; 4,710 audio materials ; 1,878 video materials ; 12 state licensed databases ; 162 print serial subscriptions )
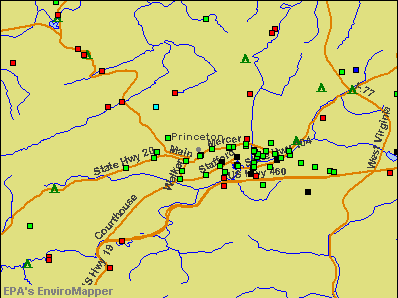
Notable locations in Princeton: (A) , Princeton Public Library (B) , Princeton City Hall (C) , HealthSouth Southern Hills Rehabilitation Hospital (D) , Princeton Fire Department Station 1 (E) , Princeton Fire Department Station 2 (F) , Mercer County Courthouse (G) . Display/hide their locations on the map
Churches in Princeton include: (A) , Burke Memorial Baptist Church (B) , Church of Christ (C) , Church of God (D) , Church of the Nazarene (E) , First Baptist Church (F) , First Church of Christ (G) , First Church of God (H) , First United Methodist Church (I) . Display/hide their locations on the map
Cemeteries: (1) , Oakwood Cemetery (2) . Display/hide their locations on the map
Lake: (A) . Display/hide its location on the map
Streams, rivers, and creeks: (A) , Daves Fork (B) . Display/hide their locations on the map
Park in Princeton: (1) . Display/hide its location on the map
Tourist attraction:
Hotels:
Courts:
Birthplace of: Rod Thorn - Basketball player, Don Caruth - Politician, John Woods (baseball) - Baseball player, Greg Keatley - Baseball player.
Mercer County has a predicted average indoor radon screening level greater than 4 pCi/L (pico curies per liter) - Highest Potential Drinking water stations with addresses in Princeton and their reported violations in the past:
APPALACHIAN TEEN CHALLENGE FEMALE CENTER (Address: 1651 UNITY ROAD Population served: 25, Groundwater):
Past monitoring violations:
Monitoring of Treatment (SWTR-Unfilt/GWR) - In JUN-2014, Contaminant: GROUNDWATER RULE
Monitoring of Treatment (SWTR-Unfilt/GWR) - In MAY-2014, Contaminant: GROUNDWATER RULE
Initial Tap Sampling for Pb and Cu - In JAN-01-2013, Contaminant: Lead and Copper Rule. Follow-up actions: St Formal NOV issued (FEB-07-2013), St Compliance achieved (FEB-20-2013)
Monitoring, Repeat Major (TCR) - In JUL-2012, Contaminant: Coliform (TCR). Follow-up actions: St Public Notif requested (OCT-03-2012), St Formal NOV issued (OCT-03-2012), St Compliance achieved (OCT-15-2012), St Public Notif received (OCT-17-2012)
Initial Tap Sampling for Pb and Cu - In JUL-01-2012, Contaminant: Lead and Copper Rule. Follow-up actions: St Formal NOV issued (AUG-03-2012), St Compliance achieved (AUG-08-2012)
2 routine major monitoring violations
39 regular monitoring violations
One other older monitoring violation
Address: 1651 UNITY ROAD Population served: 25, Groundwater):
Past monitoring violations:
Monitoring of Treatment (SWTR-Unfilt/GWR) - In JUN-2014, Contaminant: GROUNDWATER RULE
Monitoring of Treatment (SWTR-Unfilt/GWR) - In MAY-2014, Contaminant: GROUNDWATER RULE
Monitoring and Reporting (DBP) - Between OCT-2013 and DEC-2013, Contaminant: Chlorine. Follow-up actions: St Compliance achieved (NOV-01-2013), St Public Notif requested (DEC-12-2013), St Formal NOV issued (DEC-12-2013), St Public Notif received (DEC-18-2013)
Monitoring and Reporting (DBP) - Between JAN-2009 and DEC-2009, Contaminant: Total Haloacetic Acids (HAA5). Follow-up actions: St Formal NOV issued (FEB-02-2010), St Compliance achieved (AUG-25-2010)
Monitoring and Reporting (DBP) - Between JAN-2009 and DEC-2009, Contaminant: TTHM. Follow-up actions: St Formal NOV issued (FEB-02-2010), St Compliance achieved (AUG-25-2010)
2 routine major monitoring violations
One minor monitoring violation
Average household size: This city:
2.1 peopleWest Virginia:
2.4 people
Percentage of family households: This city:
55.5%Whole state:
65.8%
Percentage of households with unmarried partners: This city:
6.5%Whole state:
6.6%
Likely homosexual households (counted as self-reported same-sex unmarried-partner households)
Lesbian couples: 0.5% of all households Gay men: 0.3% of all households
3 people in group homes intended for adults in 2010People in group quarters in Princeton in 2000:
117 people in nursing homes
16 people in homes for the mentally retarded
11 people in other noninstitutional group quarters
8 people in other group homes
Banks with branches in Princeton (2011 data):
First Community Bank: Stafford Commons Branch, Princeton Branch, Princeton Crossing Branch. Info updated 2011/07/12: Bank assets: $2,144.1 mil, Deposits: $1,561.3 mil, headquarters in Bluefield, VA, positive income , Commercial Lending Specialization, 58 total offices , Holding Company: First Community Bancshares, Inc.
First Century Bank, Inc.: Springhaven Branch at 145 Springhaven Drive, branch established on 2001/07/30; Princeton Branch at 1215-A Pine Plaza Shopping Center, branch established on 1986/09/17. Info updated 2012/01/26: Bank assets: $417.5 mil, Deposits: $353.1 mil, headquarters in Bluefield, WV, positive income , Commercial Lending Specialization, 12 total offices , Holding Company: First Century Bankshares, Inc.
City National Bank of West Virginia: Princeton Branch at 191 Greasy Ridge Road, branch established on 2007/11/26. Info updated 2008/01/10: Bank assets: $2,753.2 mil, Deposits: $2,223.1 mil, headquarters in Charleston, WV, positive income , Commercial Lending Specialization, 68 total offices , Holding Company: City Holding Company
Branch Banking and Trust Company: Princeton-Bluefield Main Branch at 1309 Stafford Drive, branch established on 1977/02/24. Info updated 2010/03/29: Bank assets: $168,867.6 mil, Deposits: $127,549.5 mil, headquarters in Winston Salem, NC, positive income , Commercial Lending Specialization, 1793 total offices , Holding Company: Bb&T Corporation
New Peoples Bank, Inc.: Princeton Office Branch at 1221 Stafford Drive, branch established on 2001/09/20. Info updated 2007/08/21: Bank assets: $781.6 mil, Deposits: $709.1 mil, headquarters in Honaker, VA, negative income in the last year , Commercial Lending Specialization, 28 total offices , Holding Company: New Peoples Bankshares, Inc.
MCNB Bank and Trust Co.: South Walker Street Branch at 322 South Walker Street, branch established on 2003/02/25. Info updated 2006/11/03: Bank assets: $320.0 mil, Deposits: $284.1 mil, headquarters in Welch, WV, positive income , Commercial Lending Specialization, 7 total offices , Holding Company: Mcnb Banks, Inc.
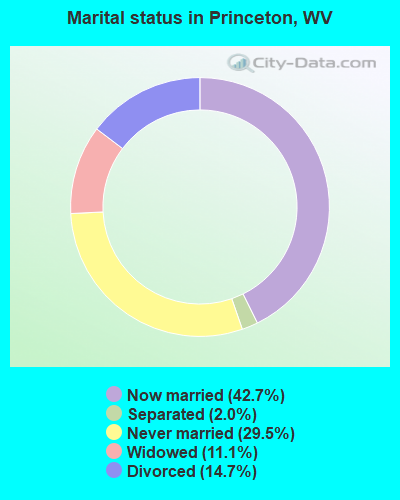
For population 15 years and over in Princeton:
Never married: 29.5%Now married: 42.7%Separated: 2.0%Widowed: 11.1%Divorced: 14.7% For population 25 years and over in Princeton:
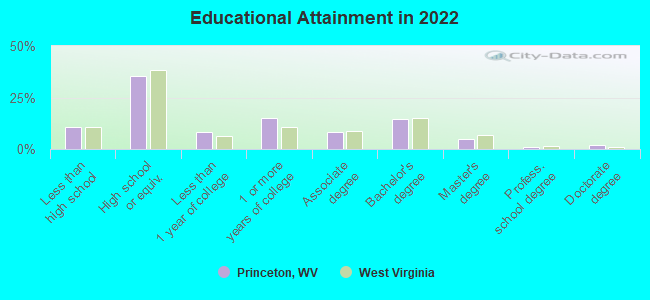
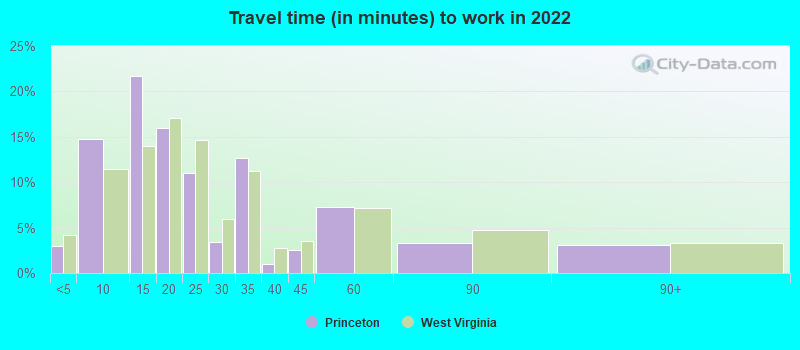
High school or higher: 88.7%Bachelor's degree or higher: 20.1%Graduate or professional degree: 7.1%Unemployed: 6.7%Mean travel time to work (commute): 17.7 minutes
Education Gini index (Inequality in education) Here:
10.7West Virginia average:
11.1
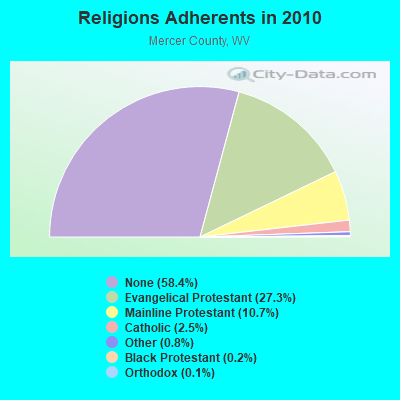
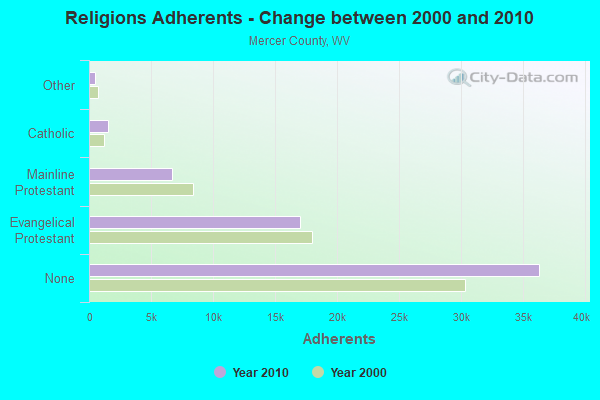
Religion statistics for Princeton, WV (based on Mercer County data)
Religion Adherents Congregations Evangelical Protestant 17,020 100 Mainline Protestant 6,683 51 Catholic 1,560 2 Other 486 5 Black Protestant 95 7 Orthodox 76 1 None 36,344 -
Source: Clifford Grammich, Kirk Hadaway, Richard Houseal, Dale E.Jones, Alexei Krindatch, Richie Stanley and Richard H.Taylor. 2012. 2010 U.S.Religion Census: Religious Congregations & Membership Study. Association of Statisticians of American Religious Bodies. Jones, Dale E., et al. 2002. Congregations and Membership in the United States 2000. Nashville, TN: Glenmary Research Center. Graphs represent county-level data
Food Environment Statistics: Number of grocery stores : 14Mercer County :
2.29 / 10,000 pop.West Virginia :
2.41 / 10,000 pop.
Number of supercenters and club stores : 1Mercer County :
0.16 / 10,000 pop.West Virginia :
0.28 / 10,000 pop.
Number of convenience stores (no gas) : 4Here :
0.65 / 10,000 pop.West Virginia :
1.09 / 10,000 pop.
Number of convenience stores (with gas) : 36Mercer County :
5.88 / 10,000 pop.State :
5.38 / 10,000 pop.
Number of full-service restaurants : 38This county :
6.20 / 10,000 pop.West Virginia :
6.22 / 10,000 pop.
Adult obesity rate : Mercer County :
28.5%West Virginia :
31.1%
Low-income preschool obesity rate : Mercer County :
13.4%West Virginia :
13.1%
Health and Nutrition: Healthy diet rate : Princeton:
51.8%West Virginia:
51.8%
Average overall health of teeth and gums : This city:
49.9%West Virginia:
49.7%
Average BMI : Princeton:
29.3West Virginia:
28.6
People feeling badly about themselves : Princeton:
19.9%West Virginia:
20.4%
People not drinking alcohol at all : This city:
15.4%West Virginia:
9.7%
Average hours sleeping at night : Princeton:
6.9West Virginia:
6.9
Overweight people : Princeton:
41.3%West Virginia:
34.8%
General health condition : This city:
55.7%State:
58.4%
Average condition of hearing : Princeton:
78.5%State:
78.6%
More about Health and Nutrition of Princeton, WV Residents
Local government employment and payroll (March 2022)
Function
Full-time employees
Monthly full-time payroll
Average yearly full-time wage
Part-time employees
Monthly part-time payroll
Hospitals
1,125 $5,868,091 $62,593 163 $463,886 Police Protection - Officers
18 $100,934 $67,289 0 $0 Streets and Highways
15 $40,072 $32,058 0 $0 Firefighters
12 $55,034 $55,034 0 $0 Other Government Administration
7 $31,972 $54,809 7 $3,700 Financial Administration
3 $13,543 $54,172 0 $0 Parks and Recreation
2 $5,832 $34,992 7 $3,333 Police - Other
2 $5,538 $33,228 0 $0 Judicial and Legal
1 $1,951 $23,412 0 $0 Local Libraries
1 $2,128 $25,536 5 $5,753
Totals for Government
1,186 $6,125,095 $61,974 182 $476,671
Princeton government finances - Expenditure in 2021 (per resident):
Current Operations - Hospitals: $152,280,000 ($26603.77)
Police Protection: $1,853,000 ($323.72)Central Staff Services: $1,346,000 ($235.15)Local Fire Protection: $1,029,000 ($179.77)Regular Highways: $955,000 ($166.84)Solid Waste Management: $490,000 ($85.60)Parks and Recreation: $485,000 ($84.73)Financial Administration: $396,000 ($69.18)General Public Buildings: $321,000 ($56.08)Protective Inspection and Regulation - Other: $251,000 ($43.85)Judicial and Legal Services: $80,000 ($13.98)General - Other: $76,000 ($13.28)Public Welfare - Other: $14,000 ($2.45)General - Interest on Debt: $50,000 ($8.74)
Intergovernmental to Local - Other - Parks and Recreation: $211,000 ($36.86)
Other - Libraries: $154,000 ($26.90)Other - Transit Utilities: $27,000 ($4.72)Other Capital Outlay - Police Protection: $85,000 ($14.85)
Local Fire Protection: $28,000 ($4.89)General - Other: $10,000 ($1.75)
Princeton government finances - Revenue in 2021 (per resident):
Charges - Hospital Public: $154,943,000 ($27069.01)
Solid Waste Management: $520,000 ($90.85)Other: $131,000 ($22.89)Federal Intergovernmental - Other: $1,117,000 ($195.14)
Local Intergovernmental - Other: $259,000 ($45.25)
Miscellaneous - General Revenue - Other: $418,000 ($73.03)
Rents: $180,000 ($31.45)Donations From Private Sources: $151,000 ($26.38)Fines and Forfeits: $125,000 ($21.84)Sale of Property: $4,000 ($0.70)State Intergovernmental - General Local Government Support: $25,000 ($4.37)
Other: $2,000 ($0.35)Tax - Occupation and Business License - Other: $2,814,000 ($491.61)
Amusements Sales: $1,626,000 ($284.07)Property: $937,000 ($163.70)Public Utilities Sales: $393,000 ($68.66)Alcoholic Beverage Sales: $93,000 ($16.25)Other License: $64,000 ($11.18)Other: $28,000 ($4.89)Other Selective Sales: $7,000 ($1.22)
Princeton government finances - Debt in 2021 (per resident):
Long Term Debt - Beginning Outstanding - Unspecified Public Purpose: $1,533,000 ($267.82)
Outstanding Unspecified Public Purpose: $1,435,000 ($250.70)Retired Unspecified Public Purpose: $97,000 ($16.95)
Princeton government finances - Cash and Securities in 2021 (per resident):
Other Funds - Cash and Securities: $2,795,000 ($488.29)
Businesses in Princeton, WV
Name Count Name Count
7-Eleven 1 Lane Furniture 2 AT&T 1 Little Caesars Pizza 1 Advance Auto Parts 1 Long John Silver's 1 Applebee's 1 Lowe's 1 Arby's 2 McDonald's 2 AutoZone 1 Microtel 1 Blockbuster 1 Nike 1 Burger King 1 Outback 1 CVS 1 Outback Steakhouse 1 Chevrolet 1 Papa John's Pizza 1 Comfort Inn 1 Pizza Hut 1 Cracker Barrel 1 RadioShack 1 Curves 1 Rite Aid 1 Dairy Queen 2 Ryan's Grill 1 Days Inn 1 SONIC Drive-In 1 Domino's Pizza 1 Sleep Inn 1 FedEx 2 Starbucks 2 Ford 1 Subway 3 GameStop 1 Taco Bell 1 H&R Block 1 Toyota 1 Hardee's 2 U-Haul 3 Hilton 1 U.S. Cellular 1 Holiday Inn 1 UPS 6 Hyundai 1 Walgreens 1 KFC 1 Walmart 1 Kroger 1 Wendy's 2 La-Z-Boy 1
Strongest AM radio stations in Princeton:
WAEY (1490 AM; 1 kW; PRINCETON, WV; Owner: PRINCETON BROADCASTING, INC.)
WAMN (1050 AM; 1 kW; GREEN VALLEY, WV; Owner: WAMN, INC.)
WBDY (1190 AM; daytime; 10 kW; BLUEFIELD, VA; Owner: MONTEREY LICENSES, LLC)
WHIS (1440 AM; 5 kW; BLUEFIELD, WV; Owner: MONTEREY LICENSES, LLC)
WNRV (990 AM; 5 kW; NARROWS-PEARISBURG, VA; Owner: PERCEPTION MEDIA GROUP, INC.)
WIWS (1070 AM; daytime; 10 kW; BECKLEY, WV; Owner: SOUTHERN COMMUNICATIONS CORPORATION)
WKNV (890 AM; daytime; 10 kW; FAIRLAWN, VA; Owner: POSITIVE RADIO GROUP, INC.)
WJLS (560 AM; 5 kW; BECKLEY, WV; Owner: FIRST MEDIA RADIO, LLC)
WKEZ (1240 AM; 1 kW; BLUEFIELD, WV; Owner: MONTEREY LICENSES, LLC)
WWNR (620 AM; 5 kW; BECKLEY, WV; Owner: DYNASTAR COMMUNICATIONS, INC.)
WFNR (710 AM; daytime; 10 kW; BLACKSBURG, VA; Owner: PERCEPTION MEDIA GROUP, INC.)
WOAY (860 AM; 10 kW; OAK HILL, WV; Owner: COMMISSIONED COMMUNICATIONS, INC.)
WTRU (830 AM; 50 kW; KERNERSVILLE, NC; Owner: TRUTH BROADCASTING CORPORATION)
Strongest FM radio stations in Princeton:
WHAJ (104.5 FM; BLUEFIELD, WV; Owner: MONTEREY LICENSES, LLC)
WHKX (106.3 FM; BLUEFIELD, VA; Owner: MONTEREY LICENSES, LLC)
WPIB (91.1 FM; BLUEFIELD, WV; Owner: POSITIVE ALTERNATIVE RADIO, INC.)
WKOY-FM (100.9 FM; PRINCETON, WV; Owner: MONTEREY LICENSES, LLC)
WSTG (95.9 FM; PRINCETON, WV; Owner: PRINCETON BROADCASTING, INC.)
W244BB (96.7 FM; PRINCETON, WV; Owner: BIBLE BROADCASTING NETWORK, INC.)
WJLS-FM (99.5 FM; BECKLEY, WV; Owner: FIRST MEDIA RADIO, LLC)
WMTD-FM (102.3 FM; HINTON, WV; Owner: SOUTHERN COMMUNICATIONS CORPORATION)
KHPR (88.1 FM; HONOLULU, HI; Owner: HAWAII PUBLIC RADIO)
WPIN-FM (91.5 FM; DUBLIN, VA; Owner: POSITIVE ALTERNATIVE RADIO, INC.)
WPSK-FM (107.1 FM; PULASKI, VA; Owner: NEW RIVER VALLEY RADIO PARTNERS, LLC)
WMEV-FM (93.9 FM; MARION, VA; Owner: HOLSTON VALLEY BROADCASTING CORPORATION)
WCIR-FM (103.7 FM; BECKLEY, WV; Owner: SOUTHERN COMMUNICATIONS CORPORATION)
WXLK (92.3 FM; ROANOKE, VA; Owner: MEL WHEELER, INC.)
WSLQ (99.1 FM; ROANOKE, VA; Owner: MEL WHEELER, INC.)
WSLC-FM (94.9 FM; ROANOKE, VA; Owner: MEL WHEELER, INC.)
WVTF (89.1 FM; ROANOKE, VA; Owner: VIRGINIA TECH FOUNDATION INC)
WVTR (91.9 FM; MARION, VA; Owner: VIRGINIA TECH FOUNDATION INC)
WOLD-FM (102.5 FM; MARION, VA; Owner: EMERALD SOUND, INC.)
WROV-FM (96.3 FM; MARTINSVILLE, VA; Owner: CAPSTAR TX LIMITED PARTNERSHIP)
TV broadcast stations around Princeton:
WVVA (Channel 6; BLUEFIELD, WV; Owner: WVVA TELEVISON, INC.)
WLFB (Channel 40; BLUEFIELD, WV; Owner: LIVING FAITH MINISTRIES, INC.)
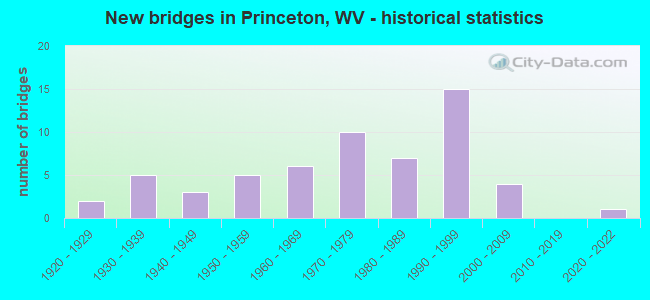
National Bridge Inventory (NBI) Statistics 58 Number of bridges499ft / 152m Total length $21,925,000 Total costs346,706 Total average daily traffic46,665 Total average daily truck traffic
New bridges - historical statistics
2 1920-1929 5 1930-1939 3 1940-1949 5 1950-1959 6 1960-1969 10 1970-1979 7 1980-1989 15 1990-1999 4 2000-2009 1 2020-2022
See full National Bridge Inventory statistics for Princeton, WV
Fire-safe hotels and motels in Princeton, West Virginia:
Budget Inn, 409 Thorn St, Princeton, West Virginia 24740 Phone: (304) 425-3585
Days Inn, 347 Meadowfield Ln, Princeton, West Virginia 24740 Phone: (304) 425-8100, Fax: (304) 487-1734
Comfort Inn Princeton, 136 Ambrose Ln, Princeton, West Virginia 24740 Phone: (304) 487-6101, Fax: (304) 425-7002
Ramada Limited, 1115 Oakvale Rd, Princeton, West Virginia 24740 Phone: (304) 425-8711, Fax: (304) 487-9785
Super 8, 901 Oakvale Rd, Princeton, West Virginia 24740 Phone: (304) 487-6161, Fax: (304) 487-6161
Holiday Inn Express, 805 Oakvale Rd, Princeton, West Virginia 24740 Phone: (304) 425-8156, Fax: (304) 425-1080
Country Inn & Suites, 111 Halls Ridge Rd, Princeton, West Virginia 24740 Phone: (304) 425-2200, Fax: (304) 425-2201
Microtel Inn & Suites, 250 Ambrose Ln, Princeton, West Virginia 24739 Phone: (304) 487-3885, Fax: (304) 487-0601
Hampton Inn, 277 Meadowfield Ln, Princeton, West Virginia 24740 Phone: (304) 431-2580, Fax: (304) 431-2366
All 9 fire-safe hotels and motels in Princeton, West Virginia
Most common first names in Princeton, WV among deceased individuals Name Count Lived (average)
James 295 70.8 years William 259 73.5 years Mary 209 78.4 years John 195 74.8 years Robert 158 71.2 years Charles 131 72.4 years George 103 73.8 years Virginia 92 77.3 years Helen 79 77.9 years Thomas 68 72.6 years
Most common last names in Princeton, WV among deceased individuals Last name Count Lived (average)
Bailey 155 75.4 years Smith 129 74.1 years White 129 74.9 years Thompson 87 73.9 years Blankenship 77 68.0 years Jones 77 74.6 years Hall 70 75.8 years Martin 70 75.4 years Hill 68 74.4 years Meadows 65 75.0 years
Princeton compared to West Virginia state average:
Unemployed percentage below state average. Hispanic race population percentage significantly below state average. Foreign-born population percentage below state average. Renting percentage above state average. Length of stay since moving in significantly above state average.
#6 on the list of "Top 101 cities with largest percentage of females in occupations: health technologists and technicians (population 5,000+)"
#20 on the list of "Top 101 cities with the highest number of murders per 100,000 residents, excludes tourist destinations and others with a lot of outsiders visiting based on city industries data (population 5,000+)"
#84 on the list of "Top 101 cities with largest percentage of males in occupations: office and administrative support occupations (population 5,000+)"
#2 on the list of "Top 101 counties with the highest number of deaths per 1000 residents 2007-2013 (pop. 50,000+)"
#6 on the list of "Top 101 counties with the smallest number of children under 18 without health insurance coverage in 2000 (pop. 50,000+)"
#13 on the list of "Top 101 counties with the lowest ground withdrawal of fresh water for public supply (pop. 50,000+)"
#17 on the list of "Top 101 counties with the smallest number of people without health insurance coverage in 2000 (pop. 50,000+)"
#38 on the list of "Top 101 counties with the largest increase in the number of deaths per 1000 residents 2000-2006 to 2007-2013 (pop. 50,000+)"
Top Patent Applicants
Tracy Leonard Lane (4)
Frank J. Bacho (3)
Theodore P. Werblin (3)
Nicholas Mckendree (1)
Jeffrey Alan Greenberg (1)
Adam Curatolo (1)
Robert Henry (1)
Christopher Lee Adams (1)
Bruce V. Mutter (1)
Dewayne Taylor (1)
Total of 16 patent applications in 2008-2024.


 Recent articles from our blog. Our writers, many of them Ph.D. graduates or candidates, create easy-to-read articles on a wide variety of topics.

 (63.0 miles
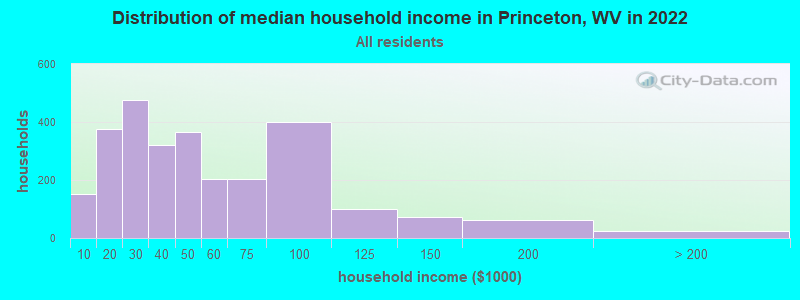


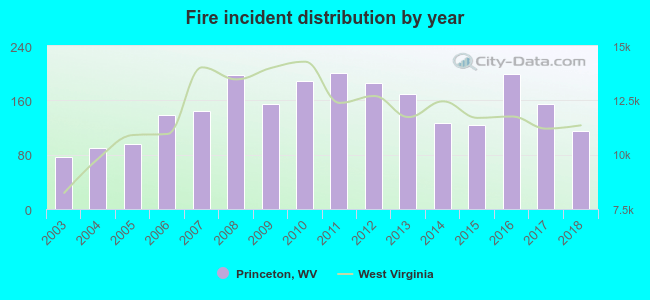 According to the data from the years 2003 - 2018 the average number of fires per year is 147. The highest number of fire incidents - 200 took place in 2011, and the least - 76 in 2003. The data has an increasing trend.
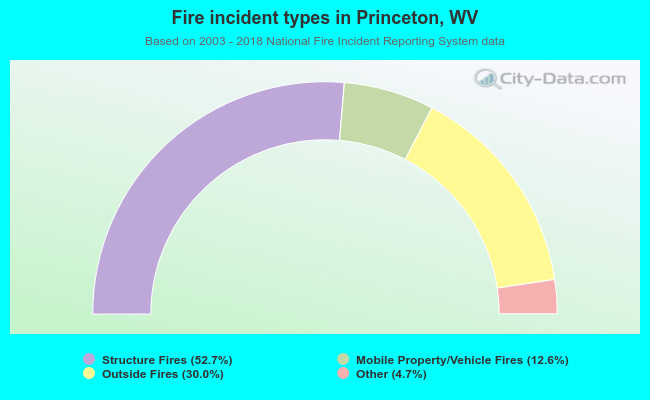 When looking into fire subcategories, the most incidents belonged to: Structure Fires (52.7%), and Outside Fires (30.0%).