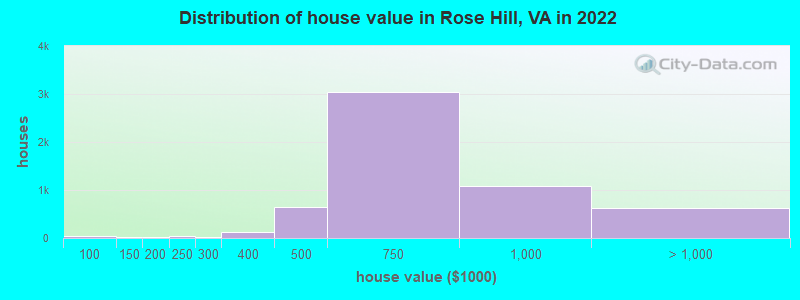
Estimated median house or condo value in 2022: $670,294 (it was $194,500 in 2000)
Rose Hill:
$670,294
VA:
$365,700
Mean prices in 2022:all housing units: $625,955; detached houses: $630,268; townhouses or other attached units: $603,860; in 5-or-more-unit structures: $295,711
Median gross rent in 2022: $2,029.
March 2022 cost of living index in Rose Hill: 164.2 (very high, U.S. average is 100)
Percentage of residents living in poverty in 2022: 2.0%
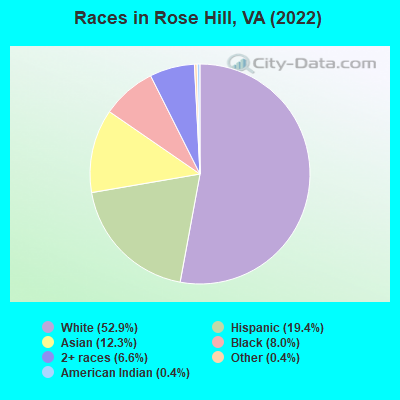
(1.2% for White Non-Hispanic residents, 4.2% for Black residents, 1.2% for Hispanic or Latino residents, 1.2% for other race residents, 3.3% for two or more races residents)
According to our research of Virginia and other state lists, there were 9 registered sex offenders living in Rose Hill, Virginia as of April 19, 2024. The ratio of all residents to sex offenders in Rose Hill is 2,342 to 1. The ratio of registered sex offenders to all residents in this city is much lower than the state average.
Recent articles from our blog. Our writers, many of them Ph.D. graduates or candidates, create easy-to-read articles on a wide variety of topics.
Latest news from Rose Hill, VA collected exclusively by city-data.com from local newspapers, TV, and radio stations
Ancestries: English (6.3%), Irish (5.2%), American (4.9%), German (4.8%), European (4.3%), Italian (1.6%).
Current Local Time: EST time zone
Land area: 4.60 square miles.
Population density: 4,397 people per square mile (average).
4,831 residents are foreign born (10.0% Latin America, 8.8% Asia).
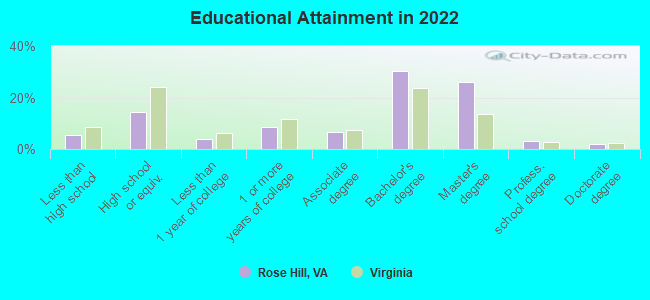
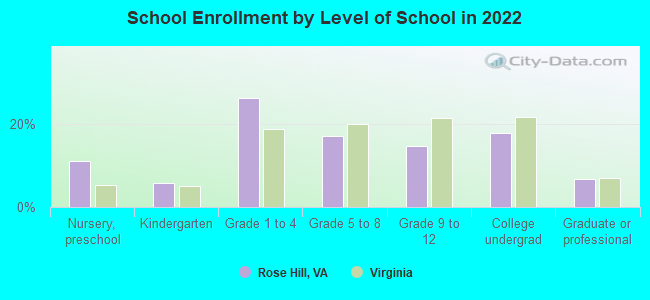
This place:
22.9%
Virginia:
12.6%
Median real estate property taxes paid for housing units with mortgages in 2022: $6,716 (1.0%) Median real estate property taxes paid for housing units with no mortgage in 2022: $6,484 (1.0%)
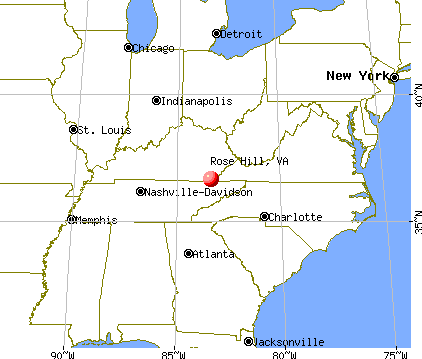
Nearest city with pop. 50,000+: Alexandria, VA (2.8 miles , pop. 128,283).
Nearest city with pop. 200,000+: Washington, DC (10.0 miles , pop. 572,059).
Nearest city with pop. 1,000,000+: Philadelphia, PA (134.2 miles , pop. 1,517,550).
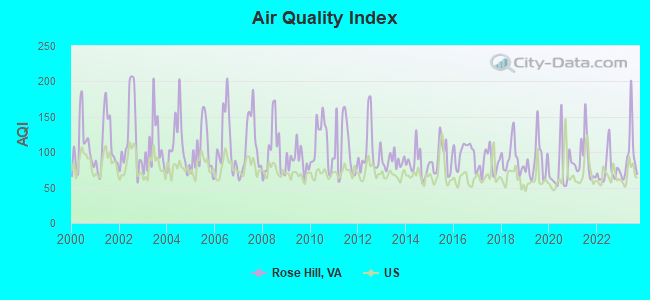
Air Quality Index (AQI) level in 2023 was 95.4. This is worse than average.
City:
95.4
U.S.:
72.6
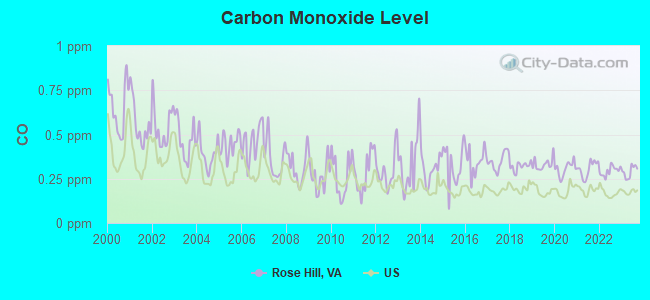
Carbon Monoxide (CO) [ppm] level in 2023 was 0.290. This is about average.Closest monitor was 1.7 miles away from the city center.
City:
0.290
U.S.:
0.251
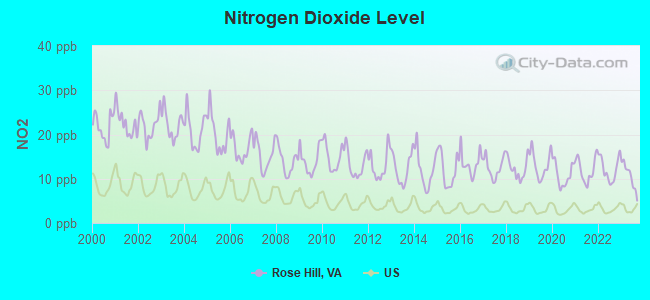
Nitrogen Dioxide (NO2) [ppb] level in 2023 was 10.6. This is significantly worse than average.Closest monitor was 1.7 miles away from the city center.
City:
10.6
U.S.:
5.1
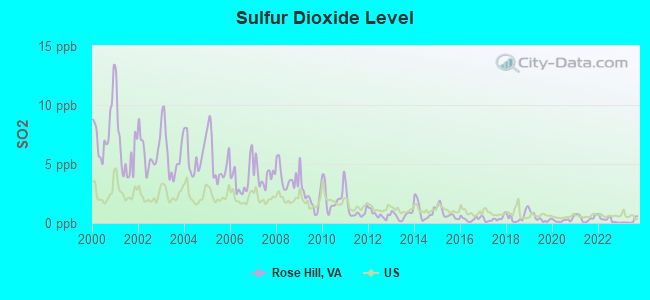
Sulfur Dioxide (SO2) [ppb] level in 2023 was 0.158. This is significantly better than average.Closest monitor was 1.1 miles away from the city center.
City:
0.158
U.S.:
1.515
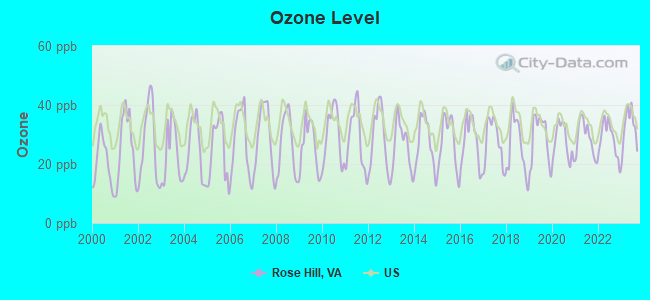
Ozone [ppb] level in 2023 was 32.4. This is about average.Closest monitor was 1.1 miles away from the city center.
City:
32.4
U.S.:
33.3
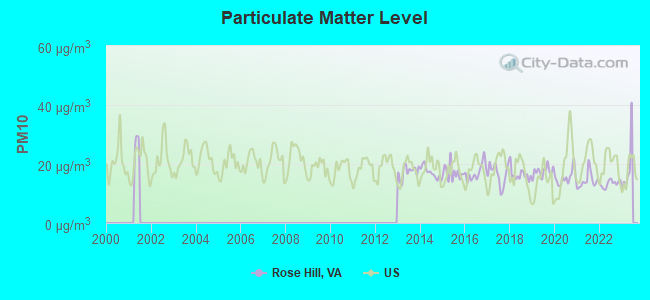
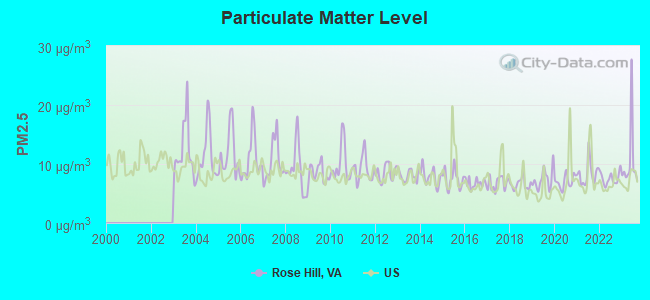
Particulate Matter (PM10) [µg/m3] level in 2022 was 13.4. This is significantly better than average.Closest monitor was 1.1 miles away from the city center.
City:
13.4
U.S.:
19.2
Particulate Matter (PM2.5) [µg/m3] level in 2023 was 10.5. This is worse than average.Closest monitor was 1.1 miles away from the city center.
City:
10.5
U.S.:
8.1
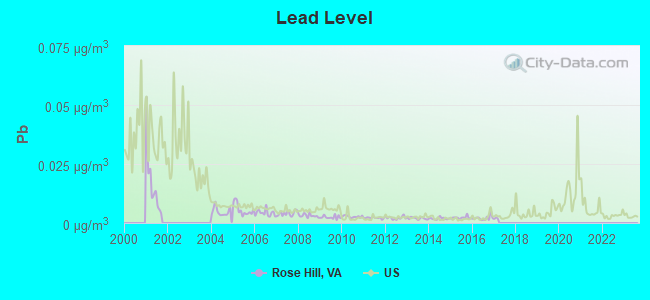
Lead (Pb) [µg/m3] level in 2016 was 0.00212. This is significantly better than average.Closest monitor was 1.1 miles away from the city center.
City:
0.00212
U.S.:
0.00931
Tornado activity:
Rose Hill-area historical tornado activity is above Virginia state average. It is 8% greater than the overall U.S. average.
On 4/28/2002, a category F4 (max. wind speeds 207-260 mph) tornado 17.0 miles away from the Rose Hill place center killed 3 peopleand injured 122 peopleand caused $124 million in damages.
On 9/5/1979, a category F3 (max. wind speeds 158-206 mph) tornado 1.7 miles away from the place center killed one personand injured 6 peopleand causedbetween $500,000 and $5,000,000 in damages.
Earthquake activity:
Rose Hill-area historical earthquake activity is significantly above Virginia state average. It is 56% smaller than the overall U.S. average.
On 8/23/2011 at 17:51:04, a magnitude 5.8 (5.8 MW, Depth: 3.7 mi, Class: Moderate, Intensity: VI - VII) earthquake occurred 75.6 miles away from the city center On 8/25/2011 at 05:07:52, a magnitude 4.5 (4.5 ML, Depth: 4.2 mi, Class: Light, Intensity: IV - V) earthquake occurred 74.6 miles away from the city center On 12/9/2003 at 20:59:18, a magnitude 4.5 (4.5 ML, Depth: 6.2 mi) earthquake occurred 88.5 miles away from Rose Hill center On 12/9/2003 at 20:59:14, a magnitude 4.5 (4.5 MB, 4.5 LG) earthquake occurred 93.7 miles away from the city center On 1/16/1994 at 01:49:16, a magnitude 4.6 (4.6 MB, 4.6 LG, Depth: 3.1 mi) earthquake occurred 120.9 miles away from the city center On 9/25/1998 at 19:52:52, a magnitude 5.2 (4.8 MB, 4.3 MS, 5.2 LG, 4.5 MW, Depth: 3.1 mi) earthquake occurred 255.2 miles away from Rose Hill center Magnitude types: regional Lg-wave magnitude (LG), body-wave magnitude (MB), local magnitude (ML), surface-wave magnitude (MS), moment magnitude (MW)
Natural disasters:
The number of natural disasters in Fairfax County (15) is near the US average (15). Major Disasters (Presidential) Declared: 12 Emergencies Declared: 3
Causes of natural disasters: Winter Storms: 5, Hurricanes: 4, Snowstorms: 3, Storms: 2, Tropical Storms: 2, Blizzard: 1, Flood: 1, Tornado: 1, Wind: 1, Other: 1 (Note: some incidents may be assigned to more than one category).
Hospitals and medical centers near Rose Hill:
ALEXANDRIA KIDNEY CENTER (Dialysis Facility, about 2 miles away; ALEXANDRIA, VA)
DEPENDABLE HOME HEALTH SERVICES (Home Health Center, about 2 miles away; ALEXANDRIA, VA)
DAVITA - ALEXANDRIA (Dialysis Facility, about 2 miles away; ALEXANDRIA, VA)
CDC - ALEXANDRIA (Dialysis Facility, about 3 miles away; ALEXANDRIA, VA)
1ST AMERICAN HOME HEALTH CARE SERVICES (Home Health Center, about 3 miles away; ALEXANDRIA, VA)
INOVA ALEXANDRIA HOSPITAL Acute Care Hospitals (about 3 miles away; ALEXANDRIA, VA)
DOMAIN MEDICAL HOME HEALTH AND STAFFING, INC (Home Health Center, about 3 miles away; ALEXANDRIA, VA)
Amtrak stations near Rose Hill:
3 miles: ALEXANDRIA (110 CALLAHAN DR.) . Services: ticket office, partially wheelchair accessible, enclosed waiting area, public restrooms, public payphones, vending machines, ATM, free short-term parking, free long-term parking, call for car rental service, call for taxi service, public transit connection.
Churches in Rose Hill include: Arthur Chapel (A), Sharon Chapel (B), Lighthouse Baptist Church (C), Christian Center Ministries (D), United Wesleyan Church (E), All Saints Sharon Chapel Episcopal Church (F), Cameron United Methodist Church (G), Rose Hill Baptist Church (H), United Church of Christ (I). Display/hide their locations on the map
Fairfax County has a predicted average indoor radon screening level greater than 4 pCi/L (pico curies per liter) - Highest Potential
Average household size:
This place:
2.8 people
Virginia:
2.5 people
Percentage of family households:
This place:
72.0%
Whole state:
67.0%
Percentage of households with unmarried partners:
This place:
4.7%
Whole state:
5.7%
Likely homosexual households (counted as self-reported same-sex unmarried-partner households)
Lesbian couples: 0.5% of all households
Gay men: 0.6% of all households
49 people in residential treatment centers for adults in 2010
10 people in group homes intended for adults in 2010
People in group quarters in Rose Hill in 2000:
8 people in homes or halfway houses for drug/alcohol abuse
5 people in other noninstitutional group quarters
4 people in nursing homes
Banks with branches in Rose Hill (2011 data):
Farmers and Miners Bank: Cumberland Gap Branch at 248 Station Creek Rd, branch established on 1984/10/17; Rose Hill Branch at 6489 Dr. Thomas Walker Rd, branch established on 1982/07/01. Info updated 2011/03/25: Bank assets: $129.1 mil, Deposits: $112.5 mil, headquarters in Pennington Gap, VA, positive income, 6 total offices
The Peoples Bank: Rose Hill Branch at 5499 Dr. Thomas Walker Road, branch established on 1952/12/17. Info updated 2011/11/08: Bank assets: $89.9 mil, Deposits: $81.3 mil, headquarters in Ewing, VA, negative income in the last year, Commercial Lending Specialization, 5 total offices
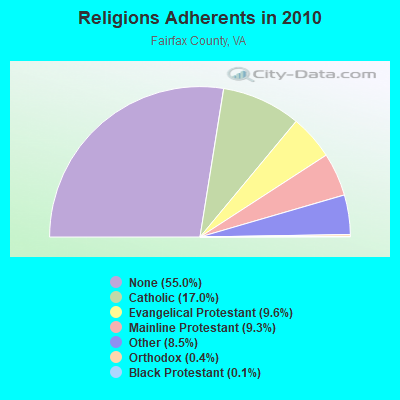
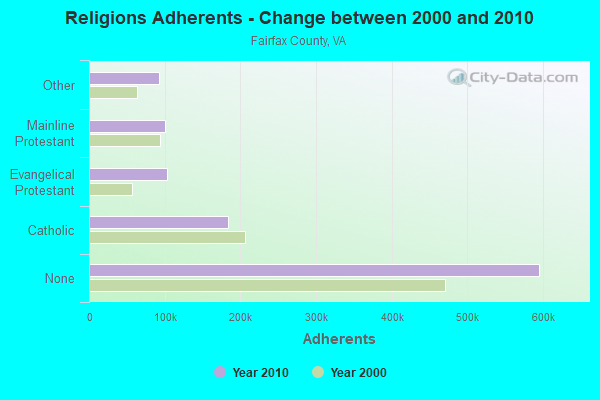
Religion statistics for Rose Hill, VA (based on Fairfax County data)
Religion
Adherents
Congregations
Catholic
184,183
29
Evangelical Protestant
103,522
316
Mainline Protestant
100,525
146
Other
91,925
119
Orthodox
4,694
8
Black Protestant
1,509
9
None
595,368
-
Source: Clifford Grammich, Kirk Hadaway, Richard Houseal, Dale E.Jones, Alexei Krindatch, Richie Stanley and Richard H.Taylor. 2012. 2010 U.S.Religion Census: Religious Congregations & Membership Study. Association of Statisticians of American Religious Bodies. Jones, Dale E., et al. 2002. Congregations and Membership in the United States 2000. Nashville, TN: Glenmary Research Center. Graphs represent county-level data
Aircraft: CESSNA 150G (Category: Land, Seats: 2, Weight: Up to 12,499 Pounds, Speed: 90 mph), Engine: CONT MOTOR 0-200 SERIES (100 HP) (4 Cycle) N-Number: 3390J, N3390J, N-3390J, Serial Number: 15066090, Year manufactured: 1967, Airworthiness Date: 02/27/1967, Certificate Issue Date: 08/05/1991 Registrant (Individual): Dennis C Vandyke, Po Box 86, Rose Hill, VA 24281
Aircraft: PIPER PA-28-140 (Category: Land, Seats: 4, Weight: Up to 12,499 Pounds, Speed: 107 mph), Engine: LYCOMING 0-320 SERIES (180 HP) (Reciprocating) N-Number: 55270, N55270, N-55270, Serial Number: 28-7325356, Year manufactured: 1973, Airworthiness Date: 03/24/1973, Certificate Issue Date: 12/05/2011 Registrant (Individual): Jason A Mcconnell, 1874 Boones Path Rd, Rose Hill, VA 24281
Home Mortgage Disclosure Act Aggregated Statistics For Year 2009 (Based on 2 full and 3 partial tracts)
A) FHA, FSA/RHS & VA Home Purchase Loans
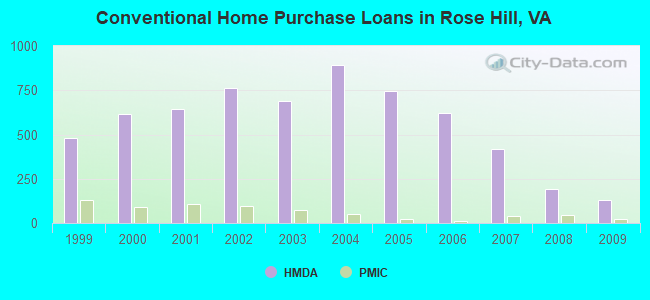
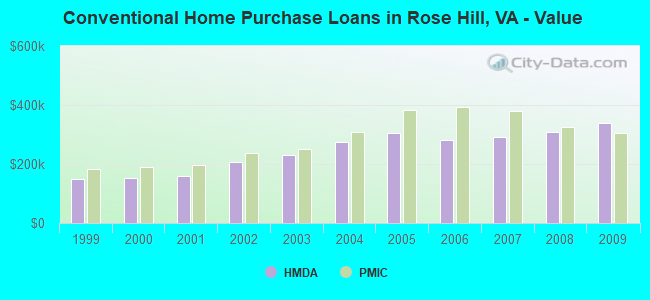
B) Conventional Home Purchase Loans
C) Refinancings
D) Home Improvement Loans
F) Non-occupant Loans on < 5 Family Dwellings (A B C & D)
Number
Average Value
Number
Average Value
Number
Average Value
Number
Average Value
Number
Average Value
LOANS ORIGINATED
161
$371,498
132
$339,609
692
$301,606
26
$127,901
42
$249,293
APPLICATIONS APPROVED, NOT ACCEPTED
4
$353,030
5
$300,152
44
$317,967
4
$167,792
1
$175,270
APPLICATIONS DENIED
12
$334,704
14
$210,134
200
$341,402
16
$75,463
26
$222,835
APPLICATIONS WITHDRAWN
22
$317,297
21
$262,716
169
$326,190
7
$92,451
11
$235,889
FILES CLOSED FOR INCOMPLETENESS
0
$0
2
$150,430
41
$312,807
2
$154,640
2
$160,145
Aggregated Statistics For Year 2008 (Based on 2 full and 3 partial tracts)
A) FHA, FSA/RHS & VA Home Purchase Loans
B) Conventional Home Purchase Loans
C) Refinancings
D) Home Improvement Loans
F) Non-occupant Loans on < 5 Family Dwellings (A B C & D)
G) Loans On Manufactured Home Dwelling (A B C & D)
Number
Average Value
Number
Average Value
Number
Average Value
Number
Average Value
Number
Average Value
Number
Average Value
LOANS ORIGINATED
129
$362,933
192
$308,467
280
$276,185
33
$137,562
44
$247,843
0
$0
APPLICATIONS APPROVED, NOT ACCEPTED
7
$380,239
19
$340,107
60
$292,761
7
$60,614
6
$305,347
0
$0
APPLICATIONS DENIED
14
$369,621
25
$301,014
171
$340,180
22
$84,430
8
$255,280
3
$81,237
APPLICATIONS WITHDRAWN
13
$352,912
37
$289,491
110
$358,828
4
$66,098
6
$251,238
0
$0
FILES CLOSED FOR INCOMPLETENESS
1
$200,660
4
$361,095
21
$284,452
3
$187,793
3
$105,937
0
$0
Aggregated Statistics For Year 2007 (Based on 2 full and 3 partial tracts)
A) FHA, FSA/RHS & VA Home Purchase Loans
B) Conventional Home Purchase Loans
C) Refinancings
D) Home Improvement Loans
E) Loans on Dwellings For 5+ Families
F) Non-occupant Loans on < 5 Family Dwellings (A B C & D)
G) Loans On Manufactured Home Dwelling (A B C & D)
Number
Average Value
Number
Average Value
Number
Average Value
Number
Average Value
Number
Average Value
Number
Average Value
Number
Average Value
LOANS ORIGINATED
11
$333,990
416
$291,917
438
$279,806
68
$128,804
1
$22,490,000
42
$274,906
0
$0
APPLICATIONS APPROVED, NOT ACCEPTED
2
$268,375
31
$291,841
79
$347,856
15
$154,341
0
$0
8
$322,061
0
$0
APPLICATIONS DENIED
2
$358,545
58
$321,925
251
$339,698
36
$122,163
0
$0
21
$370,206
2
$94,500
APPLICATIONS WITHDRAWN
1
$302,020
41
$309,041
135
$326,963
9
$271,154
0
$0
9
$353,761
0
$0
FILES CLOSED FOR INCOMPLETENESS
0
$0
5
$416,610
30
$359,277
3
$173,203
0
$0
2
$406,435
0
$0
Aggregated Statistics For Year 2006 (Based on 2 full and 3 partial tracts)
A) FHA, FSA/RHS & VA Home Purchase Loans
B) Conventional Home Purchase Loans
C) Refinancings
D) Home Improvement Loans
F) Non-occupant Loans on < 5 Family Dwellings (A B C & D)
G) Loans On Manufactured Home Dwelling (A B C & D)
Number
Average Value
Number
Average Value
Number
Average Value
Number
Average Value
Number
Average Value
Number
Average Value
LOANS ORIGINATED
5
$341,554
621
$280,325
617
$292,398
97
$128,997
51
$273,378
0
$0
APPLICATIONS APPROVED, NOT ACCEPTED
1
$208,440
30
$291,225
95
$292,717
24
$79,002
5
$220,502
0
$0
APPLICATIONS DENIED
0
$0
80
$294,279
221
$319,732
36
$147,389
15
$301,363
1
$8,540
APPLICATIONS WITHDRAWN
1
$349,600
44
$288,206
171
$347,367
21
$308,444
11
$280,096
0
$0
FILES CLOSED FOR INCOMPLETENESS
0
$0
10
$369,483
33
$310,777
5
$216,012
3
$342,427
0
$0
Aggregated Statistics For Year 2005 (Based on 2 full and 3 partial tracts)
A) FHA, FSA/RHS & VA Home Purchase Loans
B) Conventional Home Purchase Loans
C) Refinancings
D) Home Improvement Loans
F) Non-occupant Loans on < 5 Family Dwellings (A B C & D)
G) Loans On Manufactured Home Dwelling (A B C & D)
Number
Average Value
Number
Average Value
Number
Average Value
Number
Average Value
Number
Average Value
Number
Average Value
LOANS ORIGINATED
3
$276,080
744
$306,696
891
$289,876
108
$139,967
102
$288,772
0
$0
APPLICATIONS APPROVED, NOT ACCEPTED
0
$0
60
$283,026
118
$275,536
16
$142,775
7
$244,096
1
$56,000
APPLICATIONS DENIED
1
$321,470
107
$306,873
218
$288,464
45
$140,771
23
$278,204
0
$0
APPLICATIONS WITHDRAWN
0
$0
49
$313,170
184
$259,804
24
$157,652
14
$224,729
0
$0
FILES CLOSED FOR INCOMPLETENESS
0
$0
11
$275,495
45
$302,626
6
$151,685
3
$317,233
0
$0
Aggregated Statistics For Year 2004 (Based on 2 full and 3 partial tracts)
A) FHA, FSA/RHS & VA Home Purchase Loans
B) Conventional Home Purchase Loans
C) Refinancings
D) Home Improvement Loans
F) Non-occupant Loans on < 5 Family Dwellings (A B C & D)
G) Loans On Manufactured Home Dwelling (A B C & D)
Number
Average Value
Number
Average Value
Number
Average Value
Number
Average Value
Number
Average Value
Number
Average Value
LOANS ORIGINATED
6
$240,147
890
$275,651
946
$242,917
88
$105,230
94
$218,197
0
$0
APPLICATIONS APPROVED, NOT ACCEPTED
0
$0
49
$239,424
117
$252,333
11
$47,327
9
$213,421
0
$0
APPLICATIONS DENIED
0
$0
92
$287,541
211
$250,485
39
$80,615
17
$283,052
1
$67,290
APPLICATIONS WITHDRAWN
0
$0
69
$280,318
177
$234,861
20
$140,437
12
$191,012
0
$0
FILES CLOSED FOR INCOMPLETENESS
1
$307,850
17
$421,226
38
$239,686
6
$93,117
2
$192,500
0
$0
Aggregated Statistics For Year 2003 (Based on 2 full and 3 partial tracts)
A) FHA, FSA/RHS & VA Home Purchase Loans
B) Conventional Home Purchase Loans
C) Refinancings
D) Home Improvement Loans
F) Non-occupant Loans on < 5 Family Dwellings (A B C & D)
Number
Average Value
Number
Average Value
Number
Average Value
Number
Average Value
Number
Average Value
LOANS ORIGINATED
35
$221,068
691
$228,836
2,415
$200,837
51
$48,610
133
$156,533
APPLICATIONS APPROVED, NOT ACCEPTED
1
$165,500
48
$239,856
252
$197,589
12
$27,156
19
$183,964
APPLICATIONS DENIED
0
$0
52
$232,813
282
$229,999
29
$44,060
17
$167,432
APPLICATIONS WITHDRAWN
6
$189,338
60
$285,917
226
$208,184
6
$67,058
18
$174,101
FILES CLOSED FOR INCOMPLETENESS
0
$0
17
$246,134
80
$208,664
3
$41,437
5
$168,858
Aggregated Statistics For Year 2002 (Based on 2 full and 3 partial tracts)
A) FHA, FSA/RHS & VA Home Purchase Loans
B) Conventional Home Purchase Loans
C) Refinancings
D) Home Improvement Loans
F) Non-occupant Loans on < 5 Family Dwellings (A B C & D)
Number
Average Value
Number
Average Value
Number
Average Value
Number
Average Value
Number
Average Value
LOANS ORIGINATED
70
$193,778
764
$206,971
1,499
$189,298
61
$31,197
82
$139,420
APPLICATIONS APPROVED, NOT ACCEPTED
1
$296,230
42
$233,046
134
$176,829
21
$44,950
6
$127,122
APPLICATIONS DENIED
2
$189,235
35
$201,887
205
$192,773
30
$27,815
6
$142,797
APPLICATIONS WITHDRAWN
3
$203,177
67
$269,718
170
$175,301
17
$40,252
11
$132,844
FILES CLOSED FOR INCOMPLETENESS
0
$0
7
$137,401
42
$192,816
1
$47,630
1
$215,070
Aggregated Statistics For Year 2001 (Based on 2 full and 3 partial tracts)
A) FHA, FSA/RHS & VA Home Purchase Loans
B) Conventional Home Purchase Loans
C) Refinancings
D) Home Improvement Loans
F) Non-occupant Loans on < 5 Family Dwellings (A B C & D)
Number
Average Value
Number
Average Value
Number
Average Value
Number
Average Value
Number
Average Value
LOANS ORIGINATED
133
$170,770
643
$160,395
1,011
$170,309
70
$33,233
46
$124,793
APPLICATIONS APPROVED, NOT ACCEPTED
2
$169,165
36
$108,210
77
$130,834
19
$37,201
0
$0
APPLICATIONS DENIED
1
$248,510
31
$156,524
133
$117,514
40
$30,073
8
$94,755
APPLICATIONS WITHDRAWN
5
$161,134
52
$199,580
147
$141,665
20
$32,752
6
$117,568
FILES CLOSED FOR INCOMPLETENESS
1
$252,040
8
$203,430
40
$154,431
3
$57,037
3
$99,147
Aggregated Statistics For Year 2000 (Based on 2 full and 3 partial tracts)
A) FHA, FSA/RHS & VA Home Purchase Loans
B) Conventional Home Purchase Loans
C) Refinancings
D) Home Improvement Loans
F) Non-occupant Loans on < 5 Family Dwellings (A B C & D)
Number
Average Value
Number
Average Value
Number
Average Value
Number
Average Value
Number
Average Value
LOANS ORIGINATED
161
$158,585
616
$152,916
146
$120,138
59
$29,543
21
$107,867
APPLICATIONS APPROVED, NOT ACCEPTED
4
$164,975
40
$100,418
25
$103,071
21
$28,558
3
$123,097
APPLICATIONS DENIED
8
$155,632
37
$171,368
90
$91,370
44
$30,209
6
$48,808
APPLICATIONS WITHDRAWN
12
$170,110
56
$178,523
53
$84,752
12
$58,981
2
$85,850
FILES CLOSED FOR INCOMPLETENESS
2
$160,985
4
$161,540
8
$133,872
3
$35,907
0
$0
Aggregated Statistics For Year 1999 (Based on 2 full and 3 partial tracts)
A) FHA, FSA/RHS & VA Home Purchase Loans
B) Conventional Home Purchase Loans
C) Refinancings
D) Home Improvement Loans
F) Non-occupant Loans on < 5 Family Dwellings (A B C & D)
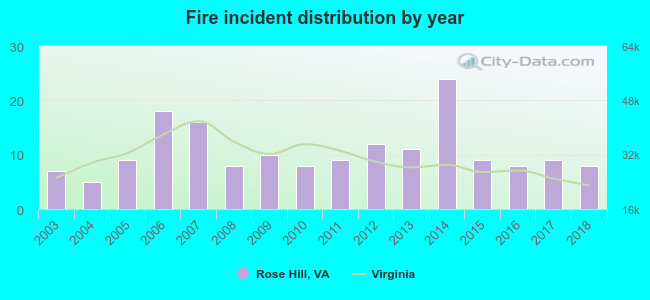
2003 - 2018 National Fire Incident Reporting System (NFIRS) incidents
According to the data from the years 2003 - 2018 the average number of fires per year is 11. The highest number of reported fire incidents - 24 took place in 2014, and the least - 5 in 2004. The data has an increasing trend.
When looking into fire subcategories, the most incidents belonged to: Structure Fires (49.7%), and Outside Fires (38.6%).
Fire incident types reported to NFIRS in Rose Hill, VA


 Recent articles from our blog. Our writers, many of them Ph.D. graduates or candidates, create easy-to-read articles on a wide variety of topics.

 (2.8 miles
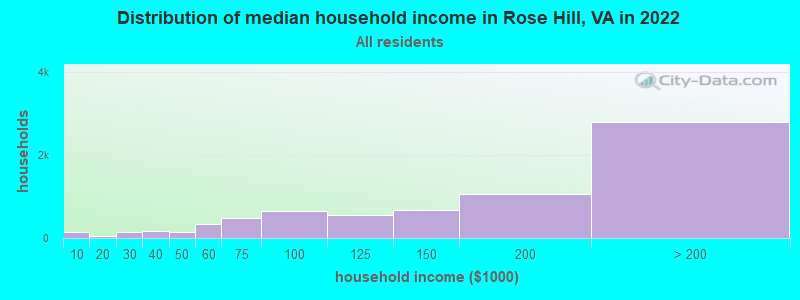

 According to the data from the years 2003 - 2018 the average number of fires per year is 11. The highest number of reported fire incidents - 24 took place in 2014, and the least - 5 in 2004. The data has an increasing trend.
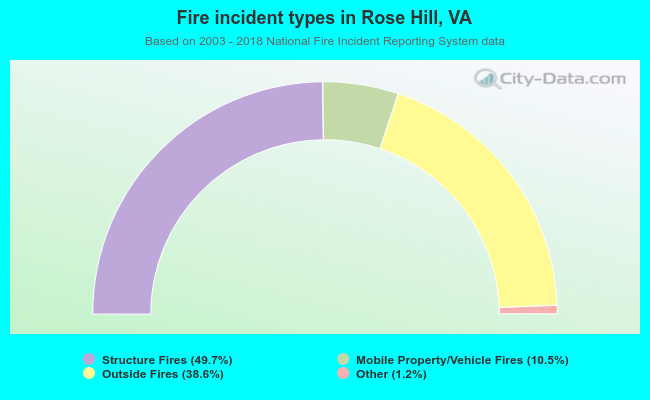 When looking into fire subcategories, the most incidents belonged to: Structure Fires (49.7%), and Outside Fires (38.6%).