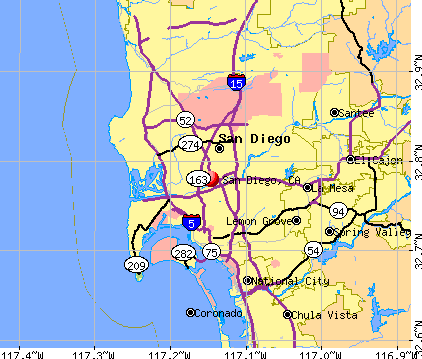
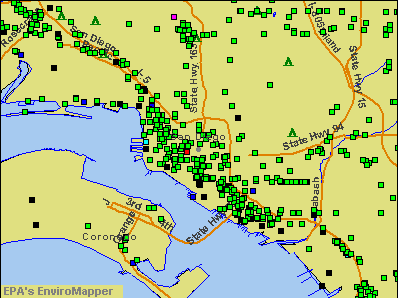
San Diego, California
San Diego: San Diego 2005
San Diego: Scenic Trinidad Coast
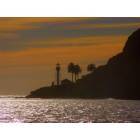
San Diego: Point Loma at sun set
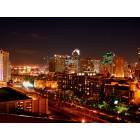
San Diego: San Diego skyline at night
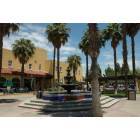
San Diego
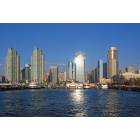
San Diego: San Diego skyline from the Coronado Ferry
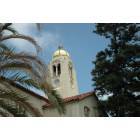
San Diego: San Diego
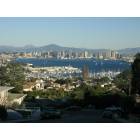
San Diego: San Diego
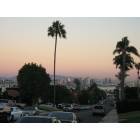
San Diego: Sunset from Point Loma
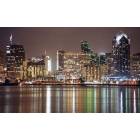
San Diego: Night time
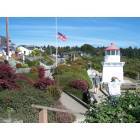
San Diego: Quaint Village of Trinidad
- see
235
more - add
your
Submit your own pictures of this city and show them to the world
- OSM Map
- General Map
- Google Map
- MSN Map
Population change since 2000: +12.9%
| Males: 703,900 | |
| Females: 677,262 |
| Median resident age: | 36.2 years |
| California median age: | 37.9 years |
Zip codes: 92037, 92101, 92102, 92103, 92104, 92105, 92106, 92107, 92108, 92109, 92110, 92111, 92113, 92114, 92116, 92117, 92119, 92122, 92123, 92124, 92126, 92129, 92132, 92134, 92140, 92145, 92147, 92173.
San Diego Zip Code Map| San Diego: | $100,010 |
| CA: | $91,551 |
Estimated per capita income in 2022: $52,701 (it was $23,609 in 2000)
San Diego city income, earnings, and wages data
Estimated median house or condo value in 2022: $905,300 (it was $220,000 in 2000)
| San Diego: | $905,300 |
| CA: | $715,900 |
Mean prices in 2022: all housing units: over $1,000,000; detached houses: over $1,000,000; townhouses or other attached units: $822,615; in 2-unit structures: $967,724; in 3-to-4-unit structures: over $1,000,000; in 5-or-more-unit structures: $704,051; mobile homes: $134,985
Median gross rent in 2022: $2,128.
(9.1% for White Non-Hispanic residents, 15.6% for Black residents, 14.7% for Hispanic or Latino residents, 18.6% for American Indian residents, 15.3% for Native Hawaiian and other Pacific Islander residents, 14.6% for other race residents, 13.2% for two or more races residents)
Detailed information about poverty and poor residents in San Diego, CA

- 548,68839.7%White alone
- 418,10630.3%Hispanic
- 244,70617.7%Asian alone
- 79,6855.8%Two or more races
- 73,8685.3%Black alone
- 8,4460.6%Other race alone
- 5,9310.4%Native Hawaiian and Other
Pacific Islander alone - 1,7520.1%American Indian alone
According to our research of California and other state lists, there were 1,334 registered sex offenders living in San Diego, California as of April 27, 2024.
The ratio of all residents to sex offenders in San Diego is 1,054 to 1.
The ratio of registered sex offenders to all residents in this city is lower than the state average.
The City-Data.com crime index weighs serious crimes and violent crimes more heavily. Higher means more crime, U.S. average is 246.1. It adjusts for the number of visitors and daily workers commuting into cities.
- means the value is smaller than the state average.- means the value is about the same as the state average.
- means the value is bigger than the state average.
- means the value is much bigger than the state average.

Crime rate in San Diego detailed stats: murders, rapes, robberies, assaults, burglaries, thefts, arson
Full-time law enforcement employees in 2021, including police officers: 2,394 (1,877 officers - 1,571 male; 306 female).
| Officers per 1,000 residents here: | 1.31 |
| California average: | 2.30 |

Latest news from San Diego, CA collected exclusively by city-data.com from local newspapers, TV, and radio stations
Ancestries: German (4.0%), English (3.6%), Irish (3.3%), American (3.0%), Italian (2.2%), European (1.9%).
Current Local Time: PST time zone
Elevation: 40 feet
Land area: 324.3 square miles.
Population density: 4,258 people per square mile (average).
339,576 residents are foreign born (12.1% Asia, 8.7% Latin America).
| This city: | 24.6% |
| California: | 26.7% |
Median real estate property taxes paid for housing units with mortgages in 2022: $6,285 (0.7%)
Median real estate property taxes paid for housing units with no mortgage in 2022: $3,991 (0.5%)
Nearest cities:
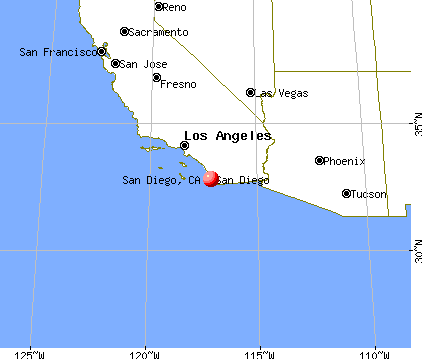
Latitude: 32.78 N, Longitude: 117.15 W
Daytime population change due to commuting: +172,431 (+12.5%)
Workers who live and work in this city: 578,759 (78.7%)
Area code commonly used in this area: 619


Detailed articles:
- San Diego: Introduction
- San Diego Basic Facts
- San Diego: Communications
- San Diego: Convention Facilities
- San Diego: Economy
- San Diego: Education and Research
- San Diego: Geography and Climate
- San Diego: Health Care
- San Diego: History
- San Diego: Municipal Government
- San Diego: Population Profile
- San Diego: Recreation
- San Diego: Transportation
San Diego tourist attractions:
- Andaz San Diego (Ivy Hotel) - San Diego, California - Boutique Hotel in the Gaslamp Quarter
- Balboa Park - San Diego, California - America's Largest Urban Cultural Park
- Belmont Park - San Diego, California - historical and traditional theme park
- Birch Aquarium at Scripps Institute of Oceanography in San Diego, California
- Cabrillo National Monument in California is a Lesson in History
- Coronado Beach, San Diego, California - San Diego, CA -Big Crowds Visit Biggest Beach on Peninsula Just Outside of Downtown
- Coronado Bridge - San Diego, California - Award-Winning, Landmark Bridge
- Fashion Valley Shopping Center - San Diego, California - San Diego's Leading Outdoor Mall
- Gaslamp Quarter - San Diego, California - Downtown Shopping, Dining and Entertainment
- The Grand Del Mar Hotel - San Diego, California - Award-Winning Lodgings with Mediterranean Elegance
- Hard Rock Hotel San Diego - San Diego, California - Lodgings Rock and Roll in the Gaslamp Quarter
- Hotel Solamar - San Diego, California - Luxury Hotel in the Gaslamp Quarter
- La Jolla Shores Hotel, CA
- Mingei International Museum, San Diego, CA
- Mission Beach - San Diego, California - San Diego's Most Popular Public Beach
- Bristol Hotel
- Comfort Inn Gaslamp/ Convention Center
- Town and Country Resort Hotel
- Sommerset Suites Hotel
- Beach Haven Inn
- Park Manor Suites
- Staybridge Suites San Diego - Sorrento Mesa
- 4th & B
- Alcazar Garden
- Casa del Rey Moro African Museum
- Casa de Machado y Stewart
- Casa De Balboa
- Casa de Estudillo
- California Department of Fish and Game
- California Ballet Company
- Cabrillo Tide Pools
- Botanical Building and Lily Pond
- Marriott Marina San Diego
- Westin Gaslamp Quarter, San Diego
- Crystal Pier Hotel & Cottages
- Centro Cultural de la Raze
- Children's Zoo
- Chula Vista Nature Center
- Downtown San Diego
- Giant Dipper Roller Coaster
- Ghostly Tours in History
- Hilton San Diego Bayfront
- Se San Diego
- Hillcrest
- HMCS Yukon
- El Prado
- Embarcadero
- Fisherman's Landing
- Fort Rosecrans Cemetery
- Claire de Lune Coffee Lounge
- Cleveland National Forest
- Club Sevilla
- Coronado Museum of History and Art
- Desert Garden
- Diversionary Theatre
- Dog Beach
- Garnet Avenue
- Girard Avenue and Prospect Street
- Lamb's Players Theatre
- Kroc Center Ice
- Lips
- Rancho Bernardo Inn
- Marston House Museum
- Mason Street School
- Marissa Dive Charters
- Maritime Museum of San Diego
- Marine Corps Command Museum
- Marie Hitchcock Puppet Theater
- Manchester Grand Hyatt San Diego
- New Americans Museum
- Noble Canyon
- Omni San Diego Hotel
- San Diego Marriott Gaslamp Quarter
- Hilton San Diego Gaslamp Quarter
- Miramar Reservoir
- Miramar Speed Circuit
- Mission Bay Park
- Mission Beach Boardwalk
- Mission San Diego de Alcala
- Mission Trails Regional Park
- Mission Valley Family YMCA
- Morley Field
- Mormon Battalion Historic Site
- Johnson House
- Junipero Serra Museum
- Kate Sessions Memorial Park
- Kathy's Freak Farm
- Kickers
- Knott's Soak City USA
- Museum of History and Art
- Museum of Photographic Arts
- Mystery Café Dinner Theatre San Diego
- National Comedy Theatre
- Residence Inn San Diego Downtown
- House of Hospitality
- House of Ukraine - International Cottages of the House of Pacific Relations
- Hyatt Regency Mission Bay
- Inez Grant Parker Memorial Rose Garden
- Japanese Friendship Garden
- Mount Soledad
- Museum of Contemporary Art San Diego
- Another Side of San Diego Tours
- Bayside Trail
- Bazaar del Mundo
- Shamu's Harbor World
- Best Western Blue Sea Lodge
- Ocean Beach
- Embassy Suites Hotel San Diego Bay- Downtown
- San Diego Air and Space Museum
- San Diego Archaeological Center
- San Diego Automotive Museum
- San Diego Bay Walk
- San Diego Chinese Historical Museum
- San Diego Civic Theatre
- San Diego Convention Center
- San Diego Family Fun Center
- San Diego Hall of Champions Sports Museum
- San Diego Historical Society Museum
- San Diego Junior Theatre
- San Diego Miniature Railroad and Carousel
- San Diego Model Railroad Museum
- San Diego Mormon Temple
- San Diego Museum of Art
- San Diego Opera
- San Diego Police Museum
- San Diego Repertory Theatre
- San Diego Sports Arena
- San Diego Surf School
- San Diego Symphony
- San Diego Wine and Culinary Center
- San Juan Trail
- Sculpture Garden
- SDAI Museum of the Living Artist
- Seeley Stables
- The Horton Grand Hotel and Suites
- Westin San Diego
- San Diego Deep Sea
- Plaza del Pasado
- Presidio Park
- Razor Point and Beach Trail Loop
- Reuben H. Fleet Science Center
- Point Loma
- Riverwalk Golf Club-Friars Course
- Catamaran Resort Hotel
- Hilton La Jolla Torrey Pines
- Rancho Bernardo Inn Golf Course and Spa
- Palm Canyon
- Old Globe Theatre
- Old Point Loma Lighthouse
- Old Town San Diego State Historic Park
- Osprey Charters
- The Promenade at Pacific Beach
- Ocean Park Inn
- Bahia Resort Hotel
- Hyatt Regency La Jolla
- Sheraton San Diego Hotel and Marina
- Timken Museum of Art
- Torrey Pines City Park Beach
- Best Western Island Palms Hotel & Marina
- Whaley House Museum
- William Heath Davis House
- Windansea Beach
- Winston's Beach Club
- Courtyard by Marriott San Diego Downtown
- San Diego Marriott Del Mar
- Stadium Golf Center and Batting Cages
- The Bitter End
- The Dana on Mission Bay
- The Firehouse Museum
- The New Children's Museum
- The Onyx Room
- Star of India
- The Beach Cottages
- Wells Fargo Museum
- San Diego Marriott La Jolla
- Wave House
- Residence Inn San Diego La Jolla
- The Inn at Sunset Cliffs
- Hilton San Diego Resort & Spa
- Sheraton Harbor Island Hotel Jogging Course
- Shout House
- South Bay Drive-In
- South Bay Marina Biological Study Area
- Spanish Landing
- Spreckels Organ Pavilion
- Spreckels Theater
- Spruce Street Footbridge
- Villa Montezuma Museum
- Visitor Information Center
- Twiggs
- United Nations Building
- University of San Diego USD
- USS Midway Museum
- Rose Canyon Hiking Park
- Humphreys Half Moon Inn & Suites
- Salk Institute
- Homewood Suites San Diego Airport
- Hotel Indigo San Diego Gaslamp Quarter
- San Diego Marriott Mission Valley
- Smith Ranch - Julian Train & Gold Mine
- Gaslamp Plaza Suites
- Residence Inn San Diego Mission Valley
- Homewood Suites San Diego
- Sheraton Suites San Diego
- Diamond Head Inn
- Residence Inn San Diego Central
- Bay Club Hotel & Marina
- Doubletree Hotel San Diego Downtown
- Pacific Beach - San Diego, California - Lively Coastal Community in San Diego
- Pacific Terrace Hotel - San Diego, California - Upscale Lodgings Facing the Ocean
- Paradise Point Resort & Spa - San Diego, California - San Diego's Tropical Island Resort
- PETCO Park in San Diego, California
- Qualcomm Stadium - San Diego, California - Home to the NFL's San Diego Chargers
- San Diego Zoo - San Diego, California - one of the world's largest and most popular zoos
- San Diego Air & Space Museum - San Diego, California - California's Official Aerospace Museum
- San Diego Aircraft Carrier Museum - San Diego, California - Exhibits Aboard the USS Midway
- San Diego International Airport - San Diego CA San Diego International Airport Flights
- San Diego Maritime Museum - San Diego, California - Collection of Historic Ships and Submarines
- San Diego Museum of Man - San Diego, California - Anthropology and Archaeology on Display
- San Diego Natural History Museum - San Diego, California - Exhibits of the Natural World, plus 3D Movies
- Seaport Village - San Diego, California - Waterfront Shopping, Dining and Entertainment
- SeaWorld San Diego - San Diego, California - large theme park and aquarium
- Spanish Village Art Center - San Diego, California - Colorful Community of Artists and Galleries
- Surfer Beach Hotel - San Diego, California - Unpretentious Beachside Accommodations
- The Keating Hotel - San Diego, California - Luxury Hotel Lofts in the Gaslamp Quarter
- The US Grant Hotel - San Diego, California - Historic Luxury Hotel in the Gaslamp Quarter
- The Westgate Hotel - San Diego, California - Euro-style Hotel in the Gaslamp District
- Tower23 Hotel - San Diego, California - Luxury Boutique Hotel at Pacific Beach
- Westfield Horton Plaza - San Diego, California - Major Downtown Shopping Mall
- W San Diego - San Diego, California - Lifestyle Lodgings in the Downtown Area
San Diego, California accommodation & food services, waste management - Economy and Business Data
Single-family new house construction building permits:
- 2022: 506 buildings, average cost: $324,300
- 2021: 539 buildings, average cost: $305,000
- 2020: 445 buildings, average cost: $291,000
- 2019: 580 buildings, average cost: $351,600
- 2018: 774 buildings, average cost: $310,800
- 2017: 1138 buildings, average cost: $341,000
- 2016: 823 buildings, average cost: $303,400
- 2015: 1325 buildings, average cost: $329,400
- 2014: 712 buildings, average cost: $345,900
- 2013: 821 buildings, average cost: $366,800
- 2012: 535 buildings, average cost: $372,900
- 2011: 451 buildings, average cost: $349,000
- 2010: 557 buildings, average cost: $255,900
- 2009: 374 buildings, average cost: $289,000
- 2008: 641 buildings, average cost: $323,700
- 2007: 748 buildings, average cost: $196,200
- 2006: 815 buildings, average cost: $184,800
- 2005: 1059 buildings, average cost: $175,800
- 2004: 1301 buildings, average cost: $167,100
- 2003: 1926 buildings, average cost: $190,500
- 2002: 2588 buildings, average cost: $205,900
- 2001: 2209 buildings, average cost: $254,400
- 2000: 2014 buildings, average cost: $261,300
- 1999: 2233 buildings, average cost: $199,900
- 1998: 2819 buildings, average cost: $194,000
- 1997: 2814 buildings, average cost: $183,500


| Here: | 4.2% |
| California: | 5.1% |


Population change in the 1990s: +105,611 (+9.4%).

- Professional, scientific, technical services (14.5%)
- Health care (11.3%)
- Educational services (9.2%)
- Accommodation & food services (8.4%)
- Construction (4.8%)
- Finance & insurance (4.2%)
- Public administration (4.1%)

- Professional, scientific, technical services (15.6%)
- Accommodation & food services (8.2%)
- Construction (7.8%)
- Health care (6.6%)
- Educational services (5.9%)
- Administrative & support & waste management services (4.5%)
- Public administration (4.5%)

- Health care (16.7%)
- Professional, scientific, technical services (13.3%)
- Educational services (13.0%)
- Accommodation & food services (8.6%)
- Social assistance (4.1%)
- Finance & insurance (4.0%)
- Public administration (3.7%)

- Cooks and food preparation workers (7.0%)
- Other management occupations, except farmers and farm managers (6.8%)
- Computer specialists (5.7%)
- Engineers (3.0%)
- Registered nurses (2.4%)
- Building and grounds cleaning and maintenance occupations (2.3%)
- Life and physical scientists (2.1%)

- Computer specialists (8.3%)
- Other management occupations, except farmers and farm managers (7.4%)
- Cooks and food preparation workers (6.8%)
- Engineers (4.8%)
- Laborers and material movers, hand (2.8%)
- Building and grounds cleaning and maintenance occupations (2.7%)
- Top executives (2.5%)

- Cooks and food preparation workers (7.2%)
- Other management occupations, except farmers and farm managers (6.1%)
- Registered nurses (4.2%)
- Nursing, psychiatric, and home health aides (3.6%)
- Computer specialists (2.6%)
- Retail sales workers, except cashiers (2.5%)
- Life and physical scientists (2.4%)
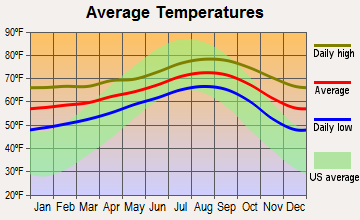
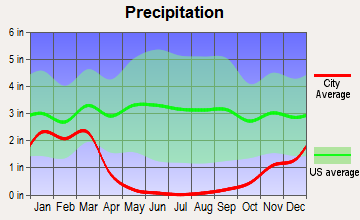
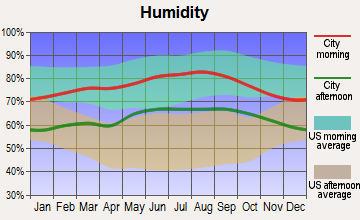
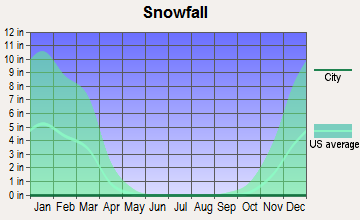
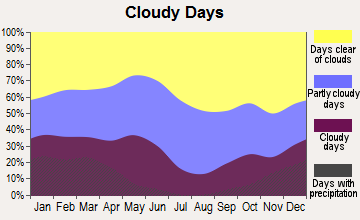
Average climate in San Diego, California
Based on data reported by over 4,000 weather stations


|
|
(lower is better)

Air Quality Index (AQI) level in 2022 was 106. This is significantly worse than average.
| City: | 106 |
| U.S.: | 73 |

Carbon Monoxide (CO) [ppm] level in 2022 was 0.291. This is about average. Closest monitor was 3.6 miles away from the city center.
| City: | 0.291 |
| U.S.: | 0.251 |

Nitrogen Dioxide (NO2) [ppb] level in 2022 was 9.45. This is significantly worse than average. Closest monitor was 1.8 miles away from the city center.
| City: | 9.45 |
| U.S.: | 5.11 |

Sulfur Dioxide (SO2) [ppb] level in 2022 was 0.0589. This is significantly better than average. Closest monitor was 3.6 miles away from the city center.
| City: | 0.0589 |
| U.S.: | 1.5147 |

Ozone [ppb] level in 2022 was 30.9. This is about average. Closest monitor was 3.6 miles away from the city center.
| City: | 30.9 |
| U.S.: | 33.3 |

Particulate Matter (PM10) [µg/m3] level in 2022 was 23.7. This is worse than average. Closest monitor was 4.1 miles away from the city center.
| City: | 23.7 |
| U.S.: | 19.2 |

Particulate Matter (PM2.5) [µg/m3] level in 2022 was 10.1. This is worse than average. Closest monitor was 4.1 miles away from the city center.
| City: | 10.1 |
| U.S.: | 8.1 |

Lead (Pb) [µg/m3] level in 2023 was 0.00587. This is significantly better than average. Closest monitor was 3.6 miles away from the city center.
| City: | 0.00587 |
| U.S.: | 0.00931 |
Earthquake activity:
San Diego-area historical earthquake activity is significantly above California state average. It is 5735% greater than the overall U.S. average.On 6/28/1992 at 11:57:34, a magnitude 7.6 (6.2 MB, 7.6 MS, 7.3 MW, Depth: 0.7 mi, Class: Major, Intensity: VIII - XII) earthquake occurred 103.4 miles away from the city center, causing 3 deaths (1 shaking deaths, 2 other deaths) and 400 injuries, causing $100,000,000 total damage and $40,000,000 insured losses
On 7/21/1952 at 11:52:14, a magnitude 7.7 (7.7 UK) earthquake occurred 186.8 miles away from San Diego center, causing $50,000,000 total damage
On 10/16/1999 at 09:46:44, a magnitude 7.4 (6.3 MB, 7.4 MS, 7.2 MW, 7.3 ML) earthquake occurred 126.8 miles away from San Diego center
On 5/19/1940 at 04:36:40, a magnitude 7.2 (7.2 UK) earthquake occurred 89.5 miles away from the city center, causing $33,000,000 total damage
On 12/31/1934 at 18:45:56, a magnitude 7.1 (7.1 UK) earthquake occurred 80.9 miles away from San Diego center
On 10/15/1979 at 23:16:54, a magnitude 7.0 (5.7 MB, 6.9 MS, 7.0 ML, 6.4 MW) earthquake occurred 87.7 miles away from the city center
Magnitude types: body-wave magnitude (MB), local magnitude (ML), surface-wave magnitude (MS), moment magnitude (MW)
Natural disasters:
The number of natural disasters in San Diego County (39) is a lot greater than the US average (15).Major Disasters (Presidential) Declared: 21
Emergencies Declared: 2
Causes of natural disasters: Fires: 21, Floods: 17, Storms: 9, Winter Storms: 6, Landslides: 5, Mudslides: 4, Freeze: 1, Heavy Rain: 1, Hurricane: 1, Tornado: 1, Other: 1 (Note: some incidents may be assigned to more than one category).

Main business address for: MAXIM PHARMACEUTICALS INC (MEDICINAL CHEMICALS & BOTANICAL PRODUCTS), DIVERSA CORP (SERVICES-COMMERCIAL PHYSICAL & BIOLOGICAL RESEARCH), MEDICINOVA INC (PHARMACEUTICAL PREPARATIONS), MACROPORE INC (ORTHOPEDIC, PROSTHETIC & SURGICAL APPLIANCES & SUPPLIES), SDG&E FUNDING LLC A DE LIMITED LIABILITY CO (ASSET-BACKED SECURITIES), BIOGEN IDEC INC (BIOLOGICAL PRODUCTS (NO DIAGNOSTIC SUBSTANCES)), PRICESMART INC (RETAIL-VARIETY STORES), EDUCATION LENDING GROUP INC (PERSONAL CREDIT INSTITUTIONS) and 84 other public companies.
Hospitals in San Diego:
- ALVARADO HOSPITAL MEDICAL CENTER (Government - Federal, provides emergency services, 6655 ALVARADO ROAD)
- AVALON HOSPICE AND PALLIATIVE CARE (3914 MURPHY CANYON ROAD, SUITE A226)
- HARBOR VIEW MEDICAL CENTER (provides emergency services, 120 ELM STREET)
- HOSPICE OF SHARP HEALTHCARE (1800 THIBODO ROAD SUITE B)
- LIGHTBRIDGE HOSPICE (5280 CARROLL CANYON ROAD, # 310)
- ODYSSEY HEALTHCARE OF SAN DIEGO (9444 BALBOA AVENUE, SUITE 290)
- SAN DIEGO GENERAL HOSPITAL (446 26TH STREET)
- SD CTY LOMA PORTAL MENTAL HLTH FAC (3485 KENYON ST)
- SHARP MARY BIRCH HOSPITAL FOR WOMEN (3003 HEALTH CENTER DRIVE)
- UNIVERSITY OF CALIFORNIA SAN DIEGO MEDICAL CENTER (Voluntary non-profit - Other, 200 WEST ARBOR DRIVE)
Airports, heliports and other landing facilities located in San Diego:
- Montgomery Field Airport (MYF) (Runways: 3, Commercial Ops: 4, Air Taxi Ops: 3,476, Itinerant Ops: 109,094, Local Ops: 111,645, Military Ops: 647)
- San Diego International Airport (SAN) (Runways: 1, Commercial Ops: 155,310, Air Taxi Ops: 22,953, Itinerant Ops: 8,930, Local Ops: 3, Military Ops: 597)
- Brown Field Municipal Airport (SDM) (Runways: 2, Air Taxi Ops: 3,118, Itinerant Ops: 23,273, Local Ops: 50,729, Military Ops: 12,765)
- Miramar Mcas Airport (NKX) (Runways: 2)
- North Island Nas /Halsey Field/ Airport (NZY) (Runways: 2)
- Heliports: 8
- Torrey Pines Gliderport (CA84)
Amtrak station:
SAN DIEGO (1050 KETTNER BLVD.) . Services: ticket office, fully wheelchair accessible, enclosed waiting area, public restrooms, public payphones, full-service food facilities, paid short-term parking, paid long-term parking, call for car rental service, taxi stand, public transit connection.Biggest Colleges/Universities in San Diego:
- San Diego State University (Full-time enrollment: 27,516; Location: 5500 Campanile Dr; Public; Website: www.sdsu.edu; Offers Doctor's degree)
- San Diego Mesa College (Full-time enrollment: 12,487; Location: 7250 Mesa College Dr; Public; Website: www.sdmesa.edu/)
- San Diego City College (Full-time enrollment: 7,972; Location: 1313 Park Boulevard; Public; Website: www.sdcity.edu/)
- University of San Diego (Full-time enrollment: 7,589; Location: 5998 Alcala Park; Private, not-for-profit; Website: www.sandiego.edu; Offers Doctor's degree)
- University of Phoenix-San Diego Campus (Full-time enrollment: 5,159; Location: 9645 Granite Ridge Dive; Private, for-profit; Website: www.phoenix.edu; Offers Master's degree)
- San Diego Miramar College (Full-time enrollment: 5,128; Location: 10440 Black Mountain Rd; Public; Website: www.sdmiramar.edu/)
- Point Loma Nazarene University (Full-time enrollment: 3,189; Location: 3900 Lomaland Dr; Private, not-for-profit; Website: www.pointloma.edu; Offers Master's degree)
- Alliant International University (Full-time enrollment: 3,155; Location: 10455 Pomerado Road; Private, not-for-profit; Website: www.alliant.edu; Offers Doctor's degree)
- The Art Institute of California-Argosy University San Diego (Full-time enrollment: 2,180; Location: 7650 Mission Valley Road; Private, for-profit; Website: www.artinstitutes.edu/san-diego/)
- Kaplan College-San Diego (Full-time enrollment: 1,700; Location: 9055 Balboa Avenue; Private, for-profit; Website: www.kaplancollege.com/san-diego-ca/)
- California College San Diego (Full-time enrollment: 1,577; Location: 6602 Convoy Court Ste 100; Private, not-for-profit; Website: www.cc-sd.edu)
- Concorde Career College-San Diego (Full-time enrollment: 1,222; Location: 4393 Imperial Avenue, Suite 100; Private, for-profit; Website: www.concorde.edu)
- Coleman University (Full-time enrollment: 1,080; Location: 8888 Balboa Ave; Private, not-for-profit; Website: www.coleman.edu; Offers Master's degree)
- Pacific College of Oriental Medicine-San Diego (Full-time enrollment: 774; Location: 7445 Mission Valley Rd Ste 105; Private, for-profit; Website: www.PacificCollege.edu; Offers Doctor's degree)
- Newschool of Architecture and Design (Full-time enrollment: 601; Location: 1249 F St; Private, for-profit; Website: www.newschoolarch.edu; Offers Master's degree)
- Platt College-San Diego (Full-time enrollment: 414; Location: 6250 El Cajon Blvd; Private, for-profit; Website: www.platt.edu)
- Argosy University-San Diego (Full-time enrollment: 375; Location: 1615 Murray Canyon Road, Suite 100; Private, for-profit; Website: www.argosy.edu/sandiego; Offers Doctor's degree)
- Paul Mitchell the School-San Diego (Full-time enrollment: 362; Location: 410 A St; Private, for-profit; Website: sandiego.paulmitchell.edu/)
- CET-San Diego (Full-time enrollment: 253; Location: 4153 Market Street; Private, not-for-profit; Website: www.cetweb.org/index.php)
- San Diego College (Full-time enrollment: 248; Location: 3350 Market St Ste C; Private, for-profit; Website: www.sandiegocollege.edu)
Biggest public high schools in San Diego:
- RANCHO BERNARDO HIGH (Students: 2,034, Location: 13010 PASEO LUCIDO, Grades: 9-12)
- MIRA MESA HIGH (Students: 1,922, Location: 10510 REAGAN RD., Grades: 9-12)
- HENRY HIGH (Students: 1,792, Location: 6702 WANDERMERE DR., Grades: 9-12)
- WESTVIEW HIGH (Students: 1,775, Location: 13500 CAMINO DEL SUR, Grades: 9-12)
- MT. CARMEL HIGH (Students: 1,712, Location: 9550 CARMEL MOUNTAIN RD., Grades: 9-12)
- SCRIPPS RANCH HIGH (Students: 1,707, Location: 10410 TREENA ST., Grades: 9-12)
- MORSE HIGH (Students: 1,675, Location: 6905 SKYLINE DR., Grades: 9-12)
- SAN YSIDRO HIGH (Students: 1,588, Location: 5353 AIRWAY RD., Grades: 9-12)
- POINT LOMA HIGH (Students: 1,499, Location: 2335 CHATSWORTH BLVD., Grades: 9-12)
- SERRA HIGH (Students: 1,456, Location: 5156 SANTO RD., Grades: 9-12)
Biggest private high schools in San Diego:
- CATHEDRAL CATHOLIC HIGH SCHOOL (Students: 1,706, Location: 5555 DEL MAR HEIGHTS RD, Grades: 9-12)
- FRANCIS PARKER SCHOOL (Students: 1,233, Location: 6501 LINDA VISTA RD, Grades: PK-12)
- HORIZON CHRISTIAN ACADEMY PK-12 (Students: 1,009, Location: 5331 MOUNT ALIFAN DR, Grades: PK-12)
- ACADEMY OF OUR LADY OF PEACE (Students: 750, Location: 4860 OREGON ST, Grades: 9-12, Girls only)
- ST AUGUSTINE HIGH SCHOOL (Students: 731, Location: 3266 NUTMEG ST, Grades: 9-12, Boys only)
- MARANATHA CHRISTIAN SCHOOLS (Students: 515, Location: 9050 MARANATHA DR, Grades: KG-12)
- SAN DIEGO JEWISH ACADEMY (Students: 513, Location: 11860 CARMEL CREEK RD, Grades: KG-12)
- THE ROCK ACADEMY (Students: 422, Location: 2320 TRUXTUN RD, Grades: PK-12)
- OCEAN VIEW CHRISTIAN ACADEMY (Students: 308, Location: 2460 PALM AVE, Grades: PK-12)
- THE WALDORF SCHOOL OF SAN DIEGO (Students: 272, Location: 3547 ALTADENA AVE, Grades: PK-12)
Biggest public elementary/middle schools in San Diego:
- BERNARDO HEIGHTS MIDDLE (Students: 1,338, Location: 12990 PASEO LUCIDO, Grades: 6-8)
- MESA VERDE MIDDLE (Students: 1,321, Location: 8375 ENTREKEN WAY, Grades: 6-8)
- STANDLEY MIDDLE (Students: 1,268, Location: 6298 RADCLIFFE DR., Grades: 6-8)
- BLACK MOUNTAIN MIDDLE (Students: 1,241, Location: 9353 OVIEDO ST., Grades: 6-8)
- WANGENHEIM MIDDLE (Students: 1,195, Location: 9230 GOLD COAST DR., Grades: 6-8)
- BELL MIDDLE (Students: 1,136, Location: 620 BRIARWOOD RD., Grades: 6-8)
- CLARK MIDDLE (Students: 1,121, Location: 4388 THORN ST., Grades: 6-8)
- CHALLENGER MIDDLE (Students: 1,079, Location: 10810 PARKDALE AVE., Grades: 6-8)
- LEWIS MIDDLE (Students: 1,026, Location: 5170 GREENBRIER AVE., Grades: 6-8)
- OAK VALLEY MIDDLE (Students: 1,005, Location: 16055 WINECREEK RD., Grades: 6-8)
Biggest private elementary/middle schools in San Diego:
- SCHOOL OF THE MADELEINE (Students: 606, Location: 1875 ILLION ST, Grades: PK-8)
- MISSION BAY MONTESSORI ACADEMY (Students: 391, Location: 2640 SODERBLOM AVE, Grades: PK-6)
- CHABAD HEBREW ACADEMY (Students: 360, Location: 10785 POMERADO RD, Grades: PK-8)
- ST THERESE ACADEMY (Students: 345, Location: 6046 CAMINO RICO, Grades: PK-8)
- NAZARETH SCHOOL (Students: 326, Location: 10728 SAN DIEGO MISSION RD, Grades: PK-8)
- SOILLE SAN DIEGO HEBREW DAY SCHOOL (Students: 290, Location: 3630 AFTON RD, Grades: PK-8)
- OUR LADYS SCHOOL (Students: 277, Location: 650 24TH ST, Grades: PK-8)
- ST DIDACUS SCHOOL (Students: 275, Location: 4630 34TH ST, Grades: PK-8)
- WARREN-WALKER SCHOOL (Students: 259, Location: 4605 POINT LOMA AVE, Grades: PK-8)
- ST CHARLES CATHOLIC SCHOOL (Students: 237, Location: 929 18TH ST, Grades: KG-8)
Libraries in San Diego:
- SAN DIEGO PUBLIC LIBRARY (Operating income: $41,443,616; Location: 820 E ST.; 4,938,445 books; 6,132 e-books; 179,457 audio materials; 205,023 video materials; 80 local licensed databases; 1 state licensed databases; 3 other licensed databases; 4,012 print serial subscriptions; 2,405 electronic serial subscriptions)
- SAN DIEGO COUNTY LIBRARY (Operating income: $38,584,850; Location: 5555 OVERLAND AVE., BUILDING 15; 1,185,903 books; 1,414 e-books; 127,056 audio materials; 102,569 video materials; 37 local licensed databases; 5,533 print serial subscriptions; 6 electronic serial subscriptions)
User-submitted facts and corrections:
- houses in San Diego do not cost anywhere near $200,000. The average home ranges from $300,000 to $400,000
added by Natalie Taylor
- Addition: University of California San Diego . It is one of the largest employers and one of the largest universities in San Diego County.
- other colleges NewSchool of Architecture and Design Woodbury University Art Institute of San Diego
- All Saints' Church 625 Pennsylvania Avenue San Diego, CA 92103 info at allsaintschurch.org http://www.allsaintschurch.org San Diego's Anglo-Catholic parish.
Points of interest:
Notable locations in San Diego: North City Water Reclamation Plant (A), Point Loma Wastewater Treatment Plant (B), South Bay International Wastewater Treatment Plant (C), South Bay Water Reclamation Plant (D), Mission Beach Roller Coaster (E), Diane Center (F), Mission Dam and Flume Historic Site (G), Mole Pier (H), South Bay Drive-In (I), Pacific Beach (J), Penasquitos Ranch (K), Siempre Viva Industrial Center (L), Siempre Viva Business Park (M), San Diego Business Park (N), Otay Mesa International Center (O), Otay Mesa Industrial Park (P), Otay la Mesa Business Center (Q), Martinez Ranch (R), La Media Business Park (S), Empire Center (T). Display/hide their locations on the map
Shopping Centers: Clairemont Town Square Shopping Center (1), Flower Hill Promenade Shopping Center (2), Horton Plaza Shopping Center (3), Las Americas Shopping Center (4), Liberty Park Plaza Shopping Center (5), Mission Valley Center-Westfield Shopping Center (6), San Ysidro Village Shopping Center (7), UTC-Westfield Shoppingtown Shopping Center (8), Loma Square Shopping Center (9). Display/hide their locations on the map
Main business address in San Diego include: MAXIM PHARMACEUTICALS INC (A), DIVERSA CORP (B), MEDICINOVA INC (C), MACROPORE INC (D), SDG&E FUNDING LLC A DE LIMITED LIABILITY CO (E), BIOGEN IDEC INC (F), PRICESMART INC (G), EDUCATION LENDING GROUP INC (H). Display/hide their locations on the map
Churches in San Diego include: College Park Presbyterian Church (A), Rancho Bernardo Baptist Church (B), Penasquitos Nazarene Church (C), Assembly of God Church (D), First Baptist Church (E), Fourth Church of Christ Scientist (F), La Jolla Lutheran Church (G), La Jolla Presbyterian Church (H), Mary Star of the Sea Roman Catholic Church (I). Display/hide their locations on the map
Cemeteries: Greenwood Cemetery (1), Mount Hope Cemetery (2), Mount Olivet Cemetery (3), Holy Cross Cemetery (4), El Camino Memorial Park (5), Miramar National Cemetery (6), Fort Rosecrans National Cemetery (7). Display/hide their locations on the map
Lakes, reservoirs, and swamps: Los Penasquitos Lagoon (A), Smiley Lagoon (B), Chollas Reservoir (C), Murray Reservoir (D), Lake Hodges (E), Lake Miramar (F), Hollis Lake (G), Del Cerro Reservoir (H). Display/hide their locations on the map
Rivers and creeks: Chicarita Creek (A), Chollas Creek (B), Tecolote Creek (C), Santa Maria Creek (D), Santa Ysabel Creek (E), San Diego River (F), Otay River (G). Display/hide their locations on the map
Parks in San Diego include: Sunnyslope Park (1), Tijuana River County Open Space Preserve (2), Montgomery Waller Recreation Center (3), Pacific Gateway Park (4), Palm Ridge Park (5), San Ysidro Community Park (6), Silverwing Park (7), Petco Park (8), Olive Park (9). Display/hide their locations on the map
Beaches: Windansea Beach (A), Torrey Pines City Beach (B), Ocean Beach City Beach (C), Marine Street Beach (D), La Playa (E), Crown Point Shores (F), Wipeout Beach (G), Ski Beach (H), La Jolla Shores Beach (I). Display/hide their locations on the map
Tourist attractions: Aerospace Museum (2001 Pan American Plaza) (1), Balboa Park Promotions (Museums; 1549 El Prado) (2), Berkeley Ferryboat (Museums; 1492 North Harbor Drive) (3), Automotive Museum-Sd (2080 Pan American Plaza) (4), Distinguished Flying Cross Society (Cultural Attractions- Events- & Facilities; 4442 Vandever Avenue) (5), Aztec Club (Cultural Attractions- Events- & Facilities; 5178 College Avenue) (6), Aztec Store & More (Cultural Attractions- Events- & Facilities; 7007 Friars Road) (7), Convention & Visitors Bureau (Cultural Attractions- Events- & Facilities; 401 B Street Suite 1400) (8), Childrens Museum of San Diego (Cultural Attractions- Events- & Facilities; 211 West Maple Street) (9). Display/hide their approximate locations on the map
Hotels: Best Western Posada at the Yac (5005 North Harbor Drive) (1), Beachfront San Diego (4747 Mission Boulevard Suite 7) (2), Banana Bungalow Hostel San Diego (707 Reed Avenue) (3), Best Western Lamplighter Inn & Suites (6474 El Cajon Boulevard) (4), Best Western Seven Seas (411 Hotel Circle South) (5), Anchor Motel (2912 Garrison Street) (6), Beach Haven Motel (4740 Mission Blvd) (7), Best Western Blue Sea Lodge (707 Pacific Beach Drive) (8), Arlington Apartment Hotel (701 7th Avenue) (9). Display/hide their approximate locations on the map
Courts: Federal Bureau Of Investigation (9797 Aero Drive) (1), Bankruptcy Court (325 West F Street) (2), San Diego County - Alternate Public Defender- Jury Services-Superior Court- Juvenile Depend (8525 Gibbs Drive Suite 301) (3), Secret Service (550 West Centre Street Suite 660) (4), San Diego County - Alternate Public Defender- Jury Services-Superior Court- Juvenile Delinqu (8525 Gibbs Drive Suite 208) (5), Ronson Court Deli (4885 Ronson) (6), Superintendent Of Schools - Juvenile Court & Community Schools- Polinsky Sc (9400 Ruffin Court) (7), California State - Court-Superior Court Of California- Cunty Of Sn Dg- Kearny Mesa Br (8950 Clairemont Mesa) (8). Display/hide their approximate locations on the map
Birthplace of: Shane and Sia Barbi - Vegan, Cameron Diaz - (born 1972), Hollywood star, half Cuban, Bob Clampett - Animator, Arthur Jensen - Psychologist, Damon Allen - And football player, Adam Willard - Musician, Bert Acosta - Aviator, Stephen Strasburg - Baseball player, Cole Hamels - Baseball player, Kendra Wilkinson - Model and reality television participant.
Drinking water stations with addresses in San Diego and their reported violations in the past:
WILLIAM HEISE COUNTY PARK (Population served: 850, Groundwater):Past monitoring violations:MOUNT LAGUNA WATER SYSTEM (Population served: 500, Groundwater):
- One routine major monitoring violation
- One regular monitoring violation
Past health violations:YUMA MESA R V PARK (Address: 4120 30TH ST , Serves AZ, Population served: 366, Groundwater):Past monitoring violations:
- MCL, Monthly (TCR) - Between JUL-2012 and SEP-2012, Contaminant: Coliform. Follow-up actions: St AO (w/o penalty) issued (JUL-19-2012)
- MCL, Acute (TCR) - Between JAN-2012 and MAR-2012, Contaminant: Coliform. Follow-up actions: St Boil Water Order (JAN-23-2012)
- MCL, Monthly (TCR) - Between JUL-2010 and SEP-2010, Contaminant: Coliform. Follow-up actions: St AO (w/o penalty) issued (AUG-13-2010)
- MCL, Monthly (TCR) - Between OCT-2008 and DEC-2008, Contaminant: Coliform
- MCL, Monthly (TCR) - Between OCT-2008 and DEC-2008, Contaminant: Coliform. Follow-up actions: St AO (w/o penalty) issued (OCT-18-2008)
- MCL, Monthly (TCR) - Between JUL-2006 and SEP-2006, Contaminant: Coliform. Follow-up actions: St AO (w/o penalty) issued (OCT-19-2006)
- 3 other older health violations
- Monitoring, Repeat Major (TCR) - Between APR-2008 and JUN-2008, Contaminant: Coliform (TCR). Follow-up actions: St AO (w/o penalty) issued (JUL-15-2008)
- Monitoring, Repeat Major (TCR) - Between APR-2008 and JUN-2008, Contaminant: Coliform (TCR). Follow-up actions: St AO (w/o penalty) issued (JUL-15-2008)
- 2 routine major monitoring violations
Past monitoring violations:BUTTERFIELD RANCH (Population served: 350, Groundwater):
- Monitoring, Source Water (GWR) - In DEC-19-2013, Contaminant: E. COLI. Follow-up actions: St Violation/Reminder Notice (2 times from JAN-24-2014 to JAN-24-2014), St Compliance achieved (FEB-20-2014)
- Monitoring, Repeat Major (TCR) - In DEC-2013, Contaminant: Coliform (TCR). Follow-up actions: St Violation/Reminder Notice (JAN-23-2014), St Compliance achieved (FEB-20-2014)
- 4 routine major monitoring violations
- One regular monitoring violation
Past health violations:SACRED ROCKS RESERVE (Population served: 300, Groundwater):Past monitoring violations:
- MCL, Monthly (TCR) - In JUL-2005, Contaminant: Coliform. Follow-up actions: St AO (w/o penalty) issued (AUG-15-2005)
- MCL, Monthly (TCR) - In JUL-2005, Contaminant: Coliform
- Follow-up Or Routine LCR Tap M/R - In DEC-01-2007, Contaminant: Lead and Copper Rule. Follow-up actions: St AO (w/o penalty) issued (DEC-11-2007)
- 9 routine major monitoring violations
Past health violations:LAKE MORENA COUNTY PARK (Population served: 300, Groundwater):Past monitoring violations:
- MCL, Monthly (TCR) - Between JUL-2005 and SEP-2005, Contaminant: Coliform. Follow-up actions: St AO (w/o penalty) issued (OCT-10-2005)
- MCL, Monthly (TCR) - Between JUL-2005 and SEP-2005, Contaminant: Coliform
- 18 routine major monitoring violations
- One regular monitoring violation
Past health violations:WHISPERING OAKS PROGRAM CENTER (Population served: 250, Groundwater):
- MCL, Monthly (TCR) - Between OCT-2008 and DEC-2008, Contaminant: Coliform. Follow-up actions: St AO (w/o penalty) issued (OCT-13-2008)
- MCL, Monthly (TCR) - Between OCT-2008 and DEC-2008, Contaminant: Coliform
- MCL, Single Sample - Between OCT-2006 and DEC-2006, Contaminant: Nitrate-Nitrite. Follow-up actions: St AO (w/o penalty) issued (DEC-28-2006)
Past monitoring violations:FRY CREEK / OBSERVATORY (Population served: 200, Groundwater):
- One routine major monitoring violation
- One regular monitoring violation
Past health violations:Past monitoring violations:
- MCL, Monthly (TCR) - Between APR-2011 and JUN-2011, Contaminant: Coliform. Follow-up actions: St AO (w/o penalty) issued (MAY-25-2011)
- MCL, Acute (TCR) - Between APR-2010 and JUN-2010, Contaminant: Coliform. Follow-up actions: St Boil Water Order (MAY-14-2010)
- 5 routine major monitoring violations
Drinking water stations with addresses in San Diego that have no violations reported:
- WILDERNESS GARDENS PRESERVE (Address: 4th floor , Population served: 500, Primary Water Source Type: Groundwater)
- CAMPO HILLS-COUNTY PUBLIC WORKS WASTEWTR (Address: SUITE 315 , Population served: 458, Primary Water Source Type: Groundwater under infl of surface water)
- SANTA MARGARITA COUNTY PRESERVE (Address: 4th floor , Population served: 75, Primary Water Source Type: Groundwater)
- MOM S PIE HOUSE (Address: 4th floor , Population served: 25, Primary Water Source Type: )
- COUNTY LINE BBQ AND CAFE (Address: 4th floor , Population served: 25, Primary Water Source Type: )
| This city: | 2.6 people |
| California: | 2.9 people |
| This city: | 59.0% |
| Whole state: | 68.7% |
| This city: | 7.5% |
| Whole state: | 7.2% |
Likely homosexual households (counted as self-reported same-sex unmarried-partner households)
- Lesbian couples: 0.6% of all households
- Gay men: 0.8% of all households
People in group quarters in San Diego in 2010:
- 15,298 people in college/university student housing
- 11,448 people in military barracks and dormitories (nondisciplinary)
- 8,798 people in military ships
- 4,669 people in other noninstitutional facilities
- 2,902 people in nursing facilities/skilled-nursing facilities
- 2,081 people in group homes intended for adults
- 1,728 people in federal detention centers
- 1,050 people in residential treatment centers for adults
- 1,046 people in emergency and transitional shelters (with sleeping facilities) for people experiencing homelessness
- 809 people in local jails and other municipal confinement facilities
- 495 people in workers' group living quarters and job corps centers
- 322 people in correctional facilities intended for juveniles
- 297 people in hospitals with patients who have no usual home elsewhere
- 237 people in military disciplinary barracks and jails
- 175 people in correctional residential facilities
- 175 people in group homes for juveniles (non-correctional)
- 168 people in mental (psychiatric) hospitals and psychiatric units in other hospitals
- 151 people in residential treatment centers for juveniles (non-correctional)
- 43 people in military treatment facilities with assigned patients
- 32 people in state prisons
- 21 people in maritime/merchant vessels
- 11 people in in-patient hospice facilities
People in group quarters in San Diego in 2000:
- 12,887 people in college dormitories (includes college quarters off campus)
- 10,694 people in military barracks, etc.
- 5,740 people in military ships
- 5,043 people in other noninstitutional group quarters
- 3,285 people in nursing homes
- 1,373 people in other group homes
- 1,156 people in homes or halfway houses for drug/alcohol abuse
- 972 people in local jails and other confinement facilities (including police lockups)
- 946 people in federal prisons and detention centers
- 465 people in short-term care, detention or diagnostic centers for delinquent children
- 426 people in military transient quarters for temporary residents
- 424 people in other nonhousehold living situations
- 310 people in homes for the mentally ill
- 273 people in homes for the mentally retarded
- 257 people in military disciplinary barracks
- 246 people in crews of maritime vessels
- 230 people in halfway houses
- 215 people in agriculture workers' dormitories on farms
- 182 people in other workers' dormitories
- 162 people in mental (psychiatric) hospitals or wards
- 108 people in religious group quarters
- 95 people in homes for the physically handicapped
- 76 people in orthopedic wards and institutions for the physically handicapped
- 50 people in hospitals/wards and hospices for chronically ill
- 48 people in other types of correctional institutions
- 47 people in hospices or homes for chronically ill
- 43 people in wards in military hospitals for patients who have no usual home elsewhere
- 33 people in training schools for juvenile delinquents
- 29 people in wards in general hospitals for patients who have no usual home elsewhere
- 19 people in residential treatment centers for emotionally disturbed children
- 16 people in hospitals or wards for drug/alcohol abuse
- 9 people in job corps and vocational training facilities
- 6 people in homes for abused, dependent, and neglected children
- 3 people in other hospitals or wards for chronically ill
Banks with most branches in San Diego (2011 data):
- Wells Fargo Bank, National Association: 44 branches. Info updated 2011/04/05: Bank assets: $1,161,490.0 mil, Deposits: $905,653.0 mil, headquarters in Sioux Falls, SD, positive income, 6395 total offices, Holding Company: Wells Fargo & Company
- JPMorgan Chase Bank, National Association: 35 branches. Info updated 2011/11/10: Bank assets: $1,811,678.0 mil, Deposits: $1,190,738.0 mil, headquarters in Columbus, OH, positive income, International Specialization, 5577 total offices, Holding Company: Jpmorgan Chase & Co.
- Bank of America, National Association: 33 branches. Info updated 2009/11/18: Bank assets: $1,451,969.3 mil, Deposits: $1,077,176.8 mil, headquarters in Charlotte, NC, positive income, 5782 total offices, Holding Company: Bank Of America Corporation
- U.S. Bank National Association: 31 branches. Info updated 2012/01/30: Bank assets: $330,470.8 mil, Deposits: $236,091.5 mil, headquarters in Cincinnati, OH, positive income, 3121 total offices, Holding Company: U.S. Bancorp
- Union Bank, National Association: 26 branches. Info updated 2011/09/01: Bank assets: $88,967.5 mil, Deposits: $65,286.4 mil, headquarters in San Francisco, CA, positive income, Commercial Lending Specialization, 403 total offices, Holding Company: Mitsubishi Ufj Financial Group, Inc.
- California Bank & Trust: 12 branches. Info updated 2009/07/20: Bank assets: $10,894.1 mil, Deposits: $9,193.9 mil, local headquarters, positive income, Commercial Lending Specialization, 109 total offices, Holding Company: Zions Bancorporation
- Comerica Bank: 9 branches. Info updated 2011/07/29: Bank assets: $60,970.5 mil, Deposits: $48,300.9 mil, headquarters in Dallas, TX, positive income, Commercial Lending Specialization, 497 total offices, Holding Company: Comerica Incorporated
- Citibank, National Association: 8 branches. Info updated 2012/01/10: Bank assets: $1,288,658.0 mil, Deposits: $882,541.0 mil, headquarters in Sioux Falls, SD, positive income, International Specialization, 1048 total offices, Holding Company: Citigroup Inc.
- Torrey Pines Bank: at 12220 El Camino Real, Suite 100, Symphony Towers Branch, Downtown San Diego Branch, Kearny Mesa Office, Golden Triangle Office, Carmel Valley Branch. Info updated 2011/01/05: Bank assets: $1,728.4 mil, Deposits: $1,416.8 mil, local headquarters, positive income, Commercial Lending Specialization, 13 total offices, Holding Company: Western Alliance Bancorporation
- 31 other banks with 51 local branches
For population 15 years and over in San Diego:

- Never married: 41.5%
- Now married: 44.3%
- Separated: 1.7%
- Widowed: 3.6%
- Divorced: 8.8%
For population 25 years and over in San Diego:
- High school or higher: 90.8%
- Bachelor's degree or higher: 51.2%
- Graduate or professional degree: 21.7%
- Unemployed: 3.9%
- Mean travel time to work (commute): 18.2 minutes


| Here: | 12.9 |
| California average: | 15.5 |


Graphs represent county-level data. Detailed 2008 Election Results
Neighborhoods in San Diego:
(San Diego, California Neighborhood Map)- Adams Avenue Park neighborhood
- Adams North neighborhood
- Adeline Gardens neighborhood
- Allied Gardens neighborhood
- Alta Vista neighborhood
- Andalucia neighborhood
- Angove Condos neighborhood
- Arbor Drive Townhomes neighborhood
- Arizona Park neighborhood
- Arroyos Del Mar neighborhood
- Avalon Plaza neighborhood
- Axos neighborhood
- Balboa Park neighborhood
- Bamboo Gardens neighborhood
- Banker's Hill (Bankers Hill) neighborhood
- Barrio Logan neighborhood
- Bay Ho neighborhood
- Bay Park neighborhood
- Bay Terraces neighborhood
- Bay View Villas neighborhood
- Bella Vista Condos neighborhood
- Bernardino Corp Center neighborhood
- Birdland neighborhood
- Black Mountain Ranch neighborhood
- Blue Waters Condos neighborhood
- Bosque Del Mar neighborhood
- Bridgeview neighborhood
- Britannia Industrial Park neighborhood
- Broadway Heights neighborhood
- Bryn Glen neighborhood
- Burlingame neighborhood
- Cabrera neighborhood
- Cabrillo Knoll neighborhood
- California Terraces neighborhood
- Califronia Terraces neighborhood
- Cambridge Square neighborhood
- Campus Walk Condos neighborhood
- Canyon Ridge neighborhood
- Carmel Mountain neighborhood
- Carmel Valley neighborhood
- Carroll Canyon Business Park neighborhood
- Castle neighborhood
- Chalcedeony Row Homes neighborhood
- Cherokee Point neighborhood
- Chollas Creek neighborhood
- Chollas Creek Villas neighborhood
- Chollas View neighborhood
- Cielo Del Mar neighborhood
- City Heights neighborhood
- City View Condominiums neighborhood
- City Walk Condominiums neighborhood
- Cityscape neighborhood
- Clairemont neighborhood
- Clairemont Mesa East neighborhood
- Clairemont Mesa West neighborhood
- Colina Del Sol neighborhood
- College East neighborhood
- College Grove Condos neighborhood
- College West neighborhood
- Colonial Court neighborhood
- Core-columbia neighborhood
- Coronado View neighborhood
- Corridor neighborhood
- Cortez neighborhood
- Costa Del Sol neighborhood
- Costa Del Sol West neighborhood
- Courtyard at College neighborhood
- Cypress Greens neighborhood
- Darnall neighborhood
- Del Cerro neighborhood
- Del Norte Cottages neighborhood
- Dennery Ranch neighborhood
- Dennery Ranch Villages neighborhood
- Downtown neighborhood
- Duck Pond Ranch neighborhood
- East Village neighborhood
- Egger Highlands neighborhood
- El Cerrito neighborhood
- Elan Condos neighborhood
- Emerald Hills neighborhood
- Encanto neighborhood
- Esperanza neighborhood
- Estelle Condos neighborhood
- Fairbanks Summit neighborhood
- Fairbrook Estates neighborhood
- Fairmont Park neighborhood
- Fairmont Village neighborhood
- Fashion Walk Condos neighborhood
- Felspar Park neighborhood
- Felspar Street Townhomes neighborhood
- Felton Heights neighborhood
- Felton Street neighborhood
- Fenton Carroll Canyon neighborhood
- Fleet Ridge (Roseville) neighborhood
- Florida Gardens neighborhood
- Florida Street Condos neighborhood
- Fox Canyon neighborhood
- Gaslamp neighborhood
- Glenridge neighborhood
- Gold Coast Condos neighborhood
- Golden Heights neighborhood
- Golden Hill neighborhood
- Golden Palms Condominiums neighborhood
- Grant Hill neighborhood
- Grantville neighborhood
- Greystone Torrey Highlands neighborhood
- Greystone-Garden neighborhood
- Harbor Lights Condos neighborhood
- Harborview neighborhood
- Hidden Trails neighborhood
- Hillcrest neighborhood
- Hilltop Condominiums neighborhood
- Hollywood Park (Azalea) neighborhood
- Horton Plaza neighborhood
- Imperial Marketplace neighborhood
- India Street Lofts Condos neighborhood
- Islenair neighborhood
- Jamacha Lomita neighborhood
- Judson Street Condos neighborhood
- Kearny Mesa neighborhood
- Kearny Mesa Townhomes neighborhood
- Kensington neighborhood
- LXJ Condominiums neighborhood
- La Boheme Condos neighborhood
- La Jolla Commons neighborhood
- La Jolla Crossroads neighborhood
- La Playa neighborhood
- Lake Murray neighborhood
- Legacy Walk neighborhood
- Levanto neighborhood
- Liberty Station neighborhood
- Lincoln Park neighborhood
- Linda Vista neighborhood
- Little Italy neighborhood
- Logan Heights neighborhood
- Loma Portal neighborhood
- Lone Tree Estates neighborhood
- Lusso Condos neighborhood
- Marina neighborhood
- Mariners Village neighborhood
- Marlborough Villas neighborhood
- Maryland Street Townhomes neighborhood
- Mcmillin Torrey Highlands neighborhood
- Memorial neighborhood
- Mesa Grande neighborhood
- Mesa Norte neighborhood
- Mesa Verde Estates neighborhood
- Midtown neighborhood
- Midway District neighborhood
- Milazzo neighborhood
- Mira Mesa neighborhood
- Miramar neighborhood
- Miramar Ranch North neighborhood
- Mission Bay neighborhood
- Mission Beach neighborhood
- Mission City neighborhood
- Mission Hills neighborhood
- Mission Hills Commons neighborhood
- Mission Valley neighborhood
- Mission Valley East neighborhood
- Mission Valley West neighborhood
- Mississippi Street Condos neighborhood
- Monarch at Carmel Valley neighborhood
- Monarch at Scripps Ranch neighborhood
- Montecito - neighborhood
- Montecito Point neighborhood
- Morena neighborhood
- Moto Villas Condos neighborhood
- Mountain View neighborhood
- Mt Hope neighborhood
- Navajo neighborhood
- Nestor neighborhood
- Nobel Research Park neighborhood
- Normal Heights neighborhood
- Normal Heights Village neighborhood
- North Bay Terraces neighborhood
- North City neighborhood
- North Clairemont neighborhood
- North Encanto neighborhood
- North Park neighborhood
- Northblock Lofts neighborhood
- Oak Park neighborhood
- Ocean Beach neighborhood
- Ocean Crest neighborhood
- Ocean View Hills Corporate Center neighborhood
- Old Town neighborhood
- Orange Blossom Park neighborhood
- Otay Corporate Center South neighborhood
- Otay Mesa neighborhood
- Otay Mesa West neighborhood
- Otay Pacific Bus Park neighborhood
- Pac Highlands Ranch neighborhood
- Pac Tower Condos neighborhood
- Pacific Beach neighborhood
- Pacific Beach Drive Condominiums neighborhood
- Pacific Terrace neighborhood
- Palisade Gardens neighborhood
- Palm Breeze Villas neighborhood
- Palm City neighborhood
- Paradise Hills neighborhood
- Park Gate neighborhood
- Park Laurel neighborhood
- Park Place Condominiums neighborhood
- Park Villas of Talmadge neighborhood
- Park West neighborhood
- Parkcrest neighborhood
- Parkloft Condiminiums neighborhood
- Parkview neighborhood
- Paseo De Mission Hills neighborhood
- Pegasus neighborhood
- Penn Station neighborhood
- Pinnacle Museum Tower Condominium neighborhood
- Point Carmel neighborhood
- Point Loma neighborhood
- Point Loma Heights neighborhood
- Porta D Italia neighborhood
- Porto Siena neighborhood
- Prado Terrace neighborhood
- Princess Park in California Terraces neighborhood
- Rainier Place neighborhood
- Rancho Bernardo neighborhood
- Rancho Encantada neighborhood
- Rancho Penasquitos neighborhood
- Reata Way neighborhood
- Remington Hills neighborhood
- Renaissance at North Park neighborhood
- Rhodes Crossing neighborhood
- Ridgeview/webster neighborhood
- Rivera Drive Residences neighborhood
- Riviera Del Sol neighborhood
- Riviera Drive Townhomes neighborhood
- Rolando neighborhood
- Sabre Springs neighborhood
- Saddle Club Estates neighborhood
- Samuel Fox Lofts neighborhood
- San Carlos neighborhood
- Santa Monica neighborhood
- Savannah Terrace-Sabre Springs Areas neighborhood
- Schotz Estates neighborhood
- Scripps Highlands neighborhood
- Scripps Pomerado neighborhood
- Scripps Ranch neighborhood
- Seabreeze at Old El Camino Real neighborhood
- Serra Mesa neighborhood
- Shaw Property neighborhood
- Shelltown neighborhood
- Shelter Island neighborhood
- Sherman Heights neighborhood
- Sigsbee Row neighborhood
- Silver Oak Estates neighborhood
- Skyline neighborhood
- Skyline Terraces Estates neighborhood
- Smart Corner neighborhood
- Solmelia Condos neighborhood
- Sorrento Valley neighborhood
- South Bay Terraces neighborhood
- South Encanto neighborhood
- South Park neighborhood
- Southcrest neighborhood
- Southcrest Park Estates neighborhood
- Southgate Condos neighborhood
- Southpark Townhomes neighborhood
- Spectrum Ter neighborhood
- Spinnaker Point neighborhood
- Spruce Canyon Townhomes neighborhood
- Stockton neighborhood
- Summit Place neighborhood
- Sundowner Estates neighborhood
- Sunroad B Promenade neighborhood
- Sunset neighborhood
- Sunset Cliffs neighborhood
- Sunset Cliffs Boulevard Condos neighborhood
- Swan Canyon neighborhood
- Swift Park neighborhood
- Sycamore Estates neighborhood
- Talmadge neighborhood
- Temecula Heights neighborhood
- Teralta East neighborhood
- Teralta West neighborhood
- The Anchorage neighborhood
- The Bentley neighborhood
- The Court at Adelaide neighborhood
- The Egyptian neighborhood
- The Grande at Santa Fe Place neighborhood
- The Metropolitan Project neighborhood
- The Palisades neighborhood
- The Tent City (Tent City) neighborhood
- The Village in University Heights neighborhood
- The Villas at Stallions Crossing neighborhood
- Thorn Street Condos neighborhood
- Tierrasanta neighborhood
- Tijuana River Valley neighborhood
- Titan Condos neighborhood
- Torrey Brooke neighborhood
- Torrey Glenn neighborhood
- Torrey Highlands neighborhood
- Torrey Highlands Village Center neighborhood
- Torrey Hills neighborhood
- Torrey Ranch neighborhood
- Torrey Reserve Gateway neighborhood
- Torrey Santa Fe neighborhood
- Torrey View Estates neighborhood
- University City neighborhood
- University Heights neighborhood
- Valencia Business Park neighborhood
- Valencia Park neighborhood
- Verona neighborhood
- Villas Del Parque neighborhood
- Vista Bougainvillea neighborhood
- Vista Colina neighborhood
- W Laurel Studios neighborhood
- Wabash Gardens neighborhood
- Waterfront Condos neighborhood
- Wilson Villas neighborhood
- Winona Square neighborhood
- Wooded Area neighborhood
- Yacht Club Condos neighborhood
- Yonge Street Condos neighborhood
Religion statistics for San Diego, CA (based on San Diego County data)


| Religion | Adherents | Congregations |
|---|---|---|
| Catholic | 801,850 | 115 |
| Evangelical Protestant | 302,320 | 974 |
| Other | 161,530 | 349 |
| Mainline Protestant | 74,992 | 211 |
| Black Protestant | 10,857 | 52 |
| Orthodox | 7,828 | 19 |
| None | 1,735,936 | - |
Food Environment Statistics:
| This county: | 1.94 / 10,000 pop. |
| California: | 2.14 / 10,000 pop. |
| This county: | 0.06 / 10,000 pop. |
| California: | 0.04 / 10,000 pop. |
| This county: | 0.77 / 10,000 pop. |
| State: | 0.62 / 10,000 pop. |
| San Diego County: | 1.65 / 10,000 pop. |
| California: | 1.49 / 10,000 pop. |
| San Diego County: | 7.56 / 10,000 pop. |
| State: | 7.42 / 10,000 pop. |
| This county: | 6.5% |
| California: | 7.3% |
| This county: | 22.2% |
| State: | 21.3% |
| San Diego County: | 16.0% |
| California: | 17.9% |
Health and Nutrition:
| San Diego: | 50.7% |
| California: | 49.4% |
| This city: | 49.8% |
| California: | 48.0% |
| Here: | 27.8 |
| California: | 28.1 |
| San Diego: | 18.6% |
| State: | 20.2% |
| San Diego: | 11.4% |
| California: | 11.2% |
| San Diego: | 6.8 |
| California: | 6.8 |
| San Diego: | 30.6% |
| State: | 31.5% |
| Here: | 58.2% |
| State: | 56.4% |
| This city: | 81.7% |
| California: | 80.9% |
More about Health and Nutrition of San Diego, CA Residents
| Local government employment and payroll (March 2022) | |||||
| Function | Full-time employees | Monthly full-time payroll | Average yearly full-time wage | Part-time employees | Monthly part-time payroll |
|---|---|---|---|---|---|
| Police Protection - Officers | 1,895 | $23,159,773 | $146,658 | 14 | $52,304 |
| Other Government Administration | 1,291 | $11,426,058 | $106,207 | 58 | $211,938 |
| Water Supply | 974 | $7,788,325 | $95,955 | 21 | $43,451 |
| Firefighters | 938 | $13,120,127 | $167,848 | 1 | $173 |
| Parks and Recreation | 910 | $5,370,275 | $70,817 | 473 | $748,195 |
| Other and Unallocable | 850 | $7,707,582 | $108,813 | 10 | $21,597 |
| Sewerage | 616 | $4,959,556 | $96,615 | 5 | $8,500 |
| Police - Other | 471 | $3,686,521 | $93,924 | 124 | $158,926 |
| Financial Administration | 462 | $4,321,234 | $112,240 | 3 | $9,418 |
| Solid Waste Management | 374 | $2,665,739 | $85,532 | 4 | $12,045 |
| Streets and Highways | 367 | $2,767,091 | $90,477 | 4 | $7,364 |
| Judicial and Legal | 359 | $3,816,297 | $127,564 | 20 | $71,094 |
| Fire - Other | 250 | $2,343,530 | $112,489 | 82 | $178,859 |
| Local Libraries | 234 | $1,584,608 | $81,262 | 280 | $780,668 |
| Airports | 18 | $136,217 | $90,811 | 0 | $0 |
| Totals for Government | 10,009 | $94,852,932 | $113,721 | 1,099 | $2,304,533 |
San Diego government finances - Expenditure in 2021 (per resident):
- Construction - Regular Highways: $241,877,000 ($175.13)
Water Utilities: $174,181,000 ($126.11)
Housing and Community Development: $122,132,000 ($88.43)
Sewerage: $101,070,000 ($73.18)
Parks and Recreation: $66,081,000 ($47.84)
General - Other: $54,697,000 ($39.60)
Police Protection: $22,568,000 ($16.34)
Local Fire Protection: $2,633,000 ($1.91)
Natural Resources - Other: $2,312,000 ($1.67)
Libraries: $2,220,000 ($1.61)
Solid Waste Management: $1,642,000 ($1.19)
Air Transportation: $329,000 ($0.24)
- Current Operations - Housing and Community Development: $572,360,000 ($414.40)
General - Other: $491,886,000 ($356.14)
Police Protection: $470,601,000 ($340.73)
Water Utilities: $457,617,000 ($331.33)
Central Staff Services: $368,070,000 ($266.49)
Parks and Recreation: $261,981,000 ($189.68)
Local Fire Protection: $246,963,000 ($178.81)
Sewerage: $224,514,000 ($162.55)
Regular Highways: $155,856,000 ($112.84)
Solid Waste Management: $112,729,000 ($81.62)
General Public Buildings: $88,401,000 ($64.00)
Protective Inspection and Regulation - Other: $84,318,000 ($61.05)
Transit Utilities: $67,771,000 ($49.07)
Judicial and Legal Services: $54,596,000 ($39.53)
Libraries: $46,261,000 ($33.49)
Financial Administration: $44,047,000 ($31.89)
Health - Other: $31,176,000 ($22.57)
Air Transportation: $5,442,000 ($3.94)
- General - Interest on Debt: $226,573,000 ($164.05)
- Other Capital Outlay - General - Other: $49,280,000 ($35.68)
Parks and Recreation: $11,235,000 ($8.13)
Water Utilities: $10,836,000 ($7.85)
Local Fire Protection: $4,413,000 ($3.20)
Police Protection: $4,188,000 ($3.03)
Sewerage: $3,843,000 ($2.78)
Regular Highways: $2,287,000 ($1.66)
Solid Waste Management: $1,344,000 ($0.97)
Libraries: $429,000 ($0.31)
Central Staff Services: $70,000 ($0.05)
Natural Resources - Other: $60,000 ($0.04)
Air Transportation: $13,000 ($0.01)
- Water Utilities - Interest on Debt: $44,020,000 ($31.87)
San Diego government finances - Revenue in 2021 (per resident):
- Charges - Other: $644,853,000 ($466.89)
Sewerage: $380,617,000 ($275.58)
Parks and Recreation: $93,275,000 ($67.53)
Housing and Community Development: $68,393,000 ($49.52)
Regular Highways: $66,528,000 ($48.17)
Solid Waste Management: $57,736,000 ($41.80)
Air Transportation: $5,774,000 ($4.18)
Miscellaneous Commercial Activities: $1,283,000 ($0.93)
- Federal Intergovernmental - Housing and Community Development: $441,467,000 ($319.63)
Other: $316,366,000 ($229.06)
Air Transportation: $807,000 ($0.58)
Water Utilities: $9,000 ($0.01)
Sewerage: $2,000 ($0.00)
- Local Intergovernmental - Other: $41,341,000 ($29.93)
- Miscellaneous - General Revenue - Other: $100,468,000 ($72.74)
Sale of Property: $96,687,000 ($70.00)
Special Assessments: $92,606,000 ($67.05)
Rents: $63,545,000 ($46.01)
Interest Earnings: $35,192,000 ($25.48)
Fines and Forfeits: $27,441,000 ($19.87)
Donations From Private Sources: $2,946,000 ($2.13)
- Revenue - Water Utilities: $606,504,000 ($439.13)
- State Intergovernmental - Highways: $58,601,000 ($42.43)
Other: $32,649,000 ($23.64)
Water Utilities: $15,406,000 ($11.15)
General Local Government Support: $2,549,000 ($1.85)
- Tax - Property: $656,437,000 ($475.28)
General Sales and Gross Receipts: $349,005,000 ($252.69)
Public Utilities Sales: $158,773,000 ($114.96)
Other Selective Sales: $128,310,000 ($92.90)
Occupation and Business License - Other: $41,748,000 ($30.23)
Documentary and Stock Transfer: $13,701,000 ($9.92)
Other License: $10,479,000 ($7.59)
San Diego government finances - Debt in 2021 (per resident):
- Long Term Debt - Outstanding Unspecified Public Purpose: $5,311,576,000 ($3845.73)
Beginning Outstanding - Unspecified Public Purpose: $5,129,104,000 ($3713.62)
Retired Unspecified Public Purpose: $834,754,000 ($604.39)
Issue, Unspecified Public Purpose: $615,837,000 ($445.88)
San Diego government finances - Cash and Securities in 2021 (per resident):
- Bond Funds - Cash and Securities: $936,456,000 ($678.02)
- Other Funds - Cash and Securities: $1,647,283,000 ($1192.68)
- Sinking Funds - Cash and Securities: $104,935,000 ($75.98)
5.18% of this county's 2021 resident taxpayers lived in other counties in 2020 ($90,734 average adjusted gross income)
| Here: | 5.18% |
| California average: | 5.19% |
0.14% of residents moved from foreign countries ($1,493 average AGI)
San Diego County: 0.14% California average: 0.03%
Top counties from which taxpayers relocated into this county between 2020 and 2021:
| from Los Angeles County, CA | |
| from Riverside County, CA | |
| from Orange County, CA |
5.71% of this county's 2020 resident taxpayers moved to other counties in 2021 ($83,556 average adjusted gross income)
| Here: | 5.71% |
| California average: | 6.14% |
0.09% of residents moved to foreign countries ($1,067 average AGI)
San Diego County: 0.09% California average: 0.02%
Top counties to which taxpayers relocated from this county between 2020 and 2021:
| to Riverside County, CA | |
| to Los Angeles County, CA | |
| to Orange County, CA |
| Businesses in San Diego, CA | ||||
| Name | Count | Name | Count | |
|---|---|---|---|---|
| 24 Hour Fitness | 13 | Jones New York | 21 | |
| 7-Eleven | 18 | Journeys | 3 | |
| 99 Cents Only Stores | 5 | Juicy Couture | 1 | |
| ALDO | 6 | Justice | 1 | |
| AT&T | 20 | KFC | 16 | |
| Abercrombie & Fitch | 3 | Kincaid | 1 | |
| Abercrombie Kids | 2 | Kmart | 1 | |
| Ace Hardware | 8 | Kohl's | 3 | |
| Aeropostale | 2 | Kroger | 16 | |
| Albertsons | 14 | LA Fitness | 5 | |
| American Eagle Outfitters | 4 | La Quinta | 3 | |
| Ann Taylor | 5 | La-Z-Boy | 1 | |
| Apple Store | 2 | Lane Bryant | 1 | |
| Applebee's | 3 | Lane Furniture | 5 | |
| Arby's | 5 | LensCrafters | 4 | |
| Ashley Furniture | 1 | Levi Strauss & Co. | 1 | |
| Audi | 1 | Little Caesars Pizza | 17 | |
| AutoZone | 15 | Loews | 1 | |
| Avenue | 1 | Long John Silver's | 1 | |
| BMW | 1 | Lowe's | 1 | |
| Baja Fresh Mexican Grill | 3 | Macy's | 5 | |
| Bally Total Fitness | 1 | Marriott | 17 | |
| Banana Republic | 3 | Marshalls | 2 | |
| Barnes & Noble | 6 | MasterBrand Cabinets | 31 | |
| Baskin-Robbins | 9 | Mazda | 1 | |
| Bath & Body Works | 7 | McDonald's | 47 | |
| Bebe | 3 | Men's Wearhouse | 4 | |
| Bed Bath & Beyond | 3 | Motel 6 | 3 | |
| Ben & Jerry's | 3 | Motherhood Maternity | 7 | |
| Best Western | 12 | New Balance | 24 | |
| Big O Tires | 3 | New York & Co | 2 | |
| Blockbuster | 21 | Nike | 44 | |
| Brooks Brothers | 1 | Nissan | 2 | |
| Brookstone | 3 | Nordstrom | 4 | |
| Budget Car Rental | 3 | Office Depot | 6 | |
| Burger King | 8 | Old Navy | 3 | |
| Burlington Coat Factory | 1 | Olive Garden | 2 | |
| CVS | 26 | On The Border | 2 | |
| Cache | 2 | Outback | 2 | |
| CarMax | 1 | Outback Steakhouse | 2 | |
| Carl\s Jr. | 23 | Pac Sun | 3 | |
| Casual Male XL | 1 | Panda Express | 18 | |
| Catherines | 1 | Panera Bread | 5 | |
| Charlotte Russe | 4 | Papa John's Pizza | 14 | |
| Chevrolet | 3 | Payless | 12 | |
| Chick-Fil-A | 2 | Penske | 9 | |
| Chico's | 5 | PetSmart | 2 | |
| Chipotle | 6 | Pier 1 Imports | 3 | |
| Chuck E. Cheese's | 2 | Pizza Hut | 15 | |
| Church's Chicken | 4 | Popeyes | 4 | |
| Cinnabon | 1 | Pottery Barn | 2 | |
| Circle K | 8 | Pottery Barn Kids | 1 | |
| Clarks | 3 | Quality | 1 | |
| Cold Stone Creamery | 8 | Quiznos | 15 | |
| Comfort Inn | 5 | RadioShack | 18 | |
| Comfort Suites | 3 | Ramada | 6 | |
| Costco | 5 | Red Lobster | 2 | |
| Crate & Barrel | 2 | Red Robin | 2 | |
| Cricket Wireless | 39 | Red Roof Inn | 1 | |
| Curves | 10 | Rite Aid | 19 | |
| DHL | 16 | Rodeway Inn | 3 | |
| Dairy Queen | 4 | Ryder Rental & Truck Leasing | 1 | |
| Days Hotel | 1 | SAS Shoes | 3 | |
| Days Inn | 5 | Safeway | 20 | |
| Decora Cabinetry | 5 | Sears | 9 | |
| Dennys | 15 | Sephora | 3 | |
| Discount Tire | 9 | Sheraton | 3 | |
| Domino's Pizza | 14 | Skechers USA | 4 | |
| DressBarn | 1 | Spencer Gifts | 1 | |
| Dressbarn | 1 | Sprint Nextel | 25 | |
| Eddie Bauer | 2 | Staples | 3 | |
| El Pollo Loco | 10 | Starbucks | 83 | |
| Ethan Allen | 1 | Subaru | 1 | |
| Express | 4 | Subway | 60 | |
| Extended Stay America | 2 | Super 8 | 3 | |
| Famous Footwear | 1 | T-Mobile | 52 | |
| FedEx | 182 | T.G.I. Driday's | 4 | |
| Firestone Complete Auto Care | 6 | T.J.Maxx | 1 | |
| Foot Locker | 3 | Taco Bell | 22 | |
| Forever 21 | 4 | Talbots | 3 | |
| Fredericks Of Hollywood | 2 | Target | 6 | |
| GNC | 26 | The Cheesecake Factory | 1 | |
| GameStop | 18 | The Limited | 1 | |
| Gap | 4 | The Room Place | 1 | |
| Goodwill | 1 | Torrid | 1 | |
| Gymboree | 4 | Toyota | 3 | |
| H&M | 1 | Toys"R"Us | 4 | |
| H&R Block | 37 | Trader Joe's | 5 | |
| Haagen-Dazs | 1 | Travelodge | 2 | |
| Haworth | 2 | True Value | 2 | |
| Hawthorn | 1 | U-Haul | 25 | |
| Hilton | 22 | UPS | 210 | |
| Holiday Inn | 17 | Urban Outfitters | 3 | |
| Hollister Co. | 2 | Vans | 17 | |
| Home Depot | 8 | Verizon Wireless | 12 | |
| HomeTown Buffet | 4 | Victoria's Secret | 5 | |
| Homestead Studio Suites | 2 | Volkswagen | 2 | |
| Honda | 2 | Vons | 22 | |
| Hot Topic | 3 | Walgreens | 6 | |
| Howard Johnson | 3 | Walmart | 4 | |
| Hyatt | 5 | Wendy's | 13 | |
| IHOP | 10 | Westin | 2 | |
| IKEA | 1 | Wet Seal | 1 | |
| J. Jill | 1 | Whole Foods Market | 1 | |
| J.Crew | 2 | World Gym | 1 | |
| JCPenney | 1 | YMCA | 11 | |
| Jamba Juice | 17 | Z Gallerie | 1 | |
| Jimmy Jazz | 1 | |||
Strongest AM radio stations in San Diego:
- KFMB (760 AM; 50 kW; SAN DIEGO, CA; Owner: MIDWEST TELEVISION, INC.)
- KCBQ (1170 AM; 50 kW; SAN DIEGO, CA; Owner: RADIO 1210, INC.)
- KOGO (600 AM; 5 kW; SAN DIEGO, CA; Owner: CITICASTERS LICENSES, L.P.)
- KPOP (1360 AM; 5 kW; SAN DIEGO, CA; Owner: CITICASTERS LICENSES, L.P.)
- KURS (1040 AM; 5 kW; SAN DIEGO, CA; Owner: QUETZAL BILINGUAL COMMUNICATIONS INC)
- KSDO (1130 AM; 10 kW; SAN DIEGO, CA; Owner: HI-FAVOR BROADCASTING, LLC)
- KPRZ (1210 AM; 20 kW; SAN MARCOS, CA; Owner: RADIO 1210, INC.)
- KECR (910 AM; 5 kW; EL CAJON, CA; Owner: FAMILY STATIONS, INC.)
- KSON (1240 AM; 1 kW; SAN DIEGO, CA; Owner: JEFFERSON-PILOT COMMUNICATIONS COMPANY OF CALIFORNIA)
- KFI (640 AM; 50 kW; LOS ANGELES, CA; Owner: CAPSTAR TX LIMITED PARTNERSHIP)
- KPLS (830 AM; 50 kW; ORANGE, CA; Owner: CRN LICENSES, LLC)
- KLAC (570 AM; 50 kW; LOS ANGELES, CA; Owner: AMFM RADIO LICENSES, L.L.C.)
- KTNQ (1020 AM; 50 kW; LOS ANGELES, CA; Owner: KTNQ-AM LICENSE CORP.)
Strongest FM radio stations in San Diego:
- KPBS-FM (89.5 FM; SAN DIEGO, CA; Owner: THE BD. OF TRUSTEES, CALIFORNIA STATE UNIVERSITY)
- KLQV (102.9 FM; SAN DIEGO, CA; Owner: HBC LICENSE CORPORATION)
- KLNV (106.5 FM; SAN DIEGO, CA; Owner: HBC LICENSE CORPORATION)
- KSDS (88.3 FM; SAN DIEGO, CA; Owner: SAN DIEGO COMMUNITY COLLEGE DISTRICT)
- KGB-FM (101.5 FM; SAN DIEGO, CA; Owner: CITICASTERS LICENSES, L.P.)
- KSON-FM (97.3 FM; SAN DIEGO, CA; Owner: JEFFERSON-PILOT COMMUNICATIONS COMPANY OF CALIFORNIA)
- KIOZ (105.3 FM; SAN DIEGO, CA; Owner: CITICASTERS LICENSES, L.P.)
- KHTS-FM (93.3 FM; EL CAJON, CA; Owner: CITICASTERS LICENSES, L.P.)
- K210CL (89.9 FM; LEMON GROVE, CA; Owner: SANTA MONICA COMMUNITY COLLEGE DISTRICT)
- KBZT (94.9 FM; SAN DIEGO, CA; Owner: JEFFERSON-PILOT COMMUNICATIONS COMPANY OF CALIFORNIA)
- KIFM (98.1 FM; SAN DIEGO, CA; Owner: JEFFERSON-PILOT COMMUNICATIONS COMPANY OF CALIFORNIA)
- KYXY (96.5 FM; SAN DIEGO, CA; Owner: INFINITY RADIO OPERATIONS INC.)
- KOCL (95.7 FM; CARLSBAD, CA; Owner: CITICASTERS LICENSES, L.P.)
- KFMB-FM (100.7 FM; SAN DIEGO, CA; Owner: MIDWEST TELEVISION, INC.)
- KMYI (94.1 FM; SAN DIEGO, CA; Owner: CITICASTERS LICENSES, L.P.)
- KPLN (103.7 FM; SAN DIEGO, CA; Owner: INFINITY RADIO OPERATIONS INC.)
- KPRI-FM7 (102.1 FM; SAN DIEGO, CA; Owner: COMPASS RADIO OF SAN DIEGO, INC.)
- KWVE (107.9 FM; SAN CLEMENTE, CA; Owner: CALVARY CHAPEL OF COSTA MESA)
- KRTM (88.9 FM; TEMECULA, CA; Owner: PENFOLD COMMUNICATIONS, INC.)
- KLVJ (100.1 FM; JULIAN, CA; Owner: EDUCATIONAL MEDIA FOUNDATION)
TV broadcast stations around San Diego:
- K63EN (Channel 63; SAN DIEGO, CA; Owner: CIVIC LIGHT, INC.)
- KBOP-LP (Channel 25; SAN DIEGO, CA; Owner: COMMERCIAL BROADCASTING CORP.)
- K61GH (Channel 61; NATIONAL CITY, CA; Owner: TV-61 SAN DIEGO, INC.)
- KBNT-CA (Channel 17; SAN DIEGO, CA; Owner: ENTRAVISION HOLDINGS, L.L.C.)
- KFMB-TV (Channel 8; SAN DIEGO, CA; Owner: MIDWEST TELEVISION, INC.)
- KGTV (Channel 10; SAN DIEGO, CA; Owner: MCGRAW-HILL BROADCASTING COMPANY, INC.)
- K59AL (Channel 59; LA JOLLA, CA; Owner: BOARD OF TRUSTEES FOR SAN DIEGO UNIVERSITY)
- K35DG (Channel 35; LA JOLLA, CA; Owner: THE REGENTS OF THE UNIV. OF CALIFORNIA)
- KNSD-LP (Channel 62; LA JOLLA, CA; Owner: STATION VENTURE OPERATIONS, LP)
- KSWB-TV (Channel 69; SAN DIEGO, CA; Owner: KSWB INC.)
- KUSI-TV (Channel 51; SAN DIEGO, CA; Owner: CHANNEL 51 OF SAN DIEGO, INC.)
- KPBS (Channel 15; SAN DIEGO, CA; Owner: BOARD OF TRUSTEES FOR SAN DIEGO UNIV.)
- KNSD (Channel 39; SAN DIEGO, CA; Owner: STATION VENTURE OPERATIONS, LP)

- National Bridge Inventory (NBI) Statistics
- 1,376Number of bridges
- 24,980ft / 7,614mTotal length
- $39,180,000Total costs
- 72,665,377Total average daily traffic
- 2,883,978Total average daily truck traffic

- New bridges - historical statistics
- 21900-1909
- 61910-1919
- 71920-1929
- 131930-1939
- 361940-1949
- 1061950-1959
- 3881960-1969
- 4001970-1979
- 1561980-1989
- 1041990-1999
- 932000-2009
- 632010-2019
- 22020-2022
FCC Registered Antenna Towers: 2,229 (See the full list of FCC Registered Antenna Towers)
FCC Registered Commercial Land Mobile Towers: 48 (See the full list of FCC Registered Commercial Land Mobile Towers in San Diego, CA)
FCC Registered Private Land Mobile Towers: 76 (See the full list of FCC Registered Private Land Mobile Towers)
FCC Registered Broadcast Land Mobile Towers: 798 (See the full list of FCC Registered Broadcast Land Mobile Towers)
FCC Registered Microwave Towers: 1,088 (See the full list of FCC Registered Microwave Towers in this town)
FCC Registered Paging Towers: 134 (See the full list of FCC Registered Paging Towers)
FCC Registered Maritime Coast & Aviation Ground Towers: 190 (See the full list of FCC Registered Maritime Coast & Aviation Ground Towers)
FCC Registered Amateur Radio Licenses: 8,035 (See the full list of FCC Registered Amateur Radio Licenses in San Diego)
FAA Registered Aircraft Manufacturers and Dealers: 33 (See the full list of FAA Registered Manufacturers and Dealers in San Diego)
FAA Registered Aircraft: 852 (See the full list of FAA Registered Aircraft)
| Home Mortgage Disclosure Act Aggregated Statistics For Year 2009 (Based on 259 full and 19 partial tracts) | ||||||||||||||
| A) FHA, FSA/RHS & VA Home Purchase Loans | B) Conventional Home Purchase Loans | C) Refinancings | D) Home Improvement Loans | E) Loans on Dwellings For 5+ Families | F) Non-occupant Loans on < 5 Family Dwellings (A B C & D) | G) Loans On Manufactured Home Dwelling (A B C & D) | ||||||||
|---|---|---|---|---|---|---|---|---|---|---|---|---|---|---|
| Number | Average Value | Number | Average Value | Number | Average Value | Number | Average Value | Number | Average Value | Number | Average Value | Number | Average Value | |
| LOANS ORIGINATED | 4,241 | $298,851 | 7,190 | $343,625 | 24,606 | $339,619 | 880 | $240,882 | 113 | $2,032,115 | 3,247 | $289,373 | 44 | $210,480 |
| APPLICATIONS APPROVED, NOT ACCEPTED | 524 | $291,433 | 1,069 | $333,241 | 2,698 | $358,993 | 122 | $197,988 | 3 | $708,710 | 485 | $275,094 | 27 | $65,002 |
| APPLICATIONS DENIED | 778 | $282,665 | 1,675 | $325,414 | 7,614 | $367,539 | 414 | $174,674 | 31 | $857,605 | 1,500 | $284,800 | 54 | $104,500 |
| APPLICATIONS WITHDRAWN | 746 | $299,292 | 1,413 | $357,313 | 4,875 | $356,818 | 177 | $209,582 | 9 | $2,214,667 | 797 | $291,227 | 7 | $232,951 |
| FILES CLOSED FOR INCOMPLETENESS | 175 | $281,689 | 248 | $326,084 | 1,329 | $362,198 | 62 | $171,689 | 1 | $540,000 | 189 | $265,900 | 6 | $92,102 |
Detailed mortgage data for all 281 tracts in San Diego, CA
| Private Mortgage Insurance Companies Aggregated Statistics For Year 2009 (Based on 227 full and 19 partial tracts) | ||||||
| A) Conventional Home Purchase Loans | B) Refinancings | C) Non-occupant Loans on < 5 Family Dwellings (A & B) | ||||
|---|---|---|---|---|---|---|
| Number | Average Value | Number | Average Value | Number | Average Value | |
| LOANS ORIGINATED | 641 | $296,075 | 172 | $353,948 | 14 | $215,269 |
| APPLICATIONS APPROVED, NOT ACCEPTED | 268 | $306,394 | 106 | $378,179 | 19 | $223,480 |
| APPLICATIONS DENIED | 154 | $287,987 | 62 | $360,941 | 5 | $224,600 |
| APPLICATIONS WITHDRAWN | 62 | $320,923 | 27 | $394,021 | 0 | $0 |
| FILES CLOSED FOR INCOMPLETENESS | 29 | $279,269 | 8 | $357,876 | 6 | $287,833 |


2005 - 2018 National Fire Incident Reporting System (NFIRS) incidents
- Fire incident types reported to NFIRS in San Diego, CA
- 8,57740.3%Structure Fires
- 7,16533.7%Outside Fires
- 4,39520.7%Mobile Property/Vehicle Fires
- 1,1455.4%Other
 Based on the data from the years 2005 - 2018 the average number of fires per year is 1520. The highest number of fire incidents - 2,611 took place in 2010, and the least - 42 in 2006. The data has a growing trend.
 When looking into fire subcategories, the most reports belonged to: Structure Fires (40.3%), and Outside Fires (33.7%).
Fire-safe hotels and motels in San Diego, California:
- Doubletree By Hilton San Diego Downtown, 1646 Front St, San Diego, California 92101 , Phone: (619) 239-6800, Fax: (619) 238-9543
- Seacoast Suites, 4760 MSN Blvd, San Diego, California 92109 , Phone: (619) 483-6780
- Best Western Inn Miramar, 9310 Kearny Mesa Rd, San Diego, California 92126 , Phone: (858) 578-6600, Fax: (858) 536-1368
- The Westin San Diego Gas Lamp Quarter, 910 Broadway Cir, San Diego, California 92101 , Phone: (619) 239-2200, Fax: (619) 239-0509
- Kona Kai Resort, 1551 Shelter Island Dr, San Diego, California 92106 , Phone: (619) 221-8000, Fax: (619) 819-8129
- Hilton San Diego Airport/Harbor Island, 1960 Hbr Island Dr, San Diego, California 92101 , Phone: (619) 291-6700, Fax: (619) 293-0689
- U S Suites In Del Mar, 12582 Carmel CRK, San Diego, California 92130 , Phone: (619) 554-0300
- Wyndham San Diego Bayside, 1355 N Habor Dr, San Diego, California 92101 , Phone: (619) 232-3861, Fax: (213) 235-0117
- 153 other hotels and motels
| Most common first names in San Diego, CA among deceased individuals | ||
| Name | Count | Lived (average) |
|---|---|---|
| John | 5,181 | 73.8 years |
| Mary | 4,344 | 79.8 years |
| William | 4,293 | 74.2 years |
| Robert | 3,933 | 70.4 years |
| James | 3,376 | 71.1 years |
| Charles | 2,556 | 74.6 years |
| George | 2,493 | 75.5 years |
| Helen | 2,181 | 80.4 years |
| Joseph | 2,150 | 75.2 years |
| Margaret | 2,023 | 80.0 years |
| Most common last names in San Diego, CA among deceased individuals | ||
| Last name | Count | Lived (average) |
|---|---|---|
| Smith | 1,856 | 75.1 years |
| Johnson | 1,416 | 75.4 years |
| Brown | 1,044 | 75.1 years |
| Williams | 977 | 73.3 years |
| Jones | 964 | 73.5 years |
| Miller | 883 | 76.2 years |
| Anderson | 827 | 76.8 years |
| Davis | 719 | 73.1 years |
| Wilson | 639 | 75.5 years |
| Taylor | 584 | 73.5 years |

- 64.2%Utility gas
- 25.8%Electricity
- 4.9%No fuel used
- 3.5%Solar energy
- 1.1%Bottled, tank, or LP gas
- 0.3%Wood
- 0.2%Other fuel

- 51.0%Electricity
- 37.6%Utility gas
- 9.2%No fuel used
- 1.3%Bottled, tank, or LP gas
- 0.5%Solar energy
- 0.1%Other fuel
- 0.1%Wood
San Diego compared to California state average:
- Unemployed percentage significantly below state average.
- Percentage of population with a bachelor's degree or higher above state average.
San Diego, CA compared to other similar cities:
San Diego on our top lists:
- #12 on the list of "Top 100 biggest cities"
- #12 on the list of "Top 101 biggest cities in 2013"
- #14 on the list of "Top 101 cities with the smallest differences between daily high and daily low temperatures (population 50,000+)"
- #22 on the list of "Top 101 cities with the largest percentage of people in military ships (population 1,000+)"
- #23 on the list of "Top 101 cities with the largest percentage of likely gay men couples (counted as self-reported male-male unmarried-partner households) (population 50,000+)"
- #23 on the list of "Top 101 cities with the most mentions on city-data.com forum"
- #25 on the list of "Top 101 cities with the smallest differences between morning and afternoon humidity (population 50,000+)"
- #25 on the list of "Top 101 cities with the smallest humidity differences during a year (population 50,000+)"
- #25 on the list of "Top 101 cities with the largest percentage of people in wards in military hospitals for patients who have no usual home elsewhere (population 1,000+)"
- #26 on the list of "Top 101 cities with the largest percentage of people in military disciplinary barracks (population 1,000+)"
- #29 on the list of "Top 100 cities with largest land areas (pop. 50,000+)"
- #32 on the list of "Top 101 cities with the largest percentage of likely homosexual households (counted as self-reported same-sex unmarried-partner households) (population 50,000+)"
- #33 on the list of "Top 101 cities with the lowest average snowfall in a year (population 50,000+)"
- #37 on the list of "Top 101 cities with the largest percentage of people in crews of maritime vessels (population 1,000+)"
- #44 on the list of "Top 101 cities with the smallest temperature differences during a year (population 50,000+)"
- #57 on the list of "Top 100 cities with the largest percentage of males (pop. 50,000+)"
- #58 on the list of "Top 101 cities with the lowest average yearly precipitation (population 50,000+)"
- #58 on the list of "Top 101 cities with the highest cost per building permit(population 50,000+)"
- #62 on the list of "Top 101 cities with largest percentage of males in occupations: life, physical, and social science occupations (population 50,000+)"
- #62 on the list of "Top 100 most racially diverse cities (pop. 50,000+)"
- #1 (92101) on the list of "Top 101 zip codes with the most offices of lawyers in 2005"
- #1 (92101) on the list of "Top 101 zip codes with the most museums in 2005"
- #14 (92108) on the list of "Top 101 zip codes with the most finance and insurance companies in 2005"
- #17 (92101) on the list of "Top 101 zip codes with the most full service restaurants in 2005"
- #24 (92101) on the list of "Top 101 zip codes with the most hotels or motels in 2005"
- #25 (92101) on the list of "Top 101 zip codes with the most medium-big companies in 2005 (at least 100 employees)"
- #30 (92037) on the list of "Top 101 zip codes with the most offices of physicians in 2005"
- #30 (92123) on the list of "Top 101 zip codes with the most Internet business establishments in 2005"
- #33 (92123) on the list of "Top 101 zip codes with the most big companies in 2005 (at least 1000 employees)"
- #44 (92173) on the list of "Top 101 zip codes with the largest percentage of Danish first ancestries (pop 5,000+)"
- #56 (92173) on the list of "Top 101 zip codes with the lowest charity contributions deductions as a percentage of AGI in 2012 (pop 5,000+)"
- #65 (92101) on the list of "Top 101 zip codes with the most alcohol drinking places in 2005"
- #72 (92103) on the list of "Top 101 zip codes with the most beauty salons in 2005"
- #101 (92105) on the list of "Top 101 zip codes with the largest percentage of Subsaharan African first ancestries (pop 5,000+)"
- #4 on the list of "Top 101 counties with the most Catholic adherents"
- #4 on the list of "Top 101 counties with the highest lead air pollution readings in 2012 (µg/m3)"
- #7 on the list of "Top 101 counties with the most Evangelical Protestant congregations"
- #7 on the list of "Top 101 counties with the most Catholic congregations"
- #7 on the list of "Top 101 counties with the highest surface withdrawal of fresh water for public supply (pop. 50,000+)"
State forum archive:
- California Pages: 2 3 4 5 6 7 8 9 10 11 12 13 14 15 16 17 18 19 20 21 22 23 24 25 26 27 28 29 30 31 32 33 34 35 36 37 38 39 40 41 42 43 44 45 46 47 48 49 50 51 52 53 54 55 56 57 58 59 60 61 62 63 64 65 66 67 68 69 70 71 72 73 74 75 76 77 78 79
- Los Angeles Pages: 2 3 4 5 6 7 8 9 10 11 12 13 14 15 16 17 18 19 20 21 22 23 24 25 26 27 28 29 30 31 32 33 34 35 36 37 38 39 40 41 42 43 44 45 46 47 48 49 50 51 52 53 54 55 56 57 58 59 60 61 62 63 64 65 66 67 68 69 70 71 72 73 74 75 76 77 78 79 80 81 82 83 84 85 86 87 88 89 90 91 92 93 94 95 96 97 98 99 100 101 102 103 104 105 106 107 108 109 110 111 112 113 114 115 116 117 118 119 120 121 122 123
- Monterey County Pages: 2 3
- Orange County Pages: 2 3 4 5 6 7 8 9 10 11 12 13 14 15 16 17 18 19 20 21 22 23 24 25 26 27 28 29 30 31 32 33 34 35 36
- Sacramento Pages: 2 3 4 5 6 7 8 9 10 11 12 13 14 15 16 17 18 19 20 21 22 23 24 25 26 27 28 29 30 31 32
- San Bernardino and Riverside Counties Pages: 2 3 4 5 6 7 8 9 10 11 12 13 14 15 16 17 18 19 20 21 22 23
- San Diego Pages: 2 3 4 5 6 7 8 9 10 11 12 13 14 15 16 17 18 19 20 21 22 23 24 25 26 27 28 29 30 31 32 33 34 35 36 37 38 39 40 41 42 43 44 45 46 47 48 49 50 51 52 53 54 55 56 57 58 59 60 61 62 63 64 65 66 67 68 69 70 71 72 73 74 75 76
- San Francisco - Oakland Pages: 2 3 4 5 6 7 8 9 10 11 12 13 14 15 16 17 18 19 20 21 22 23 24 25 26 27 28 29 30 31 32 33 34 35 36 37 38 39 40 41 42 43 44 45 46 47 48 49 50 51 52 53 54 55 56 57 58 59 60 61 62 63 64 65 66 67 68 69 70 71 72
- San Jose Pages: 2 3 4 5 6 7 8 9 10 11 12 13 14 15 16 17 18 19 20 21 22 23 24
- Ventura County Pages: 2 3 4 5 6 7

|
|
Total of 48877 patent applications in 2008-2024.
