Schererville, Indiana
Submit your own pictures of this town and show them to the world
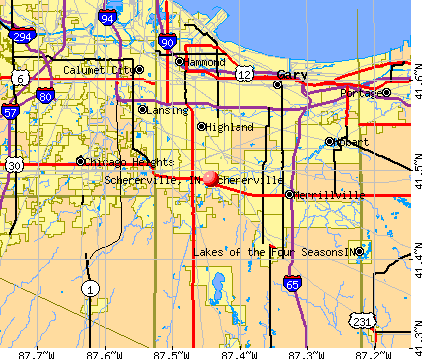
- OSM Map
- General Map
- Google Map
- MSN Map
Population change since 2000: +19.4%
 |
| Males: 14,430 | |
| Females: 15,238 |
| Median resident age: | 43.5 years |
| Indiana median age: | 38.2 years |
Zip codes: 46375.
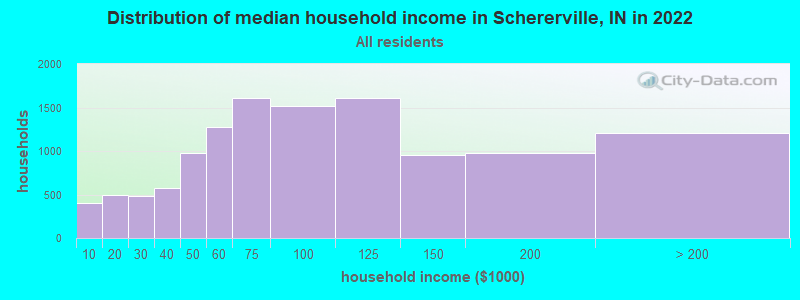
| Schererville: | $79,314 |
| IN: | $66,785 |
Estimated per capita income in 2022: $43,588 (it was $28,528 in 2000)
Schererville town income, earnings, and wages data
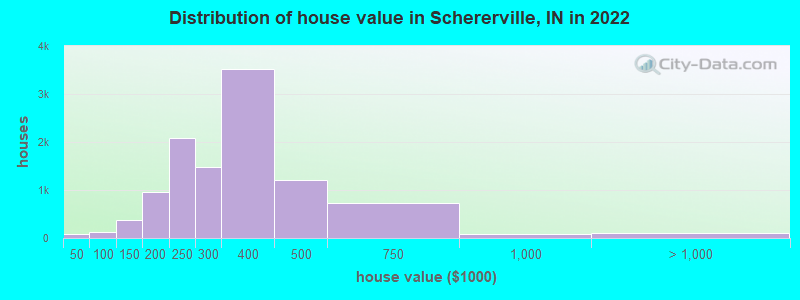
Estimated median house or condo value in 2022: $324,468 (it was $155,400 in 2000)
| Schererville: | $324,468 |
| IN: | $208,700 |
Mean prices in 2022: all housing units: $338,911; detached houses: $380,950; townhouses or other attached units: $245,711; in 2-unit structures: $198,754; in 3-to-4-unit structures: $262,145; in 5-or-more-unit structures: $116,571; mobile homes: $11,897
Median gross rent in 2022: $1,145.
(4.4% for White Non-Hispanic residents, 20.0% for Black residents, 8.1% for Hispanic or Latino residents, 25.5% for American Indian residents, 12.6% for two or more races residents)
Detailed information about poverty and poor residents in Schererville, IN

Compare current foreclosures in Schererville, IN:
| Photo | Address | Area | Beds / Baths | Price | Details |
|---|---|---|---|---|---|

|
#1
Divac Dr
Schererville, IN 46375
|
2,624 sq. feet
|
2 baths 3 beds |
show details | |

|
#2
Ticonderoga St
Schererville, IN 46375
|
1,996 sq. feet
|
2 baths 4 beds |
show details | |

|
#3
Pershing Ct
Schererville, IN 46375
|
2,504 sq. feet
|
2 baths 3 beds |
show details | |

|
#4
Kennedy Ave
Schererville, IN 46375
|
1,122 sq. feet
|
2 baths 6 beds |
show details | |

|
#5
Jordan Cir
Schererville, IN 46375
|
1,344 sq. feet
|
2 baths 2 beds |
show details | |

|
#6
W Joliet St
Schererville, IN 46375
|
2,280 sq. feet
|
1 baths 2 beds |
show details | |

|
#7
Iroquois St
Schererville, IN 46375
|
2,058 sq. feet
|
2 baths 4 beds |
show details | |

|
#8
Heather Ct
Schererville, IN 46375
|
2,700 sq. feet
|
1 baths 3 beds |
show details | |

|
#9
W 75th Ave
Schererville, IN 46375
|
3,230 sq. feet
|
2 baths 4 beds |
show details | |

|
#10
Bristol Ln
Schererville, IN 46375
|
1,378 sq. feet
|
1 baths 2 beds |
show details |
| Photo | Address | Area | Beds / Baths | Price | Details |
|---|---|---|---|---|---|

|
#11
Jarrett Dr
Schererville, IN 46375
|
5,045 sq. feet
|
2 baths 4 beds |
show details | |

|
#12
Bell St
Schererville, IN 46375
|
3,916 sq. feet
|
2 baths 3 beds |
show details | |

|
#13
Dove Dr
Schererville, IN 46375
|
4,553 sq. feet
|
2 baths 4 beds |
show details | |

|
#14
E Joliet St
Schererville, IN 46375
|
3,026 sq. feet
|
2 baths 3 beds |
show details | |

|
#15
E Wilhelm St
Schererville, IN 46375
|
1,908 sq. feet
|
1 baths 3 beds |
show details | |

|
#16
Harvest Dr
Schererville, IN 46375
|
2,811 sq. feet
|
2 baths 4 beds |
show details | |

|
#17
Starling Dr
Schererville, IN 46375
|
3,076 sq. feet
|
3 baths 3 beds |
show details | |

|
#18
Genoa Ct
Schererville, IN 46375
|
2,126 sq. feet
|
2 baths 3 beds |
show details | |

|
#19
Bristol Ln
Schererville, IN 46375
|
1,161 sq. feet
|
1 baths 2 beds |
show details | |

|
#20
Starling Dr
Schererville, IN 46375
|
3,534 sq. feet
|
3 baths 4 beds |
show details |
| Photo | Address | Area | Beds / Baths | Price | Details |
|---|---|---|---|---|---|

|
#21
Durbin St
Schererville, IN 46375
|
1,146 sq. feet
|
1 baths 3 beds |
show details | |

|
#22
Gull Dr
Schererville, IN 46375
|
2,247 sq. feet
|
3 baths 4 beds |
show details | |

|
#23
Friar Tuck Dr
Schererville, IN 46375
|
2,065 sq. feet
|
1 baths 3 beds |
show details | |

|
#24
Saint John Rd
Schererville, IN 46375
|
2,210 sq. feet
|
2 baths 4 beds |
show details | |

|
#25
Wilderness Dr
Schererville, IN 46375
|
6,120 sq. feet
|
3 baths 4 beds |
show details | |

|
#26
Barbara Jean Dr
Schererville, IN 46375
|
2,002 sq. feet
|
2 baths 2 beds |
show details | |

|
#27
Pulaski St
Schererville, IN 46375
|
3,426 sq. feet
|
3 baths 4 beds |
show details | |

|
#28
Scherland Dr
Schererville, IN 46375
|
1,448 sq. feet
|
1 baths 3 beds |
show details | |

|
#29
Bell St
Schererville, IN 46375
|
3,874 sq. feet
|
2 baths 4 beds |
show details | |

|
#30
73rd Ave
Schererville, IN 46375
|
2,707 sq. feet
|
2 baths 4 beds |
show details |
| Photo | Address | Area | Beds / Baths | Price | Details |
|---|---|---|---|---|---|

|
#31
Swan Ln
Schererville, IN 46375
|
2,712 sq. feet
|
2 baths 2 beds |
show details | |

|
#32
Hartley Dr
Schererville, IN 46375
|
3,072 sq. feet
|
3 baths 4 beds |
show details | |

|
#33
Carnoustie Ln # 142
Schererville, IN 46375
|
4,260 sq. feet
|
2 baths 2 beds |
show details | |

|
#34
Wildrose Ln
Schererville, IN 46375
|
3,414 sq. feet
|
2 baths 3 beds |
show details | |

|
#35
Cheyenne Dr
Schererville, IN 46375
|
3,674 sq. feet
|
2 baths 3 beds |
show details | |

|
#36
Sherwood Lake Dr, Apt 2
Schererville, IN 46375
|
- sq. feet
|
- baths - beds |
show details | |

|
#37
Pine Ct Apt 1
Schererville, IN 46375
|
- sq. feet
|
- baths - beds |
show details | |

|
#38
Nature View Dr
Schererville, IN 46375
|
- sq. feet
|
- baths - beds |
show details | |

|
#39
Inverness Ln
Schererville, IN 46375
|
- sq. feet
|
- baths - beds |
show details | |

|
#40
Janice Dr
Schererville, IN 46375
|
- sq. feet
|
- baths - beds |
show details |
| Photo | Address | Area | Beds / Baths | Price | Details |
|---|---|---|---|---|---|

|
#41
Mcintosh Ln
Schererville, IN 46375
|
- sq. feet
|
- baths - beds |
show details | |

|
#42
Moraine Trce Apt 1
Schererville, IN 46375
|
- sq. feet
|
- baths - beds |
show details | |

|
#43
Austin Ave Apt 14
Schererville, IN 46375
|
- sq. feet
|
- baths - beds |
show details | |

|
#44
Plum Creek Dr
Schererville, IN 46375
|
- sq. feet
|
- baths - beds |
show details | |

|
#45
E Joliet St Apt 11
Schererville, IN 46375
|
- sq. feet
|
- baths - beds |
show details | |

|
#46
Deerpath Dr Apt 204
Schererville, IN 46375
|
- sq. feet
|
- baths - beds |
show details | |

|
#47
Homan Dr Apt 203
Schererville, IN 46375
|
- sq. feet
|
- baths - beds |
show details | |

|
Check over 1 million property listings on Foreclosure.com!
|
browse all offers | |||


- 20,32768.5%White alone
- 4,69015.8%Hispanic
- 2,2987.7%Black alone
- 1,0573.6%Asian alone
- 1,0403.5%Two or more races
- 500.2%American Indian alone
- 660.2%Other race alone
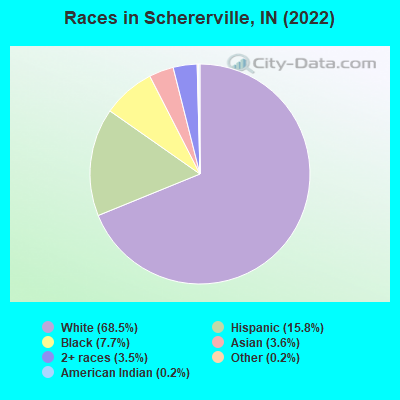
Races in Schererville detailed stats: ancestries, foreign born residents, place of birth
Type |
2009 |
2010 |
2011 |
2012 |
2013 |
2014 |
2019 |
2020 |
2021 |
2022 |
|---|---|---|---|---|---|---|---|---|---|---|
| Murders (per 100,000) | 0 (0.0) | 0 (0.0) | 1 (3.4) | 1 (3.4) | 0 (0.0) | 0 (0.0) | 0 (0.0) | 1 (3.5) | 1 (3.5) | 0 (0.0) |
| Rapes (per 100,000) | 1 (3.4) | 2 (6.8) | 1 (3.4) | 1 (3.4) | 1 (3.6) | 0 (0.0) | 2 (7.0) | 2 (7.0) | 4 (14.0) | 5 (16.9) |
| Robberies (per 100,000) | 13 (44.3) | 7 (23.9) | 7 (23.8) | 4 (13.6) | 9 (32.1) | 0 (0.0) | 3 (10.6) | 3 (10.5) | 5 (17.5) | 1 (3.4) |
| Assaults (per 100,000) | 7 (23.8) | 6 (20.5) | 4 (13.6) | 1 (3.4) | 10 (35.6) | 4 (13.8) | 3 (10.6) | 9 (31.6) | 16 (56.1) | 10 (33.8) |
| Burglaries (per 100,000) | 82 (279.3) | 47 (160.7) | 50 (170.1) | 25 (85.3) | 53 (188.9) | 11 (38.0) | 17 (59.8) | 18 (63.3) | 17 (59.6) | 19 (64.1) |
| Thefts (per 100,000) | 655 (2,231) | 672 (2,298) | 696 (2,368) | 321 (1,095) | 589 (2,100) | 129 (445.5) | 266 (936.2) | 423 (1,487) | 463 (1,623) | 355 (1,198) |
| Auto thefts (per 100,000) | 60 (204.4) | 47 (160.7) | 33 (112.3) | 8 (27.3) | 32 (114.1) | 6 (20.7) | 11 (38.7) | 21 (73.8) | 25 (87.6) | 18 (60.8) |
| Arson (per 100,000) | 0 (0.0) | 0 (0.0) | 0 (0.0) | 0 (0.0) | 1 (3.6) | 0 (0.0) | 1 (3.5) | 1 (3.5) | 0 (0.0) | 0 (0.0) |
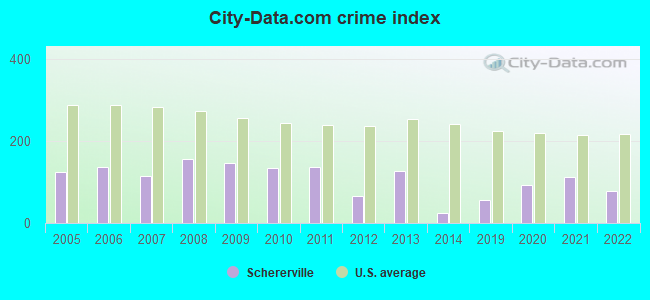
| City-Data.com crime index | 145.9 | 132.8 | 135.0 | 66.3 | 125.9 | 24.9 | 55.6 | 91.9 | 110.8 | 78.5 |
The City-Data.com crime index weighs serious crimes and violent crimes more heavily. Higher means more crime, U.S. average is 246.1. It adjusts for the number of visitors and daily workers commuting into cities.
Crime rate in Schererville detailed stats: murders, rapes, robberies, assaults, burglaries, thefts, arson
Full-time law enforcement employees in 2020, including police officers: 67 (52 officers - 50 male; 2 female).
| Officers per 1,000 residents here: | 1.83 |
| Indiana average: | 2.12 |
 Recent articles from our blog. Our writers, many of them Ph.D. graduates or candidates, create easy-to-read articles on a wide variety of topics.

 | Schererville/St. John - neighborhoods (5 replies) |
| Possible relocation due to job (11 replies) |
| NWI vs. Indy (35 replies) |
| Schererville, St. john, or Dyer? (5 replies) |
| How will the renovated Strack & Van Til do against Whole Foods in Schererville? (16 replies) |
| Looking to buy a home in NWI need opinions!! (4 replies) |
Latest news from Schererville, IN collected exclusively by city-data.com from local newspapers, TV, and radio stations
Ancestries: Polish (12.8%), German (6.7%), Serbian (5.8%), American (4.6%), Irish (3.4%), Italian (3.4%).
Current Local Time: CST time zone
Elevation: 626 feet
Land area: 13.6 square miles.
Population density: 2,180 people per square mile (low).
3,371 residents are foreign born (4.4% Europe, 4.1% Asia, 1.4% Latin America).
| This town: | 11.4% |
| Indiana: | 5.6% |
Median real estate property taxes paid for housing units with mortgages in 2022: $2,689 (0.8%)
Median real estate property taxes paid for housing units with no mortgage in 2022: $2,649 (0.8%)
Nearest city with pop. 50,000+: Gary, IN  (8.1 miles , pop. 102,746).
Nearest city with pop. 200,000+: Chicago, IL (27.2 miles , pop. 2,896,016).
Nearest cities:
), Latitude: 41.49 N, Longitude: 87.44 W
Daytime population change due to commuting: -1,992 (-6.7%)
Workers who live and work in this town: 4,071 (26.8%)
Area code commonly used in this area: 219
Schererville, Indiana accommodation & food services, waste management - Economy and Business Data
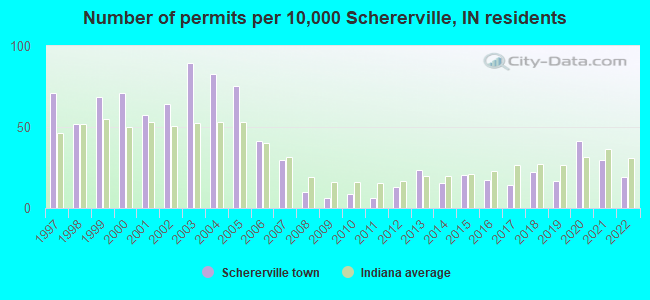
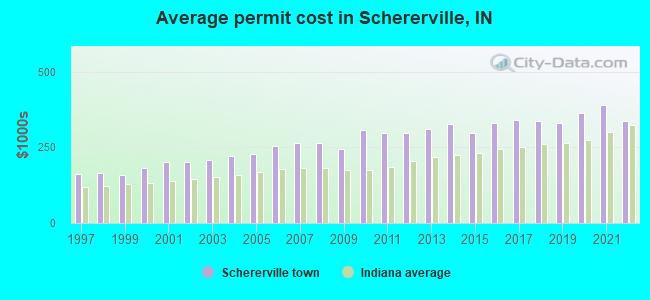
Single-family new house construction building permits:
- 2022: 48 buildings, average cost: $337,900
- 2021: 73 buildings, average cost: $390,200
- 2020: 103 buildings, average cost: $364,000
- 2019: 42 buildings, average cost: $331,600
- 2018: 55 buildings, average cost: $338,200
- 2017: 36 buildings, average cost: $339,900
- 2016: 43 buildings, average cost: $331,900
- 2015: 50 buildings, average cost: $297,500
- 2014: 38 buildings, average cost: $327,400
- 2013: 58 buildings, average cost: $310,700
- 2012: 32 buildings, average cost: $296,600
- 2011: 16 buildings, average cost: $297,200
- 2010: 22 buildings, average cost: $305,700
- 2009: 15 buildings, average cost: $245,800
- 2008: 24 buildings, average cost: $266,300
- 2007: 73 buildings, average cost: $266,300
- 2006: 103 buildings, average cost: $255,400
- 2005: 187 buildings, average cost: $228,600
- 2004: 206 buildings, average cost: $219,700
- 2003: 222 buildings, average cost: $209,400
- 2002: 159 buildings, average cost: $199,800
- 2001: 143 buildings, average cost: $200,100
- 2000: 176 buildings, average cost: $182,200
- 1999: 171 buildings, average cost: $156,600
- 1998: 129 buildings, average cost: $164,000
- 1997: 177 buildings, average cost: $162,600
| Here: | 3.4% |
| Indiana: | 2.8% |
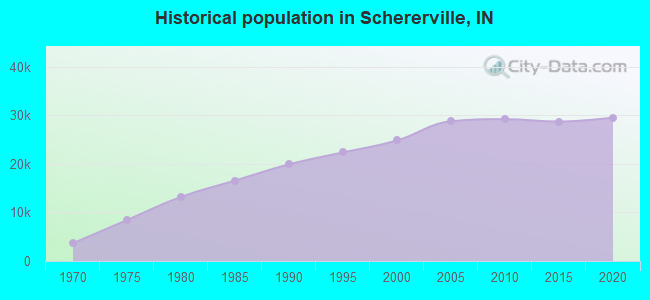
Population change in the 1990s: +5,706 (+29.8%).
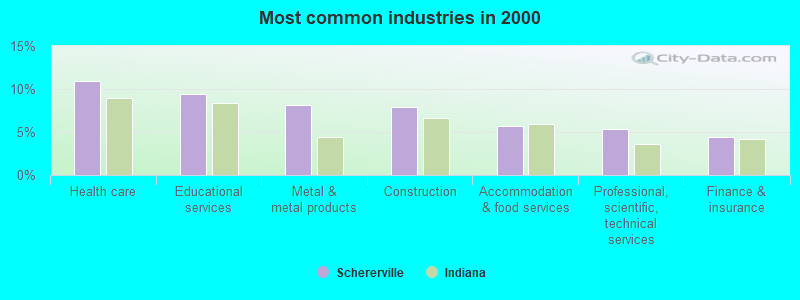
- Health care (11.0%)
- Educational services (9.4%)
- Metal & metal products (8.1%)
- Construction (7.9%)
- Accommodation & food services (5.6%)
- Professional, scientific, technical services (5.4%)
- Finance & insurance (4.4%)
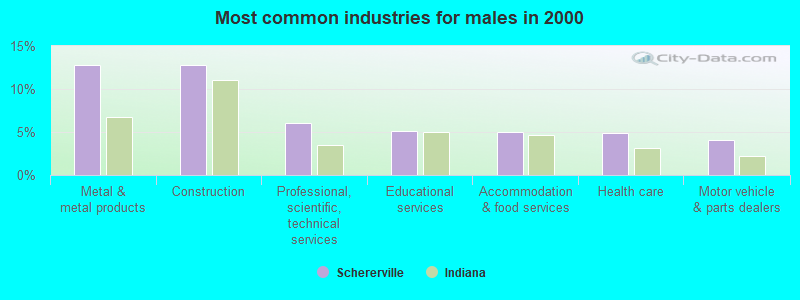
- Metal & metal products (12.8%)
- Construction (12.8%)
- Professional, scientific, technical services (6.1%)
- Educational services (5.1%)
- Accommodation & food services (5.0%)
- Health care (4.9%)
- Motor vehicle & parts dealers (4.0%)
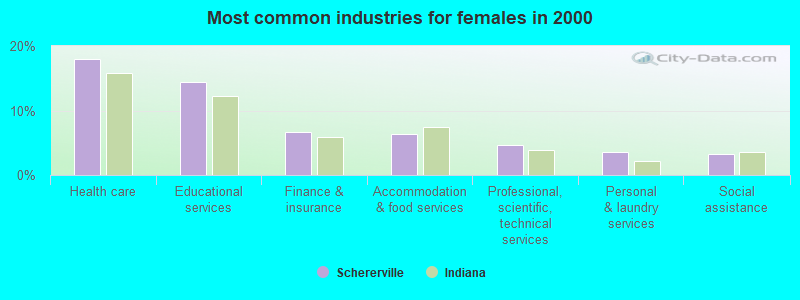
- Health care (18.0%)
- Educational services (14.4%)
- Finance & insurance (6.6%)
- Accommodation & food services (6.4%)
- Professional, scientific, technical services (4.6%)
- Personal & laundry services (3.5%)
- Social assistance (3.2%)
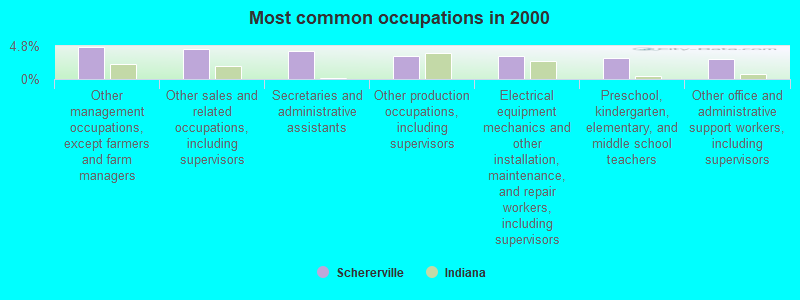
- Other management occupations, except farmers and farm managers (4.7%)
- Other sales and related occupations, including supervisors (4.3%)
- Secretaries and administrative assistants (4.0%)
- Other production occupations, including supervisors (3.3%)
- Electrical equipment mechanics and other installation, maintenance, and repair workers, including supervisors (3.3%)
- Preschool, kindergarten, elementary, and middle school teachers (3.1%)
- Other office and administrative support workers, including supervisors (3.0%)
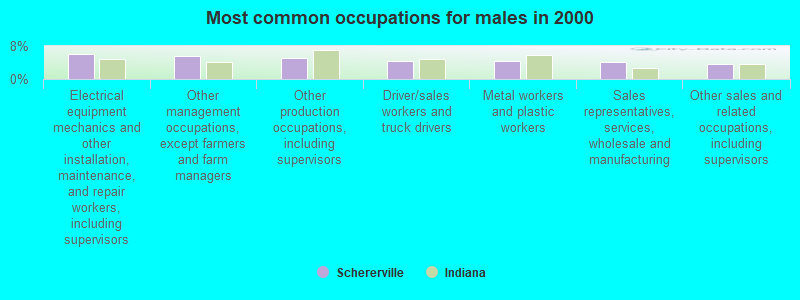
- Electrical equipment mechanics and other installation, maintenance, and repair workers, including supervisors (6.2%)
- Other management occupations, except farmers and farm managers (5.5%)
- Other production occupations, including supervisors (5.1%)
- Driver/sales workers and truck drivers (4.4%)
- Metal workers and plastic workers (4.3%)
- Sales representatives, services, wholesale and manufacturing (4.1%)
- Other sales and related occupations, including supervisors (3.6%)

- Secretaries and administrative assistants (8.8%)
- Registered nurses (5.8%)
- Other sales and related occupations, including supervisors (5.2%)
- Preschool, kindergarten, elementary, and middle school teachers (4.9%)
- Other office and administrative support workers, including supervisors (4.8%)
- Other management occupations, except farmers and farm managers (3.7%)
- Retail sales workers, except cashiers (3.5%)
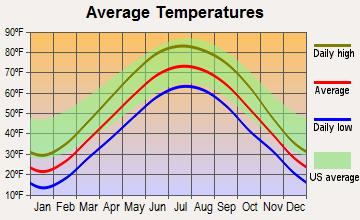
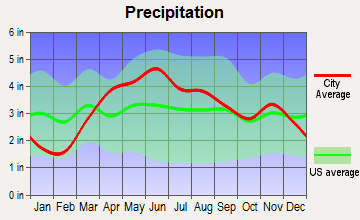
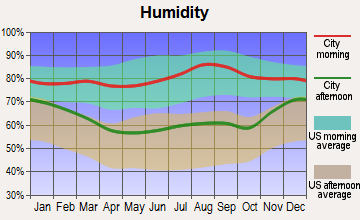
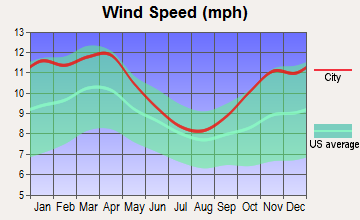
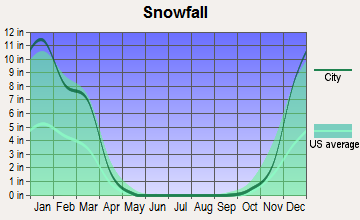
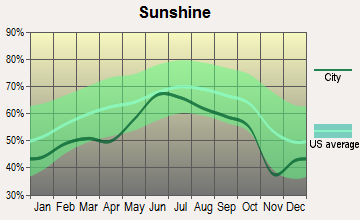
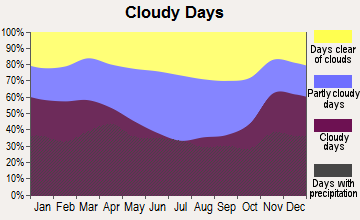
Average climate in Schererville, Indiana
Based on data reported by over 4,000 weather stations
|
|

(lower is better)
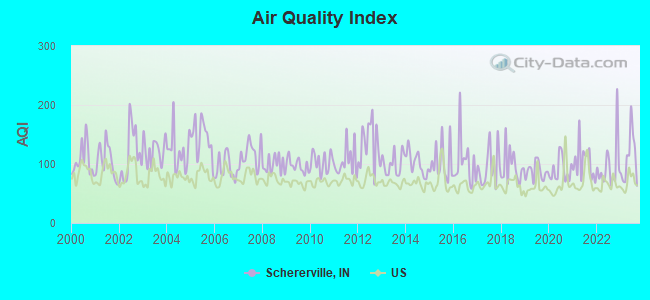
Air Quality Index (AQI) level in 2023 was 110. This is significantly worse than average.
| City: | 110 |
| U.S.: | 73 |

Carbon Monoxide (CO) [ppm] level in 2023 was 0.339. This is worse than average. Closest monitor was 8.3 miles away from the city center.
| City: | 0.339 |
| U.S.: | 0.251 |
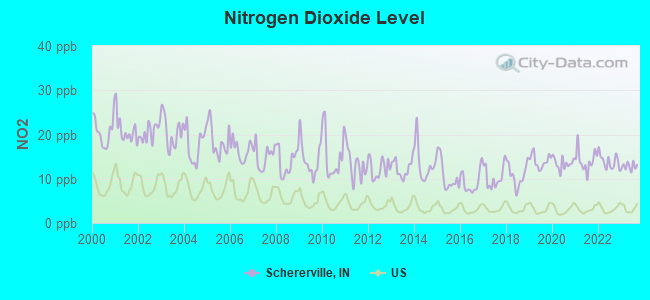
Nitrogen Dioxide (NO2) [ppb] level in 2023 was 12.8. This is significantly worse than average. Closest monitor was 6.7 miles away from the city center.
| City: | 12.8 |
| U.S.: | 5.1 |
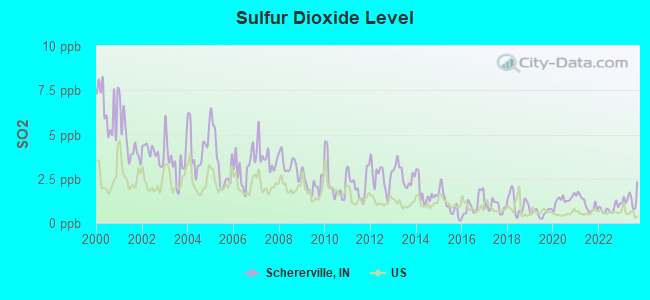
Sulfur Dioxide (SO2) [ppb] level in 2023 was 1.34. This is about average. Closest monitor was 6.7 miles away from the city center.
| City: | 1.34 |
| U.S.: | 1.51 |
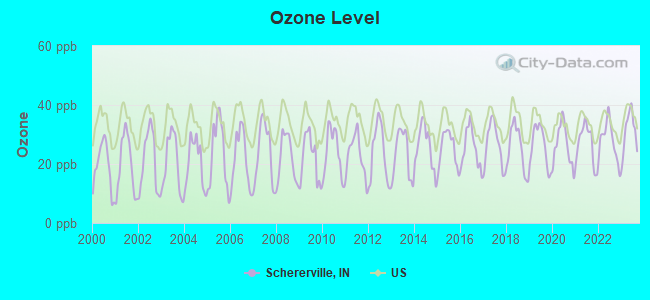
Ozone [ppb] level in 2023 was 31.0. This is about average. Closest monitor was 8.3 miles away from the city center.
| City: | 31.0 |
| U.S.: | 33.3 |
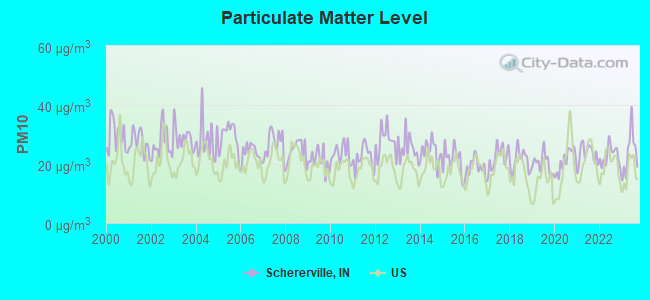
Particulate Matter (PM10) [µg/m3] level in 2023 was 23.7. This is worse than average. Closest monitor was 6.9 miles away from the city center.
| City: | 23.7 |
| U.S.: | 19.2 |
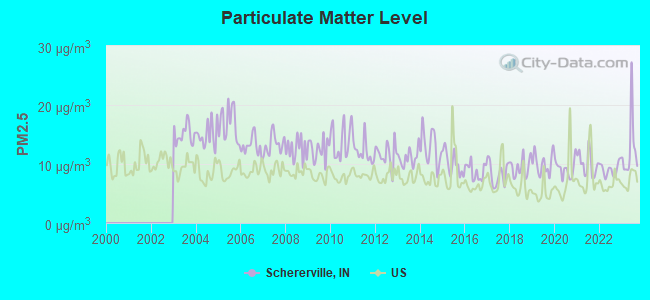
Particulate Matter (PM2.5) [µg/m3] level in 2023 was 12.5. This is significantly worse than average. Closest monitor was 4.1 miles away from the city center.
| City: | 12.5 |
| U.S.: | 8.1 |
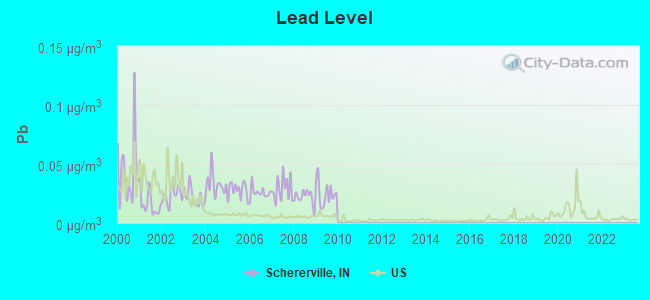
Lead (Pb) [µg/m3] level in 2009 was 0.0250. This is significantly worse than average. Closest monitor was 6.7 miles away from the city center.
| City: | 0.0250 |
| U.S.: | 0.0093 |
Tornado activity:
Schererville-area historical tornado activity is slightly below Indiana state average. It is 64% greater than the overall U.S. average.
On 8/28/1990, a category F5 (max. wind speeds 261-318 mph) tornado 34.1 miles away from the Schererville town center killed 29 people and injured 350 people and caused between $50,000 and $500,000 in damages.
On 4/21/1967, a category F4 (max. wind speeds 207-260 mph) tornado 17.6 miles away from the town center killed 33 people and injured 500 people and caused between $5,000,000 and $50,000,000 in damages.
Earthquake activity:
Schererville-area historical earthquake activity is significantly above Indiana state average. It is 41% greater than the overall U.S. average.On 4/18/2008 at 09:36:59, a magnitude 5.4 (5.1 MB, 4.8 MS, 5.4 MW, 5.2 MW, Class: Moderate, Intensity: VI - VII) earthquake occurred 211.4 miles away from the city center
On 6/10/1987 at 23:48:54, a magnitude 5.1 (4.9 MB, 4.4 MS, 4.6 MS, 5.1 LG) earthquake occurred 186.0 miles away from the city center
On 4/18/2008 at 09:36:59, a magnitude 5.2 (5.2 MW, Depth: 8.9 mi) earthquake occurred 211.4 miles away from Schererville center
On 6/28/2004 at 06:10:52, a magnitude 4.2 (4.2 MW, Depth: 6.2 mi, Class: Light, Intensity: IV - V) earthquake occurred 75.5 miles away from the city center
On 6/18/2002 at 17:37:15, a magnitude 5.0 (4.3 MB, 4.6 MW, 5.0 LG) earthquake occurred 242.9 miles away from Schererville center
On 4/18/2008 at 15:14:16, a magnitude 4.8 (4.5 MB, 4.8 MW, 4.6 MW) earthquake occurred 209.5 miles away from the city center
Magnitude types: regional Lg-wave magnitude (LG), body-wave magnitude (MB), surface-wave magnitude (MS), moment magnitude (MW)
Natural disasters:
The number of natural disasters in Lake County (19) is greater than the US average (15).Major Disasters (Presidential) Declared: 12
Emergencies Declared: 5
Causes of natural disasters: Floods: 11, Storms: 10, Winter Storms: 5, Tornadoes: 3, Snowstorms: 2, Hurricane: 1, Snow: 1, Other: 1 (Note: some incidents may be assigned to more than one category).
Hospitals and medical centers in Schererville:
Amtrak stations near Schererville:
- 4 miles: DYER (SHEFFIELD RD.) . Services: enclosed waiting area, public payphones, free short-term parking, free long-term parking.
- 13 miles: HOMEWOOD (181 1ST ST. & PARK AVE.) . Services: ticket office, enclosed waiting area, public restrooms, public payphones, paid short-term parking, paid long-term parking, public transit connection.
- 15 miles: HAMMOND-WHITING (HAMMOND, 1135 CALUMET AVE.) . Services: ticket office, partially wheelchair accessible, enclosed waiting area, public restrooms, public payphones, free short-term parking, free long-term parking, call for taxi service.
College/University in Schererville:
Colleges/universities with over 2000 students nearest to Schererville:
- Purdue University-Calumet Campus (about 7 miles; Hammond, IN; Full-time enrollment: 7,343)
- Indiana University-Northwest (about 8 miles; Gary, IN; FT enrollment: 4,390)
- Prairie State College (about 11 miles; Chicago Heights, IL; FT enrollment: 4,050)
- South Suburban College (about 13 miles; South Holland, IL; FT enrollment: 3,972)
- Governors State University (about 15 miles; University Park, IL; FT enrollment: 4,043)
- City Colleges of Chicago-Olive-Harvey College (about 18 miles; Chicago, IL; FT enrollment: 4,110)
- Chicago State University (about 19 miles; Chicago, IL; FT enrollment: 4,352)
Public high school in Schererville:
- WEST LAKE SPEC ED COOP (Location: 212 E JOLIET ST, Grades: PK-12)
Private high school in Schererville:
Public elementary/middle schools in Schererville:
- MICHAEL GRIMMER MIDDLE SCHOOL (Students: 1,085, Location: 225 W 77TH AVE, Grades: 5-8)
- JAMES H WATSON ELEM SCH (Students: 745, Location: 333 W 77TH ST, Grades: PK-4)
- HOMAN ELEMENTARY SCHOOL (Students: 708, Location: 210 E JOLIET, Grades: PK-4)
- PEIFER ELEMENTARY SCHOOL (Students: 642, Location: 1824 S CLINE, Grades: PK-4)
Private elementary/middle schools in Schererville:
- ST MICHEAL ELEMENTARY SCHOOL (Students: 328, Location: 16 W WILHELM ST, Grades: PK-8)
- FOREST RIDGE ACADEMY (Students: 206, Location: 7300 FOREST RIDGE DR, Grades: PK-8)
User-submitted facts and corrections:
- WJOB AM 1230 ownership is now Vasquez Development LLC
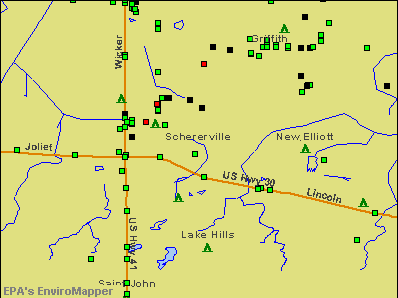
Points of interest:
Notable locations in Schererville: Illiana Racetrack (A), Schererville Fire Department Station 2 (B), Schererville Fire Department Station 4 (C), Schererville Fire Department Station 3 (D). Display/hide their locations on the map
Shopping Centers: Victoria Centre Shopping Center (1), The Crossroads Shopping Center (2), Pine Island Plaza Shopping Center (3), Oak Ridge Center Shopping Center (4), Lincoln Ridge Plaza Shopping Center (5), Deer Run Plaza Shopping Center (6). Display/hide their locations on the map
Churches in Schererville include: Saint George Hellenic Greek Church (A), First Baptist Church (B), Immanuel Presbyterian Church (C), Peace Lutheran Church (D), Saint Michael Church (E). Display/hide their locations on the map
Cemeteries: Memory Lane Memorial Cemetery (1), Saint Michael's Cemetery (2), Pleasant View Cemetery (3), Chapel Lawn Memorial Gardens Cemetery (4). Display/hide their locations on the map
Parks in Schererville include: Peter G Redar Park (1), Stephen Park (2), Elmridge Park (3), Plum Creek Park (4), Beidron Park (5), Hoosier Prairie State Nature Preserve (6), Rohrman Park (7), Foxwood Park (8). Display/hide their locations on the map
Tourist attraction: Schererville Golf & Fun Center (Amusement & Theme Parks; 101 US Highway 41).
Hotels: Rosewood Inn (1026 West US Highway 30), Best Western Crossroads Inn (1905 Harder Court), Holiday Inn Exp Schererville (1019 West Lincoln Highway).
Court: Schererville Town - Town Court (25 East Joliet Street).
| This town: | 2.5 people |
| Indiana: | 2.5 people |
| This town: | 67.2% |
| Whole state: | 66.9% |
| This town: | 5.6% |
| Whole state: | 6.9% |
Likely homosexual households (counted as self-reported same-sex unmarried-partner households)
- Lesbian couples: 0.3% of all households
- Gay men: 0.2% of all households
People in group quarters in Schererville in 2010:
- 63 people in residential treatment centers for juveniles (non-correctional)
- 43 people in college/university student housing
- 14 people in residential treatment centers for adults
People in group quarters in Schererville in 2000:
- 34 people in other noninstitutional group quarters
- 32 people in homes or halfway houses for drug/alcohol abuse
- 22 people in homes for the mentally ill
- 15 people in mental (psychiatric) hospitals or wards
Banks with most branches in Schererville (2011 data):
- First Financial Bank, National Association: Schererville Branch, Online Banking, Route 41 Schererville Branch. Info updated 2009/09/21: Bank assets: $6,663.4 mil, Deposits: $5,754.9 mil, headquarters in Hamilton, OH, positive income, Commercial Lending Specialization, 101 total offices, Holding Company: First Financial Bancorp
- Fifth Third Bank: Schererville Branch at 1545 U.S. 41, branch established on 1934/07/01. Info updated 2009/10/05: Bank assets: $114,540.4 mil, Deposits: $89,689.1 mil, headquarters in Cincinnati, OH, positive income, Commercial Lending Specialization, 1378 total offices, Holding Company: Fifth Third Bancorp
- Citizens Financial Bank: Schererville Branch at 7650 Harvest Drive, branch established on 1999/12/20. Info updated 2011/07/21: Bank assets: $1,149.8 mil, Deposits: $986.7 mil, headquarters in Munster, IN, negative income in the last year, Commercial Lending Specialization, 22 total offices
- First Midwest Bank: Schererville Branch at 1806 Robin Hood Boulevard, branch established on 1970/09/21. Info updated 2011/12/22: Bank assets: $7,848.0 mil, Deposits: $6,529.2 mil, headquarters in Itasca, IL, positive income, Commercial Lending Specialization, 100 total offices, Holding Company: First Midwest Bancorp, Inc.
- Bank of England: Eng Lending at 742 E. Us Highway 30, branch established on 2012/02/10. Info updated 2011/01/06: Bank assets: $240.7 mil, Deposits: $209.4 mil, headquarters in England, AR, positive income, 16 total offices, Holding Company: Mhbc Investments Limited Partnership I Lllp
- Peoples Bank SB: Schererville at 141 W. Lincoln Highway, branch established on 1990/02/05. Info updated 2006/11/03: Bank assets: $652.4 mil, Deposits: $528.1 mil, headquarters in Munster, IN, positive income, Commercial Lending Specialization, 12 total offices, Holding Company: Northwest Indiana Bancorp
- BMO Harris Bank National Association: Schererville Branch at 790 East Lincoln Highway, branch established on 2003/11/03. Info updated 2011/07/14: Bank assets: $97,264.0 mil, Deposits: $75,624.6 mil, headquarters in Chicago, IL, positive income, 717 total offices, Holding Company: Bank Of Montreal
- Liberty Savings Bank, FSB: Highway 30 Branch at 195 East Highway 30, branch established on 1926/01/01. Info updated 2011/07/21: Bank assets: $69.0 mil, Deposits: $64.3 mil, headquarters in Whiting, IN, negative income in the last year, Mortgage Lending Specialization, 3 total offices
- JPMorgan Chase Bank, National Association: Schererville Branch at 1801 Kennedy Avenue, branch established on 1990/04/14. Info updated 2011/11/10: Bank assets: $1,811,678.0 mil, Deposits: $1,190,738.0 mil, headquarters in Columbus, OH, positive income, International Specialization, 5577 total offices, Holding Company: Jpmorgan Chase & Co.
- 2 other banks with 2 local branches
For population 15 years and over in Schererville:
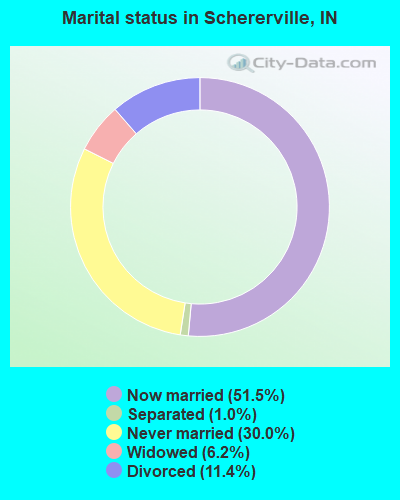
- Never married: 30.0%
- Now married: 51.5%
- Separated: 1.0%
- Widowed: 6.2%
- Divorced: 11.4%
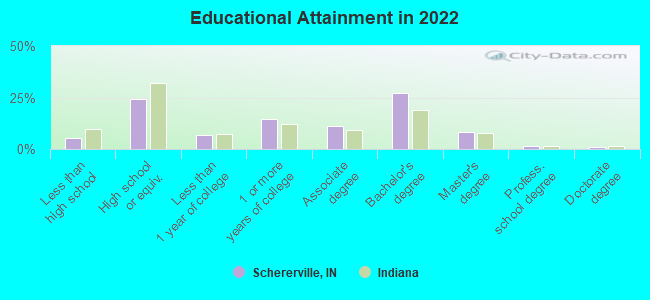
For population 25 years and over in Schererville:
- High school or higher: 95.0%
- Bachelor's degree or higher: 35.4%
- Graduate or professional degree: 11.1%
- Unemployed: 2.7%
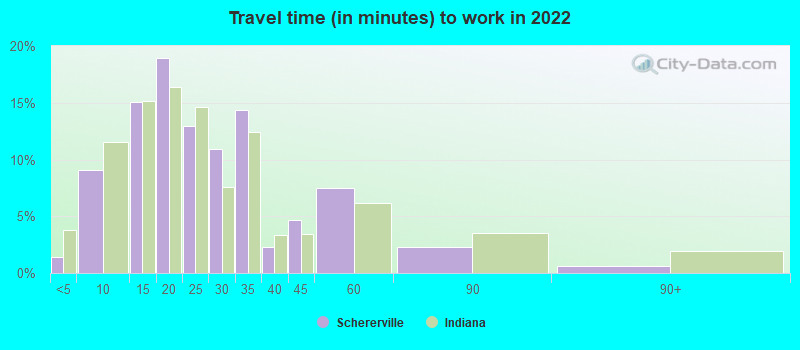
- Mean travel time to work (commute): 26.6 minutes
| Here: | 10.1 |
| Indiana average: | 11.3 |
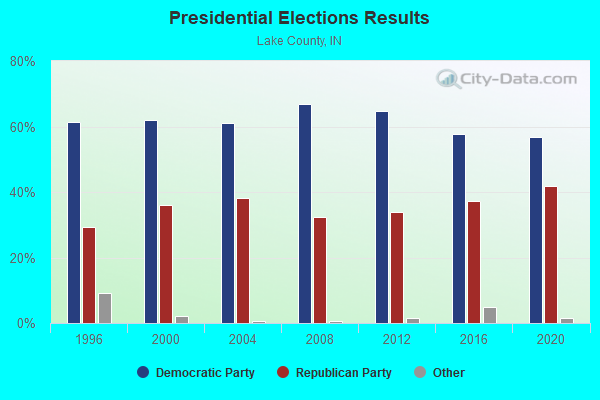
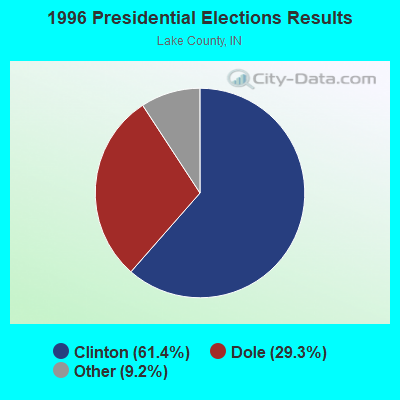
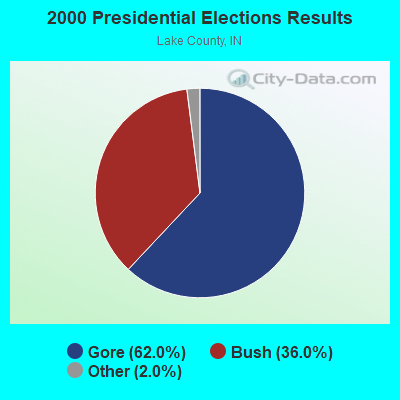

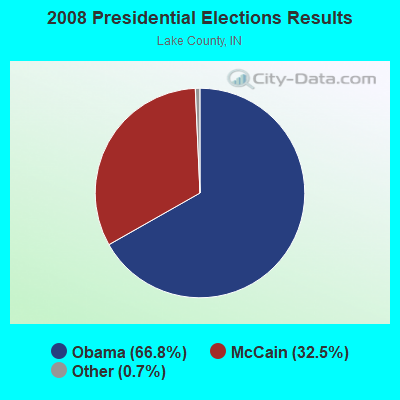
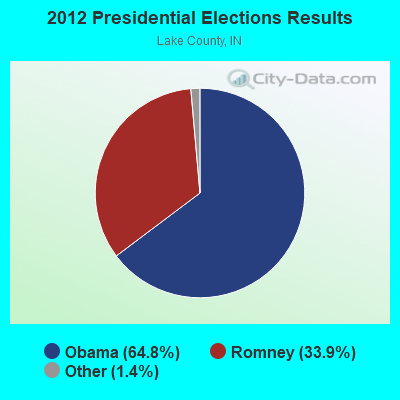


Graphs represent county-level data. Detailed 2008 Election Results
Religion statistics for Schererville, IN (based on Lake County data)
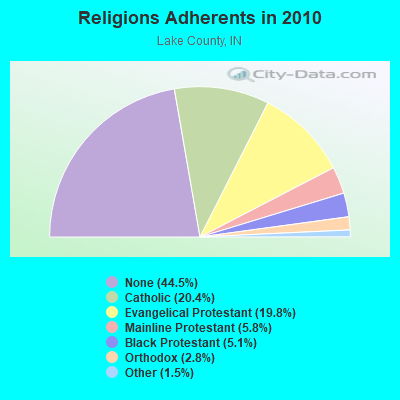
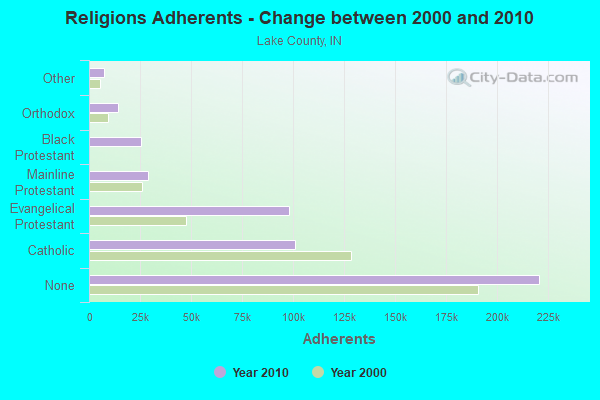
| Religion | Adherents | Congregations |
|---|---|---|
| Catholic | 101,096 | 58 |
| Evangelical Protestant | 98,213 | 266 |
| Mainline Protestant | 28,943 | 78 |
| Black Protestant | 25,459 | 74 |
| Orthodox | 13,990 | 14 |
| Other | 7,460 | 29 |
| None | 220,844 | - |
Food Environment Statistics:
| Lake County: | 1.67 / 10,000 pop. |
| Indiana: | 1.73 / 10,000 pop. |
| This county: | 0.08 / 10,000 pop. |
| Indiana: | 0.21 / 10,000 pop. |
| Here: | 0.61 / 10,000 pop. |
| Indiana: | 0.50 / 10,000 pop. |
| This county: | 3.56 / 10,000 pop. |
| Indiana: | 3.57 / 10,000 pop. |
| Here: | 5.86 / 10,000 pop. |
| State: | 6.78 / 10,000 pop. |
| This county: | 10.8% |
| Indiana: | 9.2% |
| Here: | 32.3% |
| Indiana: | 29.0% |
| Lake County: | 11.7% |
| Indiana: | 14.3% |
Health and Nutrition:
| Here: | 51.0% |
| Indiana: | 49.3% |
| This city: | 49.2% |
| Indiana: | 46.2% |
| Schererville: | 28.8 |
| State: | 28.7 |
| Schererville: | 20.9% |
| State: | 21.3% |
| This city: | 10.0% |
| State: | 10.6% |
| Here: | 6.8 |
| Indiana: | 6.8 |
| Here: | 35.1% |
| Indiana: | 33.9% |
| This city: | 58.0% |
| Indiana: | 56.1% |
| This city: | 79.6% |
| Indiana: | 78.7% |
More about Health and Nutrition of Schererville, IN Residents
| Local government employment and payroll (March 2022) | |||||
| Function | Full-time employees | Monthly full-time payroll | Average yearly full-time wage | Part-time employees | Monthly part-time payroll |
|---|---|---|---|---|---|
| Police Protection - Officers | 50 | $311,032 | $74,648 | 0 | $0 |
| Streets and Highways | 34 | $151,282 | $53,394 | 9 | $12,320 |
| Sewerage | 21 | $94,030 | $53,731 | 0 | $0 |
| Firefighters | 18 | $111,573 | $74,382 | 30 | $47,237 |
| Police - Other | 17 | $76,495 | $53,996 | 8 | $7,123 |
| Financial Administration | 13 | $61,097 | $56,397 | 3 | $10,496 |
| Parks and Recreation | 8 | $34,173 | $51,260 | 9 | $10,394 |
| Other Government Administration | 7 | $20,005 | $34,294 | 13 | $23,597 |
| Judicial and Legal | 2 | $11,634 | $69,804 | 7 | $9,792 |
| Fire - Other | 1 | $4,342 | $52,104 | 0 | $0 |
| Totals for Government | 171 | $875,663 | $61,450 | 79 | $120,959 |
Schererville government finances - Expenditure in 2021 (per resident):
- Construction - Water Utilities: $386,000 ($13.01)
General - Other: $229,000 ($7.72)
Parks and Recreation: $36,000 ($1.21)
- Current Operations - Water Utilities: $5,190,000 ($174.94)
Police Protection: $4,935,000 ($166.34)
Sewerage: $3,283,000 ($110.66)
Health - Other: $2,075,000 ($69.94)
Solid Waste Management: $2,052,000 ($69.17)
Parks and Recreation: $2,005,000 ($67.58)
Regular Highways: $1,414,000 ($47.66)
General - Other: $1,358,000 ($45.77)
Local Fire Protection: $1,202,000 ($40.52)
Central Staff Services: $865,000 ($29.16)
Judicial and Legal Services: $337,000 ($11.36)
Financial Administration: $220,000 ($7.42)
Miscellaneous Commercial Activities - Other: $189,000 ($6.37)
Corrections - Other: $36,000 ($1.21)
Natural Resources - Other: $19,000 ($0.64)
Protective Inspection and Regulation - Other: $14,000 ($0.47)
- General - Interest on Debt: $1,174,000 ($39.57)
- Intergovernmental to Local - Other - Parks and Recreation: $6,000 ($0.20)
- Other Capital Outlay - Sewerage: $361,000 ($12.17)
Water Utilities: $187,000 ($6.30)
Police Protection: $34,000 ($1.15)
Solid Waste Management: $14,000 ($0.47)
Miscellaneous Commercial Activities - Other: $11,000 ($0.37)
Local Fire Protection: $8,000 ($0.27)
Parks and Recreation: $5,000 ($0.17)
Health - Other: $2,000 ($0.07)
Regular Highways: $1,000 ($0.03)
Schererville government finances - Revenue in 2021 (per resident):
- Charges - Sewerage: $16,072,000 ($541.73)
Solid Waste Management: $2,112,000 ($71.19)
Other: $897,000 ($30.23)
Parks and Recreation: $123,000 ($4.15)
- Federal Intergovernmental - Other: $170,000 ($5.73)
- Local Intergovernmental - Highways: $514,000 ($17.33)
Other: $30,000 ($1.01)
- Miscellaneous - Fines and Forfeits: $347,000 ($11.70)
Interest Earnings: $315,000 ($10.62)
Rents: $151,000 ($5.09)
Donations From Private Sources: $25,000 ($0.84)
Sale of Property: $10,000 ($0.34)
Special Assessments: $4,000 ($0.13)
- Revenue - Water Utilities: $14,435,000 ($486.55)
- State Intergovernmental - Highways: $3,391,000 ($114.30)
Other: $1,484,000 ($50.02)
General Local Government Support: $1,314,000 ($44.29)
Health and Hospitals: $3,000 ($0.10)
- Tax - Property: $16,291,000 ($549.11)
Other License: $1,125,000 ($37.92)
Public Utilities Sales: $405,000 ($13.65)
Other Selective Sales: $5,000 ($0.17)
Schererville government finances - Debt in 2021 (per resident):
- Long Term Debt - Outstanding Unspecified Public Purpose: $37,520,000 ($1264.66)
Beginning Outstanding - Unspecified Public Purpose: $37,520,000 ($1264.66)
Schererville government finances - Cash and Securities in 2021 (per resident):
- Bond Funds - Cash and Securities: $9,956,000 ($335.58)
- Other Funds - Cash and Securities: $21,253,000 ($716.36)
- Sinking Funds - Cash and Securities: $19,963,000 ($672.88)
5.29% of this county's 2021 resident taxpayers lived in other counties in 2020 ($54,961 average adjusted gross income)
| Here: | 5.29% |
| Indiana average: | 6.66% |
0.01% of residents moved from foreign countries ($91 average AGI)
Lake County: 0.01% Indiana average: 0.00%
Top counties from which taxpayers relocated into this county between 2020 and 2021:
| from Cook County, IL | |
| from Porter County, IN | |
| from Will County, IL |
| Businesses in Schererville, IN | ||||
| Name | Count | Name | Count | |
|---|---|---|---|---|
| AT&T | 1 | Menards | 1 | |
| Advance Auto Parts | 1 | New Balance | 1 | |
| Applebee's | 1 | Nike | 1 | |
| Arby's | 1 | Nissan | 1 | |
| Ashley Furniture | 1 | Old Navy | 1 | |
| AutoZone | 1 | Panera Bread | 1 | |
| BMW | 1 | Papa John's Pizza | 1 | |
| Bakers Square | 1 | Payless | 2 | |
| Baskin-Robbins | 1 | PetSmart | 1 | |
| Bath & Body Works | 1 | Pizza Hut | 1 | |
| Bed Bath & Beyond | 1 | Popeyes | 1 | |
| Best Western | 1 | Quiznos | 1 | |
| Buffalo Wild Wings | 1 | RadioShack | 1 | |
| Burger King | 1 | Red Robin | 1 | |
| Comfort Inn | 1 | Sears | 2 | |
| Cricket Wireless | 1 | Shoe Carnival | 1 | |
| Dairy Queen | 1 | Sprint Nextel | 1 | |
| Decora Cabinetry | 2 | Steak 'n Shake | 1 | |
| DressBarn | 1 | Subway | 1 | |
| Dressbarn | 1 | T-Mobile | 3 | |
| Dunkin Donuts | 1 | T.G.I. Driday's | 1 | |
| Fashion Bug | 1 | T.J.Maxx | 1 | |
| FedEx | 3 | Taco Bell | 1 | |
| GameStop | 1 | The Room Place | 1 | |
| H&R Block | 1 | Toyota | 1 | |
| Holiday Inn | 1 | U-Haul | 1 | |
| Home Depot | 1 | U.S. Cellular | 1 | |
| Houlihan's | 1 | UPS | 7 | |
| KFC | 1 | Verizon Wireless | 1 | |
| Long John Silver's | 1 | Walgreens | 3 | |
| Lowe's | 1 | Walmart | 1 | |
| MasterBrand Cabinets | 8 | Wendy's | 1 | |
| McDonald's | 1 | White Castle | 1 | |
Strongest AM radio stations in Schererville:
- WIND (560 AM; 5 kW; CHICAGO, IL; Owner: TICHENOR LICENSE CORPORATION ("TLC"))
- WLS (890 AM; 50 kW; CHICAGO, IL; Owner: WLS, INC.)
- WVIV (1200 AM; 20 kW; CHICAGO, IL; Owner: WLXX-AM LICENSE CORP.)
- WYLL (1160 AM; 50 kW; CHICAGO, IL; Owner: SCA LICENSE CORPORATION)
- WWCA (1270 AM; 1 kW; GARY, IN; Owner: METRO COMMUNICATIONS, INC.)
- WNTD (950 AM; 5 kW; CHICAGO, IL; Owner: RADIO UNICA OF CHICAGO LICENSE CORP.)
- WMVP (1000 AM; 50 kW; CHICAGO, IL; Owner: ABC, INC.)
- WSCR (670 AM; 50 kW; CHICAGO, IL; Owner: INFINITY BROADCASTING OPERATIONS, INC.)
- WGN (720 AM; 50 kW; CHICAGO, IL; Owner: WGN CONTINENTAL BROADCASTING CO.)
- WBBM (780 AM; 50 kW; CHICAGO, IL; Owner: INFINITY BROADCASTING OPERATIONS, INC.)
- WNDZ (750 AM; daytime; 5 kW; PORTAGE, IN; Owner: ENTRAVISION HOLDINGS, LLC)
- WJOB (1230 AM; 1 kW; HAMMOND, IN; Owner: ST. GEORGE BROADCASTING, LLC, ROBERT J. MACCINI, RECEIVER)
- WNWI (1080 AM; 3 kW; OAK LAWN, IL; Owner: BIRACH BROADCASTING CORPORATION)
Strongest FM radio stations in Schererville:
- WZVN (107.1 FM; LOWELL, IN; Owner: M & M BROADCASTING, INC.)
- WYCA (106.3 FM; LANSING, IL; Owner: DONTRON, INC.)
- WPWX (92.3 FM; HAMMOND, IN; Owner: DONTRON, INC.)
- WCKG (105.9 FM; ELMWOOD PARK, IL; Owner: INFINITY HOLDINGS CORPORATION OF ORLANDO)
- WLIT-FM (93.9 FM; CHICAGO, IL; Owner: AMFM RADIO LICENSES, L.L.C.)
- WJMK (104.3 FM; CHICAGO, IL; Owner: INFINITY BROADCASTING CORP. OF ILLINOIS)
- WNUA (95.5 FM; CHICAGO, IL; Owner: AMFM RADIO LICENSES, L.L.C.)
- WTMX (101.9 FM; SKOKIE, IL; Owner: BONNEVILLE HOLDING COMPANY)
- WBBM-FM (96.3 FM; CHICAGO, IL; Owner: INFINITY BROADCASTING OPERATIONS, INC.)
- WKSC-FM (103.5 FM; CHICAGO, IL; Owner: AMFM RADIO LICENSES, L.L.C.)
- WFMT (98.7 FM; CHICAGO, IL; Owner: WINDOW TO THE WORLD COMMUNICATIONS)
- WZZN (94.7 FM; CHICAGO, IL; Owner: ABC CHICAGO FM RADIO,INC.)
- WGCI-FM (107.5 FM; CHICAGO, IL; Owner: AMFM RADIO LICENSES, L.L.C.)
- WBEZ (91.5 FM; CHICAGO, IL; Owner: THE WBEZ ALLIANCE, INC.)
- WKQX (101.1 FM; CHICAGO, IL; Owner: EMMIS RADIO LICENSE CORPORATION)
- WLUP-FM (97.9 FM; CHICAGO, IL; Owner: BONNEVILLE HOLDING COMPANY)
- WNND (100.3 FM; CHICAGO, IL; Owner: BONNEVILLE HOLDING COMPANY)
- WOJO (105.1 FM; EVANSTON, IL; Owner: TICHENOR LICENSE CORPORATION ("TLC"))
- WUSN (99.5 FM; CHICAGO, IL; Owner: INFINITY BROADCASTING CORPORATION OF CHICAGO)
- WVAZ (102.7 FM; OAK PARK, IL; Owner: AMFM RADIO LICENSES, L.L.C.)
TV broadcast stations around Schererville:
- WYIN (Channel 56; GARY, IN; Owner: NORTHWEST INDIANA PUBLIC BROADCASTING, INC.)
- WLS-TV (Channel 7; CHICAGO, IL; Owner: WLS TELEVISION, INC.)
- WMAQ-TV (Channel 5; CHICAGO, IL; Owner: NBC SUBSIDIARY (WMAQ-TV), INC.)
- WTTW (Channel 11; CHICAGO, IL; Owner: WINDOW TO THE WORLD COMMUNICATIONS, INC.)
- WGN-TV (Channel 9; CHICAGO, IL; Owner: WGN CONTINENTAL BROADCASTING COMPANY)
- WGBO-TV (Channel 66; JOLIET, IL; Owner: WGBO LICENSE PARTNERSHIP, G.P.)
- WBBM-TV (Channel 2; CHICAGO, IL; Owner: CBS BROADCASTING INC.)
- WPWR-TV (Channel 50; GARY, IN; Owner: FOX TELEVISION STATIONS, INC.)
- WXFT (Channel 60; AURORA, IL; Owner: TELEFUTURA CHICAGO LLC)
- WCPX (Channel 38; CHICAGO, IL; Owner: PAXSON CHICAGO LICENSE, INC.)
- WCIU-TV (Channel 26; CHICAGO, IL; Owner: WCIU-TV LIMITED PARTNERSHIP)
- WFLD (Channel 32; CHICAGO, IL; Owner: FOX TELEVISION STATIONS, INC.)
- W68DO (Channel 68; PALATINE, IL; Owner: TRINITY BROADCASTING NETWORK)
- WFBT-CA (Channel 23; CHICAGO, IL; Owner: CHANNEL 23 LIMITED PARTNERSHIP)
- WJYS (Channel 62; HAMMOND, IN; Owner: JOVON BROADCASTING CORPORATION)
- WSNS-TV (Channel 44; CHICAGO, IL; Owner: TELEMUNDO OF CHICAGO, INC.)
- WOCH-LP (Channel 28; CHICAGO, IL; Owner: KM LPTV OF CHICAGO-28, L.L.C.)
- WYCC (Channel 20; CHICAGO, IL; Owner: COLLEGE DIST. #508, COUNTY OF COOK)
- WOCK-CA (Channel 13; CHICAGO, IL; Owner: KM LPTV OF CHICAGO-13, L.L.C.)
- W34CK (Channel 34; ARLINGTON HEIGHTS, IL; Owner: FIRST UNITED, INC.)
- W18AT (Channel 18; GARY, IN; Owner: LESEA BROADCASTING CORPORATION)
- W54AP (Channel 54; BLUE ISLAND, IL; Owner: CATHOLIC VIEWS BROADCASTS, INC.)
- W24AW (Channel 24; VALPARAISO, IN; Owner: LESEA BROADCASTING CORPORATION)
- W54BK (Channel 54; CHESTERTON, IN; Owner: LESEA BROADCASTING CORPORATION)
- National Bridge Inventory (NBI) Statistics
- 14Number of bridges
- 131ft / 39.8mTotal length
- $15,000Total costs
- 186,090Total average daily traffic
- 22,108Total average daily truck traffic
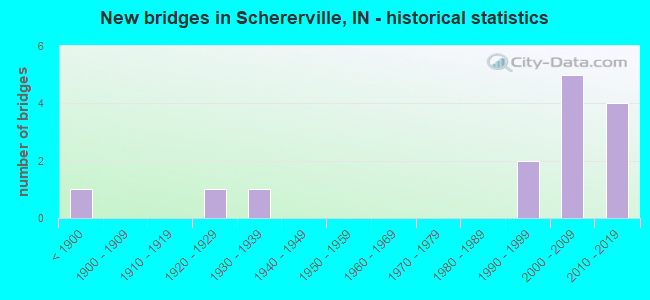
- New bridges - historical statistics
- 1Before 1900
- 11920-1929
- 11930-1939
- 21990-1999
- 52000-2009
- 42010-2019
FCC Registered Broadcast Land Mobile Towers: 10 (See the full list of FCC Registered Broadcast Land Mobile Towers in Schererville, IN)
FCC Registered Microwave Towers: 10 (See the full list of FCC Registered Microwave Towers in this town)
FCC Registered Amateur Radio Licenses: 78 (See the full list of FCC Registered Amateur Radio Licenses in Schererville)
FAA Registered Aircraft: 11 (See the full list of FAA Registered Aircraft in Schererville)
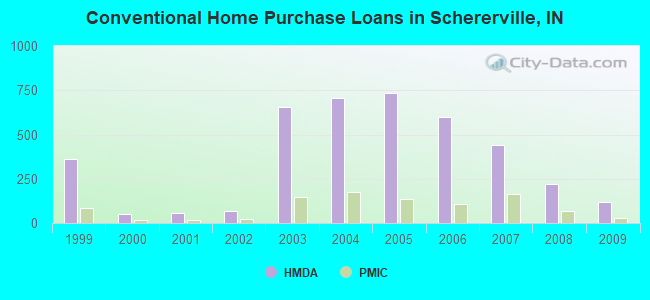
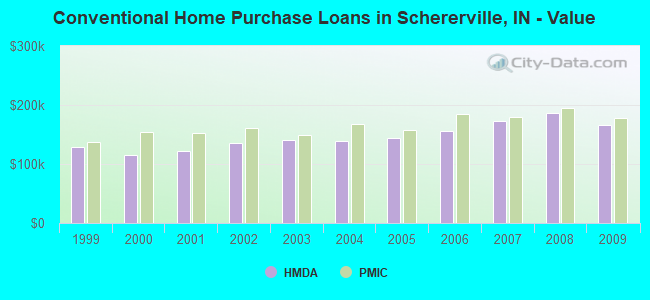
| Home Mortgage Disclosure Act Aggregated Statistics For Year 2009 (Based on 2 full and 3 partial tracts) | ||||||||||||||
| A) FHA, FSA/RHS & VA Home Purchase Loans | B) Conventional Home Purchase Loans | C) Refinancings | D) Home Improvement Loans | E) Loans on Dwellings For 5+ Families | F) Non-occupant Loans on < 5 Family Dwellings (A B C & D) | G) Loans On Manufactured Home Dwelling (A B C & D) | ||||||||
|---|---|---|---|---|---|---|---|---|---|---|---|---|---|---|
| Number | Average Value | Number | Average Value | Number | Average Value | Number | Average Value | Number | Average Value | Number | Average Value | Number | Average Value | |
| LOANS ORIGINATED | 80 | $179,256 | 119 | $166,765 | 886 | $170,785 | 34 | $80,446 | 1 | $1,804,900 | 23 | $135,602 | 1 | $226,090 |
| APPLICATIONS APPROVED, NOT ACCEPTED | 7 | $210,617 | 6 | $162,502 | 53 | $165,707 | 3 | $36,450 | 0 | $0 | 2 | $92,500 | 0 | $0 |
| APPLICATIONS DENIED | 14 | $142,906 | 13 | $238,964 | 230 | $183,091 | 8 | $57,932 | 0 | $0 | 6 | $116,507 | 0 | $0 |
| APPLICATIONS WITHDRAWN | 5 | $172,780 | 7 | $173,084 | 137 | $187,618 | 3 | $43,000 | 0 | $0 | 4 | $141,188 | 0 | $0 |
| FILES CLOSED FOR INCOMPLETENESS | 2 | $146,055 | 0 | $0 | 39 | $198,520 | 2 | $70,855 | 0 | $0 | 1 | $112,730 | 0 | $0 |
Detailed HMDA statistics for the following Tracts: 0426.02 , 0426.04, 0426.05, 0427.01, 0427.02
| Private Mortgage Insurance Companies Aggregated Statistics For Year 2009 (Based on 2 full and 3 partial tracts) | ||||
| A) Conventional Home Purchase Loans | B) Refinancings | |||
|---|---|---|---|---|
| Number | Average Value | Number | Average Value | |
| LOANS ORIGINATED | 28 | $177,693 | 34 | $198,946 |
| APPLICATIONS APPROVED, NOT ACCEPTED | 10 | $216,153 | 11 | $246,171 |
| APPLICATIONS DENIED | 4 | $208,502 | 8 | $194,171 |
| APPLICATIONS WITHDRAWN | 2 | $194,905 | 2 | $281,230 |
| FILES CLOSED FOR INCOMPLETENESS | 0 | $0 | 0 | $0 |
Detailed PMIC statistics for the following Tracts: 0426.02 , 0426.04, 0426.05, 0427.01, 0427.02
2003 - 2018 National Fire Incident Reporting System (NFIRS) incidents
- Fire incident types reported to NFIRS in Schererville, IN
- 42341.4%Outside Fires
- 37636.8%Structure Fires
- 13813.5%Mobile Property/Vehicle Fires
- 858.3%Other
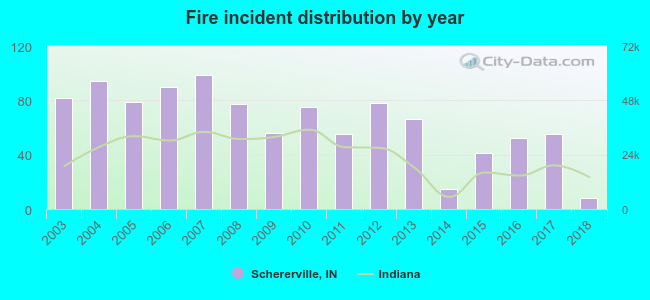 Based on the data from the years 2003 - 2018 the average number of fires per year is 64. The highest number of fires - 99 took place in 2007, and the least - 8 in 2018. The data has a decreasing trend.
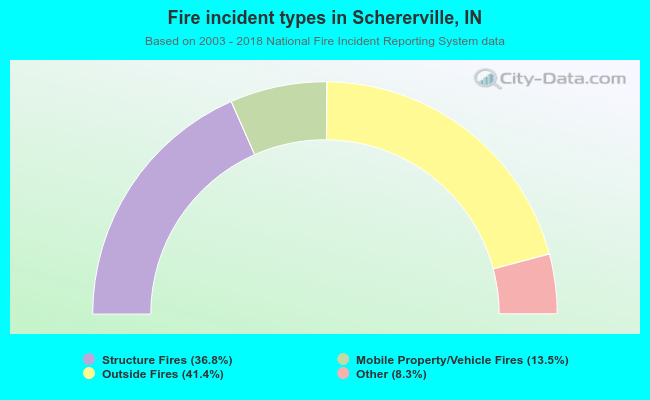 When looking into fire subcategories, the most reports belonged to: Outside Fires (41.4%), and Structure Fires (36.8%).
Fire-safe hotels and motels in Schererville, Indiana:
- Lee's Motel, 1234 Lincoln Hwy, Schererville, Indiana 46375 , Phone: (219) 865-8413
- Comfort Inn, 1019 W Lincoln Hwy, Schererville, Indiana 46375 , Phone: (219) 865-9500, Fax: (219) 865-9520
- Best Western, 1905 Harder Ct, Schererville, Indiana 46375 , Phone: (219) 865-3400, Fax: (219) 865-2800
- Holiday Inn Express Hotel & Suites, 1773 Fountain Park Dr, Schererville, Indiana 46375 , Phone: (219) 865-3301, Fax: (219) 865-3302
- Hampton Inn & Suites, 1904 US 41, Schererville, Indiana 46375 , Phone: (219) 440-7591, Fax: (219) 440-7754
- Staybridge Suites, 1758 Fountain Park Dr, Schererville, Indiana 46375 , Phone: (219) 227-5125, Fax: (219) 227-5126
| Most common first names in Schererville, IN among deceased individuals | ||
| Name | Count | Lived (average) |
|---|---|---|
| John | 84 | 75.6 years |
| Mary | 75 | 81.8 years |
| Robert | 72 | 72.9 years |
| William | 59 | 73.9 years |
| Joseph | 54 | 75.4 years |
| George | 39 | 77.6 years |
| James | 37 | 69.3 years |
| Helen | 29 | 83.4 years |
| Edward | 28 | 75.7 years |
| Thomas | 26 | 68.8 years |
| Most common last names in Schererville, IN among deceased individuals | ||
| Last name | Count | Lived (average) |
|---|---|---|
| Smith | 16 | 79.6 years |
| Miller | 14 | 72.3 years |
| Johnson | 12 | 79.4 years |
| Brown | 11 | 73.2 years |
| Nelson | 9 | 79.6 years |
| Kuhn | 8 | 72.3 years |
| Grimmer | 7 | 75.3 years |
| Wilson | 7 | 66.4 years |
| Robinson | 7 | 69.3 years |
| White | 7 | 79.6 years |
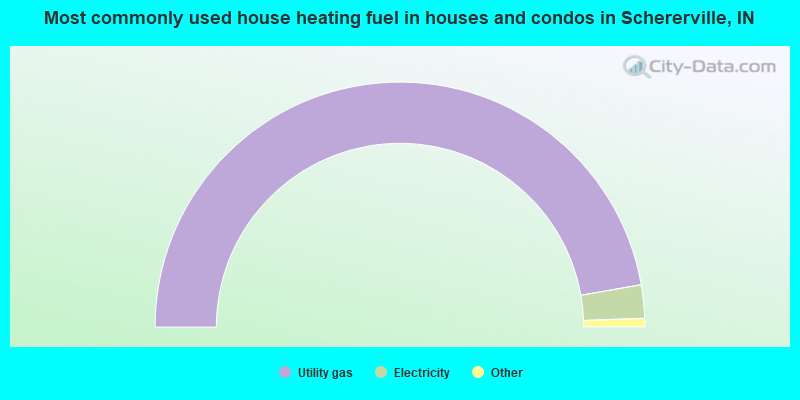
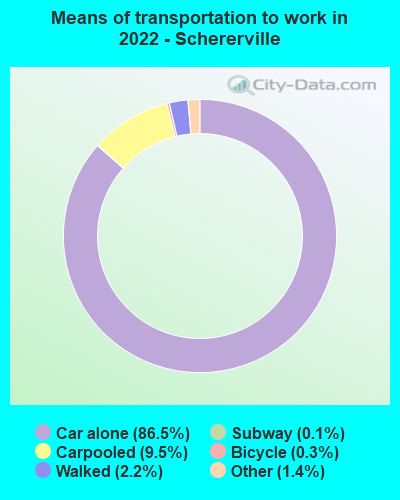
- 94.5%Utility gas
- 4.4%Electricity
- 0.7%Bottled, tank, or LP gas
- 0.4%No fuel used
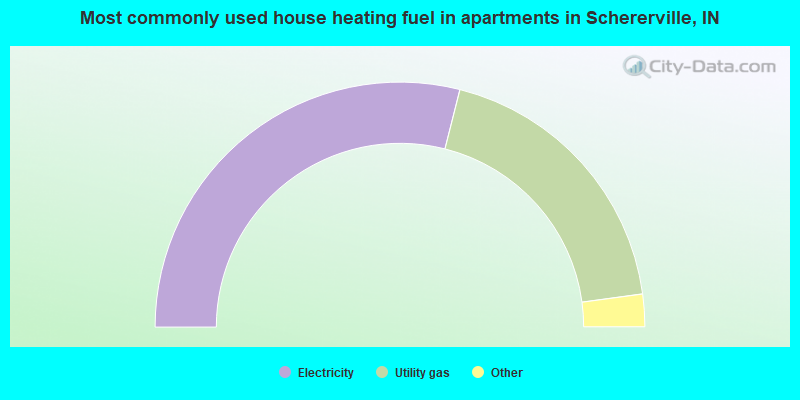
- 57.9%Electricity
- 37.8%Utility gas
- 2.0%Bottled, tank, or LP gas
- 1.6%Other fuel
- 0.6%No fuel used
Schererville compared to Indiana state average:
- Median house value above state average.
- Unemployed percentage significantly below state average.
- Hispanic race population percentage above state average.
- Foreign-born population percentage significantly above state average.
- Length of stay since moving in above state average.
- House age below state average.
- Percentage of population with a bachelor's degree or higher above state average.

|
|
Total of 107 patent applications in 2008-2024.