South Sand Hills, Texas
Submit your own pictures of this place and show them to the world
- OSM Map
- General Map
- Google Map
- MSN Map

| Males: 285 | |
| Females: 262 |
| Median resident age: | 39.0 years |
| Texas median age: | 32.3 years |
Zip code: 79324
| South Sand Hills: | $77,063 |
| TX: | $72,284 |
Estimated per capita income in 2022: $33,209 (it was $14,293 in 2000)
South Sand Hills CCD income, earnings, and wages data
Estimated median house or condo value in 2022: $155,192 (it was $45,700 in 2000)
| South Sand Hills: | $155,192 |
| TX: | $275,400 |
Mean prices in 2022: all housing units: $124,805; detached houses: $131,854; mobile homes: $51,248
South Sand Hills, TX residents, houses, and apartments details
Detailed information about poverty and poor residents in South Sand Hills, TX


- 34960.8%White alone
- 21136.8%Hispanic
- 81.4%Black alone
- 40.7%Two or more races
- 20.3%American Indian alone
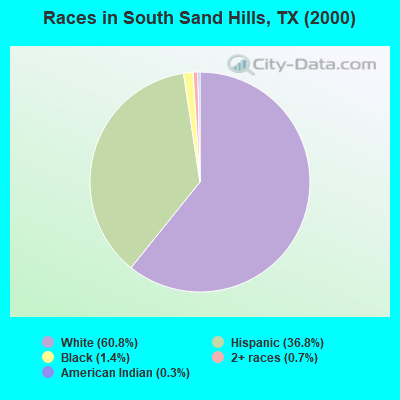
Races in South Sand Hills detailed stats: ancestries, foreign born residents, place of birth
 Recent articles from our blog. Our writers, many of them Ph.D. graduates or candidates, create easy-to-read articles on a wide variety of topics.
Current Local Time: CST time zone
Land area: 488.8 square miles.
Population density: 1.1 people per square mile (very low).

| South Sand Hills CCD: | 1.6% ($744) |
| Texas: | 1.8% ($1,393) |
Nearest city with pop. 50,000+: Lubbock, TX  (60.3 miles , pop. 199,564).
Nearest city with pop. 200,000+: Albuquerque, NM (230.5 miles , pop. 448,607).
Nearest city with pop. 1,000,000+: Dallas, TX (357.1 miles , pop. 1,188,580).
Nearest cities:
), ), ), ), Latitude: 33.96 N, Longitude: 102.81 W
Area code commonly used in this area: 806

| Here: | 3.8% |
| Texas: | 3.5% |
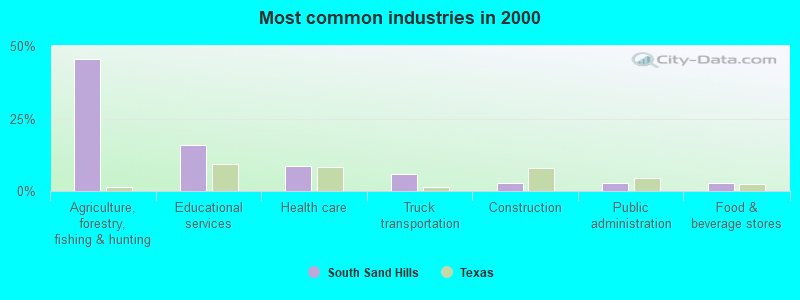
- Agriculture, forestry, fishing & hunting (45.6%)
- Educational services (15.8%)
- Health care (8.7%)
- Truck transportation (5.8%)
- Construction (2.9%)
- Public administration (2.9%)
- Food & beverage stores (2.9%)
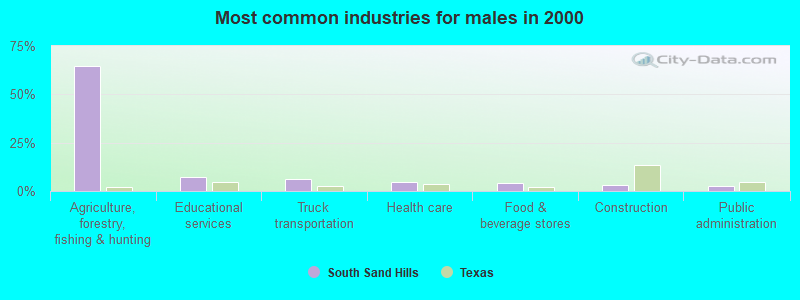
- Agriculture, forestry, fishing & hunting (64.6%)
- Educational services (7.3%)
- Truck transportation (6.1%)
- Health care (4.9%)
- Food & beverage stores (4.3%)
- Construction (3.0%)
- Public administration (2.4%)
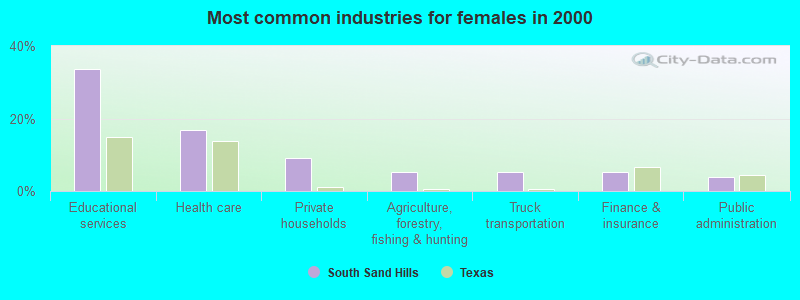
- Educational services (33.8%)
- Health care (16.9%)
- Private households (9.1%)
- Agriculture, forestry, fishing & hunting (5.2%)
- Truck transportation (5.2%)
- Finance & insurance (5.2%)
- Public administration (3.9%)
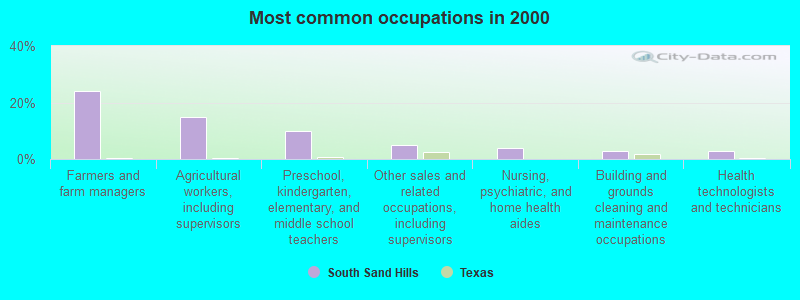
- Farmers and farm managers (24.1%)
- Agricultural workers, including supervisors (14.9%)
- Preschool, kindergarten, elementary, and middle school teachers (10.0%)
- Other sales and related occupations, including supervisors (5.0%)
- Nursing, psychiatric, and home health aides (3.7%)
- Building and grounds cleaning and maintenance occupations (2.9%)
- Health technologists and technicians (2.9%)
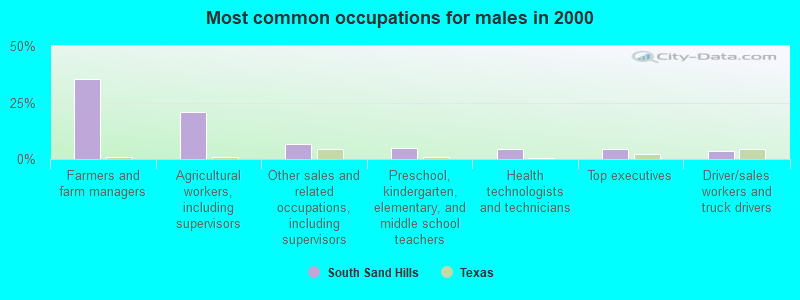
- Farmers and farm managers (35.4%)
- Agricultural workers, including supervisors (20.7%)
- Other sales and related occupations, including supervisors (6.7%)
- Preschool, kindergarten, elementary, and middle school teachers (4.9%)
- Health technologists and technicians (4.3%)
- Top executives (4.3%)
- Driver/sales workers and truck drivers (3.7%)
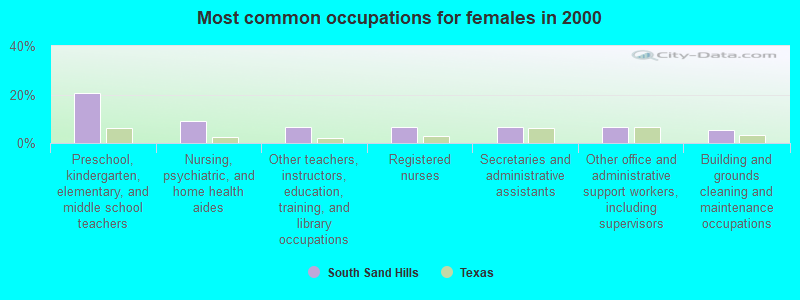
- Preschool, kindergarten, elementary, and middle school teachers (20.8%)
- Nursing, psychiatric, and home health aides (9.1%)
- Other teachers, instructors, education, training, and library occupations (6.5%)
- Registered nurses (6.5%)
- Secretaries and administrative assistants (6.5%)
- Other office and administrative support workers, including supervisors (6.5%)
- Building and grounds cleaning and maintenance occupations (5.2%)
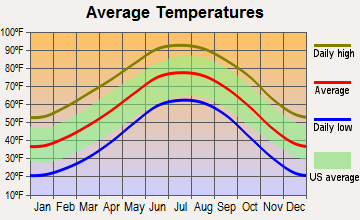
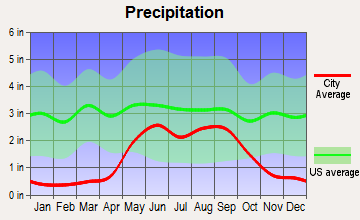
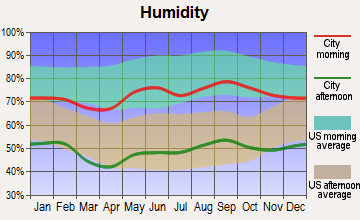
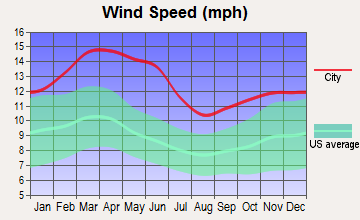
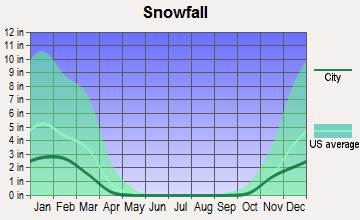
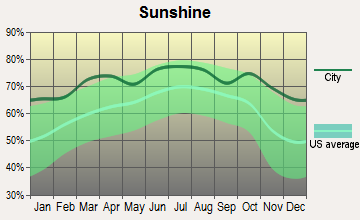
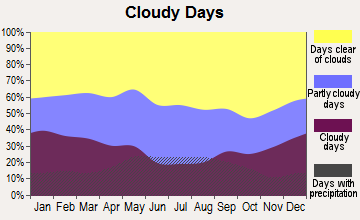
Average climate in South Sand Hills, Texas
Based on data reported by over 4,000 weather stations
Tornado activity:
South Sand Hills-area historical tornado activity is near Texas state average. It is 42% greater than the overall U.S. average.
On 4/21/1957, a category F4 (max. wind speeds 207-260 mph) tornado 25.2 miles away from the South Sand Hills place center injured 7 people and caused between $500,000 and $5,000,000 in damages.
On 4/17/1970, a category F4 tornado 27.1 miles away from the place center injured 24 people and caused between $5,000,000 and $50,000,000 in damages.
Earthquake activity:
South Sand Hills-area historical earthquake activity is significantly above Texas state average. It is 446% greater than the overall U.S. average.On 6/16/1978 at 11:46:54, a magnitude 5.3 (4.4 MB, 4.6 UK, 5.3 ML, Class: Moderate, Intensity: VI - VII) earthquake occurred 134.5 miles away from South Sand Hills center
On 1/2/1992 at 11:45:35, a magnitude 5.0 (4.6 MB, 5.0 LG, Depth: 3.1 mi) earthquake occurred 113.7 miles away from the city center
On 4/14/1995 at 00:32:56, a magnitude 5.7 (5.6 MB, 5.7 MS, 5.7 MW, Depth: 11.1 mi) earthquake occurred 256.7 miles away from the city center
On 3/26/2020 at 15:16:27, a magnitude 5.0 (5.0 MW, Depth: 5.9 mi) earthquake occurred 170.8 miles away from the city center
On 8/23/2011 at 05:46:18, a magnitude 5.3 (5.3 MW, Depth: 2.5 mi) earthquake occurred 239.4 miles away from South Sand Hills center
On 9/3/2016 at 12:02:44, a magnitude 5.8 (5.8 MW, Depth: 3.5 mi) earthquake occurred 373.6 miles away from the city center
Magnitude types: regional Lg-wave magnitude (LG), body-wave magnitude (MB), local magnitude (ML), surface-wave magnitude (MS), moment magnitude (MW)
Natural disasters:
The number of natural disasters in Bailey County (8) is smaller than the US average (15).Major Disasters (Presidential) Declared: 3
Emergencies Declared: 4
Causes of natural disasters: Hurricanes: 3, Fires: 2, Winter Storms: 2, Flood: 1, Tornado: 1, Wind: 1, Other: 1 (Note: some incidents may be assigned to more than one category).
Colleges/universities with over 2000 students nearest to South Sand Hills:
- Eastern New Mexico University-Main Campus (about 35 miles; Portales, NM; Full-time enrollment: 4,263)
- South Plains College (about 38 miles; Levelland, TX; FT enrollment: 7,007)
- Texas Tech University Health Sciences Center (about 59 miles; Lubbock, TX; FT enrollment: 3,269)
- Texas Tech University (about 60 miles; Lubbock, TX; FT enrollment: 29,251)
- Wayland Baptist University (about 65 miles; Plainview, TX; FT enrollment: 5,526)
- West Texas A & M University (about 88 miles; Canyon, TX; FT enrollment: 6,820)
- Amarillo College (about 102 miles; Amarillo, TX; FT enrollment: 6,622)
Points of interest:
Notable locations in South Sand Hills: Circle Back (A), Refuge Headquarters (B). Display/hide their locations on the map
Churches in South Sand Hills include: Hicks Chapel (A), Longview Church (B). Display/hide their locations on the map
Lakes and reservoirs: Lower Pauls Lake (A), Baileyboro Lake (B), Coyote Lake (C), Upper Goose Lake (D), Upper Pauls Lake (E), Upper White Lake (F), Lower White Lake (G), Lower Goose Lake (H). Display/hide their locations on the map
Park in South Sand Hills: Muleshoe National Wildlife Refuge (1). Display/hide its location on the map
| This place: | 2.7 people |
| Texas: | 2.8 people |
| This place: | 72.8% |
| Whole state: | 69.9% |
| This place: | 5.7% |
| Whole state: | 6.0% |
Likely homosexual households (counted as self-reported same-sex unmarried-partner households)
- Lesbian couples: 0.6% of all households
- Gay men: 0.0% of all households
| This place: | 18.3% |
| Whole state: | 15.4% |
| This place: | 6.7% |
| Whole state: | 6.7% |
For population 15 years and over in South Sand Hills:
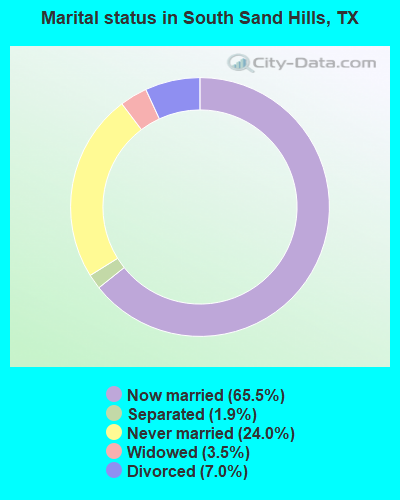
- Never married: 24.0%
- Now married: 65.5%
- Separated: 1.9%
- Widowed: 3.5%
- Divorced: 7.0%
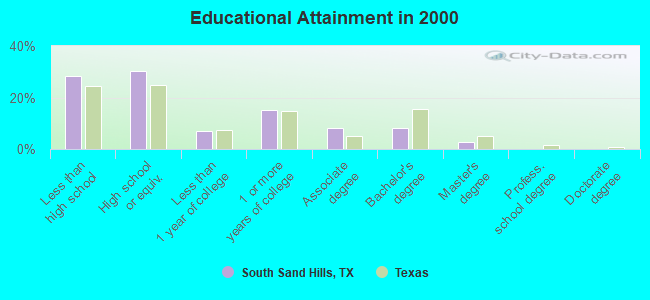
For population 25 years and over in South Sand Hills:
- High school or higher: 71.5%
- Bachelor's degree or higher: 10.7%
- Graduate or professional degree: 2.7%
- Unemployed: 3.6%
- Mean travel time to work (commute): 20.6 minutes
| Here: | 14.6 |
| Texas average: | 15.6 |
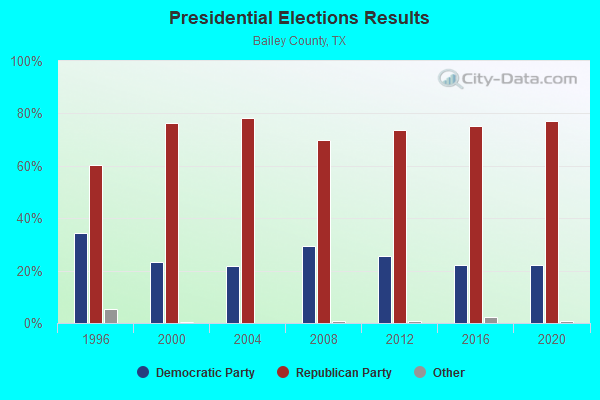
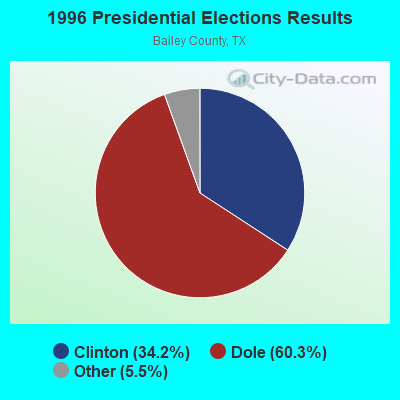
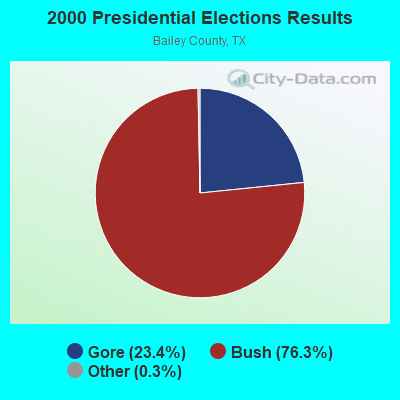
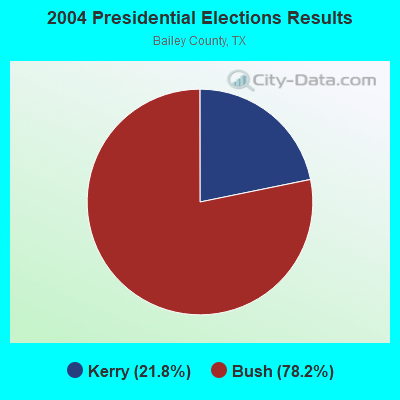
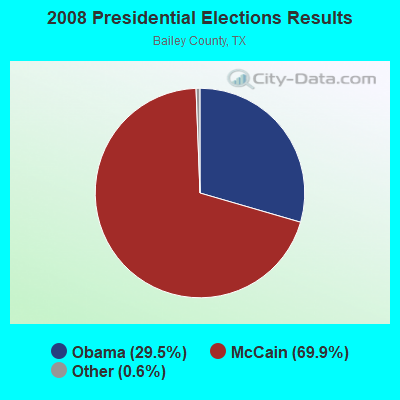
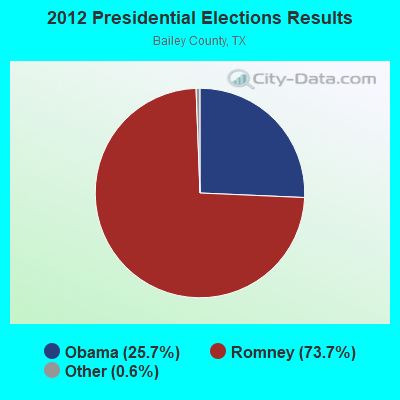
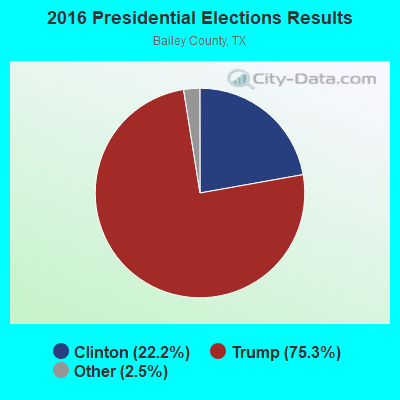
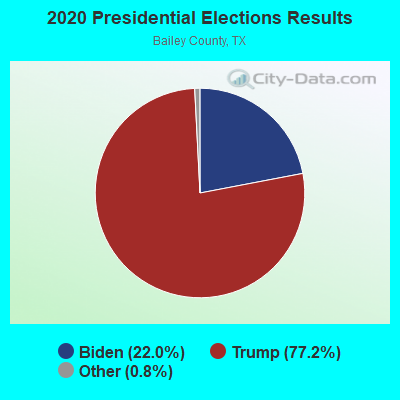
Graphs represent county-level data. Detailed 2008 Election Results
Religion statistics for South Sand Hills, TX (based on Bailey County data)
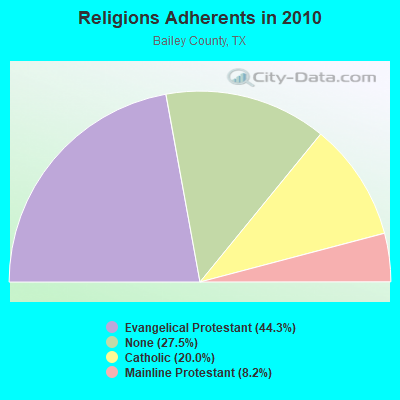
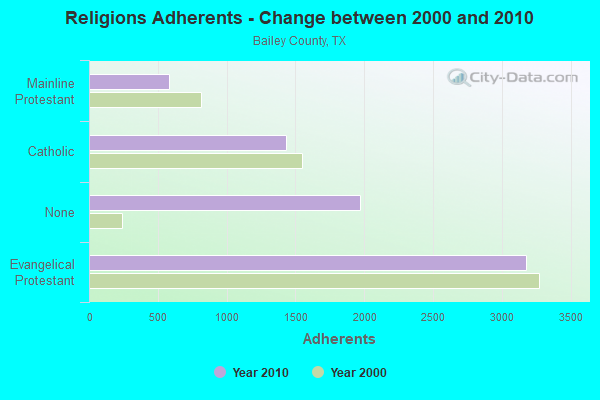
| Religion | Adherents | Congregations |
|---|---|---|
| Evangelical Protestant | 3,174 | 13 |
| Catholic | 1,432 | 1 |
| Mainline Protestant | 585 | 2 |
| Other | 3 | - |
| None | 1,971 | - |
Food Environment Statistics:
| This county: | 3.18 / 10,000 pop. |
| Texas: | 1.47 / 10,000 pop. |
| Here: | 6.36 / 10,000 pop. |
| Texas: | 3.95 / 10,000 pop. |
| Bailey County: | 4.77 / 10,000 pop. |
| Texas: | 6.13 / 10,000 pop. |
| Here: | 9.7% |
| Texas: | 8.9% |
| Bailey County: | 27.4% |
| Texas: | 26.6% |
| Bailey County: | 14.5% |
| State: | 15.7% |
Strongest AM radio stations in South Sand Hills:
- KICA (980 AM; 50 kW; CLOVIS, NM; Owner: BROADCAST ENTERTAINMENT CORPORATION)
- KMUL (1380 AM; 50 kW; MULESHOE, TX; Owner: BROADCAST ENTERTAINMENT CORPORATION)
- KIJN (1060 AM; daytime; 10 kW; FARWELL, TX; Owner: METROPOLITIAN RADIO GROUP, INC.)
- KINF (1020 AM; 50 kW; ROSWELL, NM; Owner: JAMES CRYSTAL HOLDINGS OF NEW MEXICO, INC.)
- KFYO (790 AM; 5 kW; LUBBOCK, TX; Owner: CAPSTAR TX LIMITED PARTNERSHIP)
- KKOB (770 AM; 50 kW; ALBUQUERQUE, NM; Owner: CITADEL BROADCASTING COMPANY)
- KJTV (950 AM; 5 kW; LUBBOCK, TX; Owner: RAMAR COMMUNICATIONS II, LTD.)
- KVOP (1090 AM; 5 kW; PLAINVIEW, TX; Owner: EQUICOM, INC)
- KGYN (1210 AM; 50 kW; GUYMON, OK; Owner: TELNS BROADCASTING COMPANY, INC.)
- KZZN (1490 AM; 1 kW; LITTLEFIELD, TX; Owner: EMIL MACHA)
- KGNC (710 AM; 10 kW; AMARILLO, TX; Owner: MCC RADIO, LLC)
- KLVT (1230 AM; 1 kW; LEVELLAND, TX; Owner: PAUL R. BEANE)
- KYKK (1110 AM; daytime; 5 kW; HUMBLE CITY, NM; Owner: NOALMARK BROADCASTING CORPORATION)
Strongest FM radio stations in South Sand Hills:
- K220FT (91.9 FM; PORTALES, NM; Owner: CALVARY CHAPEL OF TWIN FALLS, INC.)
- KMUL-FM (103.1 FM; MULESHOE, TX; Owner: BROADCAST ENTERTAINMENT CORPORATION)
- KAIQ (95.5 FM; WOLFFORTH, TX; Owner: LITTLEFIELD BROADCASTING, L.L.C.)
- KSMX (107.5 FM; CLOVIS, NM; Owner: ROONEY MOON BROADCASTING, INC.)
TV broadcast stations around South Sand Hills:
- KLBK-TV (Channel 13; LUBBOCK, TX; Owner: QUORUM OF TEXAS LICENSE, LLC)
- KENW (Channel 3; PORTALES, NM; Owner: EASTERN NEW MEXICO UNIVERSITY)
- K24DU (Channel 24; DORA, NM; Owner: NVG-AMARILLO, LLC)
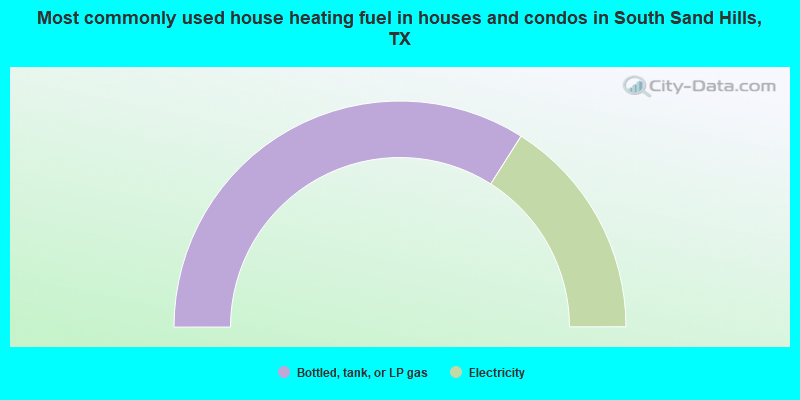
- 68.0%Bottled, tank, or LP gas
- 32.0%Electricity
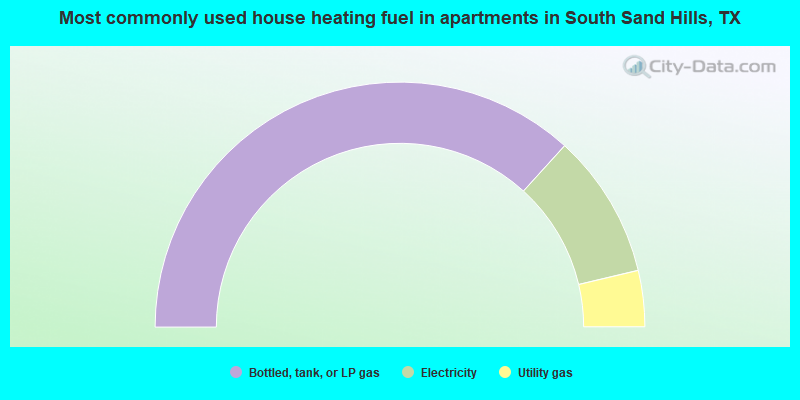
- 73.4%Bottled, tank, or LP gas
- 19.1%Electricity
- 7.4%Utility gas
South Sand Hills compared to Texas state average:
- Median house value below state average.
- Unemployed percentage significantly below state average.
- Black race population percentage significantly below state average.
- Median age significantly above state average.
- Foreign-born population percentage significantly below state average.
- Length of stay since moving in significantly above state average.
- Number of rooms per house significantly below state average.
- House age significantly below state average.
- Percentage of population with a bachelor's degree or higher below state average.