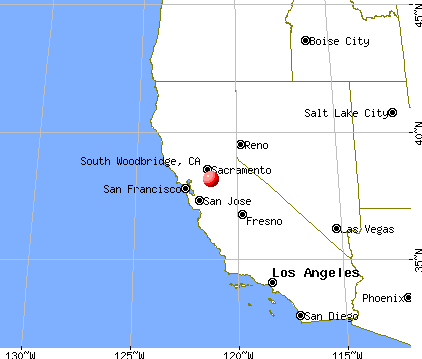
South Woodbridge, California
Submit your own pictures of this place and show them to the world
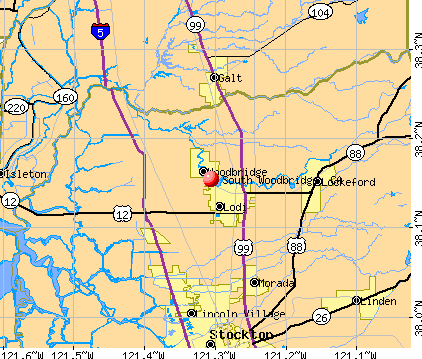
- OSM Map
- General Map
- Google Map
- MSN Map
| Males: 1,685 | |
| Females: 1,623 |
| Median resident age: | 33.1 years |
| California median age: | 33.3 years |
Zip codes: 95258.
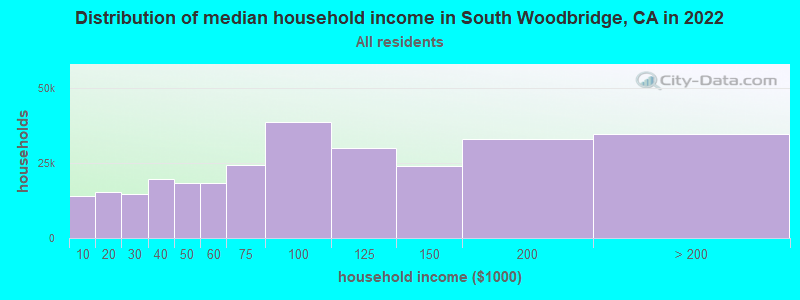
| South Woodbridge: | $101,053 |
| CA: | $91,551 |
Estimated per capita income in 2022: $38,953 (it was $19,067 in 2000)
South Woodbridge CDP income, earnings, and wages data
Estimated median house or condo value in 2022: $516,254 (it was $134,700 in 2000)
| South Woodbridge: | $516,254 |
| CA: | $715,900 |
Mean prices in 2022: all housing units: $555,132; detached houses: $579,147; townhouses or other attached units: $413,977; in 2-unit structures: $846,717; in 3-to-4-unit structures: $323,925; in 5-or-more-unit structures: $223,694; mobile homes: $155,998; occupied boats, rvs, vans, etc.: $9,512
South Woodbridge, CA residents, houses, and apartments details
Detailed information about poverty and poor residents in South Woodbridge, CA
Compare current foreclosures near South Woodbridge, CA:
| Photo | Address | Area | Beds / Baths | Price | Details |
|---|---|---|---|---|---|

|
#1
Quail Lakes Dr Apt 126
Stockton, CA 95207
|
612 sq. feet
|
1 baths 1 beds |
$185,000
|
show details |

|
#2
Vineyard Dr
Lodi, CA 95240
|
1,225 sq. feet
|
2 baths 3 beds |
$370,000
|
show details |

|
#3
E Bianchi Rd Apt 2
Stockton, CA 95207
|
840 sq. feet
|
1 baths 2 beds |
$189,000
|
show details |

|
#4
W Benjamin Holt Dr
Stockton, CA 95219
|
926 sq. feet
|
1 baths 2 beds |
show details | |

|
#5
Almond Dr Apt 84
Lodi, CA 95240
|
1,064 sq. feet
|
1 baths 2 beds |
show details | |

|
#6
N Country Club Blvd
Stockton, CA 95204
|
1,615 sq. feet
|
2 baths 3 beds |
show details | |

|
#7
Hacienda Ct
Stockton, CA 95209
|
1,347 sq. feet
|
2 baths 3 beds |
show details | |

|
#8
Nygaard Ln
Wilton, CA 95693
|
2,925 sq. feet
|
3 baths 3 beds |
show details | |

|
#9
Date St
Stockton, CA 95215
|
1,050 sq. feet
|
1 baths 3 beds |
show details | |

|
#10
Finland Ave
Stockton, CA 95205
|
1,199 sq. feet
|
1 baths 3 beds |
show details |
| Photo | Address | Area | Beds / Baths | Price | Details |
|---|---|---|---|---|---|

|
#11
Cambria Dr
Stockton, CA 95205
|
1,019 sq. feet
|
1 baths 3 beds |
show details | |

|
#12
Clipper Ln
Stockton, CA 95204
|
1,402 sq. feet
|
2 baths 3 beds |
show details | |

|
#13
W Brannan Island Rd
Isleton, CA 95641
|
- sq. feet
|
2 baths 3 beds |
show details | |

|
#14
Shirleen Dr
Stockton, CA 95209
|
2,837 sq. feet
|
3 baths 4 beds |
show details | |

|
#15
Boston Ave
Stockton, CA 95206
|
1,294 sq. feet
|
2 baths 4 beds |
show details | |

|
#16
Mcfarland St
Galt, CA 95632
|
1,452 sq. feet
|
2 baths 3 beds |
show details | |

|
#17
Betty Mae Ct
Stockton, CA 95212
|
2,468 sq. feet
|
2 baths 4 beds |
show details | |

|
#18
Creek Trail Cir
Stockton, CA 95209
|
2,135 sq. feet
|
3 baths 5 beds |
show details | |

|
#19
Atlanta Cir
Stockton, CA 95219
|
- sq. feet
|
2 baths 3 beds |
show details | |

|
#20
E Taylor St
Stockton, CA 95205
|
960 sq. feet
|
2 baths 3 beds |
show details |
| Photo | Address | Area | Beds / Baths | Price | Details |
|---|---|---|---|---|---|

|
#21
Christina Ave
Stockton, CA 95204
|
- sq. feet
|
2 baths 3 beds |
show details | |

|
#22
Shorelake Ct
Stockton, CA 95219
|
2,668 sq. feet
|
3 baths 4 beds |
show details | |

|
#23
N Ham Ln
Lodi, CA 95242
|
1,767 sq. feet
|
3 baths 3 beds |
show details | |

|
#24
Myran Ave
Stockton, CA 95205
|
1,025 sq. feet
|
1 baths 2 beds |
show details | |

|
#25
W Sonoma Ave
Stockton, CA 95204
|
1,236 sq. feet
|
1 baths 3 beds |
show details | |

|
#26
Rutledge Dr
Lodi, CA 95242
|
1,104 sq. feet
|
2 baths 3 beds |
show details | |

|
#27
Hayden Brook Dr
Stockton, CA 95212
|
2,209 sq. feet
|
3 baths 5 beds |
show details | |

|
#28
W Poplar St
Stockton, CA 95203
|
1,335 sq. feet
|
1 baths 2 beds |
show details | |

|
#29
Oakfield Dr
Stockton, CA 95210
|
- sq. feet
|
3 baths 4 beds |
show details | |

|
#30
W Harding Way
Stockton, CA 95204
|
2,029 sq. feet
|
2 baths 4 beds |
show details |
| Photo | Address | Area | Beds / Baths | Price | Details |
|---|---|---|---|---|---|

|
#31
Grouse Run Dr
Stockton, CA 95207
|
1,167 sq. feet
|
2 baths 2 beds |
show details | |

|
#32
Tina Pl
Stockton, CA 95215
|
4,042 sq. feet
|
4 baths 5 beds |
show details | |

|
#33
Canyon Creek Dr
Stockton, CA 95207
|
1,516 sq. feet
|
2 baths 2 beds |
show details | |

|
#34
Embarcadero Dr
Stockton, CA 95219
|
2,145 sq. feet
|
3 baths 3 beds |
show details | |

|
#35
E Harper St
Stockton, CA 95204
|
866 sq. feet
|
1 baths 2 beds |
show details | |

|
#36
Silver Creek Cir
Stockton, CA 95207
|
2,294 sq. feet
|
4 baths 6 beds |
show details | |

|
#37
Towers Pl
Stockton, CA 95215
|
3,002 sq. feet
|
3 baths 3 beds |
show details | |

|
#38
Round Valley Cir
Stockton, CA 95207
|
1,999 sq. feet
|
3 baths 4 beds |
show details | |

|
#39
Pacific Ave Apt 15
Stockton, CA 95207
|
594 sq. feet
|
1 baths 1 beds |
show details | |

|
#40
Tina Pl
Stockton, CA 95215
|
4,042 sq. feet
|
4 baths 5 beds |
show details |
| Photo | Address | Area | Beds / Baths | Price | Details |
|---|---|---|---|---|---|

|
#41
E Churchill St
Stockton, CA 95204
|
1,014 sq. feet
|
1 baths 2 beds |
show details | |

|
#42
Indiana St
Woodbridge, CA 95258
|
1,043 sq. feet
|
2 baths 3 beds |
show details | |

|
#43
Amberfield Cir
Stockton, CA 95219
|
1,674 sq. feet
|
2 baths 3 beds |
show details | |

|
#44
Del Rio Dr
Stockton, CA 95204
|
1,013 sq. feet
|
1 baths 3 beds |
show details | |

|
#45
N Filbert St
Stockton, CA 95205
|
1,443 sq. feet
|
2 baths 3 beds |
show details | |

|
#46
E Hampton St
Stockton, CA 95204
|
880 sq. feet
|
1 baths 1 beds |
show details | |

|
#47
Myran Ave
Stockton, CA 95205
|
684 sq. feet
|
1 baths 1 beds |
show details | |

|
#48
E Geary St
Stockton, CA 95204
|
1,211 sq. feet
|
1 baths 3 beds |
show details | |

|
#49
Del Rio Dr
Stockton, CA 95204
|
1,566 sq. feet
|
1 baths 4 beds |
show details | |

|
Check over 1 million property listings on Foreclosure.com!
|
browse all offers | |||

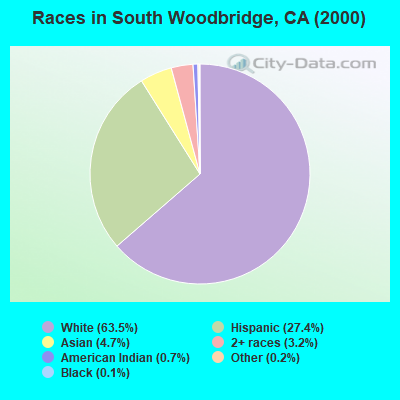
- 1,79563.5%White alone
- 77427.4%Hispanic
- 1334.7%Asian alone
- 903.2%Two or more races
- 210.7%American Indian alone
- 70.2%Other race alone
- 40.1%Black alone
- 10.04%Native Hawaiian and Other
Pacific Islander alone
 Recent articles from our blog. Our writers, many of them Ph.D. graduates or candidates, create easy-to-read articles on a wide variety of topics.

Ancestries: German (19.5%), Irish (10.5%), English (7.2%), United States (4.4%), Swedish (3.5%), Scotch-Irish (3.1%).
Current Local Time: PST time zone
Land area: 0.37 square miles.
Population density: 8,987 people per square mile (high).
341 residents are foreign born (7.5% Latin America, 2.6% Asia, 2.0% Europe).
| This place: | 12.1% |
| California: | 26.2% |
| South Woodbridge CDP: | 1.0% ($1,288) |
| California: | 0.8% ($1,564) |
Nearest city with pop. 50,000+: Lodi, CA  (2.2 miles , pop. 56,999).
Nearest city with pop. 200,000+: Stockton, CA (12.3 miles , pop. 243,771).
Nearest city with pop. 1,000,000+: Los Angeles, CA (325.5 miles , pop. 3,694,820).
Nearest cities:
), ), ), ), ), ), Latitude: 38.15 N, Longitude: 121.31 W
Area code commonly used in this area: 209
| Here: | 6.8% |
| California: | 5.1% |
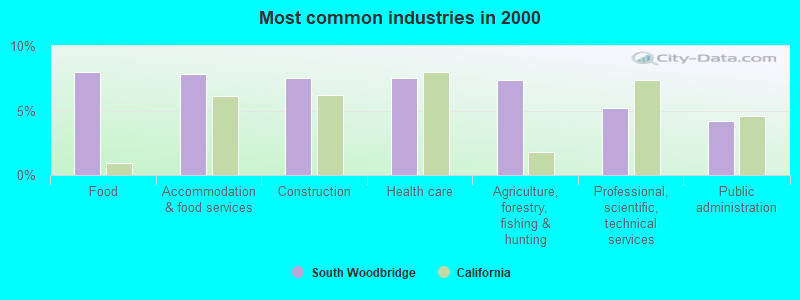
- Food (8.0%)
- Accommodation & food services (7.8%)
- Construction (7.6%)
- Health care (7.6%)
- Agriculture, forestry, fishing & hunting (7.4%)
- Professional, scientific, technical services (5.2%)
- Public administration (4.2%)
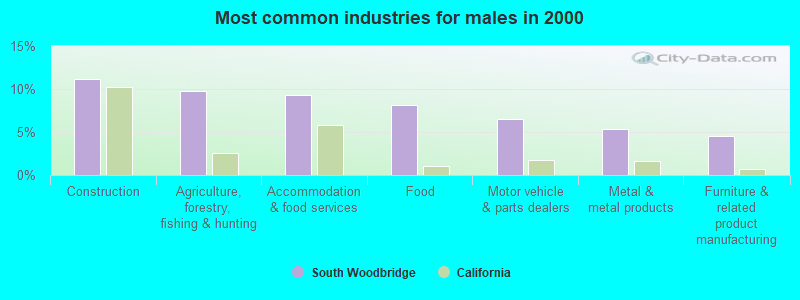
- Construction (11.1%)
- Agriculture, forestry, fishing & hunting (9.8%)
- Accommodation & food services (9.4%)
- Food (8.1%)
- Motor vehicle & parts dealers (6.5%)
- Metal & metal products (5.4%)
- Furniture & related product manufacturing (4.5%)
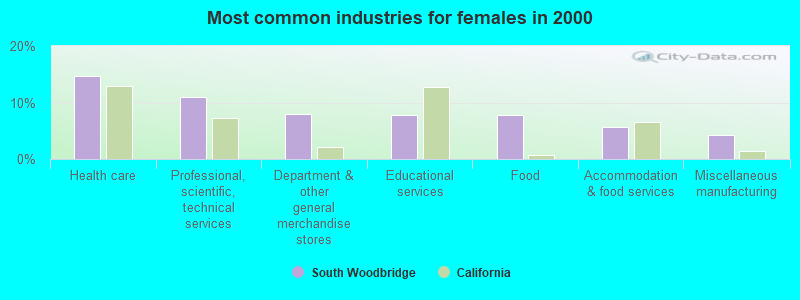
- Health care (14.7%)
- Professional, scientific, technical services (11.0%)
- Department & other general merchandise stores (7.9%)
- Educational services (7.7%)
- Food (7.7%)
- Accommodation & food services (5.6%)
- Miscellaneous manufacturing (4.2%)
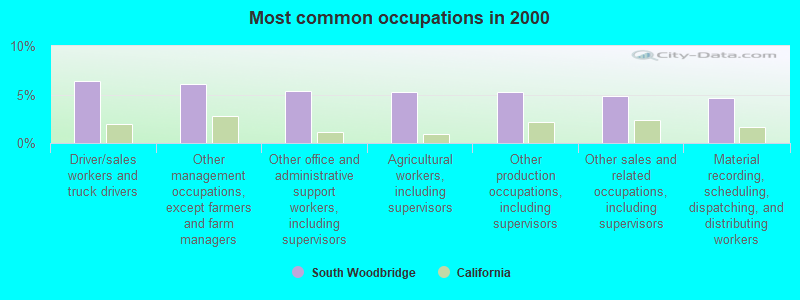
- Driver/sales workers and truck drivers (6.4%)
- Other management occupations, except farmers and farm managers (6.1%)
- Other office and administrative support workers, including supervisors (5.4%)
- Agricultural workers, including supervisors (5.3%)
- Other production occupations, including supervisors (5.2%)
- Other sales and related occupations, including supervisors (4.8%)
- Material recording, scheduling, dispatching, and distributing workers (4.7%)
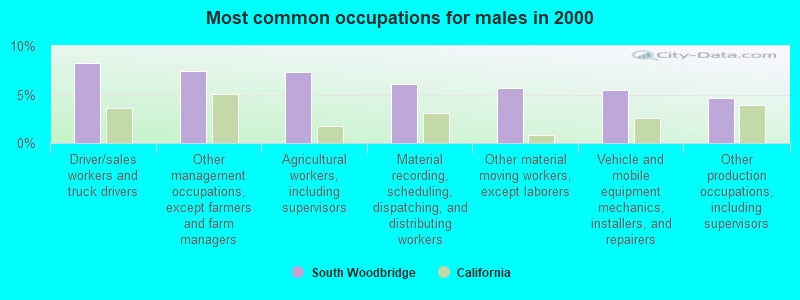
- Driver/sales workers and truck drivers (8.3%)
- Other management occupations, except farmers and farm managers (7.4%)
- Agricultural workers, including supervisors (7.3%)
- Material recording, scheduling, dispatching, and distributing workers (6.1%)
- Other material moving workers, except laborers (5.6%)
- Vehicle and mobile equipment mechanics, installers, and repairers (5.5%)
- Other production occupations, including supervisors (4.7%)
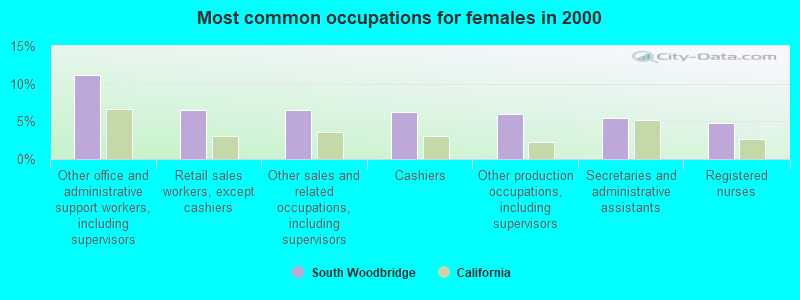
- Other office and administrative support workers, including supervisors (11.2%)
- Retail sales workers, except cashiers (6.6%)
- Other sales and related occupations, including supervisors (6.6%)
- Cashiers (6.2%)
- Other production occupations, including supervisors (6.0%)
- Secretaries and administrative assistants (5.4%)
- Registered nurses (4.8%)
Average climate in South Woodbridge, California
Based on data reported by over 4,000 weather stations


(lower is better)
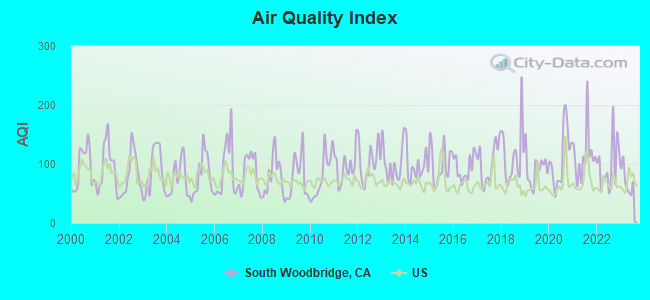
Air Quality Index (AQI) level in 2023 was 71.8. This is about average.
| City: | 71.8 |
| U.S.: | 72.6 |
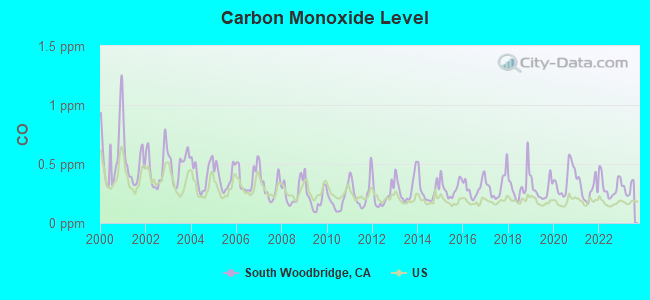
Carbon Monoxide (CO) [ppm] level in 2023 was 0.295. This is about average. Closest monitor was 2.8 miles away from the city center.
| City: | 0.295 |
| U.S.: | 0.251 |
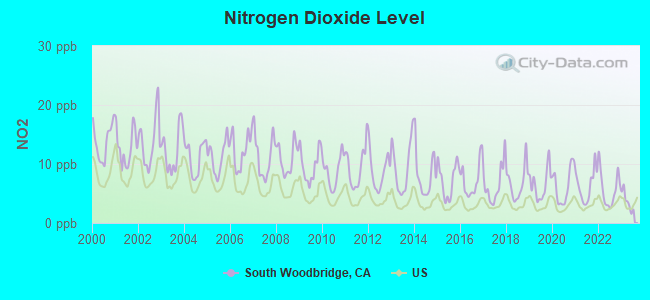
Nitrogen Dioxide (NO2) [ppb] level in 2023 was 3.71. This is better than average. Closest monitor was 12.0 miles away from the city center.
| City: | 3.71 |
| U.S.: | 5.11 |
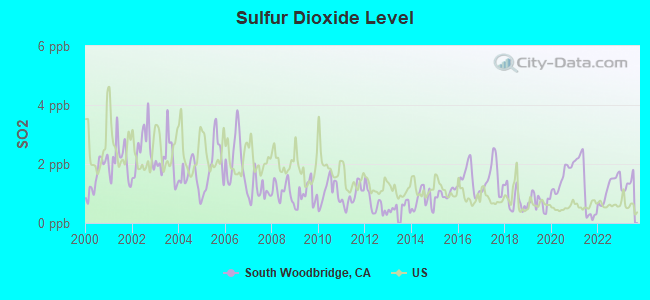
Sulfur Dioxide (SO2) [ppb] level in 2023 was 1.32. This is about average. Closest monitor was 14.2 miles away from the city center.
| City: | 1.32 |
| U.S.: | 1.51 |
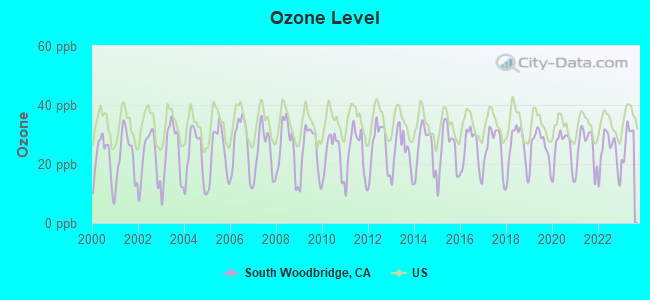
Ozone [ppb] level in 2023 was 28.3. This is about average. Closest monitor was 2.8 miles away from the city center.
| City: | 28.3 |
| U.S.: | 33.3 |
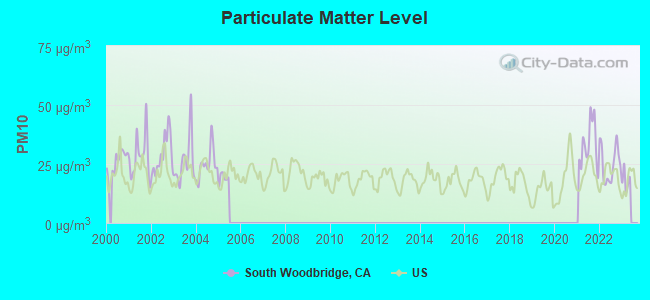
Particulate Matter (PM10) [µg/m3] level in 2022 was 25.0. This is worse than average. Closest monitor was 9.0 miles away from the city center.
| City: | 25.0 |
| U.S.: | 19.2 |
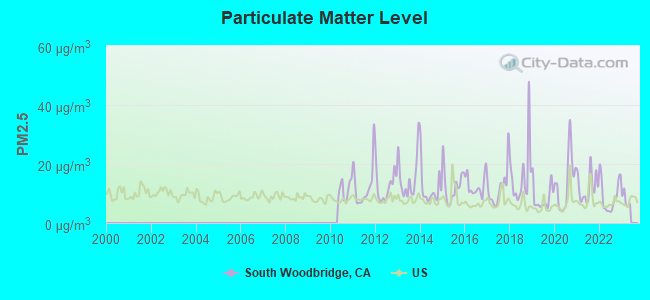
Particulate Matter (PM2.5) [µg/m3] level in 2022 was 9.27. This is about average. Closest monitor was 13.4 miles away from the city center.
| City: | 9.27 |
| U.S.: | 8.11 |
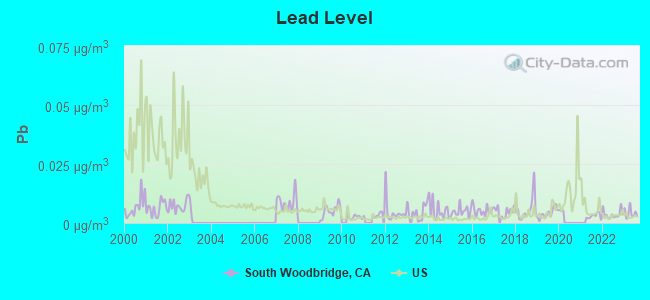
Lead (Pb) [µg/m3] level in 2023 was 0.00414. This is significantly better than average. Closest monitor was 9.4 miles away from the city center.
| City: | 0.00414 |
| U.S.: | 0.00931 |
Earthquake activity:
South Woodbridge-area historical earthquake activity is significantly above California state average. It is 7903% greater than the overall U.S. average.On 4/18/1906 at 13:12:21, a magnitude 7.9 (7.9 UK, Class: Major, Intensity: VIII - XII) earthquake occurred 92.8 miles away from South Woodbridge center, causing $524,000,000 total damage
On 10/18/1989 at 00:04:15, a magnitude 7.1 (6.5 MB, 7.1 MS, 6.9 MW, 7.0 ML) earthquake occurred 76.6 miles away from the city center, causing 62 deaths (62 shaking deaths) and 3757 injuries, causing $1,305,032,704 total damage
On 7/21/1952 at 11:52:14, a magnitude 7.7 (7.7 UK) earthquake occurred 253.0 miles away from the city center, causing $50,000,000 total damage
On 11/4/1927 at 13:51:53, a magnitude 7.5 (7.5 UK) earthquake occurred 224.6 miles away from the city center
On 10/3/1915 at 06:52:48, a magnitude 7.6 (7.6 UK) earthquake occurred 260.3 miles away from South Woodbridge center
On 12/21/1932 at 06:10:09, a magnitude 7.2 (7.2 UK) earthquake occurred 176.5 miles away from South Woodbridge center
Magnitude types: body-wave magnitude (MB), local magnitude (ML), surface-wave magnitude (MS), moment magnitude (MW)
Natural disasters:
The number of natural disasters in San Joaquin County (20) is greater than the US average (15).Major Disasters (Presidential) Declared: 15
Emergencies Declared: 3
Causes of natural disasters: Floods: 13, Storms: 7, Mudslides: 4, Landslides: 3, Winter Storms: 3, Drought: 1, Earthquake: 1, Freeze: 1, Heavy Rain: 1, Hurricane: 1, Tornado: 1, Wind: 1, Other: 2 (Note: some incidents may be assigned to more than one category).
Hospitals and medical centers near South Woodbridge:
- WOODBRIDGE ICF (Hospital, about 1 miles away; WOODBRIDGE, CA)
- LODI MEMORIAL HOSPITAL - WEST D/P SNF (Nursing Home, about 1 miles away; LODI, CA)
- LODI MEMORIAL HOSPITAL - WEST (Hospital, about 2 miles away; LODI, CA)
- WINE COUNTRY CARE CENTER (Nursing Home, about 2 miles away; LODI, CA)
- ARBOR NURSING CENTER (Nursing Home, about 2 miles away; LODI, CA)
- TOKAY DIALYSIS CENTER (Dialysis Facility, about 3 miles away; LODI, CA)
- BECHTHOLD CONV HOSP (Nursing Home, about 3 miles away; LODI, CA)
Amtrak stations near South Woodbridge:
- 14 miles: STOCKTON, CABRAL STATION (STOCKTON, 949 E. CHANNEL ST.) . Services: public payphones.
- 15 miles: STOCKTON, SAN JOAQUIN ST. (STOCKTON, 735 S. SAN JOAQUIN ST.) . Services: ticket office, fully wheelchair accessible, enclosed waiting area, public restrooms, public payphones, vending machines, free short-term parking, call for car rental service, call for taxi service, public transit connection.
Colleges/universities with over 2000 students nearest to South Woodbridge:
- San Joaquin Delta College (about 12 miles; Stockton, CA; Full-time enrollment: 12,167)
- University of the Pacific (about 13 miles; Stockton, CA; FT enrollment: 4,999)
- Cosumnes River College (about 22 miles; Sacramento, CA; FT enrollment: 9,327)
- California State University-Sacramento (about 29 miles; Sacramento, CA; FT enrollment: 22,234)
- Sacramento City College (about 29 miles; Sacramento, CA; FT enrollment: 15,963)
- Los Medanos College (about 32 miles; Pittsburg, CA; FT enrollment: 5,289)
- University of Phoenix-Sacramento Valley Campus (about 35 miles; Sacramento, CA; FT enrollment: 2,855)
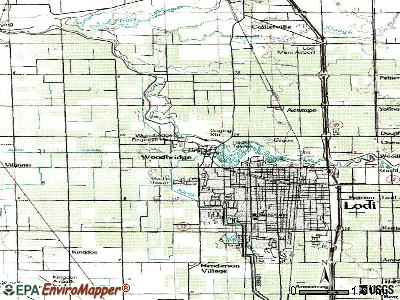
Points of interest:
Notable location: Woodbridge Fire Protection District Station 1 (A). Display/hide its location on the map
| This place: | 3.1 people |
| California: | 2.9 people |
| This place: | 82.3% |
| Whole state: | 69.4% |
| This place: | 4.4% |
| Whole state: | 5.9% |
Likely homosexual households (counted as self-reported same-sex unmarried-partner households)
- Lesbian couples: 0.2% of all households
- Gay men: 0.2% of all households
| This place: | 7.1% |
| Whole state: | 14.2% |
| This place: | 3.9% |
| Whole state: | 6.3% |
For population 15 years and over in South Woodbridge:
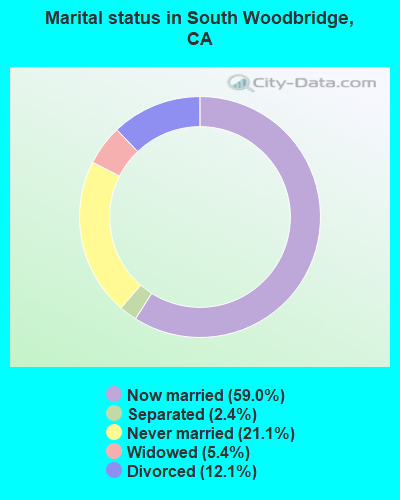
- Never married: 21.1%
- Now married: 59.0%
- Separated: 2.4%
- Widowed: 5.4%
- Divorced: 12.1%
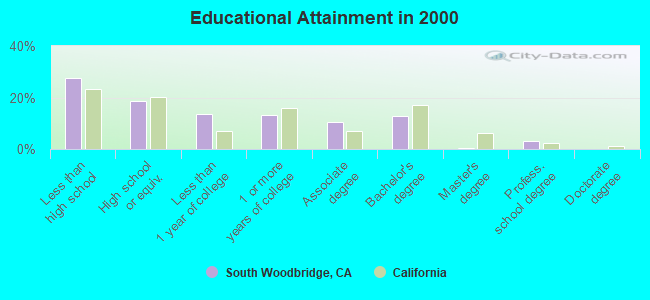
For population 25 years and over in South Woodbridge:
- High school or higher: 72.4%
- Bachelor's degree or higher: 16.3%
- Graduate or professional degree: 3.5%
- Unemployed: 7.4%
- Mean travel time to work (commute): 33.1 minutes
| Here: | 13.8 |
| California average: | 16.1 |
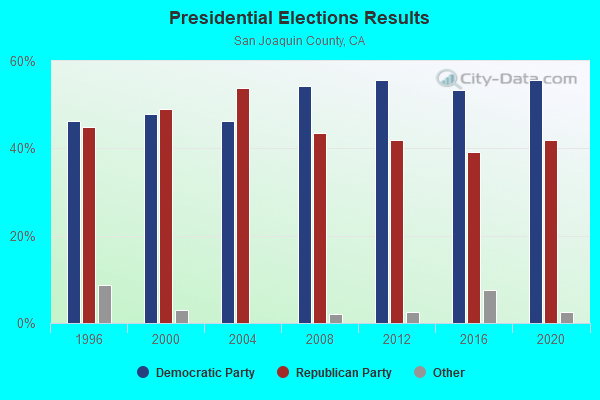
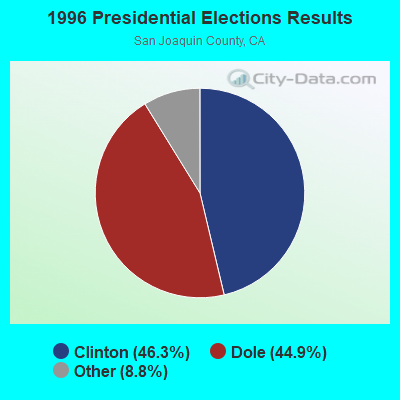
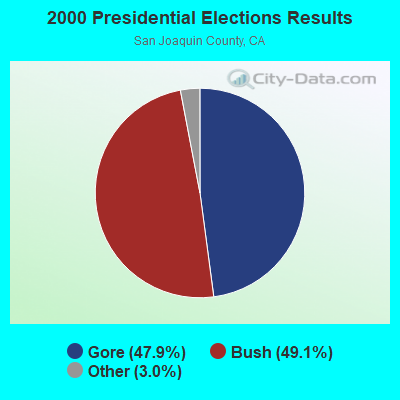
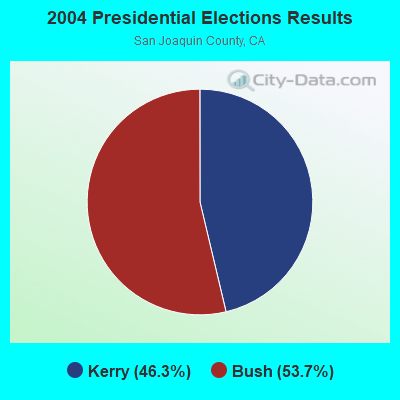
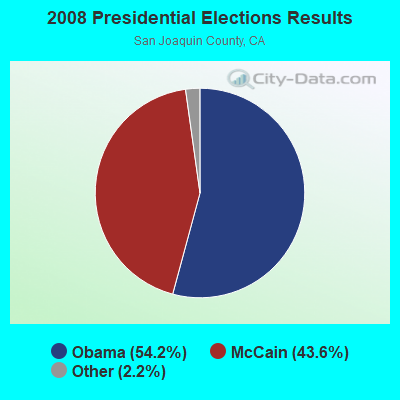
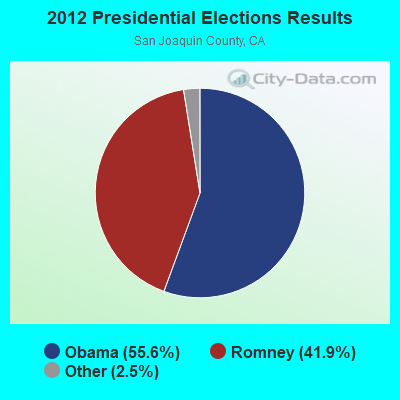
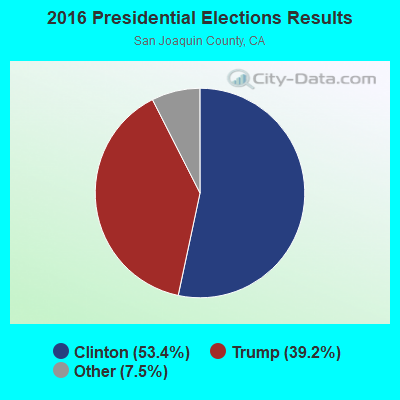

Graphs represent county-level data. Detailed 2008 Election Results
Religion statistics for South Woodbridge, CA (based on San Joaquin County data)
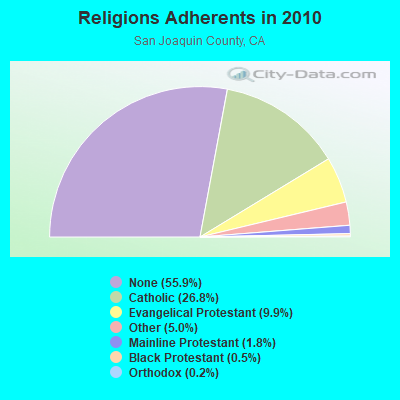
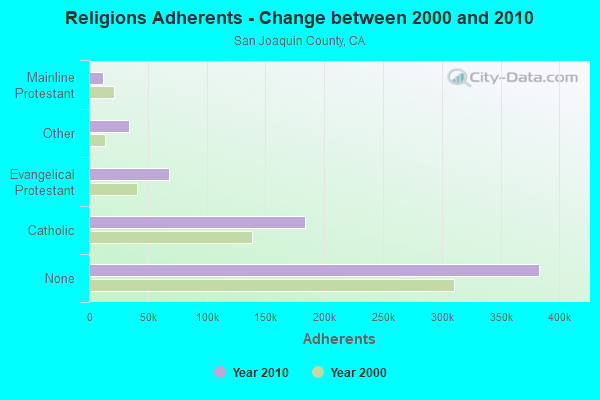
| Religion | Adherents | Congregations |
|---|---|---|
| Catholic | 183,692 | 18 |
| Evangelical Protestant | 67,940 | 304 |
| Other | 33,949 | 68 |
| Mainline Protestant | 12,067 | 43 |
| Black Protestant | 3,251 | 17 |
| Orthodox | 1,368 | 2 |
| None | 383,039 | - |
Food Environment Statistics:
| San Joaquin County: | 2.34 / 10,000 pop. |
| State: | 2.14 / 10,000 pop. |
| Here: | 0.04 / 10,000 pop. |
| California: | 0.04 / 10,000 pop. |
| This county: | 0.67 / 10,000 pop. |
| State: | 0.62 / 10,000 pop. |
| Here: | 2.02 / 10,000 pop. |
| California: | 1.49 / 10,000 pop. |
| Here: | 5.23 / 10,000 pop. |
| State: | 7.42 / 10,000 pop. |
| This county: | 7.1% |
| California: | 7.3% |
| Here: | 29.2% |
| California: | 21.3% |
| This county: | 16.5% |
| State: | 17.9% |
6.18% of this county's 2021 resident taxpayers lived in other counties in 2020 ($75,687 average adjusted gross income)
| Here: | 6.18% |
| California average: | 5.19% |
0.01% of residents moved from foreign countries ($71 average AGI)
San Joaquin County: 0.01% California average: 0.03%
Top counties from which taxpayers relocated into this county between 2020 and 2021:
| from Alameda County, CA | |
| from Santa Clara County, CA | |
| from Stanislaus County, CA |
5.64% of this county's 2020 resident taxpayers moved to other counties in 2021 ($66,959 average adjusted gross income)
| Here: | 5.64% |
| California average: | 6.14% |
0.01% of residents moved to foreign countries ($82 average AGI)
San Joaquin County: 0.01% California average: 0.02%
Top counties to which taxpayers relocated from this county between 2020 and 2021:
| to Stanislaus County, CA | |
| to Sacramento County, CA | |
| to Alameda County, CA |
Strongest AM radio stations in South Woodbridge:
- KHTK (1140 AM; 50 kW; SACRAMENTO, CA; Owner: INFINITY RADIO SUBSIDIARY OPERATIONS INC.)
- KSTE (650 AM; 25 kW; RANCHO CORDOVA, CA; Owner: AMFM RADIO LICENSES, L.L.C.)
- KCVR (1570 AM; 5 kW; LODI, CA; Owner: ENTRAVISION HOLDINGS, LLC)
- KCBC (770 AM; 50 kW; RIVERBANK, CA; Owner: KIERTRON, INC.)
- KNBR (680 AM; 50 kW; SAN FRANCISCO, CA; Owner: KNBR LICO, INC.)
- KTRB (860 AM; 50 kW; MODESTO, CA; Owner: PAPPAS RADIO OF CALIFORNIA, A CALIFORNIA LIMITED PARTNERSHIP)
- KGO (810 AM; 50 kW; SAN FRANCISCO, CA; Owner: KGO-AM RADIO, INC.)
- KFIA (710 AM; 25 kW; CARMICHAEL, CA; Owner: VISTA BROADCASTING INC.)
- KCBS (740 AM; 50 kW; SAN FRANCISCO, CA; Owner: INFINITY BROADCASTING OPERATIONS, INC.)
- KTCT (1050 AM; 50 kW; SAN MATEO, CA; Owner: SUSQUEHANNA RADIO CORP.)
- KFBK (1530 AM; 50 kW; SACRAMENTO, CA; Owner: AMFM RADIO LICENSES, L.L.C.)
- KSTN (1420 AM; 5 kW; STOCKTON, CA; Owner: SAN JOAQUIN BROADCASTING CO.)
- KFAX (1100 AM; 50 kW; SAN FRANCISCO, CA; Owner: GOLDEN GATE BROADCASTING CO, INC.)
Strongest FM radio stations in South Woodbridge:
- KJOY (99.3 FM; STOCKTON, CA; Owner: CITADEL BROADCASTING COMPANY)
- KKSF-FM1 (103.7 FM; PLEASANTON, ETC., CA; Owner: AMFM RADIO LICENSES, L.L.C.)
- KBLX-FM2 (102.9 FM; PLEASANTON, CA; Owner: ICBC BROADCAST HOLDINGS -CA, INC.)
- KSOL-FM3 (98.9 FM; PLEASANTON, CA; Owner: TMS LICENSE CALIFORNIA, INC)
- KFRC-FM3 (99.7 FM; WALNUT CREEK, CA; Owner: INFINITY KFRC-FM, INC.)
- KZBR-FM1 (95.7 FM; WALNUT CREEK, CA; Owner: BONNEVILLE HOLDING COMPANY)
- KMEL-FM1 (106.1 FM; CONCORD, CA; Owner: AMFM RADIO LICENSES, L.L.C.)
- KISQ-FM3 (98.1 FM; CONCORD, CA; Owner: AMFM RADIO LICENSES, L.L.C.)
- KWIN (97.7 FM; LODI, CA; Owner: CITADEL BROADCASTING COMPANY)
- KOSO (93.1 FM; PATTERSON, CA; Owner: CAPSTAR TX LIMITED PARTNERSHIP)
- K238AC (95.5 FM; SALIDA, CA; Owner: FAMILY STATIONS, INC.)
- KQOD (100.1 FM; STOCKTON, CA; Owner: CAPSTAR TX LIMITED PARTNERSHIP)
- KXJZ (88.9 FM; SACRAMENTO, CA; Owner: CALIFORNIA STATE UNIV., SACRAMENTO)
- KEDR (88.1 FM; SACRAMENTO, CA; Owner: FAMILY STATIONS, INC.)
- KUIC (95.3 FM; VACAVILLE, CA; Owner: KUIC, INC.)
- KUOP (91.3 FM; STOCKTON, CA; Owner: UNIVERSITY OF THE PACIFIC)
- KHOP (95.1 FM; OAKDALE, CA; Owner: CITADEL BROADCASTING COMPANY)
- KYCC (90.1 FM; STOCKTON, CA; Owner: YOUR CHRISTIAN COMPANION NETWORK, INC.)
- KXCL (103.9 FM; YUBA CITY, CA; Owner: HARLAN COMMUNICATIONS, INC.)
- KBAA (94.5 FM; GILROY, CA; Owner: INFINITY RADIO OPERATIONS INC.)
TV broadcast stations around South Woodbridge:
- KUVS (Channel 19; MODESTO, CA; Owner: KUVS LICENSE PARTNERSHIP, G.P.)
- KOVR (Channel 13; STOCKTON, CA; Owner: SCI - SACRAMENTO LICENSEE, LLC)
- KXTV (Channel 10; SACRAMENTO, CA; Owner: KXTV, INC.)
- KCRA-TV (Channel 3; SACRAMENTO, CA; Owner: KCRA HEARST-ARGYLE TELEVISION, INC.)
- KQCA (Channel 58; STOCKTON, CA; Owner: KCRA HEARST-ARGYLE TELEVISION, INC.)
- KMAX-TV (Channel 31; SACRAMENTO, CA; Owner: UPN STATIONS GROUP INC.)
- KSPX (Channel 29; SACRAMENTO, CA; Owner: PAXSON SACRAMENTO LICENSE, INC.)
- KTXL (Channel 40; SACRAMENTO, CA; Owner: CHANNEL 40, INC.)
- KVIE (Channel 6; SACRAMENTO, CA; Owner: KVIE, INC.)
- KDTS-CA (Channel 52; STOCKTON, CA; Owner: WORD OF GOD FELLOWSHIP, INC.)
- KMMK-LP (Channel 14; SACRAMENTO, CA; Owner: CABALLERO TELEVISION TEXAS, L.L.C.)
- KEZT-CA (Channel 23; SACRAMENTO, CA; Owner: TELEFUTURA SACRAMENTO LLC)
- KMMW-LP (Channel 47; STOCKTON, CA; Owner: CABALLERO TELEVISION TEXAS, L.L.C.)
- National Bridge Inventory (NBI) Statistics
- 3Number of bridges
- 13ft / 4.4mTotal length
- 11,496Total average daily traffic
- 497Total average daily truck traffic
- 5,243Total future (year 2042) average daily traffic
FCC Registered Antenna Towers:
2- Thomas McGovern, At Intersection Of Uprr Tracks And E Jahant Rd. (Lat: 38.201806 Lon: -121.287778), Type: 12.0, Structure height: 06077 m, Overall height: 12 m, Registrant: Union Pacific Railroad, Uplicensing@up.Com, , Omaha, Phone: (402) 544-1777
- Thomas McGovern, At Intersection Of Uprr Tracks And E Jahant Rd. (Lat: 38.201806 Lon: -121.287778), Type: 12.0, Structure height: 06077 m, Overall height: 12 m, Registrant: Union Pacific Railroad, Uplicensing@up.Com, , Omaha, Phone: (402) 544-1777
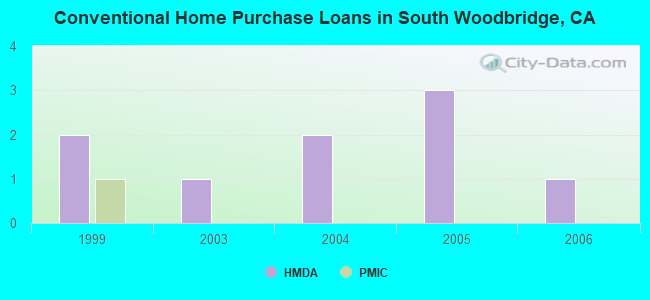
| Home Mortgage Disclosure Act Aggregated Statistics For Year 2009 (Based on 1 partial tract) | ||
| C) Refinancings | ||
|---|---|---|
| Number | Average Value | |
| LOANS ORIGINATED | 1 | $402,790 |
| APPLICATIONS APPROVED, NOT ACCEPTED | 0 | $0 |
| APPLICATIONS DENIED | 0 | $0 |
| APPLICATIONS WITHDRAWN | 0 | $0 |
| FILES CLOSED FOR INCOMPLETENESS | 0 | $0 |
Detailed HMDA statistics for the following Tracts: 0041.03
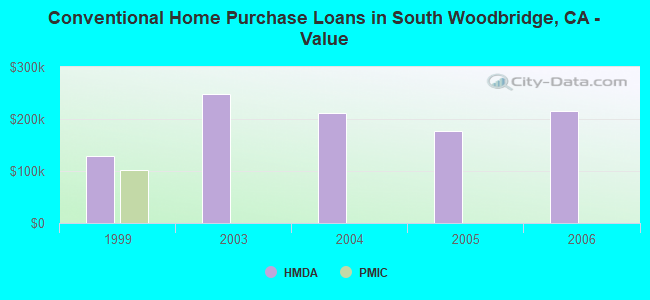
| Private Mortgage Insurance Companies Aggregated Statistics For Year 1999 (Based on 1 partial tract) | ||
| A) Conventional Home Purchase Loans | ||
|---|---|---|
| Number | Average Value | |
| LOANS ORIGINATED | 1 | $101,800 |
| APPLICATIONS APPROVED, NOT ACCEPTED | 0 | $0 |
| APPLICATIONS DENIED | 0 | $0 |
| APPLICATIONS WITHDRAWN | 0 | $0 |
| FILES CLOSED FOR INCOMPLETENESS | 0 | $0 |
Detailed PMIC statistics for the following Tracts: 0041.03
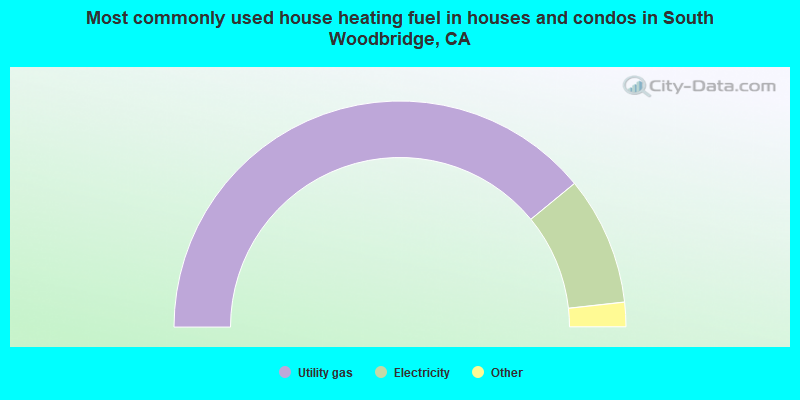
- 78.1%Utility gas
- 18.4%Electricity
- 2.3%No fuel used
- 1.2%Bottled, tank, or LP gas
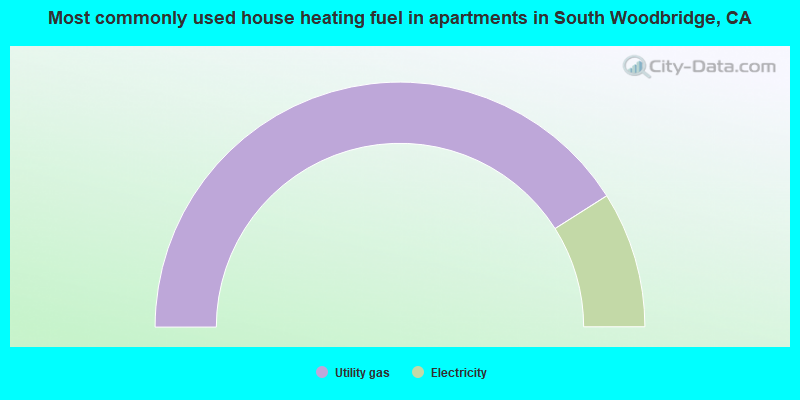
- 82.0%Utility gas
- 18.0%Electricity
South Woodbridge compared to California state average:
- Unemployed percentage below state average.
- Black race population percentage significantly below state average.
- Foreign-born population percentage below state average.
- Renting percentage significantly below state average.
- Length of stay since moving in significantly above state average.
- Number of rooms per house significantly below state average.
- House age significantly below state average.
- Percentage of population with a bachelor's degree or higher below state average.