Southampton, New York Submit your own pictures of this village and show them to the world
OSM Map
General Map
Google Map
MSN Map
OSM Map
General Map
Google Map
MSN Map
OSM Map
General Map
Google Map
MSN Map
OSM Map
General Map
Google Map
MSN Map
Please wait while loading the map...
Population in 2022: 4,615 (83% urban, 17% rural). Population change since 2000: +16.4%Males: 2,111 Females: 2,504
March 2022 cost of living index in Southampton: 168.3 (very high, U.S. average is 100) Percentage of residents living in poverty in 2022: 3.6%for White Non-Hispanic residents , 5.6% for Hispanic or Latino residents )
Profiles of local businesses
Business Search - 14 Million verified businesses
Data:
Median household income ($)
Median household income (% change since 2000)
Household income diversity
Ratio of average income to average house value (%)
Ratio of average income to average rent
Median household income ($) - White
Median household income ($) - Black or African American
Median household income ($) - Asian
Median household income ($) - Hispanic or Latino
Median household income ($) - American Indian and Alaska Native
Median household income ($) - Multirace
Median household income ($) - Other Race
Median household income for houses/condos with a mortgage ($)
Median household income for apartments without a mortgage ($)
Races - White alone (%)
Races - White alone (% change since 2000)
Races - Black alone (%)
Races - Black alone (% change since 2000)
Races - American Indian alone (%)
Races - American Indian alone (% change since 2000)
Races - Asian alone (%)
Races - Asian alone (% change since 2000)
Races - Hispanic (%)
Races - Hispanic (% change since 2000)
Races - Native Hawaiian and Other Pacific Islander alone (%)
Races - Native Hawaiian and Other Pacific Islander alone (% change since 2000)
Races - Two or more races (%)
Races - Two or more races (% change since 2000)
Races - Other race alone (%)
Races - Other race alone (% change since 2000)
Racial diversity
Unemployment (%)
Unemployment (% change since 2000)
Unemployment (%) - White
Unemployment (%) - Black or African American
Unemployment (%) - Asian
Unemployment (%) - Hispanic or Latino
Unemployment (%) - American Indian and Alaska Native
Unemployment (%) - Multirace
Unemployment (%) - Other Race
Population density (people per square mile)
Population - Males (%)
Population - Females (%)
Population - Males (%) - White
Population - Males (%) - Black or African American
Population - Males (%) - Asian
Population - Males (%) - Hispanic or Latino
Population - Males (%) - American Indian and Alaska Native
Population - Males (%) - Multirace
Population - Males (%) - Other Race
Population - Females (%) - White
Population - Females (%) - Black or African American
Population - Females (%) - Asian
Population - Females (%) - Hispanic or Latino
Population - Females (%) - American Indian and Alaska Native
Population - Females (%) - Multirace
Population - Females (%) - Other Race
Coronavirus confirmed cases (Apr 23, 2024)
Deaths caused by coronavirus (Apr 23, 2024)
Coronavirus confirmed cases (per 100k population) (Apr 23, 2024)
Deaths caused by coronavirus (per 100k population) (Apr 23, 2024)
Daily increase in number of cases (Apr 23, 2024)
Weekly increase in number of cases (Apr 23, 2024)
Cases doubled (in days) (Apr 23, 2024)
Hospitalized patients (Apr 18, 2022)
Negative test results (Apr 18, 2022)
Total test results (Apr 18, 2022)
COVID Vaccine doses distributed (per 100k population) (Sep 19, 2023)
COVID Vaccine doses administered (per 100k population) (Sep 19, 2023)
COVID Vaccine doses distributed (Sep 19, 2023)
COVID Vaccine doses administered (Sep 19, 2023)
Likely homosexual households (%)
Likely homosexual households (% change since 2000)
Likely homosexual households - Lesbian couples (%)
Likely homosexual households - Lesbian couples (% change since 2000)
Likely homosexual households - Gay men (%)
Likely homosexual households - Gay men (% change since 2000)
Cost of living index
Median gross rent ($)
Median contract rent ($)
Median monthly housing costs ($)
Median house or condo value ($)
Median house or condo value ($ change since 2000)
Mean house or condo value by units in structure - 1, detached ($)
Mean house or condo value by units in structure - 1, attached ($)
Mean house or condo value by units in structure - 2 ($)
Mean house or condo value by units in structure by units in structure - 3 or 4 ($)
Mean house or condo value by units in structure - 5 or more ($)
Mean house or condo value by units in structure - Boat, RV, van, etc. ($)
Mean house or condo value by units in structure - Mobile home ($)
Median house or condo value ($) - White
Median house or condo value ($) - Black or African American
Median house or condo value ($) - Asian
Median house or condo value ($) - Hispanic or Latino
Median house or condo value ($) - American Indian and Alaska Native
Median house or condo value ($) - Multirace
Median house or condo value ($) - Other Race
Median resident age
Resident age diversity
Median resident age - Males
Median resident age - Females
Median resident age - White
Median resident age - Black or African American
Median resident age - Asian
Median resident age - Hispanic or Latino
Median resident age - American Indian and Alaska Native
Median resident age - Multirace
Median resident age - Other Race
Median resident age - Males - White
Median resident age - Males - Black or African American
Median resident age - Males - Asian
Median resident age - Males - Hispanic or Latino
Median resident age - Males - American Indian and Alaska Native
Median resident age - Males - Multirace
Median resident age - Males - Other Race
Median resident age - Females - White
Median resident age - Females - Black or African American
Median resident age - Females - Asian
Median resident age - Females - Hispanic or Latino
Median resident age - Females - American Indian and Alaska Native
Median resident age - Females - Multirace
Median resident age - Females - Other Race
Commute - mean travel time to work (minutes)
Travel time to work - Less than 5 minutes (%)
Travel time to work - Less than 5 minutes (% change since 2000)
Travel time to work - 5 to 9 minutes (%)
Travel time to work - 5 to 9 minutes (% change since 2000)
Travel time to work - 10 to 19 minutes (%)
Travel time to work - 10 to 19 minutes (% change since 2000)
Travel time to work - 20 to 29 minutes (%)
Travel time to work - 20 to 29 minutes (% change since 2000)
Travel time to work - 30 to 39 minutes (%)
Travel time to work - 30 to 39 minutes (% change since 2000)
Travel time to work - 40 to 59 minutes (%)
Travel time to work - 40 to 59 minutes (% change since 2000)
Travel time to work - 60 to 89 minutes (%)
Travel time to work - 60 to 89 minutes (% change since 2000)
Travel time to work - 90 or more minutes (%)
Travel time to work - 90 or more minutes (% change since 2000)
Marital status - Never married (%)
Marital status - Now married (%)
Marital status - Separated (%)
Marital status - Widowed (%)
Marital status - Divorced (%)
Median family income ($)
Median family income (% change since 2000)
Median non-family income ($)
Median non-family income (% change since 2000)
Median per capita income ($)
Median per capita income (% change since 2000)
Median family income ($) - White
Median family income ($) - Black or African American
Median family income ($) - Asian
Median family income ($) - Hispanic or Latino
Median family income ($) - American Indian and Alaska Native
Median family income ($) - Multirace
Median family income ($) - Other Race
Median year house/condo built
Median year apartment built
Year house built - Built 2005 or later (%)
Year house built - Built 2000 to 2004 (%)
Year house built - Built 1990 to 1999 (%)
Year house built - Built 1980 to 1989 (%)
Year house built - Built 1970 to 1979 (%)
Year house built - Built 1960 to 1969 (%)
Year house built - Built 1950 to 1959 (%)
Year house built - Built 1940 to 1949 (%)
Year house built - Built 1939 or earlier (%)
Average household size
Household density (households per square mile)
Average household size - White
Average household size - Black or African American
Average household size - Asian
Average household size - Hispanic or Latino
Average household size - American Indian and Alaska Native
Average household size - Multirace
Average household size - Other Race
Occupied housing units (%)
Vacant housing units (%)
Owner occupied housing units (%)
Renter occupied housing units (%)
Vacancy status - For rent (%)
Vacancy status - For sale only (%)
Vacancy status - Rented or sold, not occupied (%)
Vacancy status - For seasonal, recreational, or occasional use (%)
Vacancy status - For migrant workers (%)
Vacancy status - Other vacant (%)
Residents with income below the poverty level (%)
Residents with income below 50% of the poverty level (%)
Children below poverty level (%)
Poor families by family type - Married-couple family (%)
Poor families by family type - Male, no wife present (%)
Poor families by family type - Female, no husband present (%)
Poverty status for native-born residents (%)
Poverty status for foreign-born residents (%)
Poverty among high school graduates not in families (%)
Poverty among people who did not graduate high school not in families (%)
Residents with income below the poverty level (%) - White
Residents with income below the poverty level (%) - Black or African American
Residents with income below the poverty level (%) - Asian
Residents with income below the poverty level (%) - Hispanic or Latino
Residents with income below the poverty level (%) - American Indian and Alaska Native
Residents with income below the poverty level (%) - Multirace
Residents with income below the poverty level (%) - Other Race
Air pollution - Air Quality Index (AQI)
Air pollution - CO
Air pollution - NO2
Air pollution - SO2
Air pollution - Ozone
Air pollution - PM10
Air pollution - PM25
Air pollution - Pb
Crime - Murders per 100,000 population
Crime - Rapes per 100,000 population
Crime - Robberies per 100,000 population
Crime - Assaults per 100,000 population
Crime - Burglaries per 100,000 population
Crime - Thefts per 100,000 population
Crime - Auto thefts per 100,000 population
Crime - Arson per 100,000 population
Crime - City-data.com crime index
Crime - Violent crime index
Crime - Property crime index
Crime - Murders per 100,000 population (5 year average)
Crime - Rapes per 100,000 population (5 year average)
Crime - Robberies per 100,000 population (5 year average)
Crime - Assaults per 100,000 population (5 year average)
Crime - Burglaries per 100,000 population (5 year average)
Crime - Thefts per 100,000 population (5 year average)
Crime - Auto thefts per 100,000 population (5 year average)
Crime - Arson per 100,000 population (5 year average)
Crime - City-data.com crime index (5 year average)
Crime - Violent crime index (5 year average)
Crime - Property crime index (5 year average)
1996 Presidential Elections Results (%) - Democratic Party (Clinton)
1996 Presidential Elections Results (%) - Republican Party (Dole)
1996 Presidential Elections Results (%) - Other
2000 Presidential Elections Results (%) - Democratic Party (Gore)
2000 Presidential Elections Results (%) - Republican Party (Bush)
2000 Presidential Elections Results (%) - Other
2004 Presidential Elections Results (%) - Democratic Party (Kerry)
2004 Presidential Elections Results (%) - Republican Party (Bush)
2004 Presidential Elections Results (%) - Other
2008 Presidential Elections Results (%) - Democratic Party (Obama)
2008 Presidential Elections Results (%) - Republican Party (McCain)
2008 Presidential Elections Results (%) - Other
2012 Presidential Elections Results (%) - Democratic Party (Obama)
2012 Presidential Elections Results (%) - Republican Party (Romney)
2012 Presidential Elections Results (%) - Other
2016 Presidential Elections Results (%) - Democratic Party (Clinton)
2016 Presidential Elections Results (%) - Republican Party (Trump)
2016 Presidential Elections Results (%) - Other
2020 Presidential Elections Results (%) - Democratic Party (Biden)
2020 Presidential Elections Results (%) - Republican Party (Trump)
2020 Presidential Elections Results (%) - Other
Ancestries Reported - Arab (%)
Ancestries Reported - Czech (%)
Ancestries Reported - Danish (%)
Ancestries Reported - Dutch (%)
Ancestries Reported - English (%)
Ancestries Reported - French (%)
Ancestries Reported - French Canadian (%)
Ancestries Reported - German (%)
Ancestries Reported - Greek (%)
Ancestries Reported - Hungarian (%)
Ancestries Reported - Irish (%)
Ancestries Reported - Italian (%)
Ancestries Reported - Lithuanian (%)
Ancestries Reported - Norwegian (%)
Ancestries Reported - Polish (%)
Ancestries Reported - Portuguese (%)
Ancestries Reported - Russian (%)
Ancestries Reported - Scotch-Irish (%)
Ancestries Reported - Scottish (%)
Ancestries Reported - Slovak (%)
Ancestries Reported - Subsaharan African (%)
Ancestries Reported - Swedish (%)
Ancestries Reported - Swiss (%)
Ancestries Reported - Ukrainian (%)
Ancestries Reported - United States (%)
Ancestries Reported - Welsh (%)
Ancestries Reported - West Indian (%)
Ancestries Reported - Other (%)
Educational Attainment - No schooling completed (%)
Educational Attainment - Less than high school (%)
Educational Attainment - High school or equivalent (%)
Educational Attainment - Less than 1 year of college (%)
Educational Attainment - 1 or more years of college (%)
Educational Attainment - Associate degree (%)
Educational Attainment - Bachelor's degree (%)
Educational Attainment - Master's degree (%)
Educational Attainment - Professional school degree (%)
Educational Attainment - Doctorate degree (%)
School Enrollment - Nursery, preschool (%)
School Enrollment - Kindergarten (%)
School Enrollment - Grade 1 to 4 (%)
School Enrollment - Grade 5 to 8 (%)
School Enrollment - Grade 9 to 12 (%)
School Enrollment - College undergrad (%)
School Enrollment - Graduate or professional (%)
School Enrollment - Not enrolled in school (%)
School enrollment - Public schools (%)
School enrollment - Private schools (%)
School enrollment - Not enrolled (%)
Median number of rooms in houses and condos
Median number of rooms in apartments
Housing units lacking complete plumbing facilities (%)
Housing units lacking complete kitchen facilities (%)
Density of houses
Urban houses (%)
Rural houses (%)
Households with people 60 years and over (%)
Households with people 65 years and over (%)
Households with people 75 years and over (%)
Households with one or more nonrelatives (%)
Households with no nonrelatives (%)
Population in households (%)
Family households (%)
Nonfamily households (%)
Population in families (%)
Family households with own children (%)
Median number of bedrooms in owner occupied houses
Mean number of bedrooms in owner occupied houses
Median number of bedrooms in renter occupied houses
Mean number of bedrooms in renter occupied houses
Median number of vehichles in owner occupied houses
Mean number of vehichles in owner occupied houses
Median number of vehichles in renter occupied houses
Mean number of vehichles in renter occupied houses
Mortgage status - with mortgage (%)
Mortgage status - with second mortgage (%)
Mortgage status - with home equity loan (%)
Mortgage status - with both second mortgage and home equity loan (%)
Mortgage status - without a mortgage (%)
Average family size
Average family size - White
Average family size - Black or African American
Average family size - Asian
Average family size - Hispanic or Latino
Average family size - American Indian and Alaska Native
Average family size - Multirace
Average family size - Other Race
Geographical mobility - Same house 1 year ago (%)
Geographical mobility - Moved within same county (%)
Geographical mobility - Moved from different county within same state (%)
Geographical mobility - Moved from different state (%)
Geographical mobility - Moved from abroad (%)
Place of birth - Born in state of residence (%)
Place of birth - Born in other state (%)
Place of birth - Native, outside of US (%)
Place of birth - Foreign born (%)
Housing units in structures - 1, detached (%)
Housing units in structures - 1, attached (%)
Housing units in structures - 2 (%)
Housing units in structures - 3 or 4 (%)
Housing units in structures - 5 to 9 (%)
Housing units in structures - 10 to 19 (%)
Housing units in structures - 20 to 49 (%)
Housing units in structures - 50 or more (%)
Housing units in structures - Mobile home (%)
Housing units in structures - Boat, RV, van, etc. (%)
House/condo owner moved in on average (years ago)
Renter moved in on average (years ago)
Year householder moved into unit - Moved in 1999 to March 2000 (%)
Year householder moved into unit - Moved in 1995 to 1998 (%)
Year householder moved into unit - Moved in 1990 to 1994 (%)
Year householder moved into unit - Moved in 1980 to 1989 (%)
Year householder moved into unit - Moved in 1970 to 1979 (%)
Year householder moved into unit - Moved in 1969 or earlier (%)
Means of transportation to work - Drove car alone (%)
Means of transportation to work - Carpooled (%)
Means of transportation to work - Public transportation (%)
Means of transportation to work - Bus or trolley bus (%)
Means of transportation to work - Streetcar or trolley car (%)
Means of transportation to work - Subway or elevated (%)
Means of transportation to work - Railroad (%)
Means of transportation to work - Ferryboat (%)
Means of transportation to work - Taxicab (%)
Means of transportation to work - Motorcycle (%)
Means of transportation to work - Bicycle (%)
Means of transportation to work - Walked (%)
Means of transportation to work - Other means (%)
Working at home (%)
Industry diversity
Most Common Industries - Agriculture, forestry, fishing and hunting, and mining (%)
Most Common Industries - Agriculture, forestry, fishing and hunting (%)
Most Common Industries - Mining, quarrying, and oil and gas extraction (%)
Most Common Industries - Construction (%)
Most Common Industries - Manufacturing (%)
Most Common Industries - Wholesale trade (%)
Most Common Industries - Retail trade (%)
Most Common Industries - Transportation and warehousing, and utilities (%)
Most Common Industries - Transportation and warehousing (%)
Most Common Industries - Utilities (%)
Most Common Industries - Information (%)
Most Common Industries - Finance and insurance, and real estate and rental and leasing (%)
Most Common Industries - Finance and insurance (%)
Most Common Industries - Real estate and rental and leasing (%)
Most Common Industries - Professional, scientific, and management, and administrative and waste management services (%)
Most Common Industries - Professional, scientific, and technical services (%)
Most Common Industries - Management of companies and enterprises (%)
Most Common Industries - Administrative and support and waste management services (%)
Most Common Industries - Educational services, and health care and social assistance (%)
Most Common Industries - Educational services (%)
Most Common Industries - Health care and social assistance (%)
Most Common Industries - Arts, entertainment, and recreation, and accommodation and food services (%)
Most Common Industries - Arts, entertainment, and recreation (%)
Most Common Industries - Accommodation and food services (%)
Most Common Industries - Other services, except public administration (%)
Most Common Industries - Public administration (%)
Occupation diversity
Most Common Occupations - Management, business, science, and arts occupations (%)
Most Common Occupations - Management, business, and financial occupations (%)
Most Common Occupations - Management occupations (%)
Most Common Occupations - Business and financial operations occupations (%)
Most Common Occupations - Computer, engineering, and science occupations (%)
Most Common Occupations - Computer and mathematical occupations (%)
Most Common Occupations - Architecture and engineering occupations (%)
Most Common Occupations - Life, physical, and social science occupations (%)
Most Common Occupations - Education, legal, community service, arts, and media occupations (%)
Most Common Occupations - Community and social service occupations (%)
Most Common Occupations - Legal occupations (%)
Most Common Occupations - Education, training, and library occupations (%)
Most Common Occupations - Arts, design, entertainment, sports, and media occupations (%)
Most Common Occupations - Healthcare practitioners and technical occupations (%)
Most Common Occupations - Health diagnosing and treating practitioners and other technical occupations (%)
Most Common Occupations - Health technologists and technicians (%)
Most Common Occupations - Service occupations (%)
Most Common Occupations - Healthcare support occupations (%)
Most Common Occupations - Protective service occupations (%)
Most Common Occupations - Fire fighting and prevention, and other protective service workers including supervisors (%)
Most Common Occupations - Law enforcement workers including supervisors (%)
Most Common Occupations - Food preparation and serving related occupations (%)
Most Common Occupations - Building and grounds cleaning and maintenance occupations (%)
Most Common Occupations - Personal care and service occupations (%)
Most Common Occupations - Sales and office occupations (%)
Most Common Occupations - Sales and related occupations (%)
Most Common Occupations - Office and administrative support occupations (%)
Most Common Occupations - Natural resources, construction, and maintenance occupations (%)
Most Common Occupations - Farming, fishing, and forestry occupations (%)
Most Common Occupations - Construction and extraction occupations (%)
Most Common Occupations - Installation, maintenance, and repair occupations (%)
Most Common Occupations - Production, transportation, and material moving occupations (%)
Most Common Occupations - Production occupations (%)
Most Common Occupations - Transportation occupations (%)
Most Common Occupations - Material moving occupations (%)
People in Group quarters - Institutionalized population (%)
People in Group quarters - Correctional institutions (%)
People in Group quarters - Federal prisons and detention centers (%)
People in Group quarters - Halfway houses (%)
People in Group quarters - Local jails and other confinement facilities (including police lockups) (%)
People in Group quarters - Military disciplinary barracks (%)
People in Group quarters - State prisons (%)
People in Group quarters - Other types of correctional institutions (%)
People in Group quarters - Nursing homes (%)
People in Group quarters - Hospitals/wards, hospices, and schools for the handicapped (%)
People in Group quarters - Hospitals/wards and hospices for chronically ill (%)
People in Group quarters - Hospices or homes for chronically ill (%)
People in Group quarters - Military hospitals or wards for chronically ill (%)
People in Group quarters - Other hospitals or wards for chronically ill (%)
People in Group quarters - Hospitals or wards for drug/alcohol abuse (%)
People in Group quarters - Mental (Psychiatric) hospitals or wards (%)
People in Group quarters - Schools, hospitals, or wards for the mentally retarded (%)
People in Group quarters - Schools, hospitals, or wards for the physically handicapped (%)
People in Group quarters - Institutions for the deaf (%)
People in Group quarters - Institutions for the blind (%)
People in Group quarters - Orthopedic wards and institutions for the physically handicapped (%)
People in Group quarters - Wards in general hospitals for patients who have no usual home elsewhere (%)
People in Group quarters - Wards in military hospitals for patients who have no usual home elsewhere (%)
People in Group quarters - Juvenile institutions (%)
People in Group quarters - Long-term care (%)
People in Group quarters - Homes for abused, dependent, and neglected children (%)
People in Group quarters - Residential treatment centers for emotionally disturbed children (%)
People in Group quarters - Training schools for juvenile delinquents (%)
People in Group quarters - Short-term care, detention or diagnostic centers for delinquent children (%)
People in Group quarters - Type of juvenile institution unknown (%)
People in Group quarters - Noninstitutionalized population (%)
People in Group quarters - College dormitories (includes college quarters off campus) (%)
People in Group quarters - Military quarters (%)
People in Group quarters - On base (%)
People in Group quarters - Barracks, unaccompanied personnel housing (UPH), (Enlisted/Officer), ;and similar group living quarters for military personnel (%)
People in Group quarters - Transient quarters for temporary residents (%)
People in Group quarters - Military ships (%)
People in Group quarters - Group homes (%)
People in Group quarters - Homes or halfway houses for drug/alcohol abuse (%)
People in Group quarters - Homes for the mentally ill (%)
People in Group quarters - Homes for the mentally retarded (%)
People in Group quarters - Homes for the physically handicapped (%)
People in Group quarters - Other group homes (%)
People in Group quarters - Religious group quarters (%)
People in Group quarters - Dormitories (%)
People in Group quarters - Agriculture workers' dormitories on farms (%)
People in Group quarters - Job Corps and vocational training facilities (%)
People in Group quarters - Other workers' dormitories (%)
People in Group quarters - Crews of maritime vessels (%)
People in Group quarters - Other nonhousehold living situations (%)
People in Group quarters - Other noninstitutional group quarters (%)
Residents speaking English at home (%)
Residents speaking English at home - Born in the United States (%)
Residents speaking English at home - Native, born elsewhere (%)
Residents speaking English at home - Foreign born (%)
Residents speaking Spanish at home (%)
Residents speaking Spanish at home - Born in the United States (%)
Residents speaking Spanish at home - Native, born elsewhere (%)
Residents speaking Spanish at home - Foreign born (%)
Residents speaking other language at home (%)
Residents speaking other language at home - Born in the United States (%)
Residents speaking other language at home - Native, born elsewhere (%)
Residents speaking other language at home - Foreign born (%)
Class of Workers - Employee of private company (%)
Class of Workers - Self-employed in own incorporated business (%)
Class of Workers - Private not-for-profit wage and salary workers (%)
Class of Workers - Local government workers (%)
Class of Workers - State government workers (%)
Class of Workers - Federal government workers (%)
Class of Workers - Self-employed workers in own not incorporated business and Unpaid family workers (%)
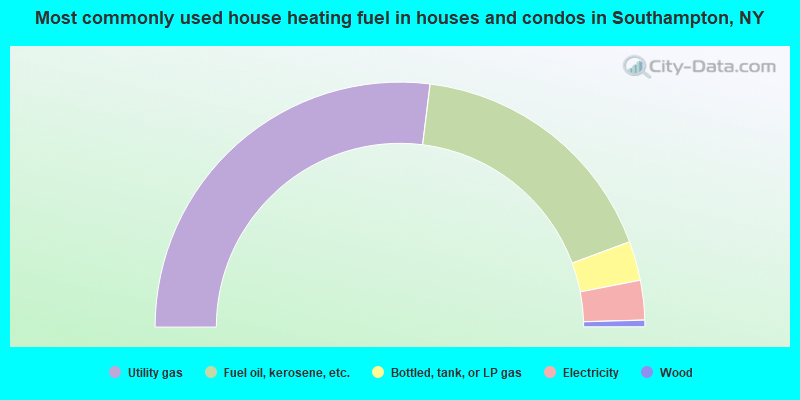
House heating fuel used in houses and condos - Utility gas (%)
House heating fuel used in houses and condos - Bottled, tank, or LP gas (%)
House heating fuel used in houses and condos - Electricity (%)
House heating fuel used in houses and condos - Fuel oil, kerosene, etc. (%)
House heating fuel used in houses and condos - Coal or coke (%)
House heating fuel used in houses and condos - Wood (%)
House heating fuel used in houses and condos - Solar energy (%)
House heating fuel used in houses and condos - Other fuel (%)
House heating fuel used in houses and condos - No fuel used (%)
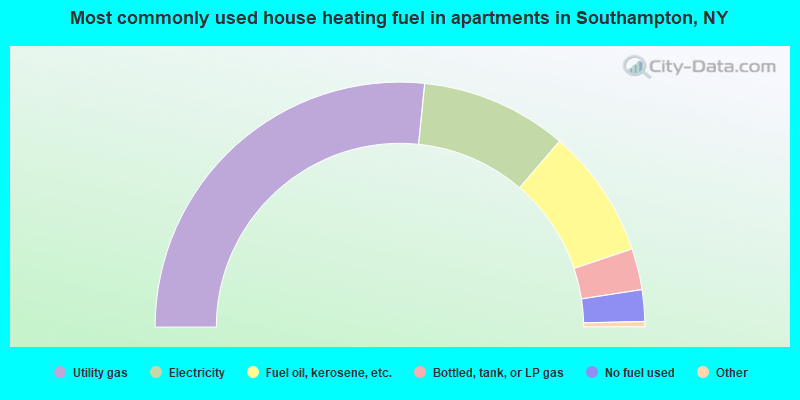
House heating fuel used in apartments - Utility gas (%)
House heating fuel used in apartments - Bottled, tank, or LP gas (%)
House heating fuel used in apartments - Electricity (%)
House heating fuel used in apartments - Fuel oil, kerosene, etc. (%)
House heating fuel used in apartments - Coal or coke (%)
House heating fuel used in apartments - Wood (%)
House heating fuel used in apartments - Solar energy (%)
House heating fuel used in apartments - Other fuel (%)
House heating fuel used in apartments - No fuel used (%)
Armed forces status - In Armed Forces (%)
Armed forces status - Civilian (%)
Armed forces status - Civilian - Veteran (%)
Armed forces status - Civilian - Nonveteran (%)
Fatal accidents locations in years 2005-2021
Fatal accidents locations in 2005
Fatal accidents locations in 2006
Fatal accidents locations in 2007
Fatal accidents locations in 2008
Fatal accidents locations in 2009
Fatal accidents locations in 2010
Fatal accidents locations in 2011
Fatal accidents locations in 2012
Fatal accidents locations in 2013
Fatal accidents locations in 2014
Fatal accidents locations in 2015
Fatal accidents locations in 2016
Fatal accidents locations in 2017
Fatal accidents locations in 2018
Fatal accidents locations in 2019
Fatal accidents locations in 2020
Fatal accidents locations in 2021
Alcohol use - People drinking some alcohol every month (%)
Alcohol use - People not drinking at all (%)
Alcohol use - Average days/month drinking alcohol
Alcohol use - Average drinks/week
Alcohol use - Average days/year people drink much
Audiometry - Average condition of hearing (%)
Audiometry - People that can hear a whisper from across a quiet room (%)
Audiometry - People that can hear normal voice from across a quiet room (%)
Audiometry - Ears ringing, roaring, buzzing (%)
Audiometry - Had a job exposure to loud noise (%)
Audiometry - Had off-work exposure to loud noise (%)
Blood Pressure & Cholesterol - Has high blood pressure (%)
Blood Pressure & Cholesterol - Checking blood pressure at home (%)
Blood Pressure & Cholesterol - Frequently checking blood cholesterol (%)
Blood Pressure & Cholesterol - Has high cholesterol level (%)
Consumer Behavior - Money monthly spent on food at supermarket/grocery store
Consumer Behavior - Money monthly spent on food at other stores
Consumer Behavior - Money monthly spent on eating out
Consumer Behavior - Money monthly spent on carryout/delivered foods
Consumer Behavior - Income spent on food at supermarket/grocery store (%)
Consumer Behavior - Income spent on food at other stores (%)
Consumer Behavior - Income spent on eating out (%)
Consumer Behavior - Income spent on carryout/delivered foods (%)
Current Health Status - General health condition (%)
Current Health Status - Blood donors (%)
Current Health Status - Has blood ever tested for HIV virus (%)
Current Health Status - Left-handed people (%)
Dermatology - People using sunscreen (%)
Diabetes - Diabetics (%)
Diabetes - Had a blood test for high blood sugar (%)
Diabetes - People taking insulin (%)
Diet Behavior & Nutrition - Diet health (%)
Diet Behavior & Nutrition - Milk product consumption (# of products/month)
Diet Behavior & Nutrition - Meals not home prepared (#/week)
Diet Behavior & Nutrition - Meals from fast food or pizza place (#/week)
Diet Behavior & Nutrition - Ready-to-eat foods (#/month)
Diet Behavior & Nutrition - Frozen meals/pizza (#/month)
Drug Use - People that ever used marijuana or hashish (%)
Drug Use - Ever used hard drugs (%)
Drug Use - Ever used any form of cocaine (%)
Drug Use - Ever used heroin (%)
Drug Use - Ever used methamphetamine (%)
Health Insurance - People covered by health insurance (%)
Kidney Conditions-Urology - Avg. # of times urinating at night
Medical Conditions - People with asthma (%)
Medical Conditions - People with anemia (%)
Medical Conditions - People with psoriasis (%)
Medical Conditions - People with overweight (%)
Medical Conditions - Elderly people having difficulties in thinking or remembering (%)
Medical Conditions - People who ever received blood transfusion (%)
Medical Conditions - People having trouble seeing even with glass/contacts (%)
Medical Conditions - People with arthritis (%)
Medical Conditions - People with gout (%)
Medical Conditions - People with congestive heart failure (%)
Medical Conditions - People with coronary heart disease (%)
Medical Conditions - People with angina pectoris (%)
Medical Conditions - People who ever had heart attack (%)
Medical Conditions - People who ever had stroke (%)
Medical Conditions - People with emphysema (%)
Medical Conditions - People with thyroid problem (%)
Medical Conditions - People with chronic bronchitis (%)
Medical Conditions - People with any liver condition (%)
Medical Conditions - People who ever had cancer or malignancy (%)
Mental Health - People who have little interest in doing things (%)
Mental Health - People feeling down, depressed, or hopeless (%)
Mental Health - People who have trouble sleeping or sleeping too much (%)
Mental Health - People feeling tired or having little energy (%)
Mental Health - People with poor appetite or overeating (%)
Mental Health - People feeling bad about themself (%)
Mental Health - People who have trouble concentrating on things (%)
Mental Health - People moving or speaking slowly or too fast (%)
Mental Health - People having thoughts they would be better off dead (%)
Oral Health - Average years since last visit a dentist
Oral Health - People embarrassed because of mouth (%)
Oral Health - People with gum disease (%)
Oral Health - General health of teeth and gums (%)
Oral Health - Average days a week using dental floss/device
Oral Health - Average days a week using mouthwash for dental problem
Oral Health - Average number of teeth
Pesticide Use - Households using pesticides to control insects (%)
Pesticide Use - Households using pesticides to kill weeds (%)
Physical Activity - People doing vigorous-intensity work activities (%)
Physical Activity - People doing moderate-intensity work activities (%)
Physical Activity - People walking or bicycling (%)
Physical Activity - People doing vigorous-intensity recreational activities (%)
Physical Activity - People doing moderate-intensity recreational activities (%)
Physical Activity - Average hours a day doing sedentary activities
Physical Activity - Average hours a day watching TV or videos
Physical Activity - Average hours a day using computer
Physical Functioning - People having limitations keeping them from working (%)
Physical Functioning - People limited in amount of work they can do (%)
Physical Functioning - People that need special equipment to walk (%)
Physical Functioning - People experiencing confusion/memory problems (%)
Physical Functioning - People requiring special healthcare equipment (%)
Prescription Medications - Average number of prescription medicines taking
Preventive Aspirin Use - Adults 40+ taking low-dose aspirin (%)
Reproductive Health - Vaginal deliveries (%)
Reproductive Health - Cesarean deliveries (%)
Reproductive Health - Deliveries resulted in a live birth (%)
Reproductive Health - Pregnancies resulted in a delivery (%)
Reproductive Health - Women breastfeeding newborns (%)
Reproductive Health - Women that had a hysterectomy (%)
Reproductive Health - Women that had both ovaries removed (%)
Reproductive Health - Women that have ever taken birth control pills (%)
Reproductive Health - Women taking birth control pills (%)
Reproductive Health - Women that have ever used Depo-Provera or injectables (%)
Reproductive Health - Women that have ever used female hormones (%)
Sexual Behavior - People 18+ that ever had sex (vaginal, anal, or oral) (%)
Sexual Behavior - Males 18+ that ever had vaginal sex with a woman (%)
Sexual Behavior - Males 18+ that ever performed oral sex on a woman (%)
Sexual Behavior - Males 18+ that ever had anal sex with a woman (%)
Sexual Behavior - Males 18+ that ever had any sex with a man (%)
Sexual Behavior - Females 18+ that ever had vaginal sex with a man (%)
Sexual Behavior - Females 18+ that ever performed oral sex on a man (%)
Sexual Behavior - Females 18+ that ever had anal sex with a man (%)
Sexual Behavior - Females 18+ that ever had any kind of sex with a woman (%)
Sexual Behavior - Average age people first had sex
Sexual Behavior - Average number of female sex partners in lifetime (males 18+)
Sexual Behavior - Average number of female vaginal sex partners in lifetime (males 18+)
Sexual Behavior - Average age people first performed oral sex on a woman (18+)
Sexual Behavior - Average number of woman performed oral sex on in lifetime (18+)
Sexual Behavior - Average number of male sex partners in lifetime (males 18+)
Sexual Behavior - Average number of male anal sex partners in lifetime (males 18+)
Sexual Behavior - Average age people first performed oral sex on a man (18+)
Sexual Behavior - Average number of male oral sex partners in lifetime (18+)
Sexual Behavior - People using protection when performing oral sex (%)
Sexual Behavior - Average number of times people have vaginal or anal sex a year
Sexual Behavior - People having sex without condom (%)
Sexual Behavior - Average number of male sex partners in lifetime (females 18+)
Sexual Behavior - Average number of male vaginal sex partners in lifetime (females 18+)
Sexual Behavior - Average number of female sex partners in lifetime (females 18+)
Sexual Behavior - Circumcised males 18+ (%)
Sleep Disorders - Average hours sleeping at night
Sleep Disorders - People that has trouble sleeping (%)
Smoking-Cigarette Use - People smoking cigarettes (%)
Taste & Smell - People 40+ having problems with smell (%)
Taste & Smell - People 40+ having problems with taste (%)
Taste & Smell - People 40+ that ever had wisdom teeth removed (%)
Taste & Smell - People 40+ that ever had tonsils teeth removed (%)
Taste & Smell - People 40+ that ever had a loss of consciousness because of a head injury (%)
Taste & Smell - People 40+ that ever had a broken nose or other serious injury to face or skull (%)
Taste & Smell - People 40+ that ever had two or more sinus infections (%)
Weight - Average height (inches)
Weight - Average weight (pounds)
Weight - Average BMI
Weight - People that are obese (%)
Weight - People that ever were obese (%)
Weight - People trying to lose weight (%)
According to our research of New York and other state lists, there were 4 registered sex offenders living in Southampton, New York as of April 23, 2024 . The ratio of all residents to sex offenders in Southampton is 800 to 1.The ratio of registered sex offenders to all residents in this city is near the state average.
Officers per 1,000 residents here:
1.93New York average:
3.28
Latest news from Southampton, NY collected exclusively by city-data.com from local newspapers, TV, and radio stations
Southampton, NY City Guides: Ancestries: Irish (10.2%), American (9.5%), Italian (9.4%), English (7.1%), Russian (6.5%), German (4.0%).
Current Local Time:
Land area: 6.33 square miles.
Population density: 729 people per square mile (low).
975 residents are foreign born (8.1% Europe , 7.3% Latin America , 5.6% Asia ).
This village:
21.7%New York:
22.6%
Median real estate property taxes paid for housing units with mortgages in 2022: $7,873 (0.4%)Median real estate property taxes paid for housing units with no mortgage in 2022: $9,356 (0.4%)
Nearest city with pop. 50,000+: West Haven, CT
Nearest city with pop. 200,000+: North Hempstead, NY
Nearest city with pop. 1,000,000+: Queens, NY
Nearest cities:
Latitude: 40.89 N, Longitude: 72.40 W
Daytime population change due to commuting: +6,482 (+144.6%)Workers who live and work in this village: 1,134 (50.0%)
Southampton tourist attractions:
Single-family new house construction building permits:
2022: 218 buildings , average cost: $911,2002021: 239 buildings , average cost: $956,4002020: 115 buildings , average cost: $957,7002019: 155 buildings , average cost: $752,7002018: 224 buildings , average cost: $846,9002017: 206 buildings , average cost: $754,2002016: 202 buildings , average cost: $738,1002015: 245 buildings , average cost: $872,2002014: 274 buildings , average cost: $817,2002013: 217 buildings , average cost: $712,3002012: 166 buildings , average cost: $841,8002011: 165 buildings , average cost: $640,7002010: 163 buildings , average cost: $652,0002009: 109 buildings , average cost: $746,6002008: 175 buildings , average cost: $805,9002007: 274 buildings , average cost: $697,4002006: 297 buildings , average cost: $714,9002005: 434 buildings , average cost: $704,3002004: 345 buildings , average cost: $667,5002003: 341 buildings , average cost: $365,6002002: 489 buildings , average cost: $187,2002001: 430 buildings , average cost: $139,7002000: 576 buildings , average cost: $129,2001999: 572 buildings , average cost: $122,9001998: 583 buildings , average cost: $117,0001997: 425 buildings , average cost: $102,600Unemployment in December 2023:
Population change in the 1990s: +14 (+0.4%).
Most common industries in Southampton, NY (%)
Both Males Females
Construction (10.6%)
Educational services (10.0%)
Health care (9.8%)
Administrative & support & waste management services (9.7%)
Accommodation & food services (6.9%)
Professional, scientific, technical services (6.3%)
Arts, entertainment, recreation (5.1%)
Construction (17.7%)
Administrative & support & waste management services (12.6%)
Accommodation & food services (7.8%)
Educational services (6.7%)
Arts, entertainment, recreation (6.7%)
Professional, scientific, technical services (6.1%)
Health care (4.6%)
Health care (17.6%)
Educational services (14.9%)
Professional, scientific, technical services (6.7%)
Used merchandise, gift, novelty, souvenir, other miscellaneous stores (5.7%)
Accommodation & food services (5.6%)
Administrative & support & waste management services (5.2%)
Real estate & rental & leasing (5.1%)
Most common occupations in Southampton, NY (%)
Both Males Females
Building and grounds cleaning and maintenance occupations (9.7%)
Other sales and related occupations, including supervisors (7.3%)
Other management occupations, except farmers and farm managers (6.4%)
Postsecondary teachers (4.0%)
Retail sales workers, except cashiers (3.7%)
Waiters and waitresses (2.9%)
Top executives (2.8%)
Building and grounds cleaning and maintenance occupations (13.4%)
Other management occupations, except farmers and farm managers (7.5%)
Other sales and related occupations, including supervisors (5.0%)
Carpenters (4.4%)
Postsecondary teachers (3.8%)
Top executives (3.7%)
Entertainers and performers, sports, and related workers (3.6%)
Other sales and related occupations, including supervisors (10.7%)
Retail sales workers, except cashiers (6.8%)
Preschool, kindergarten, elementary, and middle school teachers (5.2%)
Other management occupations, except farmers and farm managers (4.8%)
Waiters and waitresses (4.4%)
Building and grounds cleaning and maintenance occupations (4.3%)
Postsecondary teachers (4.3%)
Air pollution and air quality trends(lower is better)
AQI Ozone
Tornado activity:
Southampton-area historical tornado activity is slightly below New York state average. It is 71% smaller than the overall U.S. average.
On 7/10/1989, a category F4 (max. wind speeds 207-260 mph) tornado 40.7 miles away from the Southampton village center injured 40 people and caused between $50,000,000 and $500,000,000 in damages.
On 8/8/1999, a category F2 (max. wind speeds 113-157 mph) tornado 8.9 miles away from the village center injured one person and caused $1 million in damages.
Earthquake activity:
Southampton-area historical earthquake activity is significantly above New York state average. It is 73% smaller than the overall U.S. average. On 10/7/1983 at 10:18:46, a magnitude 5.3 (5.1 MB, 5.3 LG, 5.1 ML, Class: Moderate, Intensity: VI - VII) earthquake occurred 234.3 miles away from Southampton center On 4/20/2002 at 10:50:47, a magnitude 5.3 (5.3 ML, Depth: 3.0 mi) earthquake occurred 259.5 miles away from the city center On 8/22/1992 at 12:20:32, a magnitude 4.8 (4.8 MB, 3.8 MS, 4.7 LG, Depth: 6.2 mi, Class: Light, Intensity: IV - V) earthquake occurred 165.1 miles away from the city center On 8/23/2011 at 17:51:04, a magnitude 5.8 (5.8 MW, Depth: 3.7 mi) earthquake occurred 360.5 miles away from the city center On 4/20/2002 at 10:50:47, a magnitude 5.2 (5.2 MB, 4.2 MS, 5.2 MW, 5.0 MW) earthquake occurred 258.0 miles away from Southampton center On 1/19/1982 at 00:14:42, a magnitude 4.7 (4.5 MB, 4.7 MD, 4.5 LG) earthquake occurred 185.4 miles away from Southampton center Magnitude types: regional Lg-wave magnitude (LG), body-wave magnitude (MB), duration magnitude (MD), local magnitude (ML), surface-wave magnitude (MS), moment magnitude (MW) Natural disasters: The number of natural disasters in Suffolk County (28) is a lot greater than the US average (15).Major Disasters (Presidential) Declared: 19Emergencies Declared: 7Hurricanes: 9, Floods: 7, Storms: 7, Snowstorms: 4, Winter Storms: 3, Blizzards: 2, Heavy Rain: 1, Power Outage: 1, Tropical Depression: 1, Tropical Storm: 1, Water Shortage: 1, Other: 3 (Note: some incidents may be assigned to more than one category). Hospitals and medical centers in Southampton: SOUTHAMPTON HOSPITAL (Voluntary non-profit - Private, 240 MEETING HOUSE LANE) SOUTHAMPTON CARE CENTER (330 MEETING HOUSE LANE)
Other hospitals and medical centers near Southampton: THE HAMPTONS CENTER FOR REHABILITATION AND NURSING (Nursing Home, about 2 miles away; SOUTH HAMPTON, NY)
INDEPENDENT GROUP HOME LIVING PROGRAM, INC (Hospital, about 2 miles away; SOUTH HAMPTON, NY)
CATHOLIC GUARDIAN SOCIETY OF NEW YORK (Hospital, about 6 miles away; HAMPTON BAYS, NY)
AID TO THE DEVELOPMENTALLY DISABLED, INC (Hospital, about 11 miles away; CUTCHOGUE, NY)
INDEPENDENT GROUP HOME LIVING PROGRAM, INC (Hospital, about 11 miles away; EAST QUOGUE, NY)
INDEPENDENT GROUP HOME LIVING PROGRAM, INC (Hospital, about 12 miles away; FLANDERS, NY)
CATHOLIC GUARDIAN SOCIETY OF NEW YORK (Hospital, about 12 miles away; EAST HAMPTON, NY)
Heliports located in Southampton: Colleges/universities with over 2000 students nearest to Southampton:
Suffolk County Community College (about 35 miles; Selden, NY ; Full-time enrollment: 18,540)
Connecticut College (about 38 miles; New London, CT ; FT enrollment: 2,068)
Stony Brook University (about 39 miles; Stony Brook, NY ; FT enrollment: 22,071)
Gateway Community College (about 41 miles; New Haven, CT ; FT enrollment: 4,672)
Yale University (about 41 miles; New Haven, CT ; FT enrollment: 13,121)
University of New Haven (about 41 miles; West Haven, CT ; FT enrollment: 6,205)
Dowling College (about 42 miles; Oakdale, NY ; FT enrollment: 2,598)
Public high school in Southampton:
Public elementary/middle schools in Southampton:
Private elementary/middle school in Southampton:
See full list of schools located in Southampton Library in Southampton: ROGERS MEMORIAL LIBRARY Operating income: $3,756,162; Location: 91 COOPERS FARM ROAD; 120,835 books ; 4,881 e-books ; 7,155 audio materials ; 11,535 video materials ; 42 local licensed databases ; 14 state licensed databases ; 1 other licensed databases ; 322 print serial subscriptions ; 1 electronic serial subscriptions )
User-submitted facts and corrections:
FM radio station in Southampton, NY: WPKM(88.7 FM; MONTAUK, NY; Owner: WPKN INC.)
southampton campus of liu was bought by stoney brook university this year
Notable locations in Southampton: (A) , Southampton Town Hall (B) , Parrish Art Museum (C) , Southampton Cultural Center (D) , Southampton Village Fire Department (E) . Display/hide their locations on the map
Churches in Southampton include: (A) , Saint John's Episcopal Church (B) , Community Baptist Church (C) , First Baptist Church (D) , Our Lady of Poland Roman Catholic Church (E) , United Methodist Church of Southampton (F) , Sacred Hearts of Jesus and Mary Church (G) , First Presbyterian Church (H) , First Church of Christ Scientist (I) . Display/hide their locations on the map
Cemeteries: (1) , Old Southampton Cemetery (2) . Display/hide their locations on the map
Lakes: (A) , Phillips Pond (B) , Wickapogue Pond (C) , Agawan Lake (D) , Coopers Neck Pond (E) , Halsey Neck Pond (F) . Display/hide their locations on the map
Creek: (A) . Display/hide its location on the map
Parks in Southampton include: (1) , Agawam Park (2) , North Main Street Historic District (3) , Southampton Village Historic District (4) , Wickapogue Road Historic District (5) . Display/hide their locations on the map
Beach: (A) . Display/hide its location on the map
Hotels: (1) , Atlantic Motel (1655 County Road 39) (2) , Bentley (1655 County Road 39) (3) , Capri (281 County Road 39A) (4) , 450 County Road (North Highway) (5) , Atlas Resorts (1655 County Road 39) (6) , Brady Design (22 Main) (7) , Easterner (639 Montauk Hwy) (8) . Display/hide their approximate locations on the map
Birthplace of: Carl Yastrzemski - (born 1939), Baseball Hall of Famer, Mary Cleave - astronaut, Stephen Babinski - College football player (Massachusetts Minutemen).
Suffolk County has a predicted average indoor radon screening level less than 2 pCi/L (pico curies per liter) - Low Potential Drinking water stations with addresses in Southampton and their reported violations in the past:
HAMPTON HAMLET INN (Population served: 28, Groundwater):
Past health violations:
MCL, Monthly (TCR) - In NOV-2012, Contaminant: Coliform. Follow-up actions: St Public Notif requested (NOV-09-2012), St Formal NOV issued (NOV-09-2012), St Compliance achieved (MAR-14-2013)
MCL, Monthly (TCR) - Between JUL-2005 and SEP-2005, Contaminant: Coliform. Follow-up actions: St Public Notif requested (JUL-13-2005), St Formal NOV issued (JUL-13-2005), St Compliance achieved (AUG-27-2005)
Past monitoring violations:
One routine major monitoring violation
Drinking water stations with addresses in Southampton that have no violations reported:
LOBSTER GRILL INN (Population served: 100, Primary Water Source Type: Groundwater)
EASTERNER MOTEL (Address: 635 Montauk Hwy Population served: 25, Primary Water Source Type: Groundwater)
Average household size: This village:
2.3 peopleNew York:
2.6 people
Percentage of family households: This village:
55.9%Whole state:
63.5%
Percentage of households with unmarried partners: This village:
5.4%Whole state:
6.8%
Likely homosexual households (counted as self-reported same-sex unmarried-partner households)
Lesbian couples: 0.3% of all households Gay men: 1.7% of all households
248 people in nursing facilities/skilled-nursing facilities in 2010people in workers' group living quarters and job corps centers in 2010people in nursing homes in 2000people in religious group quarters in 2000
Banks with branches in Southampton (2011 data):
The Bridgehampton National Bank: Windmill Lane Branch, Southampton Village Branch, Southampton Branch. Info updated 2011/06/09: Bank assets: $1,333.4 mil, Deposits: $1,201.2 mil, headquarters in Bridgehampton, NY, positive income , Commercial Lending Specialization, 20 total offices , Holding Company: Bridge Bancorp, Inc.
JPMorgan Chase Bank, National Association: Southampton Drive-In Branch at 66 Nugent Street, branch established on 1997/07/01; Southampton Branch at 60 Main Street, branch established on 1963/03/18. Info updated 2011/11/10: Bank assets: $1,811,678.0 mil, Deposits: $1,190,738.0 mil, headquarters in Columbus, OH, positive income , International Specialization, 5577 total offices , Holding Company: Jpmorgan Chase & Co.
Capital One, National Association: Southampton Branch at 46 Windmill Lane, branch established on 1973/12/22. Info updated 2011/07/01: Bank assets: $133,477.8 mil, Deposits: $97,063.7 mil, headquarters in Mclean, VA, positive income , 984 total offices , Holding Company: Capital One Financial Corporation
Astoria Federal Savings and Loan Association: Southampton Branch at 65 Nugent Street, branch established on 1923/01/01. Info updated 2011/07/21: Bank assets: $16,975.1 mil, Deposits: $11,426.8 mil, headquarters in Long Island City, NY, positive income , Mortgage Lending Specialization, 86 total offices
Hudson City Savings Bank: Southampton Branch at 25 Hill Street, branch established on 2005/08/01. Info updated 2012/01/09: Bank assets: $45,373.6 mil, Deposits: $25,645.6 mil, headquarters in Paramus, NJ, negative income in the last year , Mortgage Lending Specialization, 135 total offices
HSBC Bank USA, National Association: Southampton Branch at 25 Nugent Street, branch established on 1963/06/28. Info updated 2010/11/30: Bank assets: $206,009.7 mil, Deposits: $149,026.8 mil, headquarters in Mc Lean, VA, positive income , 474 total offices , Holding Company: Hsbc Holdings Plc
The Suffolk County National Bank of Riverhead: Southampton Branch at 295 North Sea Road, branch established on 1973/06/02. Info updated 2012/01/10: Bank assets: $1,483.9 mil, Deposits: $1,312.3 mil, headquarters in Riverhead, NY, positive income , Commercial Lending Specialization, 30 total offices , Holding Company: Suffolk Bancorp
Bank of America, National Association: Southampton Branch at 60 Jagger Lane, branch established on 1985/08/26. Info updated 2009/11/18: Bank assets: $1,451,969.3 mil, Deposits: $1,077,176.8 mil, headquarters in Charlotte, NC, positive income , 5782 total offices , Holding Company: Bank Of America Corporation
For population 15 years and over in Southampton:
Never married: 24.3%Now married: 57.1%Separated: 0.5%Widowed: 8.1%Divorced: 9.9% For population 25 years and over in Southampton:
High school or higher: 98.8%Bachelor's degree or higher: 67.7%Graduate or professional degree: 36.2%Unemployed: 3.3%Mean travel time to work (commute): 18.5 minutes
Education Gini index (Inequality in education) Here:
9.3New York average:
13.9
Religion statistics for Southampton, NY (based on Suffolk County data)
Religion Adherents Congregations Catholic 879,457 75 Mainline Protestant 69,205 182 Evangelical Protestant 58,909 264 Other 50,771 124 Orthodox 10,190 10 Black Protestant 8,298 49 None 416,520 -
Source: Clifford Grammich, Kirk Hadaway, Richard Houseal, Dale E.Jones, Alexei Krindatch, Richie Stanley and Richard H.Taylor. 2012. 2010 U.S.Religion Census: Religious Congregations & Membership Study. Association of Statisticians of American Religious Bodies. Jones, Dale E., et al. 2002. Congregations and Membership in the United States 2000. Nashville, TN: Glenmary Research Center. Graphs represent county-level data
Food Environment Statistics: Number of grocery stores : 514This county :
3.40 / 10,000 pop.New York :
4.13 / 10,000 pop.
Number of supercenters and club stores : 9This county :
0.06 / 10,000 pop.State :
0.06 / 10,000 pop.
Number of convenience stores (no gas) : 217Suffolk County :
1.44 / 10,000 pop.New York :
0.92 / 10,000 pop.
Number of convenience stores (with gas) : 256This county :
1.69 / 10,000 pop.State :
1.68 / 10,000 pop.
Number of full-service restaurants : 1,232This county :
8.15 / 10,000 pop.New York :
8.82 / 10,000 pop.
Adult diabetes rate : Suffolk County :
8.1%New York :
8.2%
Adult obesity rate : Suffolk County :
23.4%New York :
23.8%
Low-income preschool obesity rate : Suffolk County :
22.3%New York :
15.6%
Health and Nutrition: Healthy diet rate : Southampton:
52.1%New York:
50.1%
Average overall health of teeth and gums : Average BMI : Southampton:
28.7New York:
28.5
People feeling badly about themselves : Southampton:
19.3%State:
20.3%
People not drinking alcohol at all : This city:
10.8%New York:
11.1%
Average hours sleeping at night : Overweight people : Southampton:
35.5%New York:
33.4%
General health condition : This city:
58.2%New York:
56.5%
Average condition of hearing : More about Health and Nutrition of Southampton, NY Residents
Local government employment and payroll (March 2022)
Function
Full-time employees
Monthly full-time payroll
Average yearly full-time wage
Part-time employees
Monthly part-time payroll
Police Protection - Officers
30 $383,370 $153,348 0 $0 Other and Unallocable
25 $159,931 $76,767 2 $4,333 Streets and Highways
14 $80,492 $68,993 0 $0 Police - Other
13 $121,970 $112,588 2 $2,524 Parks and Recreation
11 $66,606 $72,661 0 $0 Financial Administration
6 $42,021 $84,042 1 $2,354 Other Government Administration
6 $45,446 $90,892 7 $9,787 Judicial and Legal
3 $17,812 $71,248 4 $21,089 Health
2 $14,269 $85,614 6 $10,347 Fire - Other
1 $8,182 $98,184 0 $0
Totals for Government
111 $940,097 $101,632 22 $50,435
Southampton government finances - Expenditure in 2018 (per resident):
Construction - General - Other: $1,186,000 ($256.99)
Local Fire Protection: $344,000 ($74.54)Regular Highways: $153,000 ($33.15)Health - Other: $33,000 ($7.15)Parks and Recreation: $5,000 ($1.08)Current Operations - General - Other: $10,331,000 ($2238.57)
Police Protection: $7,335,000 ($1589.38)Regular Highways: $2,352,000 ($509.64)Central Staff Services: $1,435,000 ($310.94)Parks and Recreation: $1,344,000 ($291.22)General Public Buildings: $1,243,000 ($269.34)Judicial and Legal Services: $607,000 ($131.53)Protective Inspection and Regulation - Other: $596,000 ($129.14)Local Fire Protection: $488,000 ($105.74)Health - Other: $306,000 ($66.31)Financial Administration: $59,000 ($12.78)Correctional Institutions: $19,000 ($4.12)General - Interest on Debt: $606,000 ($131.31)
Other Capital Outlay - Regular Highways: $145,000 ($31.42)
Police Protection: $87,000 ($18.85)Local Fire Protection: $75,000 ($16.25)Health - Other: $51,000 ($11.05)General - Other: $32,000 ($6.93)Parks and Recreation: $31,000 ($6.72)General Public Building: $19,000 ($4.12)Central Staff Services: $13,000 ($2.82)Judicial and Legal Services: $2,000 ($0.43)Total Salaries and Wages: $12,679,000 ($2747.35)
Southampton government finances - Revenue in 2018 (per resident):
Charges - Parks and Recreation: $972,000 ($210.62)
Other: $531,000 ($115.06)Local Intergovernmental - Other: $1,129,000 ($244.64)
General Local Government Support: $289,000 ($62.62)Miscellaneous - Fines and Forfeits: $523,000 ($113.33)
General Revenue - Other: $209,000 ($45.29)Interest Earnings: $97,000 ($21.02)Rents: $51,000 ($11.05)Sale of Property: $35,000 ($7.58)Donations From Private Sources: $16,000 ($3.47)State Intergovernmental - Highways: $448,000 ($97.07)
Other: $267,000 ($57.85)General Local Government Support: $23,000 ($4.98)Tax - Property: $22,684,000 ($4915.28)
Other License: $3,384,000 ($733.26)Public Utilities Sales: $409,000 ($88.62)
Southampton government finances - Debt in 2018 (per resident):
Long Term Debt - Beginning Outstanding - Unspecified Public Purpose: $11,140,000 ($2413.87)
Outstanding Unspecified Public Purpose: $10,045,000 ($2176.60)Retired Unspecified Public Purpose: $1,095,000 ($237.27)
Southampton government finances - Cash and Securities in 2018 (per resident):
Bond Funds - Cash and Securities: $10,686,000 ($2315.49)
Other Funds - Cash and Securities: $9,650,000 ($2091.01)
4.14% of this county's 2021 resident taxpayers lived in other counties in 2020 ($206,656 average adjusted gross income )
Here:
4.14%New York average:
5.29%
0.01% of residents moved from foreign countries ($74 average AGI )Suffolk County:
0.01%New York average:
0.01%
Top counties from which taxpayers relocated into this county between 2020 and 2021:
4.28% of this county's 2020 resident taxpayers moved to other counties in 2021 ($141,172 average adjusted gross income )
Here:
4.28%New York average:
6.93%
0.01% of residents moved to foreign countries ($169 average AGI )Suffolk County:
0.01%New York average:
0.02%
Top counties to which taxpayers relocated from this county between 2020 and 2021:
Businesses in Southampton, NY
Name Count Name Count
7-Eleven 1 MasterBrand Cabinets 6 AT&T 1 McDonald's 1 Audi 1 New Balance 2 BMW 1 Nike 4 Brooks Brothers 1 Pier 1 Imports 1 Burger King 1 RadioShack 1 CVS 1 Rite Aid 1 Chevrolet 1 T-Mobile 1 Chico's 1 True Value 1 Decora Cabinetry 2 U-Haul 1 Dunkin Donuts 1 UPS 4 FedEx 7 Verizon Wireless 1 H&R Block 1 Waldbaums 1 J.Crew 1
Strongest AM radio stations in Southampton:
WFAN (660 AM; 50 kW; NEW YORK, NY; Owner: INFINITY BROADCASTING OPERATIONS, INC.)
WGSM (740 AM; 25 kW; HUNTINGTON, NY; Owner: K RADIO LICENSEE, INC.)
WTIC (1080 AM; 50 kW; HARTFORD, CT; Owner: INFINITY RADIO OPERATIONS INC.)
WCBS (880 AM; 50 kW; NEW YORK, NY; Owner: INFINITY BROADCASTING OPERATIONS, INC.)
WMCA (570 AM; 50 kW; NEW YORK, NY; Owner: SALEM MEDIA OF NEW YORK, LLC)
WNNZ (640 AM; 50 kW; WESTFIELD, MA; Owner: CLEAR CHANNEL BROADCASTING LICENSES, INC.)
WOR (710 AM; 50 kW; NEW YORK, NY; Owner: BUCKLEY BROADCASTING CORPORATION)
WABC (770 AM; 50 kW; NEW YORK, NY; Owner: WABC-AM RADIO, INC.)
WALE (990 AM; 50 kW; GREENVILLE, RI; Owner: NORTH AMERICAN BROADCASTING CO., INC.)
WLIM (1580 AM; 10 kW; PATCHOGUE, NY; Owner: POLNET COMMUNICATIONS, LTD.)
WCRN (830 AM; 50 kW; WORCESTER, MA; Owner: CARTER BROADCASTING CORPORATION)
WEPN (1050 AM; 50 kW; NEW YORK, NY; Owner: NEW YORK AM RADIO, LLC)
WINS (1010 AM; 50 kW; NEW YORK, NY; Owner: INFINITY BROADCASTING OPERATIONS, INC.)
Strongest FM radio stations in Southampton:
W264AJ (100.7 FM; SOUTHAMPTON, NY; Owner: MONROE BOARD OF EDUCATION)
WBAZ (102.5 FM; BRIDGEHAMPTON, NY; Owner: AAA ENTERTAINMENT LICENSING LLC)
W277AB (103.3 FM; NOYACK, NY; Owner: SACRED HEART UNIVERSITY, INC.)
WHFM (95.3 FM; SOUTHAMPTON, NY; Owner: CXR HOLDINGS, INC.)
WRLI-FM (91.3 FM; SOUTHAMPTON, NY; Owner: CONNECTICUT PUBLIC BROADCASTING, INC)
WLNG (92.1 FM; SAG HARBOR, NY; Owner: MAIN STREET BROADCASTING CO., INC.)
WBEA (101.7 FM; SOUTHOLD, NY; Owner: AAA ENTERTAINMENT LICENSING LLC)
W233AI (94.5 FM; SAG HARBOR, NY; Owner: MONROE BOARD OF EDUCATION)
WLIU (88.3 FM; SOUTHAMPTON, NY; Owner: LONG ISLAND UNIVERSITY PUBLIC RADIO NETWORK)
WBON (107.1 FM; HAMPTON BAYS, NY; Owner: NASSAU BROADCASTING HOLDINGS, INC.)
WLVG (96.1 FM; CENTER MORICHES, NY; Owner: WAY BROADCASTING, INC.)
WHBE (96.7 FM; EAST HAMPTON, NY; Owner: AAA ENTERTAINMENT LICENSING LLC)
WALK-FM (97.5 FM; PATCHOGUE, NY; Owner: AMFM RADIO LICENSES, L.L.C.)
WRCN-FM (103.9 FM; RIVERHEAD, NY; Owner: IW LIMITED LIABILITY COMPANY)
WXXP (105.3 FM; CALVERTON-ROANOKE, NY; Owner: JARAD BROADCASTING CO. OF CALVERTON, INC)
WSUF (89.9 FM; NOYACK, NY; Owner: SACRED HEART UNIVERSITY, INC.)
WDRE (98.5 FM; WESTHAMPTON, NY; Owner: JARAD BROADCATING COMPANY OF WESTHAMPTON, INC.)
WMOS (104.7 FM; MONTAUK, NY; Owner: CITADEL BROADCASTING COMPANY)
TV broadcast stations around Southampton:
WVVH-LP (Channel 23; SOUTHAMPTON, ETC., NY; Owner: VIDEO VOICE, INC.)
WHPX (Channel 26; NEW LONDON, CT; Owner: PAXSON HARTFORD LICENSE, INC.)
WLNY (Channel 55; RIVERHEAD, NY; Owner: WLNY-TV, INC.)
WFTY (Channel 67; SMITHTOWN, NY; Owner: UNIVISION NEW YORK LLC)
National Bridge Inventory (NBI) Statistics 2 Number of bridges20,600 Total average daily traffic
Home Mortgage Disclosure Act Aggregated Statistics For Year 2009(Based on 1 full tract) A) FHA, FSA/RHS & VA B) Conventional C) Refinancings D) Home Improvement Loans F) Non-occupant Loans on Number Average Value Number Average Value Number Average Value Number Average Value Number Average Value
LOANS ORIGINATED 1 $633,000 48 $1,351,062 105 $1,037,914 13 $920,000 82 $1,481,646 APPLICATIONS APPROVED, NOT ACCEPTED 0 $0 4 $482,500 11 $2,013,636 1 $417,000 9 $2,506,556 APPLICATIONS DENIED 0 $0 14 $618,000 59 $1,211,847 3 $14,667 37 $983,432 APPLICATIONS WITHDRAWN 0 $0 4 $1,605,000 17 $872,176 2 $4,125,000 9 $2,157,556 FILES CLOSED FOR INCOMPLETENESS 0 $0 1 $637,000 10 $3,229,500 1 $85,000 5 $2,803,600
Aggregated Statistics For Year 2008(Based on 1 full tract) B) Conventional C) Refinancings D) Home Improvement Loans E) Loans on Dwellings For 5+ Families F) Non-occupant Loans on Number Average Value Number Average Value Number Average Value Number Average Value Number Average Value
LOANS ORIGINATED 43 $1,627,884 64 $2,131,953 14 $399,786 1 $1,763,000 57 $2,390,526 APPLICATIONS APPROVED, NOT ACCEPTED 10 $1,153,600 9 $1,448,444 1 $1,825,000 0 $0 6 $1,807,500 APPLICATIONS DENIED 17 $1,829,176 27 $1,284,593 18 $224,389 0 $0 19 $1,555,684 APPLICATIONS WITHDRAWN 12 $2,075,917 19 $512,737 1 $350,000 0 $0 15 $1,517,200 FILES CLOSED FOR INCOMPLETENESS 3 $6,542,000 4 $5,029,250 2 $1,512,500 0 $0 5 $3,648,600
Aggregated Statistics For Year 2007(Based on 1 full tract) B) Conventional C) Refinancings D) Home Improvement Loans F) Non-occupant Loans on Number Average Value Number Average Value Number Average Value Number Average Value
LOANS ORIGINATED 104 $2,007,154 107 $1,234,000 15 $642,800 105 $2,207,667 APPLICATIONS APPROVED, NOT ACCEPTED 20 $1,280,700 28 $1,039,893 3 $133,333 23 $1,329,826 APPLICATIONS DENIED 17 $1,020,471 42 $837,048 15 $538,667 19 $987,421 APPLICATIONS WITHDRAWN 6 $6,953,667 20 $1,526,700 3 $847,333 12 $4,493,417 FILES CLOSED FOR INCOMPLETENESS 2 $779,500 10 $958,100 1 $600,000 4 $1,219,250
Aggregated Statistics For Year 2006(Based on 1 full tract) B) Conventional C) Refinancings D) Home Improvement Loans F) Non-occupant Loans on Number Average Value Number Average Value Number Average Value Number Average Value
LOANS ORIGINATED 89 $1,408,427 144 $1,147,986 23 $618,130 102 $1,533,618 APPLICATIONS APPROVED, NOT ACCEPTED 19 $1,299,316 25 $1,079,560 7 $518,143 18 $1,927,111 APPLICATIONS DENIED 22 $1,443,045 59 $1,048,678 10 $321,700 32 $1,925,188 APPLICATIONS WITHDRAWN 23 $1,981,739 45 $1,279,756 8 $262,125 30 $2,115,533 FILES CLOSED FOR INCOMPLETENESS 2 $851,000 12 $2,160,167 2 $175,000 6 $3,762,833
Aggregated Statistics For Year 2005(Based on 1 full tract) B) Conventional C) Refinancings D) Home Improvement Loans E) Loans on Dwellings For 5+ Families F) Non-occupant Loans on Number Average Value Number Average Value Number Average Value Number Average Value Number Average Value
LOANS ORIGINATED 115 $1,177,678 129 $855,465 16 $498,375 2 $225,000 106 $1,290,736 APPLICATIONS APPROVED, NOT ACCEPTED 24 $1,795,792 19 $534,684 1 $200,000 0 $0 21 $1,709,381 APPLICATIONS DENIED 35 $1,375,143 49 $1,118,612 16 $429,938 0 $0 32 $1,454,312 APPLICATIONS WITHDRAWN 19 $1,521,421 47 $778,426 5 $735,000 0 $0 21 $1,395,429 FILES CLOSED FOR INCOMPLETENESS 4 $385,500 19 $1,108,737 1 $2,000,000 0 $0 5 $2,604,000
Aggregated Statistics For Year 2004(Based on 1 full tract) B) Conventional C) Refinancings D) Home Improvement Loans F) Non-occupant Loans on Number Average Value Number Average Value Number Average Value Number Average Value
LOANS ORIGINATED 132 $962,705 171 $775,053 14 $187,857 121 $1,088,719 APPLICATIONS APPROVED, NOT ACCEPTED 27 $1,192,556 36 $442,389 3 $184,000 24 $1,287,708 APPLICATIONS DENIED 25 $576,600 53 $783,868 6 $167,500 22 $1,091,591 APPLICATIONS WITHDRAWN 11 $493,273 50 $617,420 2 $694,000 21 $787,667 FILES CLOSED FOR INCOMPLETENESS 3 $2,611,667 13 $487,231 1 $201,000 5 $1,816,200
Aggregated Statistics For Year 2003(Based on 1 full tract) B) Conventional C) Refinancings D) Home Improvement Loans F) Non-occupant Loans on Number Average Value Number Average Value Number Average Value Number Average Value
LOANS ORIGINATED 105 $804,171 327 $583,988 10 $58,900 163 $809,350 APPLICATIONS APPROVED, NOT ACCEPTED 16 $1,123,750 40 $424,925 3 $96,667 19 $945,263 APPLICATIONS DENIED 25 $754,400 77 $456,221 6 $49,500 33 $620,364 APPLICATIONS WITHDRAWN 11 $784,455 56 $452,393 1 $15,000 20 $702,100 FILES CLOSED FOR INCOMPLETENESS 3 $610,000 18 $563,889 0 $0 7 $828,857
Aggregated Statistics For Year 2002(Based on 1 full tract) B) Conventional C) Refinancings D) Home Improvement Loans F) Non-occupant Loans on Number Average Value Number Average Value Number Average Value Number Average Value
LOANS ORIGINATED 93 $693,505 283 $613,898 18 $65,000 141 $774,950 APPLICATIONS APPROVED, NOT ACCEPTED 12 $717,750 42 $507,929 1 $350,000 17 $640,824 APPLICATIONS DENIED 19 $544,474 67 $564,791 8 $67,875 18 $995,167 APPLICATIONS WITHDRAWN 12 $677,417 58 $600,224 8 $80,000 13 $830,615 FILES CLOSED FOR INCOMPLETENESS 3 $459,333 19 $238,789 1 $30,000 3 $410,000
Aggregated Statistics For Year 2001(Based on 1 full tract) A) FHA, FSA/RHS & VA B) Conventional C) Refinancings D) Home Improvement Loans F) Non-occupant Loans on Number Average Value Number Average Value Number Average Value Number Average Value Number Average Value
LOANS ORIGINATED 1 $238,000 70 $588,271 123 $519,911 18 $72,500 69 $753,449 APPLICATIONS APPROVED, NOT ACCEPTED 0 $0 7 $1,450,143 31 $893,839 7 $93,714 17 $1,418,882 APPLICATIONS DENIED 0 $0 10 $523,900 51 $339,784 7 $50,857 13 $473,462 APPLICATIONS WITHDRAWN 0 $0 10 $464,900 37 $437,865 6 $82,167 8 $638,500 FILES CLOSED FOR INCOMPLETENESS 0 $0 1 $750,000 4 $455,250 1 $4,000 1 $439,000
Aggregated Statistics For Year 2000(Based on 1 full tract) A) FHA, FSA/RHS & VA B) Conventional C) Refinancings D) Home Improvement Loans E) Loans on Dwellings For 5+ Families F) Non-occupant Loans on Number Average Value Number Average Value Number Average Value Number Average Value Number Average Value Number Average Value
LOANS ORIGINATED 2 $147,000 101 $682,911 83 $866,518 24 $81,292 2 $1,921,000 63 $710,714 APPLICATIONS APPROVED, NOT ACCEPTED 0 $0 27 $831,704 12 $466,750 5 $44,800 0 $0 8 $691,875 APPLICATIONS DENIED 0 $0 36 $972,056 57 $375,947 14 $142,571 0 $0 23 $921,391 APPLICATIONS WITHDRAWN 0 $0 10 $775,900 39 $370,462 3 $91,667 0 $0 5 $1,201,200 FILES CLOSED FOR INCOMPLETENESS 0 $0 4 $740,750 6 $471,667 1 $125,000 0 $0 2 $531,500
Aggregated Statistics For Year 1999(Based on 1 partial tract) B) Conventional C) Refinancings D) Home Improvement Loans E) Loans on Dwellings For 5+ Families F) Non-occupant Loans on Number Average Value Number Average Value Number Average Value Number Average Value Number Average Value
LOANS ORIGINATED 97 $500,349 117 $345,018 14 $34,421 1 $188,980 81 $559,229 APPLICATIONS APPROVED, NOT ACCEPTED 11 $1,106,994 16 $436,308 5 $28,158 0 $0 9 $1,110,468 APPLICATIONS DENIED 23 $491,307 32 $268,145 9 $98,270 0 $0 12 $391,425 APPLICATIONS WITHDRAWN 9 $347,933 30 $368,952 3 $36,220 0 $0 6 $436,702 FILES CLOSED FOR INCOMPLETENESS 3 $460,480 3 $132,600 4 $101,578 0 $0 2 $280,165
Detailed HMDA statistics for the following Tracts:
1908.00
Private Mortgage Insurance Companies Aggregated Statistics For Year 2008(Based on 1 full tract) B) Refinancings Number Average Value
LOANS ORIGINATED 0 $0 APPLICATIONS APPROVED, NOT ACCEPTED 1 $310,000 APPLICATIONS DENIED 0 $0 APPLICATIONS WITHDRAWN 0 $0 FILES CLOSED FOR INCOMPLETENESS 0 $0
Aggregated Statistics For Year 2007(Based on 1 full tract) A) Conventional Number Average Value
LOANS ORIGINATED 1 $417,000 APPLICATIONS APPROVED, NOT ACCEPTED 1 $698,000 APPLICATIONS DENIED 0 $0 APPLICATIONS WITHDRAWN 0 $0 FILES CLOSED FOR INCOMPLETENESS 0 $0
Aggregated Statistics For Year 2006(Based on 1 full tract) A) Conventional C) Non-occupant Loans on Number Average Value Number Average Value
LOANS ORIGINATED 0 $0 0 $0 APPLICATIONS APPROVED, NOT ACCEPTED 0 $0 0 $0 APPLICATIONS DENIED 0 $0 0 $0 APPLICATIONS WITHDRAWN 1 $3,510,000 1 $3,510,000 FILES CLOSED FOR INCOMPLETENESS 0 $0 0 $0
Aggregated Statistics For Year 2005(Based on 1 full tract) A) Conventional C) Non-occupant Loans on Number Average Value Number Average Value
LOANS ORIGINATED 1 $300,000 1 $300,000 APPLICATIONS APPROVED, NOT ACCEPTED 0 $0 0 $0 APPLICATIONS DENIED 0 $0 0 $0 APPLICATIONS WITHDRAWN 0 $0 0 $0 FILES CLOSED FOR INCOMPLETENESS 0 $0 0 $0
Aggregated Statistics For Year 2004(Based on 1 full tract) A) Conventional B) Refinancings C) Non-occupant Loans on Number Average Value Number Average Value Number Average Value
LOANS ORIGINATED 1 $261,000 1 $482,000 1 $261,000 APPLICATIONS APPROVED, NOT ACCEPTED 2 $316,000 2 $360,000 1 $280,000 APPLICATIONS DENIED 0 $0 0 $0 0 $0 APPLICATIONS WITHDRAWN 0 $0 0 $0 0 $0 FILES CLOSED FOR INCOMPLETENESS 0 $0 0 $0 0 $0
Aggregated Statistics For Year 2003(Based on 1 full tract) A) Conventional B) Refinancings C) Non-occupant Loans on Number Average Value Number Average Value Number Average Value
LOANS ORIGINATED 5 $337,000 1 $279,000 1 $176,000 APPLICATIONS APPROVED, NOT ACCEPTED 3 $244,333 1 $323,000 1 $323,000 APPLICATIONS DENIED 1 $450,000 0 $0 0 $0 APPLICATIONS WITHDRAWN 1 $176,000 0 $0 1 $176,000 FILES CLOSED FOR INCOMPLETENESS 0 $0 0 $0 0 $0
Aggregated Statistics For Year 2002(Based on 1 full tract) A) Conventional B) Refinancings C) Non-occupant Loans on Number Average Value Number Average Value Number Average Value
LOANS ORIGINATED 10 $304,300 2 $245,000 5 $259,400 APPLICATIONS APPROVED, NOT ACCEPTED 2 $301,000 0 $0 1 $374,000 APPLICATIONS DENIED 3 $225,000 0 $0 0 $0 APPLICATIONS WITHDRAWN 0 $0 0 $0 0 $0 FILES CLOSED FOR INCOMPLETENESS 0 $0 0 $0 0 $0
Aggregated Statistics For Year 2001(Based on 1 full tract) A) Conventional C) Non-occupant Loans on Number Average Value Number Average Value
LOANS ORIGINATED 15 $300,200 1 $374,000 APPLICATIONS APPROVED, NOT ACCEPTED 3 $329,000 1 $384,000 APPLICATIONS DENIED 2 $186,000 1 $270,000 APPLICATIONS WITHDRAWN 1 $414,000 0 $0 FILES CLOSED FOR INCOMPLETENESS 0 $0 0 $0
Aggregated Statistics For Year 2000(Based on 1 full tract) A) Conventional B) Refinancings C) Non-occupant Loans on Number Average Value Number Average Value Number Average Value
LOANS ORIGINATED 9 $246,667 1 $157,000 2 $197,500 APPLICATIONS APPROVED, NOT ACCEPTED 0 $0 0 $0 0 $0 APPLICATIONS DENIED 0 $0 0 $0 0 $0 APPLICATIONS WITHDRAWN 0 $0 0 $0 0 $0 FILES CLOSED FOR INCOMPLETENESS 0 $0 0 $0 0 $0
Aggregated Statistics For Year 1999(Based on 1 partial tract) A) Conventional B) Refinancings C) Non-occupant Loans on Number Average Value Number Average Value Number Average Value
LOANS ORIGINATED 12 $241,422 2 $227,720 5 $254,368 APPLICATIONS APPROVED, NOT ACCEPTED 2 $301,425 0 $0 0 $0 APPLICATIONS DENIED 1 $117,170 0 $0 0 $0 APPLICATIONS WITHDRAWN 0 $0 0 $0 0 $0 FILES CLOSED FOR INCOMPLETENESS 0 $0 0 $0 0 $0
Detailed PMIC statistics for the following Tracts:
1908.00
Most common first names in Southampton, NY among deceased individuals Name Count Lived (average)
John 146 75.5 years Mary 122 80.7 years William 112 75.1 years Helen 89 81.1 years Joseph 77 77.6 years George 67 76.3 years James 66 76.4 years Charles 64 77.8 years Margaret 59 80.1 years Robert 56 72.9 years
Most common last names in Southampton, NY among deceased individuals Last name Count Lived (average)
Smith 50 75.3 years Johnson 29 75.6 years White 24 80.7 years Bennett 22 74.0 years Miller 22 74.6 years Wilson 21 72.5 years Phillips 18 75.6 years Seymore 17 65.5 years Halsey 15 78.7 years Edwards 14 80.9 years
Southampton compared to New York state average:
Median household income significantly above state average. Median house value significantly above state average. Unemployed percentage significantly below state average. Black race population percentage below state average. Median age significantly above state average. Number of rooms per house above state average. Institutionalized population percentage significantly above state average. Percentage of population with a bachelor's degree or higher significantly above state average. Southampton on our top lists :
#31 on the list of "Top 101 cities with the most residents born in Other South America (population 500+)"
#42 on the list of "Top 101 cities with the most residents born in Australia (population 500+)"
#69 on the list of "Top 101 cities with the most residents born in Poland (population 500+)"
#71 on the list of "Top 101 cities with the most residents born in Australia and New Zealand Subregion (population 500+)"
#75 on the list of "Top 101 cities with the most residents born in Austria (population 500+)"
#83 on the list of "Top 101 cities with the most residents born in Greece (population 500+)"
#3 on the list of "Top 101 counties with the most Catholic adherents"
#6 on the list of "Top 101 counties with the lowest percentage of residents relocating from other counties between 2010 and 2011"
#7 on the list of "Top 101 counties with the lowest surface withdrawal of fresh water for public supply (pop. 50,000+)"
#9 on the list of "Top 101 counties with the lowest percentage of residents relocating to other counties in 2011"
#19 on the list of "Top 101 counties with the highest ground withdrawal of fresh water for public supply (pop. 50,000+)"
Top Patent Applicants
Craig P. Mowry (5)
Lance Nill (3)
Peter D. Koleoglou (2)
Bilhar S. Mann (2)
Terence J. Cullen (2)
Jeffrey S. Wecker (2)
Craig Mowry (2)
Kenneth J. Silverman (2)
Phillip Chiappe (1)
Dennis Finnerty (1)
Total of 37 patent applications in 2008-2024.

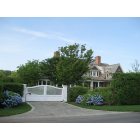

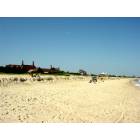
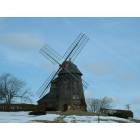
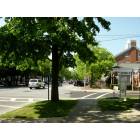

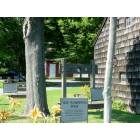
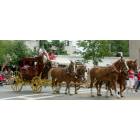
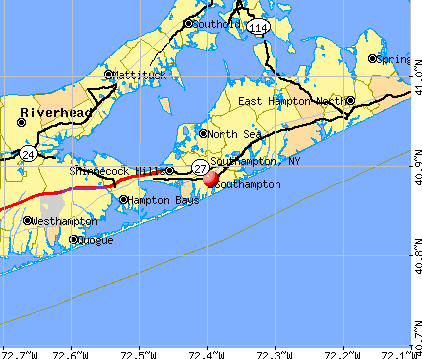


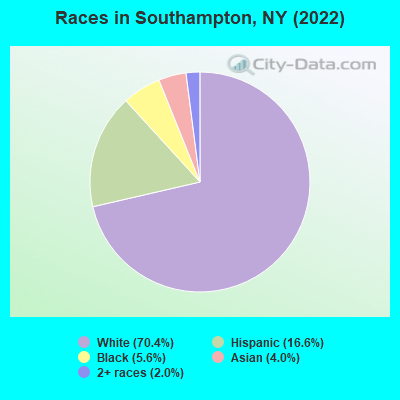
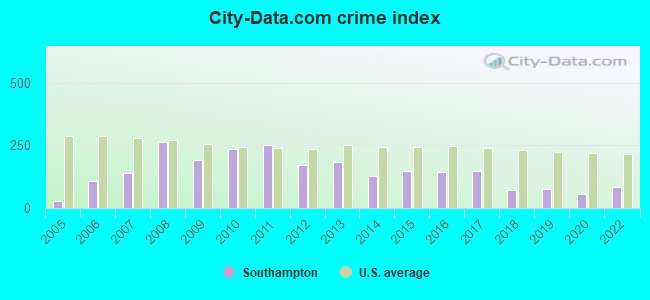
 Recent articles from our blog. Our writers, many of them Ph.D. graduates or candidates, create easy-to-read articles on a wide variety of topics.

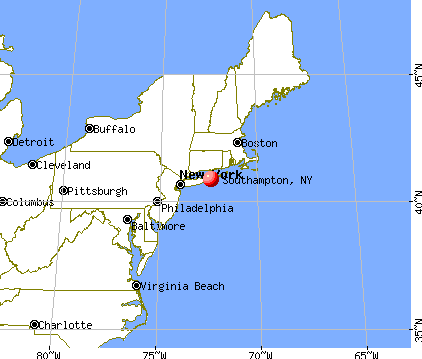
 (40.0 miles
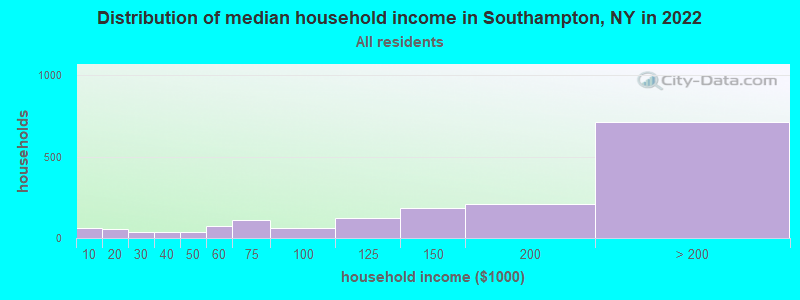
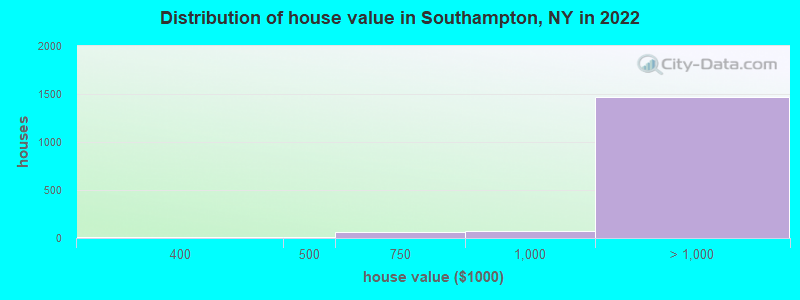

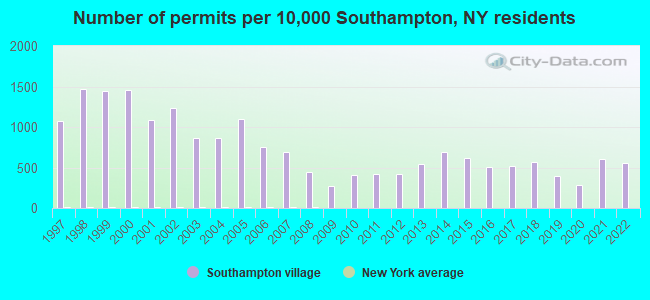
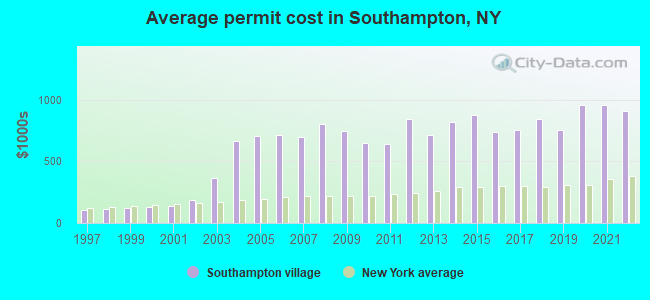
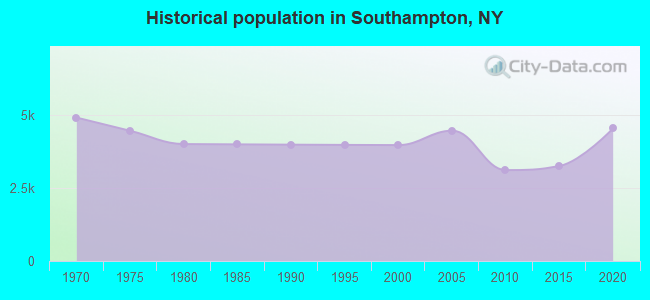
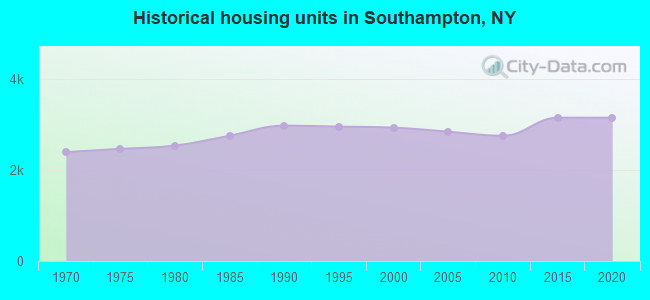
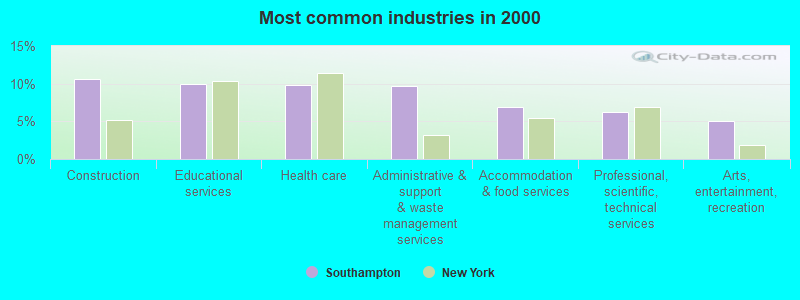
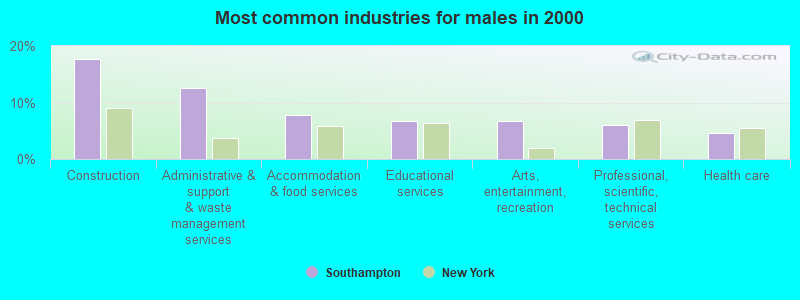
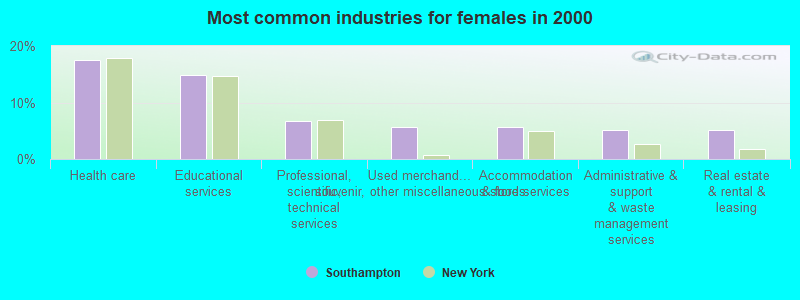
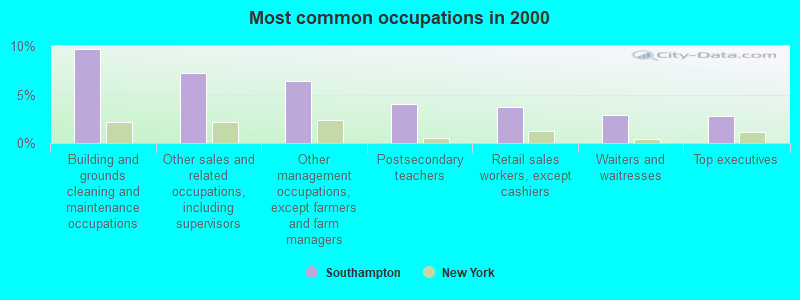
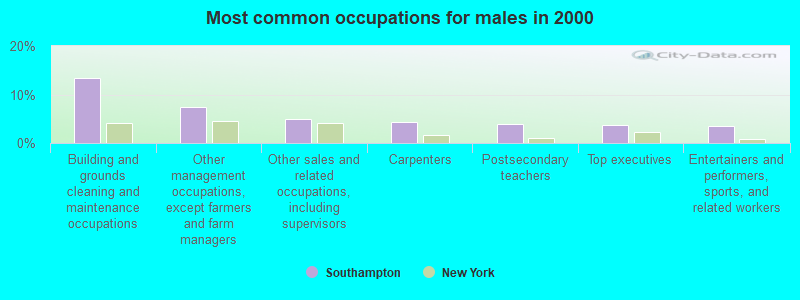
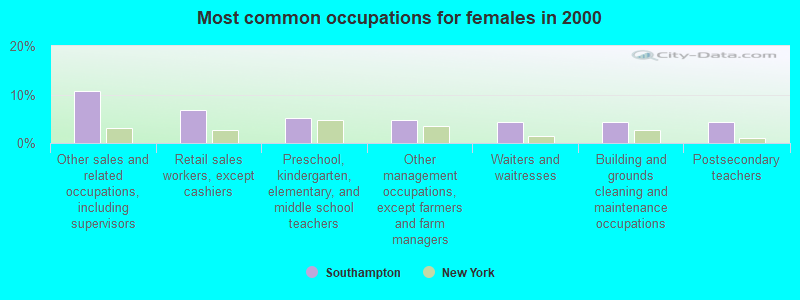


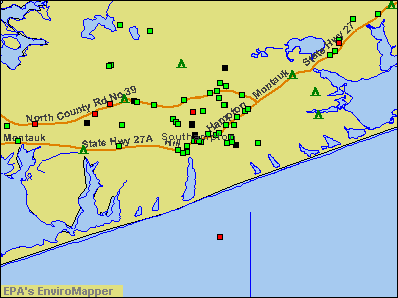

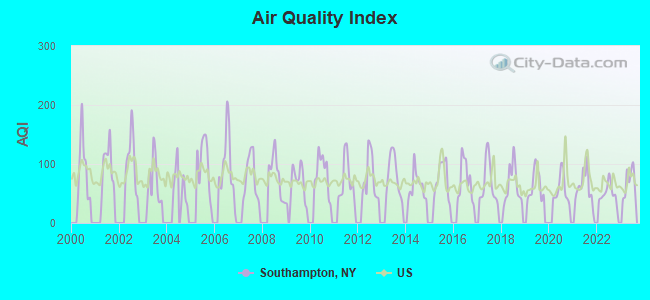
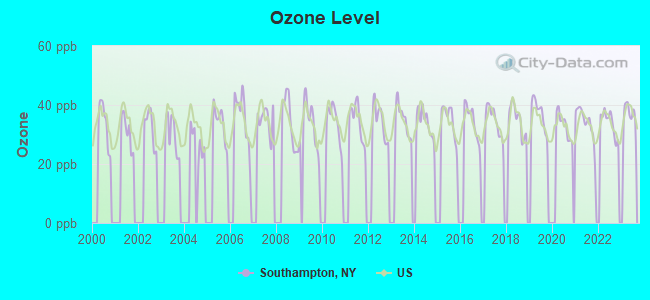

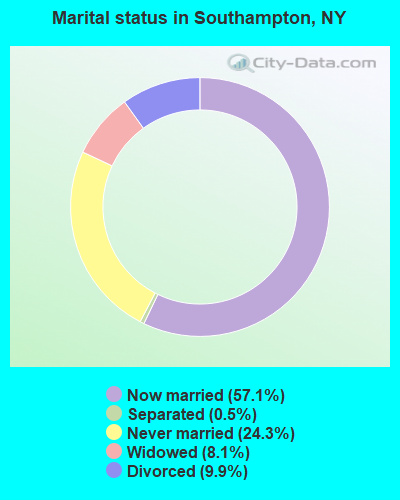
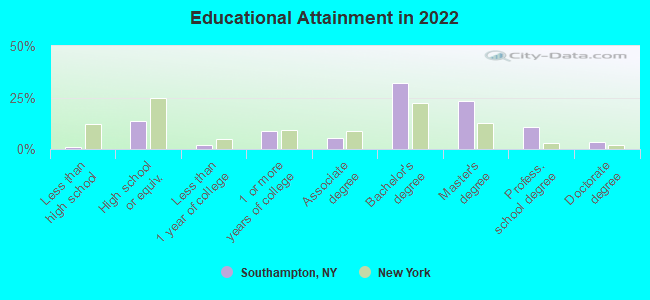
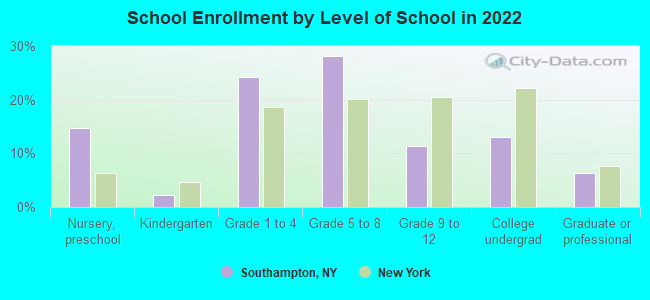
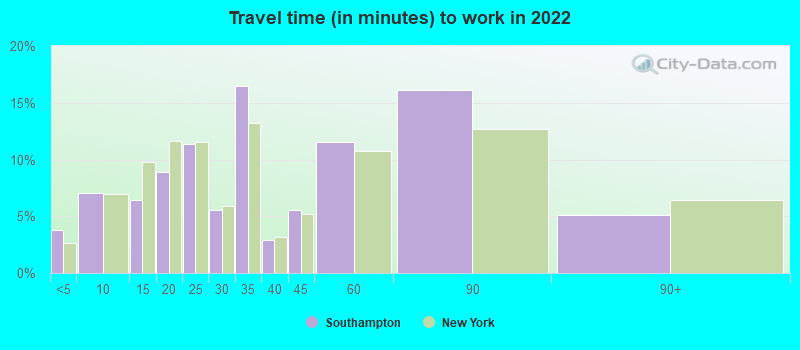
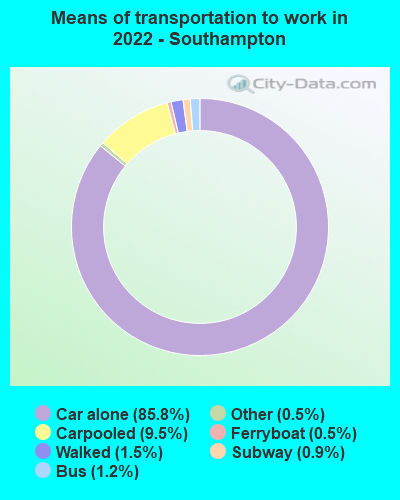


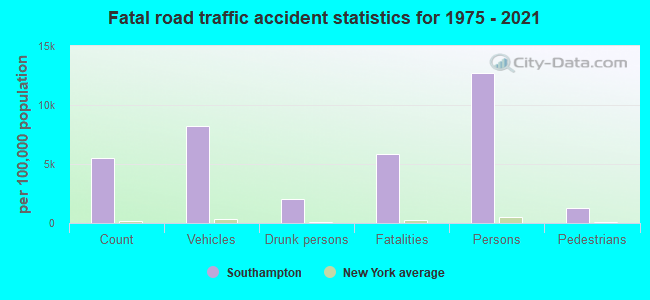
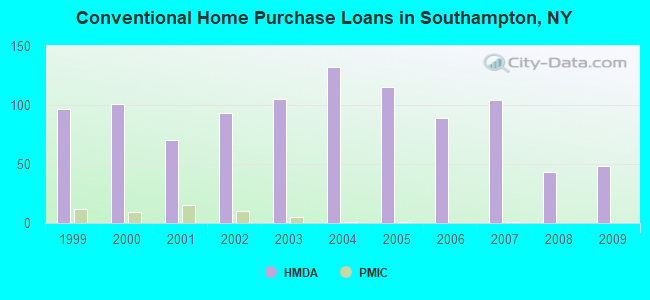
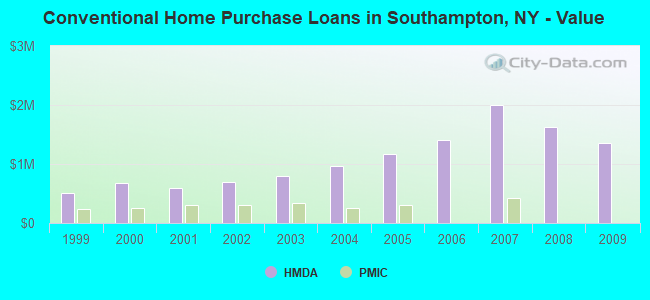
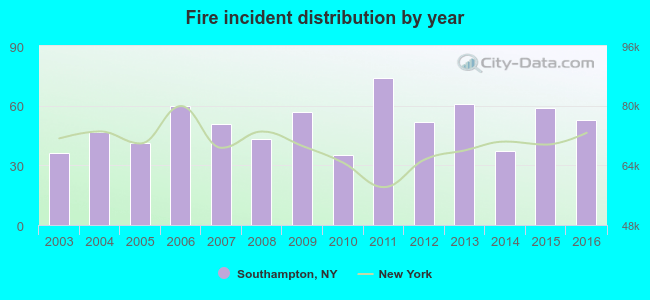 According to the data from the years 2003 - 2016 the average number of fires per year is 50. The highest number of reported fires - 74 took place in 2011, and the least - 35 in 2010. The data has an increasing trend.
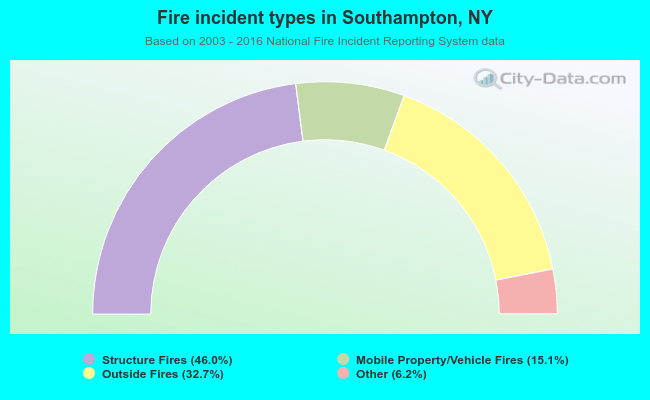 When looking into fire subcategories, the most incidents belonged to: Structure Fires (46.0%), and Outside Fires (32.7%).