St. Francis, Minnesota

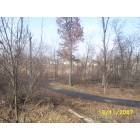
St. Francis: Rum River, Saint Francis MN
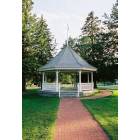
St. Francis: Woodbury Park, Saint Francis MN
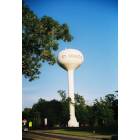
St. Francis: Water Tower, Saint Francis MN
St. Francis: Park view from City Centre Villas behind County Market
- add
your
Submit your own pictures of this city and show them to the world
- OSM Map
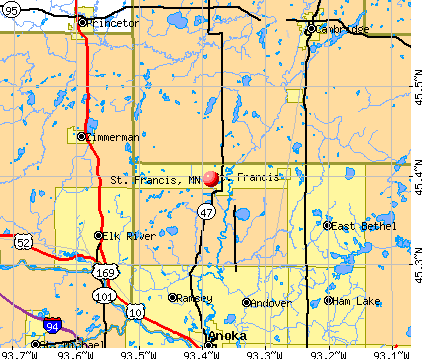
- General Map
- Google Map
- MSN Map
Population change since 2000: +70.8%
| Males: 4,334 | |
| Females: 4,053 |
| Median resident age: | 34.5 years |
| Minnesota median age: | 39.0 years |
Zip codes: 55070.
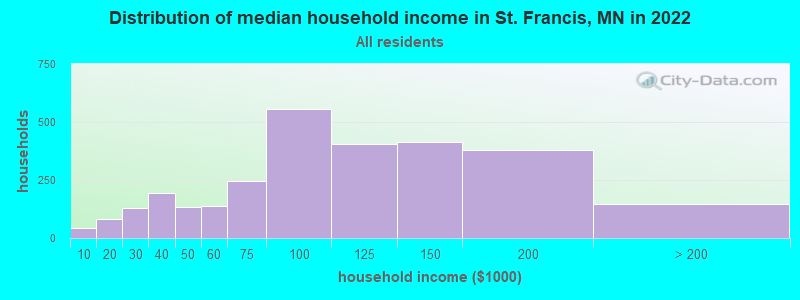
| St. Francis: | $94,642 |
| MN: | $82,338 |
Estimated per capita income in 2022: $35,487 (it was $19,957 in 2000)
St. Francis city income, earnings, and wages data
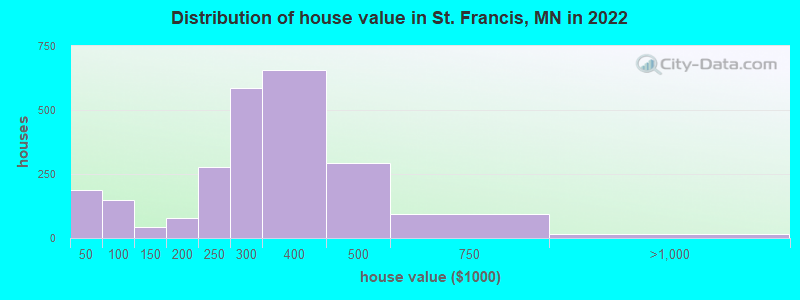
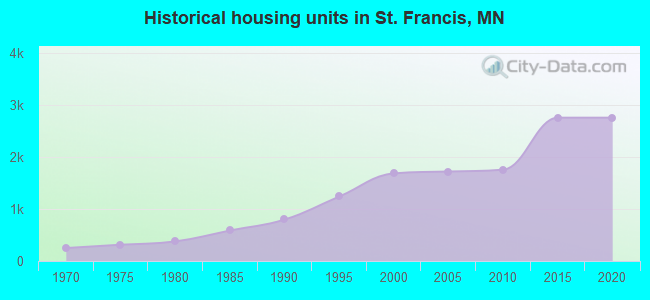
Estimated median house or condo value in 2022: $306,395 (it was $122,000 in 2000)
| St. Francis: | $306,395 |
| MN: | $314,600 |
Mean prices in 2022: all housing units: $290,676; detached houses: $327,823; townhouses or other attached units: $228,937; mobile homes: $78,385
Median gross rent in 2022: $1,069.
(5.8% for White Non-Hispanic residents, 10.7% for Black residents, 1.5% for Hispanic or Latino residents, 12.1% for other race residents, 13.0% for two or more races residents)
Detailed information about poverty and poor residents in St. Francis, MN
Compare current foreclosures near St. Francis, MN:
| Photo | Address | Area | Beds / Baths | Price | Details |
|---|---|---|---|---|---|

|
#1
284th Ave NW
Zimmerman, MN 55398
|
800 sq. feet
|
1 baths 2 beds |
$179,900
|
show details |

|
#2
Lakeview Point Dr NE
Wyoming, MN 55092
|
2,269 sq. feet
|
2 baths 4 beds |
$379,900
|
show details |

|
#3
Buchanan Ln S
Cambridge, MN 55008
|
- sq. feet
|
2 baths 5 beds |
show details | |

|
#4
Joes Lake Rd SE
Cambridge, MN 55008
|
972 sq. feet
|
1 baths 2 beds |
show details | |

|
#5
190th Ln NW
Elk River, MN 55330
|
1,160 sq. feet
|
1 baths 3 beds |
show details | |

|
#6
77th St NE
Albertville, MN 55301
|
960 sq. feet
|
2 baths 4 beds |
show details | |

|
#7
Grant St NW
Elk River, MN 55330
|
864 sq. feet
|
1 baths 2 beds |
show details | |

|
#8
Crosstown Blvd NW
Andover, MN 55304
|
1,348 sq. feet
|
1 baths 3 beds |
show details | |

|
#9
Palomino Ave NE
Elk River, MN 55330
|
1,330 sq. feet
|
3 baths 3 beds |
show details | |

|
#10
Iodine St NW
Anoka, MN 55303
|
1,160 sq. feet
|
1 baths 4 beds |
show details |
| Photo | Address | Area | Beds / Baths | Price | Details |
|---|---|---|---|---|---|

|
#11
Magnolia St NW
Minneapolis, MN 55448
|
960 sq. feet
|
1 baths 3 beds |
show details | |

|
#12
12th St N
Princeton, MN 55371
|
678 sq. feet
|
1 baths 2 beds |
show details | |

|
#13
Butternut St NW
Andover, MN 55304
|
1,276 sq. feet
|
2 baths 4 beds |
show details | |

|
#14
12th St W
Zimmerman, MN 55398
|
1,292 sq. feet
|
2 baths 2 beds |
show details | |

|
#15
Verdin St NW
Saint Francis, MN 55070
|
1,094 sq. feet
|
2 baths 3 beds |
show details | |

|
#16
18th St W
Zimmerman, MN 55398
|
1,316 sq. feet
|
2 baths 3 beds |
show details | |

|
#17
Paradise Trl NW
Isanti, MN 55040
|
1,394 sq. feet
|
2 baths 5 beds |
show details | |

|
#18
Nwwalbo Dr
Cambridge, MN 55008
|
1,100 sq. feet
|
2 baths 3 beds |
show details | |

|
#19
Winsome Way NW
Isanti, MN 55040
|
1,130 sq. feet
|
2 baths 4 beds |
show details | |

|
#20
209th Ct NE
Cedar, MN 55011
|
1,288 sq. feet
|
3 baths 3 beds |
show details |
| Photo | Address | Area | Beds / Baths | Price | Details |
|---|---|---|---|---|---|

|
#21
235th Ave NW
Elk River, MN 55330
|
2,768 sq. feet
|
2 baths 4 beds |
show details | |

|
#22
Florida Ave N
Champlin, MN 55316
|
1,976 sq. feet
|
2 baths 3 beds |
show details | |

|
#23
118th Ave NE
Minneapolis, MN 55434
|
846 sq. feet
|
1 baths 3 beds |
show details | |

|
#24
Cross St
Anoka, MN 55303
|
1,055 sq. feet
|
2 baths 4 beds |
show details | |

|
#25
Woodland Dr
Princeton, MN 55371
|
1,092 sq. feet
|
2 baths 4 beds |
show details | |

|
#26
Flora St NW
Cedar, MN 55011
|
1,300 sq. feet
|
1 baths 3 beds |
show details | |

|
#27
Verdin St NW
Saint Francis, MN 55070
|
1,094 sq. feet
|
2 baths 3 beds |
show details | |

|
#28
117th Ave NE
Minneapolis, MN 55449
|
1,912 sq. feet
|
2 baths 4 beds |
show details | |

|
#29
104th Ave NW
Minneapolis, MN 55433
|
966 sq. feet
|
2 baths 2 beds |
show details | |

|
#30
Fox St NW
Saint Francis, MN 55070
|
996 sq. feet
|
2 baths 3 beds |
show details |
| Photo | Address | Area | Beds / Baths | Price | Details |
|---|---|---|---|---|---|

|
#31
158th Ln NW
Anoka, MN 55303
|
1,225 sq. feet
|
1 baths 3 beds |
show details | |

|
#32
160th Ave NW
Andover, MN 55304
|
1,636 sq. feet
|
3 baths 3 beds |
show details | |

|
#33
7th Ave N
Zimmerman, MN 55398
|
1,423 sq. feet
|
2 baths 3 beds |
show details | |

|
#34
Kahler Ct NE
Albertville, MN 55301
|
2,149 sq. feet
|
4 baths 5 beds |
show details | |

|
#35
183rd Ct NW
Elk River, MN 55330
|
1,704 sq. feet
|
2 baths 3 beds |
show details | |

|
#36
16th St N
Princeton, MN 55371
|
1,232 sq. feet
|
1 baths 2 beds |
show details | |

|
#37
119th Ln NW
Minneapolis, MN 55448
|
794 sq. feet
|
1 baths 2 beds |
show details | |

|
#38
1st Ave E
Cambridge, MN 55008
|
720 sq. feet
|
1 baths 2 beds |
show details | |

|
#39
Marion St SE
Isanti, MN 55040
|
1,328 sq. feet
|
1 baths 3 beds |
show details | |

|
#40
Ivy St S
Cambridge, MN 55008
|
1,392 sq. feet
|
2 baths 4 beds |
show details |
| Photo | Address | Area | Beds / Baths | Price | Details |
|---|---|---|---|---|---|

|
#41
Elm St SW
Isanti, MN 55040
|
998 sq. feet
|
1 baths 2 beds |
show details | |

|
#42
Sprague Ave
Anoka, MN 55303
|
1,632 sq. feet
|
2 baths 3 beds |
show details | |

|
#43
Drake St NW
Minneapolis, MN 55448
|
600 sq. feet
|
1 baths 2 beds |
show details | |

|
#44
Jonquil St NW
Minneapolis, MN 55433
|
988 sq. feet
|
2 baths 3 beds |
show details | |

|
#45
124th Ln NW
Minneapolis, MN 55433
|
904 sq. feet
|
2 baths 3 beds |
show details | |

|
#46
Roosevelt St S
Cambridge, MN 55008
|
1,330 sq. feet
|
1 baths 2 beds |
show details | |

|
#47
284 1/2 Ave NW
Zimmerman, MN 55398
|
1,800 sq. feet
|
2 baths 3 beds |
show details | |

|
#48
Typo Creek Dr NE
Stacy, MN 55079
|
1,166 sq. feet
|
1 baths 2 beds |
show details | |

|
#49
Zachary Cir N
Dayton, MN 55327
|
1,861 sq. feet
|
2 baths 4 beds |
show details | |

|
Check over 1 million property listings on Foreclosure.com!
|
browse all offers | |||


- 7,19586.6%White alone
- 5166.2%Two or more races
- 2853.4%Hispanic
- 1091.3%Black alone
- 430.5%Other race alone
- 200.2%Asian alone
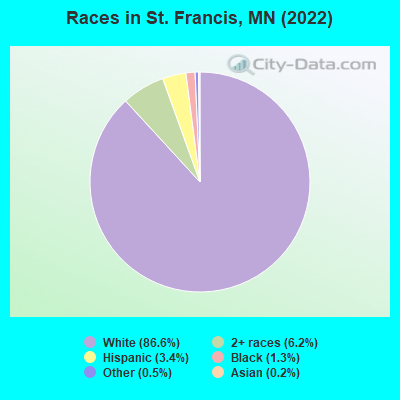
Races in St. Francis detailed stats: ancestries, foreign born residents, place of birth
Type |
2009 |
2010 |
2011 |
2012 |
2013 |
2014 |
2015 |
2016 |
2017 |
2018 |
2019 |
2020 |
2021 |
2022 |
|---|---|---|---|---|---|---|---|---|---|---|---|---|---|---|
| Murders (per 100,000) | 0 (0.0) | 0 (0.0) | 0 (0.0) | 0 (0.0) | 0 (0.0) | 0 (0.0) | 0 (0.0) | 0 (0.0) | 0 (0.0) | 0 (0.0) | 0 (0.0) | 0 (0.0) | 0 (0.0) | 0 (0.0) |
| Rapes (per 100,000) | 7 (92.5) | 6 (83.1) | 9 (123.7) | 6 (82.0) | 1 (15.9) | 7 (95.3) | 5 (67.6) | 0 (0.0) | 2 (26.6) | 5 (64.7) | 3 (38.0) | 1 (12.5) | 1 (12.3) | 6 (70.6) |
| Robberies (per 100,000) | 0 (0.0) | 0 (0.0) | 0 (0.0) | 1 (13.7) | 1 (15.9) | 4 (54.4) | 0 (0.0) | 0 (0.0) | 2 (26.6) | 1 (12.9) | 0 (0.0) | 2 (25.0) | 0 (0.0) | 0 (0.0) |
| Assaults (per 100,000) | 8 (105.7) | 4 (55.4) | 7 (96.2) | 8 (109.4) | 4 (63.8) | 5 (68.0) | 2 (27.1) | 4 (53.7) | 5 (66.6) | 4 (51.8) | 11 (139.3) | 18 (225.1) | 5 (61.3) | 7 (82.3) |
| Burglaries (per 100,000) | 22 (290.7) | 16 (221.7) | 19 (261.2) | 26 (355.4) | 22 (350.7) | 9 (122.5) | 16 (216.5) | 10 (134.4) | 5 (66.6) | 15 (194.1) | 12 (152.0) | 14 (175.1) | 5 (61.3) | 9 (105.9) |
| Thefts (per 100,000) | 159 (2,101) | 113 (1,566) | 110 (1,512) | 131 (1,791) | 92 (1,466) | 117 (1,592) | 82 (1,109) | 51 (685.3) | 107 (1,425) | 96 (1,242) | 82 (1,039) | 73 (912.8) | 52 (637.7) | 94 (1,106) |
| Auto thefts (per 100,000) | 3 (39.6) | 5 (69.3) | 7 (96.2) | 10 (136.7) | 5 (79.7) | 4 (54.4) | 4 (54.1) | 5 (67.2) | 6 (79.9) | 7 (90.6) | 2 (25.3) | 8 (100.0) | 6 (73.6) | 10 (117.6) |
| Arson (per 100,000) | 3 (39.6) | 1 (13.9) | 4 (55.0) | 0 (0.0) | 0 (0.0) | 1 (13.6) | 1 (13.5) | 2 (26.9) | 1 (13.3) | 0 (0.0) | 0 (0.0) | 4 (50.0) | 0 (0.0) | 0 (0.0) |
| City-Data.com crime index | 202.7 | 161.3 | 204.7 | 199.0 | 119.9 | 182.7 | 123.4 | 52.9 | 110.7 | 136.5 | 112.5 | 119.3 | 57.8 | 134.0 |
The City-Data.com crime index weighs serious crimes and violent crimes more heavily. Higher means more crime, U.S. average is 246.1. It adjusts for the number of visitors and daily workers commuting into cities.
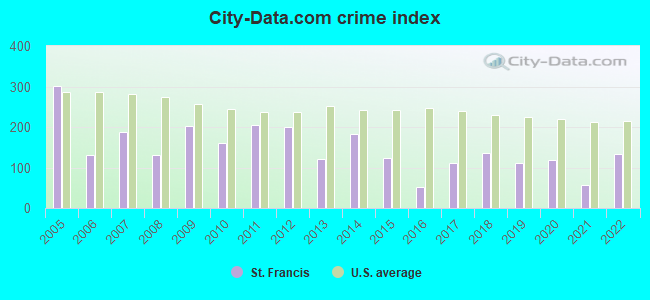
Crime rate in St. Francis detailed stats: murders, rapes, robberies, assaults, burglaries, thefts, arson
Full-time law enforcement employees in 2021, including police officers: 15 (12 officers - 11 male; 1 female).
| Officers per 1,000 residents here: | 1.47 |
| Minnesota average: | 1.76 |
 Recent articles from our blog. Our writers, many of them Ph.D. graduates or candidates, create easy-to-read articles on a wide variety of topics.

 | Where did all the Embers go? (26 replies) |
| St. Francis, MN area--where to live? (2 replies) |
| Will Minneapolis ever see 500,000 again? (390 replies) |
| Twin Cities - 16th largest metro area in the Country, can you feel it? (90 replies) |
| Considering Move to Twin Cities or Prior Lake Need Info (6 replies) |
| Any good hills to take 4 yr sledding on near Bethel, MN? (2 replies) |
Latest news from St. Francis, MN collected exclusively by city-data.com from local newspapers, TV, and radio stations
Ancestries: German (20.5%), American (19.0%), Norwegian (8.7%), Irish (7.1%), European (4.6%), Polish (4.5%).
Current Local Time: CST time zone
Elevation: 918 feet
Land area: 23.3 square miles.
Population density: 360 people per square mile (very low).

229 residents are foreign born (1.2% Latin America, 0.9% Europe, 0.4% Africa).
| This city: | 2.8% |
| Minnesota: | 8.5% |
Median real estate property taxes paid for housing units with mortgages in 2022: $2,553 (0.8%)
Median real estate property taxes paid for housing units with no mortgage in 2022: $2,170 (0.8%)
Nearest city with pop. 50,000+: Coon Rapids, MN  (16.0 miles , pop. 61,607).
Nearest city with pop. 200,000+: Minneapolis, MN (30.4 miles , pop. 382,618).
Nearest city with pop. 1,000,000+: Chicago, IL (376.8 miles , pop. 2,896,016).
Nearest cities:
), ), Latitude: 45.40 N, Longitude: 93.39 W
Area code commonly used in this area: 763
St. Francis, Minnesota accommodation & food services, waste management - Economy and Business Data
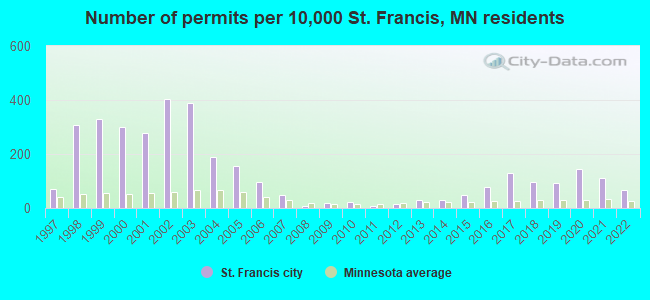
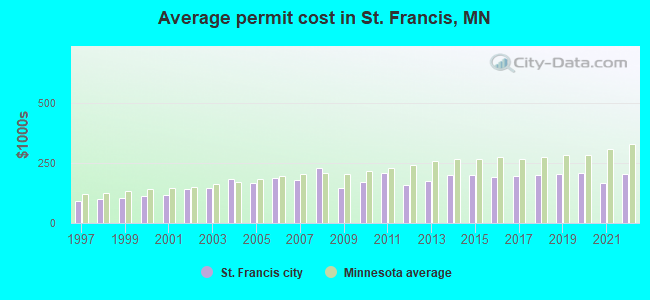
Single-family new house construction building permits:
- 2022: 32 buildings, average cost: $206,000
- 2021: 54 buildings, average cost: $168,700
- 2020: 70 buildings, average cost: $208,000
- 2019: 46 buildings, average cost: $207,200
- 2018: 48 buildings, average cost: $198,600
- 2017: 64 buildings, average cost: $196,400
- 2016: 38 buildings, average cost: $190,900
- 2015: 24 buildings, average cost: $202,300
- 2014: 14 buildings, average cost: $201,600
- 2013: 14 buildings, average cost: $176,100
- 2012: 7 buildings, average cost: $161,400
- 2011: 4 buildings, average cost: $209,300
- 2010: 12 buildings, average cost: $169,800
- 2009: 10 buildings, average cost: $146,500
- 2008: 4 buildings, average cost: $231,000
- 2007: 24 buildings, average cost: $181,000
- 2006: 47 buildings, average cost: $186,500
- 2005: 77 buildings, average cost: $168,300
- 2004: 93 buildings, average cost: $184,900
- 2003: 191 buildings, average cost: $145,600
- 2002: 199 buildings, average cost: $143,000
- 2001: 137 buildings, average cost: $119,300
- 2000: 147 buildings, average cost: $111,300
- 1999: 161 buildings, average cost: $103,100
- 1998: 151 buildings, average cost: $99,200
- 1997: 34 buildings, average cost: $93,500
| Here: | 2.5% |
| Minnesota: | 2.6% |
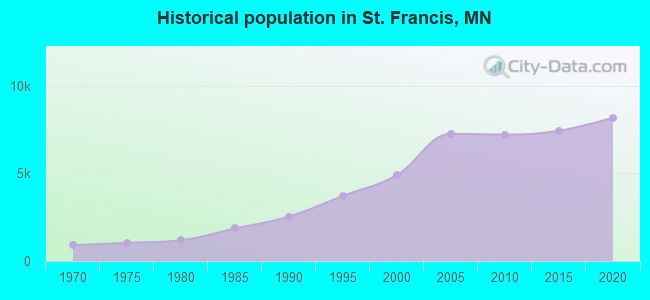
Population change in the 1990s: +2,413 (+96.6%).
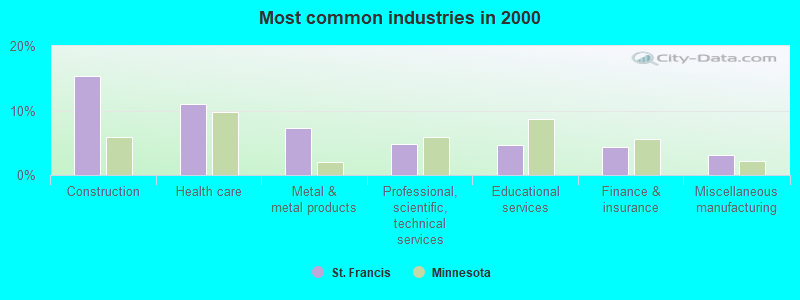
- Construction (15.3%)
- Health care (11.1%)
- Metal & metal products (7.3%)
- Professional, scientific, technical services (4.8%)
- Educational services (4.7%)
- Finance & insurance (4.4%)
- Miscellaneous manufacturing (3.1%)
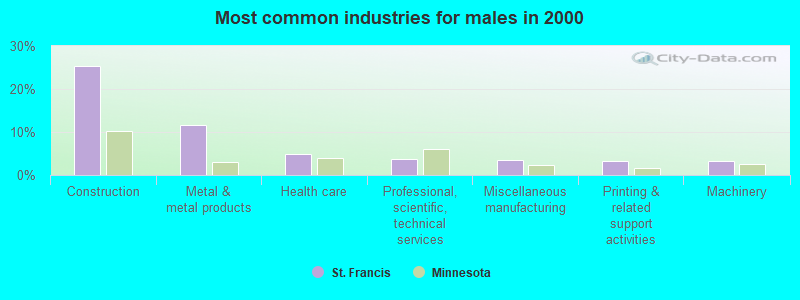
- Construction (25.4%)
- Metal & metal products (11.7%)
- Health care (4.8%)
- Professional, scientific, technical services (3.8%)
- Miscellaneous manufacturing (3.4%)
- Printing & related support activities (3.3%)
- Machinery (3.1%)
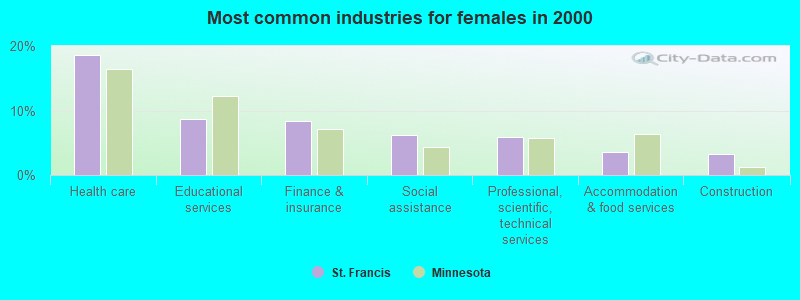
- Health care (18.6%)
- Educational services (8.7%)
- Finance & insurance (8.4%)
- Social assistance (6.2%)
- Professional, scientific, technical services (5.9%)
- Accommodation & food services (3.5%)
- Construction (3.3%)
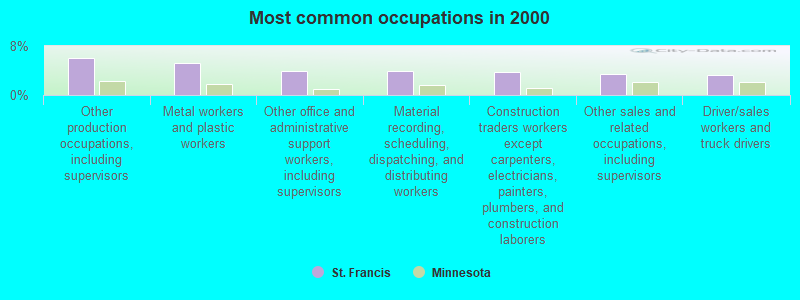
- Other production occupations, including supervisors (6.1%)
- Metal workers and plastic workers (5.2%)
- Other office and administrative support workers, including supervisors (4.0%)
- Material recording, scheduling, dispatching, and distributing workers (3.9%)
- Construction traders workers except carpenters, electricians, painters, plumbers, and construction laborers (3.7%)
- Other sales and related occupations, including supervisors (3.4%)
- Driver/sales workers and truck drivers (3.3%)
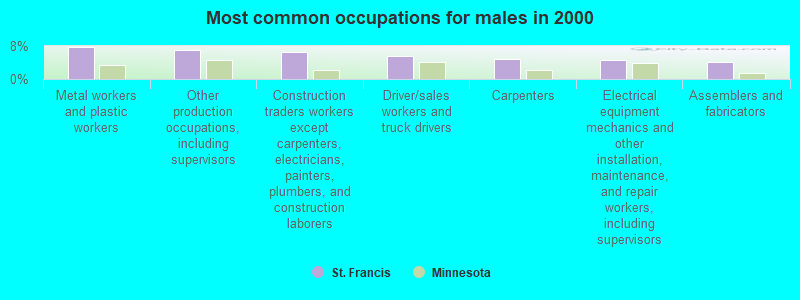
- Metal workers and plastic workers (7.7%)
- Other production occupations, including supervisors (7.1%)
- Construction traders workers except carpenters, electricians, painters, plumbers, and construction laborers (6.6%)
- Driver/sales workers and truck drivers (5.5%)
- Carpenters (4.7%)
- Electrical equipment mechanics and other installation, maintenance, and repair workers, including supervisors (4.6%)
- Assemblers and fabricators (4.2%)
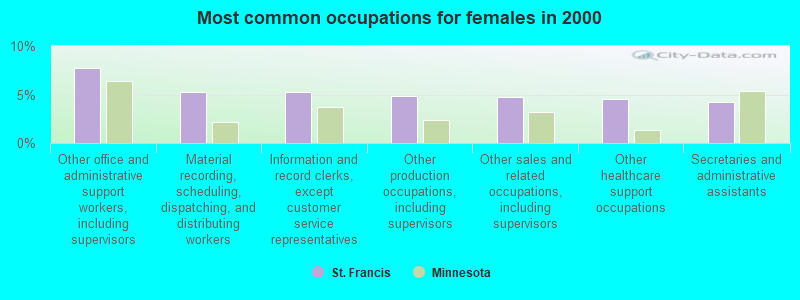
- Other office and administrative support workers, including supervisors (7.8%)
- Material recording, scheduling, dispatching, and distributing workers (5.2%)
- Information and record clerks, except customer service representatives (5.2%)
- Other production occupations, including supervisors (4.8%)
- Other sales and related occupations, including supervisors (4.7%)
- Other healthcare support occupations (4.5%)
- Secretaries and administrative assistants (4.2%)
Average climate in St. Francis, Minnesota
Based on data reported by over 4,000 weather stations


|
|

(lower is better)
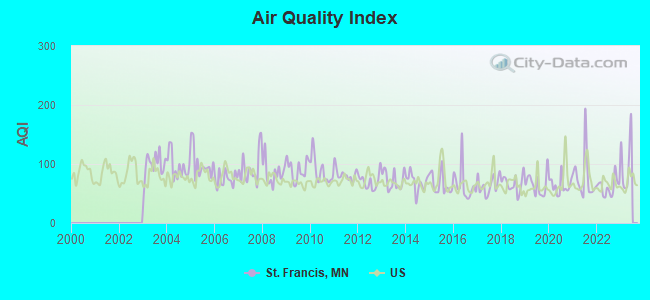
Air Quality Index (AQI) level in 2022 was 61.3. This is about average.
| City: | 61.3 |
| U.S.: | 72.6 |
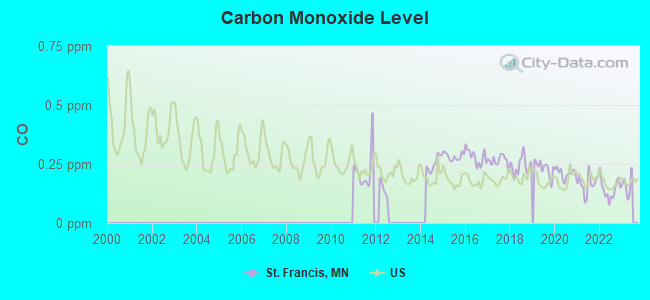
Carbon Monoxide (CO) [ppm] level in 2022 was 0.144. This is significantly better than average. Closest monitor was 19.9 miles away from the city center.
| City: | 0.144 |
| U.S.: | 0.251 |
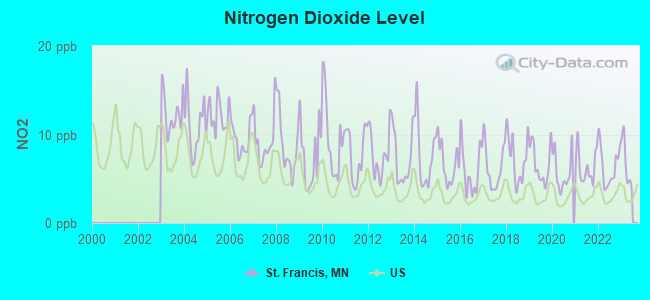
Nitrogen Dioxide (NO2) [ppb] level in 2022 was 6.38. This is worse than average. Closest monitor was 16.8 miles away from the city center.
| City: | 6.38 |
| U.S.: | 5.11 |
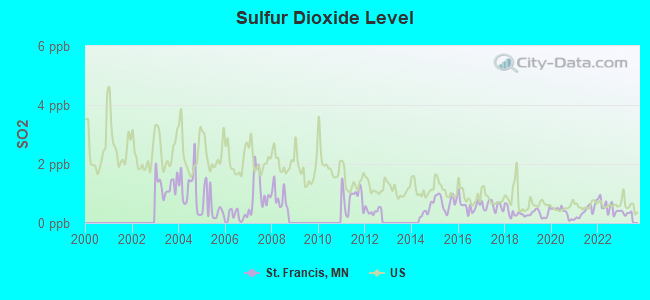
Sulfur Dioxide (SO2) [ppb] level in 2022 was 0.538. This is significantly better than average. Closest monitor was 10.7 miles away from the city center.
| City: | 0.538 |
| U.S.: | 1.515 |
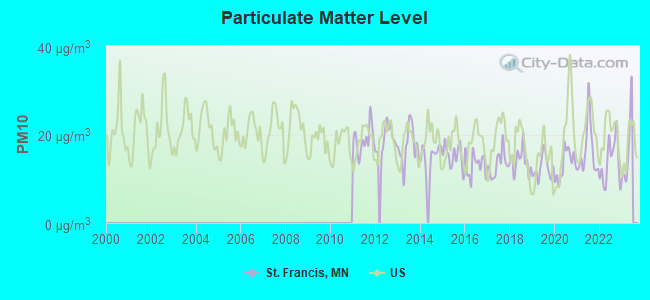
Particulate Matter (PM10) [µg/m3] level in 2022 was 13.8. This is better than average. Closest monitor was 12.2 miles away from the city center.
| City: | 13.8 |
| U.S.: | 19.2 |
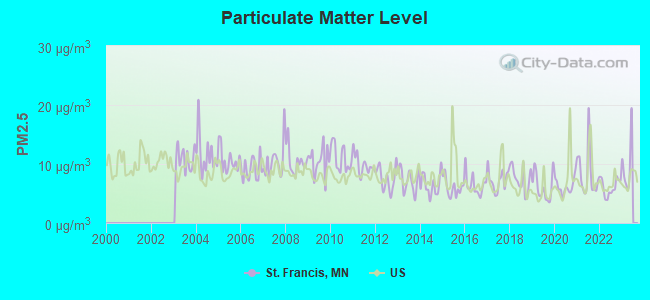
Particulate Matter (PM2.5) [µg/m3] level in 2022 was 6.07. This is better than average. Closest monitor was 18.8 miles away from the city center.
| City: | 6.07 |
| U.S.: | 8.11 |
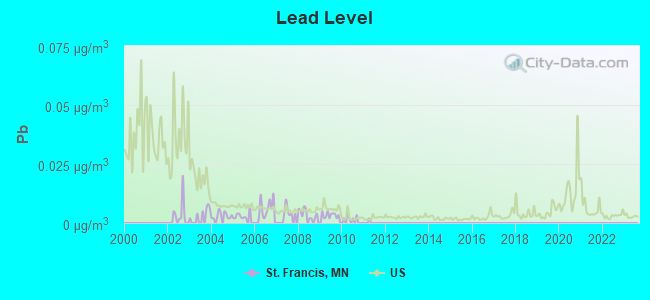
Lead (Pb) [µg/m3] level in 2010 was 0.00148. This is significantly better than average. Closest monitor was 13.7 miles away from the city center.
| City: | 0.00148 |
| U.S.: | 0.00931 |
Tornado activity:
St. Francis-area historical tornado activity is near Minnesota state average. It is 11% greater than the overall U.S. average.
On 6/19/1951, a category F4 (max. wind speeds 207-260 mph) tornado 12.3 miles away from the St. Francis city center killed one person and injured 20 people and caused between $500,000 and $5,000,000 in damages.
On 7/3/1983, a category F4 tornado 12.6 miles away from the city center injured 4 people and caused between $5000 and $50,000 in damages.
Earthquake activity:
St. Francis-area historical earthquake activity is significantly above Minnesota state average. It is 54% smaller than the overall U.S. average.On 7/9/1975 at 14:54:15, a magnitude 4.6 (4.6 MB, Class: Light, Intensity: IV - V) earthquake occurred 130.0 miles away from St. Francis center
On 6/5/1993 at 01:24:53, a magnitude 4.1 (4.1 LG, Depth: 6.2 mi) earthquake occurred 142.1 miles away from the city center
On 3/4/1983 at 06:32:18, a magnitude 4.6 (4.4 MB, 4.6 LG, 4.4 ML) earthquake occurred 306.6 miles away from the city center
On 10/20/1995 at 15:57:18, a magnitude 3.7 (3.7 LG, Depth: 3.1 mi, Class: Light, Intensity: II - III) earthquake occurred 170.5 miles away from the city center
On 2/9/1994 at 08:45:35, a magnitude 3.1 (3.1 LG, Depth: 3.1 mi) earthquake occurred 83.3 miles away from St. Francis center
On 2/7/2020 at 18:30:28, a magnitude 3.3 (3.3 ML) earthquake occurred 147.5 miles away from the city center
Magnitude types: regional Lg-wave magnitude (LG), body-wave magnitude (MB), local magnitude (ML)
Natural disasters:
The number of natural disasters in Anoka County (12) is smaller than the US average (15).Major Disasters (Presidential) Declared: 8
Emergencies Declared: 2
Causes of natural disasters: Floods: 6, Storms: 4, Tornadoes: 3, Drought: 1, Fire: 1, Hurricane: 1, Wind: 1, Other: 1 (Note: some incidents may be assigned to more than one category).
Hospitals and medical centers near St. Francis:
- GUARDIAN ANGELS ELIM HOME CARE (Home Health Center, about 11 miles away; ELK RIVER, MN)
- ELK RIVER NURSING HOME (Nursing Home, about 11 miles away; ELK RIVER, MN)
- GUARDIAN ANGELS CARE CENTER (Nursing Home, about 11 miles away; ELK RIVER, MN)
- MAC GREGOR PLACE (Hospital, about 11 miles away; ELK RIVER, MN)
- DCI CENTRAL (Hospital, about 13 miles away; CAMBRIDGE, MN)
- GOLDEN LIVINGCENTER - TWIN RIVERS (Nursing Home, about 14 miles away; ANOKA, MN)
- TWIN RIVERS CARE CENTER (Nursing Home, about 14 miles away; ANOKA, MN)
Airports located in St. Francis:
- Aero-Plain Airport (MN98) (Runways: 1)
- Becker Personal Airport (MY43) (Runways: 1)
Colleges/universities with over 2000 students nearest to St. Francis:
- Anoka-Ramsey Community College (about 16 miles; Coon Rapids, MN; Full-time enrollment: 5,918)
- North Hennepin Community College (about 20 miles; Brooklyn Park, MN; FT enrollment: 4,943)
- Hennepin Technical College (about 21 miles; Brooklyn Park, MN; FT enrollment: 4,515)
- Bethel University (about 26 miles; Saint Paul, MN; FT enrollment: 4,061)
- University of Northwestern-St Paul (about 28 miles; Saint Paul, MN; FT enrollment: 2,680)
- Walden University (about 30 miles; Minneapolis, MN; FT enrollment: 62,473)
- Capella University (about 30 miles; Minneapolis, MN; FT enrollment: 21,718)
Public high schools in St. Francis:
- ST. FRANCIS ALC (Location: 22970 BUTTERFIELD, Grades: 7-12)
- ST. FRANCIS ALC IS (Location: 22970 BUTTERFIELD DR, Grades: 9-12)
- ST. FRANCIS HIGH (Location: 3325 BRIDGE ST, Grades: 9-12)
- CROSSROADS SCHOOL & VOC. CENTER (Location: 4111 AMBASSADOR BLVD, Grades: KG-12)
Private high school in St. Francis:
- ST FRANCIS CHRISTIAN SCHOOL (Students: 56, Location: 22940 SAINT FRANCIS BLVD NW, Grades: KG-12)
Public elementary/middle schools in St. Francis:
- ST. FRANCIS MIDDLE (Location: 23026 AMBASSADOR BLVD, Grades: 6-8)
- ST. FRANCIS ELEMENTARY (Location: 22919 ST. FRANCIS BLVD, Grades: KG-5)
Private elementary/middle schools in St. Francis:
- TRINITY LUTHERAN SCHOOL (Students: 99, Location: 3812 229TH AVE NW, Grades: PK-8)
- CROWN CHRISTIAN SCHOOL (Students: 46, Location: 7515 269TH AVE NW, Grades: PK-6)
Points of interest:
Notable locations in St. Francis: Saint Francis Fire Department (A), Saint Francis Police Department (B), Saint Francis Library (C), Saint Francis City Hall (D). Display/hide their locations on the map
Churches in St. Francis include: Lighthouse Assembly of God Church (A), First Baptist Church (B), Saint Francis United Methodist Church (C). Display/hide their locations on the map
Cemetery: Oak View Cemetery (1). Display/hide its location on the map
Swamps: Smith Lake (A). Display/hide its location on the map
Parks in St. Francis include: Saint Francis Community Park (1), Rum River North County Park (2), Bethel State Wildlife Management Area (3). Display/hide their locations on the map
Birthplace of: Sean Sherk - Professional mixed martial artist.
| This city: | 2.9 people |
| Minnesota: | 2.5 people |
| This city: | 75.9% |
| Whole state: | 64.6% |
| This city: | 9.6% |
| Whole state: | 6.9% |
Likely homosexual households (counted as self-reported same-sex unmarried-partner households)
- Lesbian couples: 0.3% of all households
- Gay men: 0.1% of all households
For population 15 years and over in St. Francis:
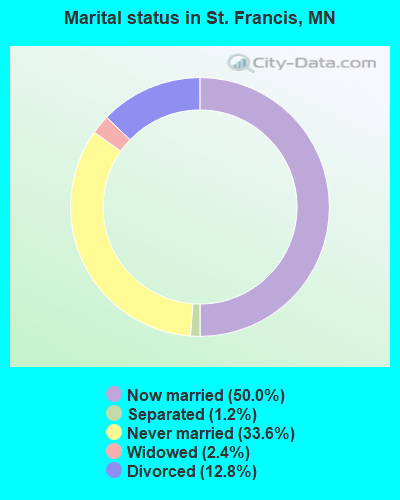
- Never married: 33.6%
- Now married: 50.0%
- Separated: 1.2%
- Widowed: 2.4%
- Divorced: 12.8%
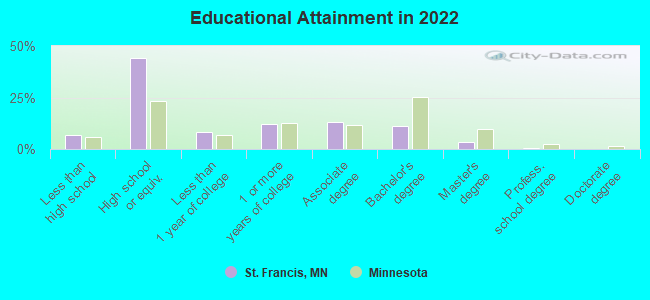
For population 25 years and over in St. Francis:
- High school or higher: 92.1%
- Bachelor's degree or higher: 15.9%
- Graduate or professional degree: 4.3%
- Unemployed: 2.9%
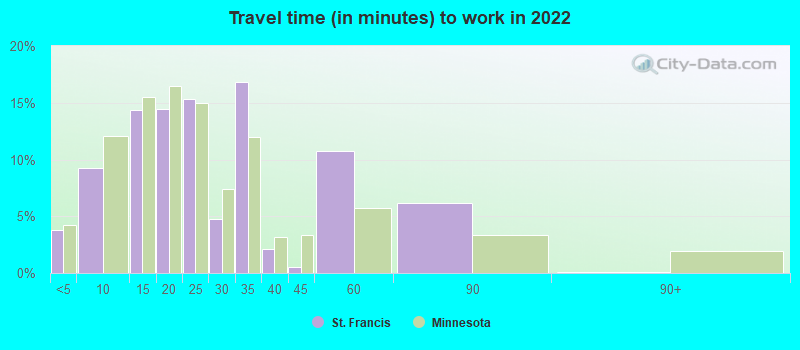
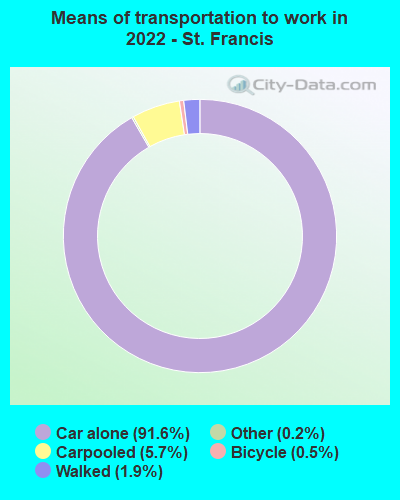
- Mean travel time to work (commute): 27.0 minutes
| Here: | 7.5 |
| Minnesota average: | 10.9 |
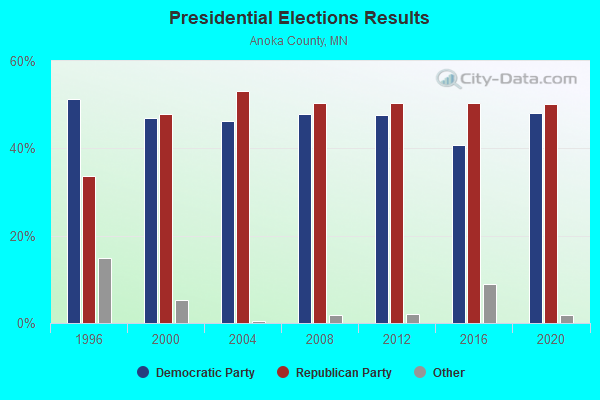
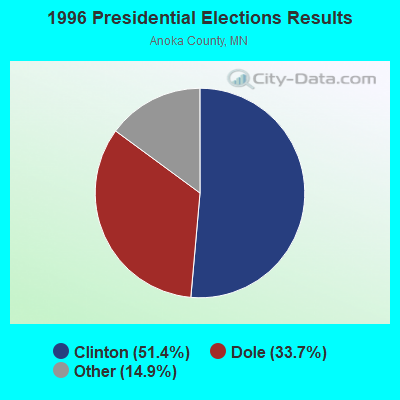
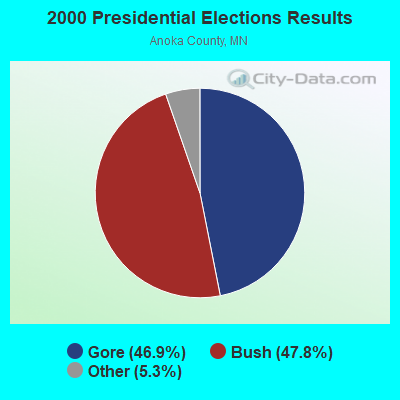
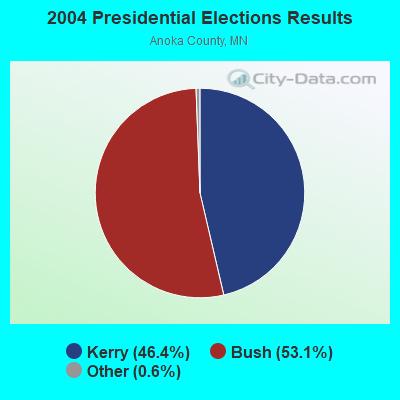
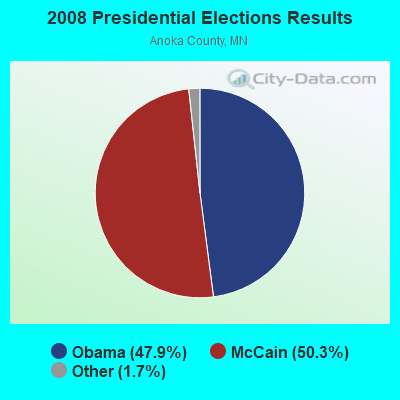

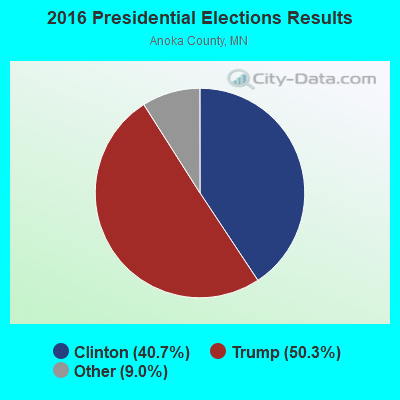
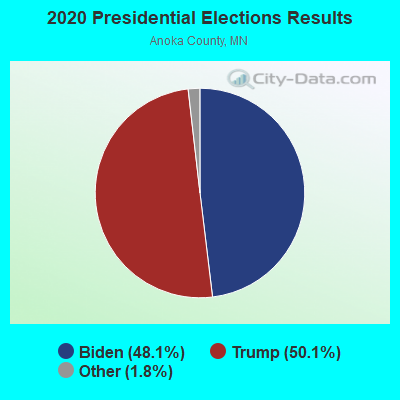
Graphs represent county-level data. Detailed 2008 Election Results
Religion statistics for St. Francis, MN (based on Anoka County data)
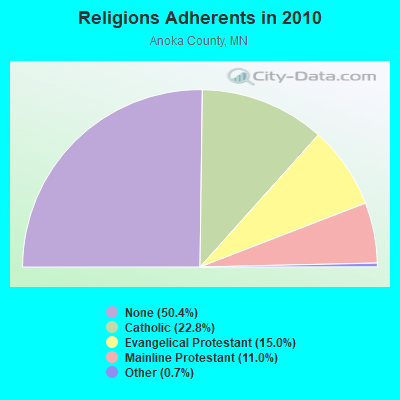
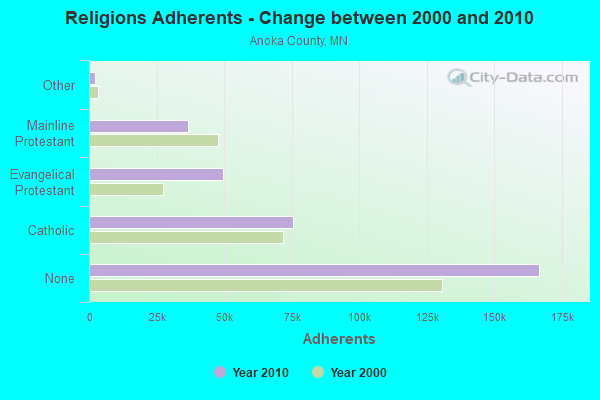
| Religion | Adherents | Congregations |
|---|---|---|
| Catholic | 75,535 | 12 |
| Evangelical Protestant | 49,709 | 109 |
| Mainline Protestant | 36,549 | 33 |
| Other | 2,179 | 12 |
| Orthodox | 195 | 3 |
| None | 166,677 | - |
Food Environment Statistics:
| Anoka County: | 0.98 / 10,000 pop. |
| State: | 1.83 / 10,000 pop. |
| Anoka County: | 0.09 / 10,000 pop. |
| Minnesota: | 0.13 / 10,000 pop. |
| Here: | 0.43 / 10,000 pop. |
| Minnesota: | 0.49 / 10,000 pop. |
| Anoka County: | 3.35 / 10,000 pop. |
| Minnesota: | 3.90 / 10,000 pop. |
| Anoka County: | 3.84 / 10,000 pop. |
| Minnesota: | 6.98 / 10,000 pop. |
| Anoka County: | 6.8% |
| State: | 6.5% |
| Here: | 27.7% |
| State: | 25.9% |
| Here: | 12.6% |
| State: | 13.0% |
Health and Nutrition:
| This city: | 43.1% |
| Minnesota: | 50.6% |
| St. Francis: | 36.2% |
| State: | 48.4% |
| St. Francis: | 28.2 |
| Minnesota: | 28.5 |
| Here: | 22.2% |
| Minnesota: | 21.0% |
| This city: | 10.1% |
| Minnesota: | 9.8% |
| This city: | 6.7 |
| Minnesota: | 6.8 |
| Here: | 28.7% |
| Minnesota: | 33.5% |
| St. Francis: | 53.3% |
| State: | 57.7% |
| St. Francis: | 79.6% |
| Minnesota: | 79.3% |
More about Health and Nutrition of St. Francis, MN Residents
St. Francis government finances - Expenditure in 2017 (per resident):
- Construction - Regular Highways: $767,000 ($91.45)
- Current Operations - Miscellaneous Commercial Activities - Other: $2,008,000 ($239.42)
Police Protection: $1,438,000 ($171.46)
Sewerage: $823,000 ($98.13)
Water Utilities: $819,000 ($97.65)
Central Staff Services: $645,000 ($76.90)
Regular Highways: $445,000 ($53.06)
Parks and Recreation: $296,000 ($35.29)
Housing and Community Development: $229,000 ($27.30)
Local Fire Protection: $211,000 ($25.16)
Protective Inspection and Regulation - Other: $168,000 ($20.03)
Financial Administration: $129,000 ($15.38)
Natural Resources - Other: $61,000 ($7.27)
Solid Waste Management: $46,000 ($5.48)
- Other Capital Outlay - Parks and Recreation: $73,000 ($8.70)
Police Protection: $66,000 ($7.87)
Regular Highways: $37,000 ($4.41)
Central Staff Services: $27,000 ($3.22)
- Total Salaries and Wages: $2,343,000 ($279.36)
- Water Utilities - Interest on Debt: $239,000 ($28.50)
St. Francis government finances - Revenue in 2017 (per resident):
- Charges - Other: $2,301,000 ($274.35)
Sewerage: $1,336,000 ($159.29)
- Miscellaneous - General Revenue - Other: $1,400,000 ($166.93)
Special Assessments: $518,000 ($61.76)
Interest Earnings: $116,000 ($13.83)
Rents: $54,000 ($6.44)
Fines and Forfeits: $31,000 ($3.70)
- Revenue - Water Utilities: $1,386,000 ($165.26)
- State Intergovernmental - Sewerage: $3,310,000 ($394.66)
Highways: $1,005,000 ($119.83)
General Local Government Support: $502,000 ($59.85)
- Tax - Property: $3,279,000 ($390.96)
Other License: $126,000 ($15.02)
Alcoholic Beverage License: $20,000 ($2.38)
St. Francis government finances - Debt in 2017 (per resident):
- Long Term Debt - Outstanding Nonguaranteed - Industrial Revenue: $36,712,000 ($4377.25)
Beginning Outstanding - Public Debt for Private Purpose: $30,268,000 ($3608.92)
Issue, Nonguaranteed - Public Debt for Private Purpose: $23,741,000 ($2830.69)
Retired Nonguaranteed - Public Debt for Private Purpose: $17,297,000 ($2062.36)
Beginning Outstanding - Unspecified Public Purpose: $9,055,000 ($1079.65)
Outstanding Unspecified Public Purpose: $8,745,000 ($1042.69)
Retired Unspecified Public Purpose: $310,000 ($36.96)
St. Francis government finances - Cash and Securities in 2017 (per resident):
- Other Funds - Cash and Securities: $15,086,000 ($1798.74)
- Sinking Funds - Cash and Securities: $39,281,000 ($4683.56)
Businesses in St. Francis, MN
- McDonald's: 1
Strongest AM radio stations in St. Francis:
- WCCO (830 AM; 50 kW; MINNEAPOLIS, MN; Owner: INFINITY MEDIA CORPORATION)
- KSTP (1500 AM; 50 kW; ST. PAUL, MN; Owner: KSTP-AM, LLC (DELAWARE))
- WCTS (1030 AM; 50 kW; MAPLEWOOD, MN; Owner: CNTL. BAPT. THEO/AL SEMI MINNEAPOLIS)
- KTIS (900 AM; 25 kW; MINNEAPOLIS, MN; Owner: NORTHWESTERN COLLEGE)
- KFAN (1130 AM; 50 kW; MINNEAPOLIS, MN; Owner: AMFM RADIO LICENSES, L.L.C.)
- WBHR (660 AM; 10 kW; SAUK RAPIDS, MN; Owner: HERBERT M. HOPPE)
- KLBP (1470 AM; 5 kW; BROOKLYN PARK, MN; Owner: 1400, INC.)
- KUOM (770 AM; daytime; 5 kW; MINNEAPOLIS, MN)
- WEBC (560 AM; 50 kW; DULUTH, MN)
- WDGY (630 AM; 8 kW; HUDSON, WI; Owner: 630 RADIO, INCORPORATED)
- KDIZ (1440 AM; 5 kW; GOLDEN VALLEY, MN; Owner: KQRS, INC.)
- WWTC (1280 AM; 5 kW; MINNEAPOLIS, MN; Owner: SCA LICENSE CORPORATION)
- WMNN (1330 AM; 10 kW; MINNEAPOLIS, MN; Owner: MINNESOTA PUBLIC RADIO.)
Strongest FM radio stations in St. Francis:
- KJZI (100.3 FM; MINNEAPOLIS, MN; Owner: AMFM RADIO LICENSES, L.L.C.)
- KQQL (107.9 FM; ANOKA, MN; Owner: AMFM RADIO LICENSES, L.L.C.)
- KNOW-FM (91.1 FM; MINNEAPOLIS-ST. PAUL, MN; Owner: MINNESOTA PUBLIC RADIO)
- WLTE (102.9 FM; MINNEAPOLIS, MN; Owner: INFINITY MEDIA CORPORATION)
- KSTP-FM (94.5 FM; ST. PAUL, MN; Owner: KSTP-FM, LLC, A DELAWARE LLC)
- KTCZ-FM (97.1 FM; MINNEAPOLIS, MN; Owner: AMFM RADIO LICENSES, L.L.C.)
- KEEY-FM (102.1 FM; ST. PAUL, MN; Owner: AMFM RADIO LICENSES, L.L.C.)
- KTIS-FM (98.5 FM; MINNEAPOLIS, MN; Owner: NORTHWESTERN COLLEGE)
- KDWB-FM (101.3 FM; RICHFIELD, MN; Owner: AMFM RADIO LICENSES, L.L.C.)
- KQRS-FM (92.5 FM; GOLDEN VALLEY, MN; Owner: KQRS, Inc.)
- KSJN (99.5 FM; MINNEAPOLIS, MN; Owner: MINNESOTA PUBLIC RADIO)
- KXXR (93.7 FM; MINNEAPOLIS, MN; Owner: KQRS, INC.)
- WGVY (105.3 FM; CAMBRIDGE, MN; Owner: KQRS, INC.)
- WFMP (107.1 FM; COON RAPIDS, MN; Owner: WFMP-FM, LLC)
- KLCI (106.1 FM; ELK RIVER, MN; Owner: MILESTONE RADIO LLC)
- KCLD-FM (104.7 FM; ST. CLOUD, MN; Owner: LEIGHTON ENTERPRISES, INC.)
- WXPT (104.1 FM; ST. LOUIS PARK, MN; Owner: THE AUDIO HOUSE, INC.)
- WLKX-FM (95.9 FM; FOREST LAKE, MN; Owner: LAKES BROADCASTING CO., INC.)
- WWJO (98.1 FM; ST. CLOUD, MN; Owner: REGENT LICENSEE OF ST. CLOUD, INC.)
- K214DF (90.7 FM; GOLDEN VALLEY, MN; Owner: EDUCATIONAL MEDIA FOUNDATION)
TV broadcast stations around St. Francis:
- KPXM (Channel 41; ST. CLOUD, MN; Owner: PAXSON MINNEAPOLIS LICENSE, INC.)
- KARE (Channel 11; MINNEAPOLIS, MN; Owner: MULTIMEDIA HOLDINGS CORPORATION)
- KSTP-TV (Channel 5; ST. PAUL, MN; Owner: HUBBARD BROADCASTING, INC.)
- KMSP-TV (Channel 9; MINNEAPOLIS, MN; Owner: FOX TELEVISION STATIONS, INC.)
- KTCA-TV (Channel 2; ST. PAUL, MN; Owner: TWIN CITIES PUBLIC TELEVISION, INC.)
- WCCO-TV (Channel 4; MINNEAPOLIS, MN; Owner: CBS BROADCASTING INC.)
- KSTC-TV (Channel 45; MINNEAPOLIS, MN; Owner: HUBBARD BROADCASTING, INC.)
- KTCI-TV (Channel 17; ST. PAUL, MN; Owner: TWIN CITIES PUBLIC TELEVISION, INC.)
- KMWB (Channel 23; MINNEAPOLIS, MN; Owner: KLGT LICENSEE, LLC)
- WFTC (Channel 29; MINNEAPOLIS, MN; Owner: FOX TELEVISION STATIONS, INC.)
- K07UI (Channel 7; MINNEAPOLIS, ETC., MN; Owner: WORD OF GOD FELLOWSHIP, INC.)
- K58BS (Channel 58; MINNEAPOLIS, MN; Owner: TRINITY BROADCASTING NETWORK)
- K67HG (Channel 67; MINNEAPOLIS, MN; Owner: VENTANA TELEVISION, INC.)
- K19ER (Channel 19; ST. PAUL, MN; Owner: CATHOLIC VIEWS BROADCASTS, INC.)
- K14KH (Channel 14; MINNEAPOLIS, MN; Owner: THREE ANGELS BROADCASTING NETWORK)
- W62BD (Channel 62; MINNEAPOLIS, MN; Owner: WORD OF GOD FELLOWSHIP, INC.)
- WBWX-CA (Channel 13; MINNEAPOLIS, MN; Owner: THE BOX WORLDWIDE LLC)
- National Bridge Inventory (NBI) Statistics
- 3Number of bridges
- 72ft / 21.9mTotal length
- 12,060Total average daily traffic
- 1,185Total average daily truck traffic
- 11,990Total future (year 2039) average daily traffic
FCC Registered Private Land Mobile Towers:
1- 23307 Nw Francis Blvd. (Lat: 45.392222 Lon: -93.366389), Type: Tower, Structure height: 54.9 m, Overall height: 59.4 m, Call Sign: WPSU770,
Assigned Frequencies: 860.362 MHz, Grant Date: 08/09/2011, Expiration Date: 08/03/2021, Cancellation Date: 11/09/2011, Certifier: Robin J Glenny, Registrant: Sprint Nextel Corporation, 12502 Sunrise Valley Drive, M/S: Varesa0209, Reston, VA 20196, Phone: (703) 433-4000, Fax: (703) 433-4483
FCC Registered Broadcast Land Mobile Towers:
3- Lat: 45.383667 Lon: -93.339056, Call Sign: WQDJ753,
Assigned Frequencies: 451.375 MHz, 456.375 MHz, 461.512 MHz, 466.512 MHz, Grant Date: 09/13/2005, Expiration Date: 09/13/2015, Cancellation Date: 11/14/2015, Certifier: Tim Oconner, Registrant: Cara Enterprises, Inc., Salt Lake City, UT 84117-0503, Phone: (801) 278-9728, Fax: (801) 278-7239, Email:
- 4111 Ambassador Road (Lat: 45.399972 Lon: -93.371250), Type: Mast, Structure height: 7.6 m, Overall height: 9.2 m, Call Sign: WQDL266,
Assigned Frequencies: 72.1600 MHz, Grant Date: 07/03/2015, Expiration Date: 09/22/2025, Certifier: Jim Heckenlaibb, Registrant: Universal Licensing Service, 4401-A Connecticut Ave Nw #232, Washington, DC 20008, Phone: (877) 677-3639, Fax: (949) 209-3097, Email:
- MOB, Lat: 45.400556 Lon: -93.371639, Call Sign: WQPH745,
Assigned Frequencies: 451.187 MHz, 451.687 MHz, 452.087 MHz, 452.487 MHz, 452.787 MHz, Grant Date: 05/22/2012, Expiration Date: 05/22/2022, Cancellation Date: 07/23/2022, Certifier: Mae L Hawkins, Registrant: Bearcom Operating LLC, Dallas, TX 75355-9001, Phone: (800) 458-9887, Fax: (214) 355-1714, Email:
FCC Registered Microwave Towers:
1- MS60XC332, 4020 St. Francis Blvd., Nw (Lat: 45.381278 Lon: -93.369111), Type: Mtower, Structure height: 53.3 m, Overall height: 55.5 m, Call Sign: WQSI497,
Assigned Frequencies: 11305.0 MHz, 11265.0 MHz, 11305.0 MHz, 11265.0 MHz, 11305.0 MHz, 11265.0 MHz, Grant Date: 09/24/2013, Expiration Date: 09/24/2023, Cancellation Date: 05/10/2023, Certifier: David Werblow, Registrant: T-Mobile Usa, Inc., 12920 Se 38th Street, Bellevue, WA 98006, Phone: (425) 383-8401, Email:
FCC Registered Amateur Radio Licenses:
1- Call Sign: K0MSB, Previous Call Sign: KE0CDM, Licensee ID: L01867640, Grant Date: 02/24/2015, Expiration Date: 02/24/2025, Certifier: Matthew S Burch, Registrant: Matthew S Burch, 23198 Jivaro St. Nw, St. Francis, MN 55070
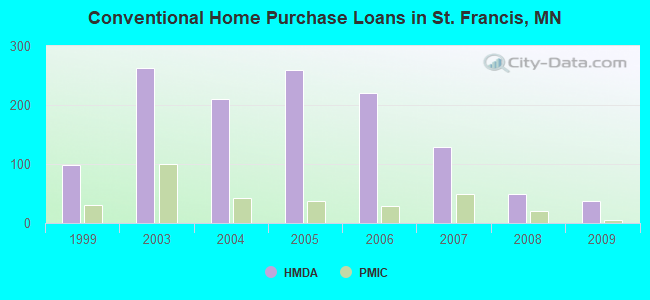
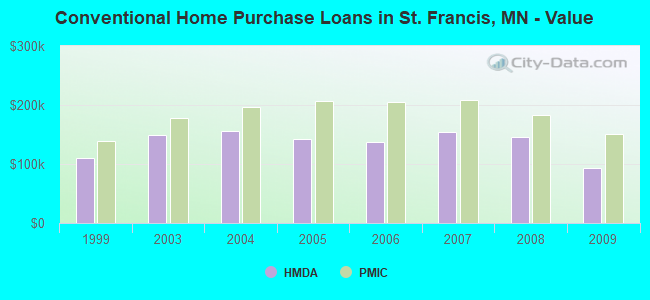
| Home Mortgage Disclosure Act Aggregated Statistics For Year 2009 (Based on 1 full and 1 partial tracts) | ||||||||||||
| A) FHA, FSA/RHS & VA Home Purchase Loans | B) Conventional Home Purchase Loans | C) Refinancings | D) Home Improvement Loans | F) Non-occupant Loans on < 5 Family Dwellings (A B C & D) | G) Loans On Manufactured Home Dwelling (A B C & D) | |||||||
|---|---|---|---|---|---|---|---|---|---|---|---|---|
| Number | Average Value | Number | Average Value | Number | Average Value | Number | Average Value | Number | Average Value | Number | Average Value | |
| LOANS ORIGINATED | 99 | $134,294 | 37 | $92,932 | 135 | $165,543 | 7 | $121,101 | 11 | $113,184 | 4 | $45,000 |
| APPLICATIONS APPROVED, NOT ACCEPTED | 0 | $0 | 4 | $45,022 | 26 | $154,274 | 1 | $36,590 | 0 | $0 | 5 | $39,386 |
| APPLICATIONS DENIED | 5 | $136,484 | 11 | $67,161 | 74 | $197,363 | 9 | $35,271 | 6 | $125,625 | 8 | $49,528 |
| APPLICATIONS WITHDRAWN | 12 | $147,022 | 5 | $91,992 | 49 | $183,788 | 1 | $128,990 | 1 | $41,000 | 2 | $33,000 |
| FILES CLOSED FOR INCOMPLETENESS | 1 | $168,320 | 1 | $152,000 | 13 | $198,385 | 0 | $0 | 0 | $0 | 1 | $50,000 |
Detailed HMDA statistics for the following Tracts: 0501.07 , 0501.08
| Private Mortgage Insurance Companies Aggregated Statistics For Year 2009 (Based on 1 full and 1 partial tracts) | ||||
| A) Conventional Home Purchase Loans | B) Refinancings | |||
|---|---|---|---|---|
| Number | Average Value | Number | Average Value | |
| LOANS ORIGINATED | 5 | $150,396 | 3 | $221,077 |
| APPLICATIONS APPROVED, NOT ACCEPTED | 3 | $174,023 | 2 | $358,145 |
| APPLICATIONS DENIED | 1 | $47,570 | 5 | $390,620 |
| APPLICATIONS WITHDRAWN | 0 | $0 | 0 | $0 |
| FILES CLOSED FOR INCOMPLETENESS | 0 | $0 | 0 | $0 |
Detailed PMIC statistics for the following Tracts: 0501.07 , 0501.08
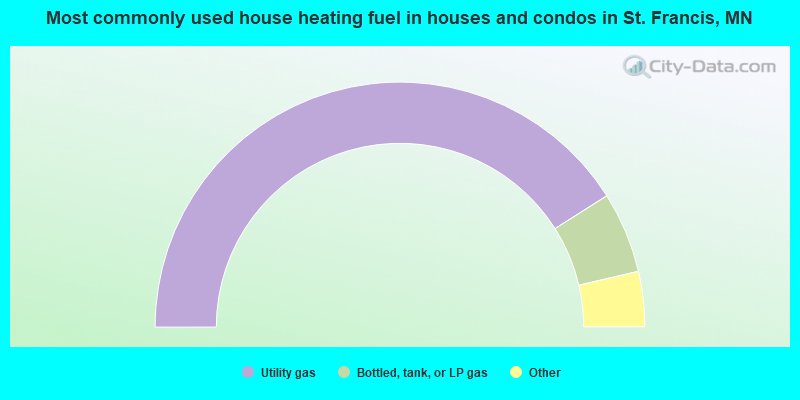
- 82.0%Utility gas
- 10.7%Bottled, tank, or LP gas
- 4.0%Wood
- 2.5%Electricity
- 0.8%Fuel oil, kerosene, etc.
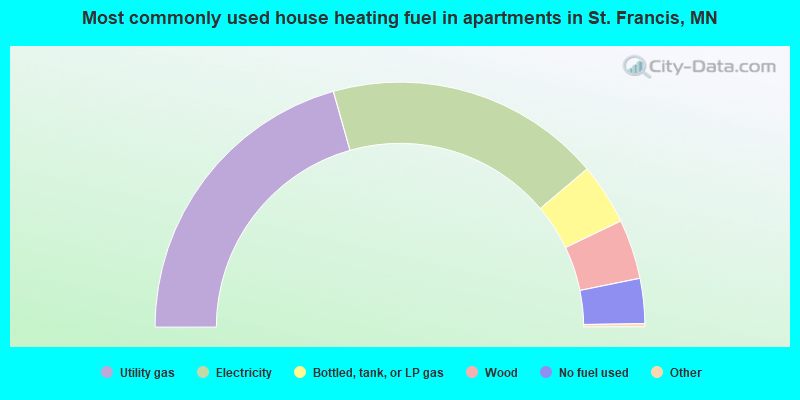
- 41.4%Utility gas
- 36.6%Electricity
- 8.1%Bottled, tank, or LP gas
- 7.9%Wood
- 6.0%No fuel used
St. Francis compared to Minnesota state average:
- Unemployed percentage significantly below state average.
- Black race population percentage significantly below state average.
- Median age significantly below state average.
- Foreign-born population percentage below state average.
- Renting percentage below state average.
- Length of stay since moving in above state average.
- House age significantly below state average.
- Percentage of population with a bachelor's degree or higher below state average.
St. Francis on our top lists:
- #73 on the list of "Top 101 cities with the highest number of rapes per 100,000 residents, excludes tourist destinations and others with a lot of outsiders visiting based on city industries data (population 5,000+)"
- #60 (55070) on the list of "Top 101 zip codes with the largest percentage of Swedish first ancestries (pop 5,000+)"
- #22 on the list of "Top 101 counties with the lowest number of infant deaths per 1000 residents 2007-2013 (pop. 50,000+)"
- #24 on the list of "Top 101 counties with the highest percentage of residents that exercised in the past month"
- #31 on the list of "Top 101 counties with the highest carbon monoxide air pollution readings in 2012 (ppm)"
- #33 on the list of "Top 101 counties with the largest increase in the number of deaths per 1000 residents 2000-2006 to 2007-2013 (pop. 50,000+)"
- #37 on the list of "Top 101 counties with the lowest number of deaths per 1000 residents 2007-2013 (pop. 50,000+)"

|
|
Total of 63 patent applications in 2008-2024.