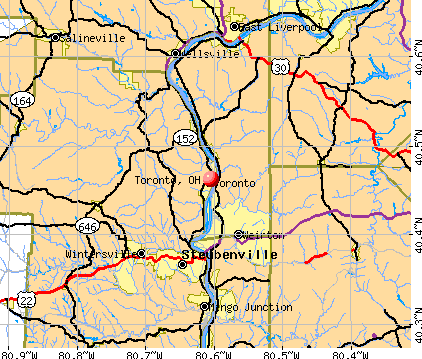
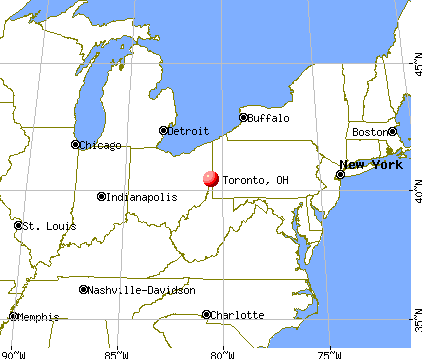
Toronto, Ohio

Toronto: The Old Toronto Pool
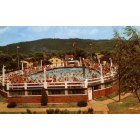
Toronto: Our Old Toronto Pool..We had alot of fun there as kids....
- add
your
Submit your own pictures of this city and show them to the world
- OSM Map
- General Map
- Google Map
- MSN Map
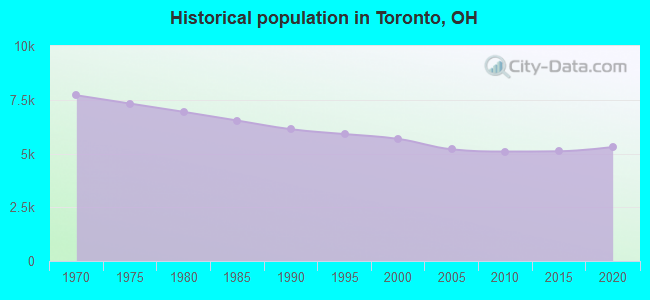
Population change since 2000: -7.8%
 |
| Males: 2,479 | |
| Females: 2,754 |
| Median resident age: | 43.5 years |
| Ohio median age: | 39.9 years |
Zip codes: 43964.
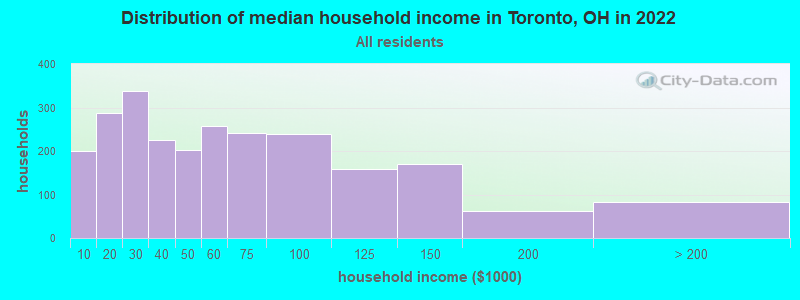
| Toronto: | $47,372 |
| OH: | $65,720 |
Estimated per capita income in 2022: $30,907 (it was $15,761 in 2000)
Toronto city income, earnings, and wages data
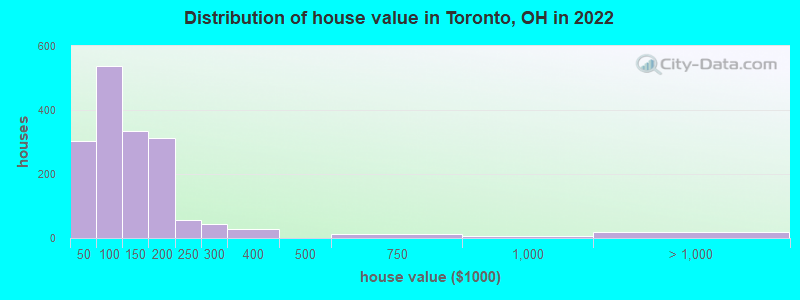
Estimated median house or condo value in 2022: $109,677 (it was $59,800 in 2000)
| Toronto: | $109,677 |
| OH: | $204,100 |
Mean prices in 2022: all housing units: $176,998; detached houses: $181,376; townhouses or other attached units: $163,578; in 2-unit structures: $133,887; in 3-to-4-unit structures: $78,107; in 5-or-more-unit structures: $496,962; mobile homes: $67,428; occupied boats, rvs, vans, etc.: $131,133
Median gross rent in 2022: $687.
(15.0% for White Non-Hispanic residents, 54.5% for Black residents, 12.2% for Hispanic or Latino residents, 25.0% for two or more races residents)
Detailed information about poverty and poor residents in Toronto, OH
Compare current foreclosures near Toronto, OH:
| Photo | Address | Area | Beds / Baths | Price | Details |
|---|---|---|---|---|---|

|
#1
Madison Ave
Toronto, OH 43964
|
1,024 sq. feet
|
1 baths 3 beds |
$119,900
|
show details |

|
#2
N 3rd St
Toronto, OH 43964
|
1,406 sq. feet
|
1 baths 3 beds |
$144,500
|
show details |

|
#3
State Route 152
Toronto, OH 43964
|
1,494 sq. feet
|
2 baths 3 beds |
show details | |

|
#4
Main St
Toronto, OH 43964
|
984 sq. feet
|
1 baths 3 beds |
show details | |

|
#5
N River Ave
Toronto, OH 43964
|
1,137 sq. feet
|
1 baths 2 beds |
show details | |

|
#6
State Route 213
Toronto, OH 43964
|
786 sq. feet
|
1 baths 3 beds |
show details | |

|
#7
Wentworth Ave
Toronto, OH 43964
|
996 sq. feet
|
1 baths 2 beds |
show details | |

|
#8
W Fernwood Dr
Toronto, OH 43964
|
1,040 sq. feet
|
1 baths 3 beds |
show details | |

|
#9
State Route 213
Toronto, OH 43964
|
2,944 sq. feet
|
2 baths 4 beds |
show details | |

|
#10
State Route 213
Toronto, OH 43964
|
- sq. feet
|
- baths - beds |
show details |
| Photo | Address | Area | Beds / Baths | Price | Details |
|---|---|---|---|---|---|

|
#11
County Road 47
Toronto, OH 43964
|
- sq. feet
|
- baths - beds |
show details | |

|
#12
County Road 47
Toronto, OH 43964
|
- sq. feet
|
- baths - beds |
show details | |

|
#13
Market St Apt 7
Toronto, OH 43964
|
- sq. feet
|
- baths - beds |
show details | |

|
#14
Tr 247
Toronto, OH 43964
|
- sq. feet
|
- baths - beds |
show details | |

|
#15
Blueberry Dr
Aliquippa, PA 15001
|
1,891 sq. feet
|
2 baths 3 beds |
$50,600
|
show details |

|
#16
West Blvd
Mingo Junction, OH 43938
|
1,757 sq. feet
|
2 baths 4 beds |
show details | |

|
#17
Eleanor St
Langeloth, PA 15054
|
1,512 sq. feet
|
1 baths 2 beds |
show details | |

|
#18
Marion Pl
Steubenville, OH 43953
|
1,212 sq. feet
|
1 baths 3 beds |
show details | |

|
#19
Sinclair Ave
Steubenville, OH 43952
|
1,200 sq. feet
|
1 baths 4 beds |
show details | |

|
#20
Bonnie Beth Dr
Wellsburg, WV 26070
|
2,542 sq. feet
|
2 baths 4 beds |
show details |
| Photo | Address | Area | Beds / Baths | Price | Details |
|---|---|---|---|---|---|

|
#21
Beechwood Blvd
Steubenville, OH 43953
|
1,761 sq. feet
|
1 baths 3 beds |
show details | |

|
#22
Cleveland Ave
Steubenville, OH 43952
|
1,128 sq. feet
|
1 baths 3 beds |
show details | |

|
#23
Marianna St
Wellsburg, WV 26070
|
768 sq. feet
|
1 baths 1 beds |
show details | |

|
#24
Valley Dr
East Liverpool, OH 43920
|
1,050 sq. feet
|
1 baths 2 beds |
show details | |

|
#25
Buena Vista Blvd
Steubenville, OH 43952
|
1,122 sq. feet
|
1 baths 2 beds |
show details | |

|
#26
Edward St
Mingo Junction, OH 43938
|
1,184 sq. feet
|
1 baths 3 beds |
show details | |

|
#27
State Route 151
Mingo Junction, OH 43938
|
1,477 sq. feet
|
1 baths 3 beds |
show details | |

|
#28
Smith Township State Rd
Burgettstown, PA 15021
|
1,080 sq. feet
|
2 baths 3 beds |
show details | |

|
#29
Chester Ave
Wellsville, OH 43968
|
1,384 sq. feet
|
1 baths 2 beds |
show details | |

|
#30
Horse Shoe Driv
Clinton, PA 15026
|
- sq. feet
|
2 baths 4 beds |
show details |
| Photo | Address | Area | Beds / Baths | Price | Details |
|---|---|---|---|---|---|

|
#31
Smiths Ferry Rd
Midland, PA 15059
|
1,188 sq. feet
|
1 baths 3 beds |
show details | |

|
#32
Commerce St
Wellsville, OH 43968
|
1,428 sq. feet
|
1 baths 3 beds |
show details | |

|
#33
Old State Rt 7
Steubenville, OH 43952
|
3,019 sq. feet
|
3 baths 3 beds |
show details | |

|
#34
9th Ave
East Liverpool, OH 43920
|
840 sq. feet
|
1 baths 2 beds |
show details | |

|
#35
County Road 19
Mingo Junction, OH 43938
|
690 sq. feet
|
1 baths 2 beds |
show details | |

|
#36
Vine St
East Liverpool, OH 43920
|
1,440 sq. feet
|
2 baths 3 beds |
show details | |

|
#37
Elich Rd
Burgettstown, PA 15021
|
1,181 sq. feet
|
1 baths 3 beds |
show details | |

|
#38
Bradshaw Ave
East Liverpool, OH 43920
|
936 sq. feet
|
1 baths 2 beds |
show details | |

|
#39
Saint Clair Ave
East Liverpool, OH 43920
|
2,866 sq. feet
|
2 baths 4 beds |
show details | |

|
#40
Alliance Ave
East Liverpool, OH 43920
|
1,120 sq. feet
|
2 baths 3 beds |
show details |
| Photo | Address | Area | Beds / Baths | Price | Details |
|---|---|---|---|---|---|

|
#41
Stella St
Burgettstown, PA 15021
|
1,326 sq. feet
|
1 baths 3 beds |
show details | |

|
#42
S Shadylane Dr
East Liverpool, OH 43920
|
1,636 sq. feet
|
1 baths 3 beds |
show details | |

|
#43
Hillcrest Rd
Wellsville, OH 43968
|
952 sq. feet
|
1 baths 3 beds |
show details | |

|
#44
County Road 19
Mingo Junction, OH 43938
|
816 sq. feet
|
1 baths 2 beds |
show details | |

|
#45
W 9th St
East Liverpool, OH 43920
|
1,744 sq. feet
|
1 baths 3 beds |
show details | |

|
#46
Wells Hollow Rd
Wellsville, OH 43968
|
1,276 sq. feet
|
1 baths 3 beds |
show details | |

|
#47
Hillcrest Rd
Wellsville, OH 43968
|
720 sq. feet
|
1 baths 2 beds |
show details | |

|
#48
Route 30
Clinton, PA 15026
|
2,176 sq. feet
|
2 baths 3 beds |
show details | |

|
#49
Avondale St
East Liverpool, OH 43920
|
1,704 sq. feet
|
1 baths 3 beds |
show details | |

|
Check over 1 million property listings on Foreclosure.com!
|
browse all offers | |||


- 4,96892.4%White alone
- 1522.8%Black alone
- 1342.5%Two or more races
- 510.9%Hispanic
- 260.5%Asian alone
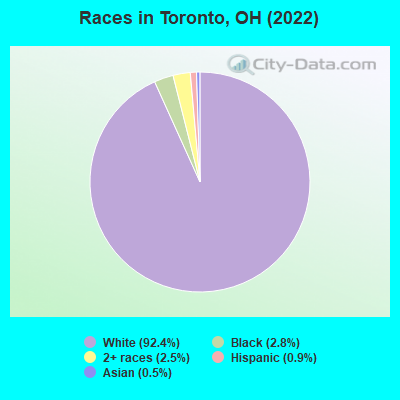
Races in Toronto detailed stats: ancestries, foreign born residents, place of birth
According to our research of Ohio and other state lists, there were 15 registered sex offenders living in Toronto, Ohio as of April 24, 2024.
The ratio of all residents to sex offenders in Toronto is 340 to 1.
Type |
2009 |
2011 |
2012 |
2013 |
2014 |
2015 |
2016 |
2017 |
2018 |
2019 |
2020 |
2021 |
2022 |
|---|---|---|---|---|---|---|---|---|---|---|---|---|---|
| Murders (per 100,000) | 0 (0.0) | 0 (0.0) | 0 (0.0) | 0 (0.0) | 0 (0.0) | 0 (0.0) | 0 (0.0) | 0 (0.0) | 1 (20.9) | 0 (0.0) | 0 (0.0) | 0 (0.0) | 1 (19.0) |
| Rapes (per 100,000) | 1 (19.3) | 0 (0.0) | 0 (0.0) | 3 (60.8) | 0 (0.0) | 2 (41.1) | 3 (61.9) | 2 (41.5) | 2 (41.9) | 2 (40.7) | 0 (0.0) | 1 (20.6) | 3 (57.0) |
| Robberies (per 100,000) | 1 (19.3) | 0 (0.0) | 0 (0.0) | 0 (0.0) | 0 (0.0) | 0 (0.0) | 0 (0.0) | 0 (0.0) | 0 (0.0) | 0 (0.0) | 0 (0.0) | 0 (0.0) | 0 (0.0) |
| Assaults (per 100,000) | 0 (0.0) | 1 (19.6) | 3 (59.7) | 6 (121.5) | 0 (0.0) | 0 (0.0) | 3 (61.9) | 13 (270.0) | 3 (62.8) | 7 (142.3) | 3 (61.4) | 2 (41.1) | 3 (57.0) |
| Burglaries (per 100,000) | 2 (38.6) | 0 (0.0) | 13 (258.8) | 3 (60.8) | 0 (0.0) | 2 (41.1) | 4 (82.6) | 4 (83.1) | 7 (146.6) | 5 (101.6) | 3 (61.4) | 1 (20.6) | 0 (0.0) |
| Thefts (per 100,000) | 0 (0.0) | 2 (39.3) | 16 (318.5) | 5 (101.3) | 5 (102.0) | 6 (123.2) | 12 (247.8) | 16 (332.4) | 7 (146.6) | 9 (183.0) | 11 (225.3) | 4 (82.2) | 7 (133.0) |
| Auto thefts (per 100,000) | 0 (0.0) | 0 (0.0) | 0 (0.0) | 0 (0.0) | 0 (0.0) | 0 (0.0) | 0 (0.0) | 1 (20.8) | 0 (0.0) | 0 (0.0) | 1 (20.5) | 0 (0.0) | 0 (0.0) |
| Arson (per 100,000) | 0 (0.0) | 0 (0.0) | 0 (0.0) | 0 (0.0) | 0 (0.0) | 0 (0.0) | 0 (0.0) | 0 (0.0) | 0 (0.0) | 0 (0.0) | 0 (0.0) | 1 (20.6) | 0 (0.0) |
| City-Data.com crime index | 24.0 | 5.5 | 42.8 | 81.2 | 4.1 | 40.7 | 77.6 | 108.0 | 104.1 | 75.4 | 27.2 | 29.4 | 100.3 |
The City-Data.com crime index weighs serious crimes and violent crimes more heavily. Higher means more crime, U.S. average is 246.1. It adjusts for the number of visitors and daily workers commuting into cities.
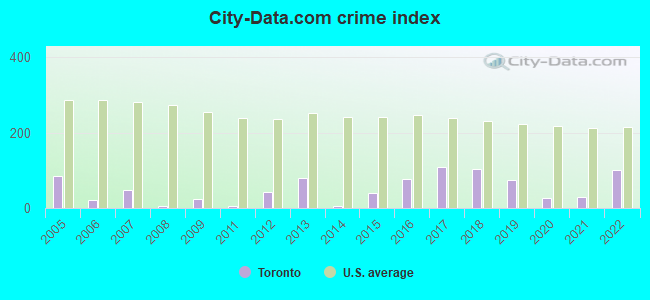
Crime rate in Toronto detailed stats: murders, rapes, robberies, assaults, burglaries, thefts, arson
Full-time law enforcement employees in 2011, including police officers: 10 (10 officers - 10 male; 0 female).
| Officers per 1,000 residents here: | 1.96 |
| Ohio average: | 2.11 |
 Recent articles from our blog. Our writers, many of them Ph.D. graduates or candidates, create easy-to-read articles on a wide variety of topics.

 | Greater Cleveland mass transit (229 replies) |
| How good are the 2021-2022 Cavaliers? (109 replies) |
| Moving from Connecticut to Toronto, OH (0 replies) |
| Wife offered her draeam job, help me feel that I can enjoy a life in Cleveland... (206 replies) |
| Moving from Toronto to Cincy (49 replies) |
| How Do Clevelanders With An Inferiority Complex to Get Over It? (392 replies) |
Latest news from Toronto, OH collected exclusively by city-data.com from local newspapers, TV, and radio stations
Ancestries: Irish (25.4%), Italian (13.2%), German (13.0%), English (8.4%), Polish (5.8%), American (5.6%).
Current Local Time: EST time zone
Elevation: 700 feet
Land area: 1.88 square miles.
Population density: 2,779 people per square mile (average).
46 residents are foreign born
| This city: | 0.9% |
| Ohio: | 4.9% |
Median real estate property taxes paid for housing units with mortgages in 2022: $1,132 (0.9%)
Median real estate property taxes paid for housing units with no mortgage in 2022: $909 (0.9%)
Nearest city with pop. 50,000+: Pittsburgh, PA  (33.0 miles , pop. 334,563).
Nearest city with pop. 1,000,000+: Philadelphia, PA (290.0 miles , pop. 1,517,550).
Nearest cities:
), ), ), ), ), )Latitude: 40.46 N, Longitude: 80.60 W
Area code: 740
Toronto, Ohio accommodation & food services, waste management - Economy and Business Data
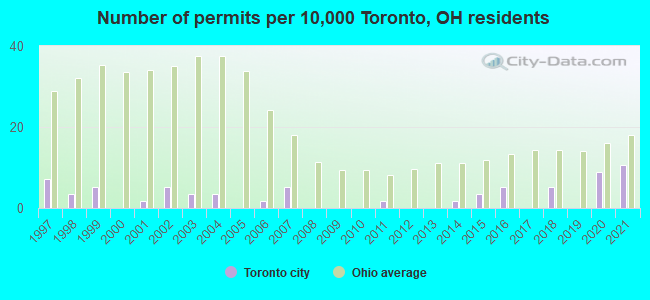
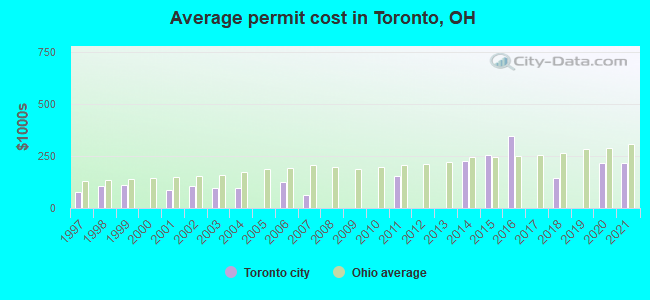
Single-family new house construction building permits:
- 2021: 6 buildings, average cost: $217,000
- 2020: 5 buildings, average cost: $217,000
- 2018: 3 buildings, average cost: $146,700
- 2016: 3 buildings, average cost: $347,300
- 2015: 2 buildings, average cost: $255,000
- 2014: 1 building, cost: $225,000
- 2011: 1 building, cost: $152,000
- 2007: 3 buildings, average cost: $63,700
- 2006: 1 building, cost: $125,000
- 2004: 2 buildings, average cost: $95,000
- 2003: 2 buildings, average cost: $95,000
- 2002: 3 buildings, average cost: $103,700
- 2001: 1 building, cost: $87,500
- 1999: 3 buildings, average cost: $109,000
- 1998: 2 buildings, average cost: $108,000
- 1997: 4 buildings, average cost: $79,000
| Here: | 4.7% |
| Ohio: | 3.1% |
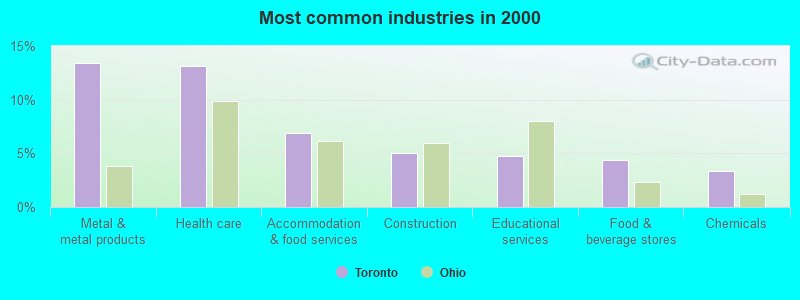
- Metal & metal products (13.4%)
- Health care (13.1%)
- Accommodation & food services (6.9%)
- Construction (5.0%)
- Educational services (4.7%)
- Food & beverage stores (4.3%)
- Chemicals (3.3%)
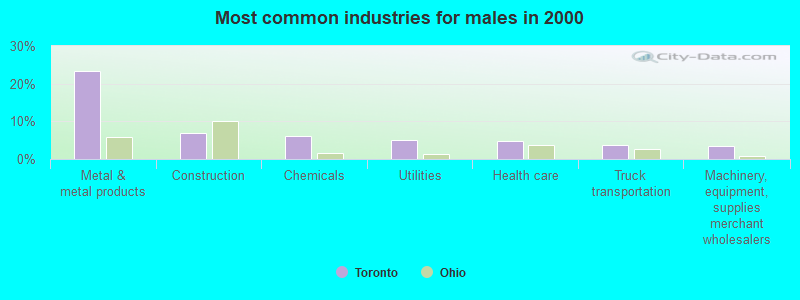
- Metal & metal products (23.3%)
- Construction (6.8%)
- Chemicals (6.0%)
- Utilities (5.1%)
- Health care (4.7%)
- Truck transportation (3.6%)
- Machinery, equipment, supplies merchant wholesalers (3.4%)
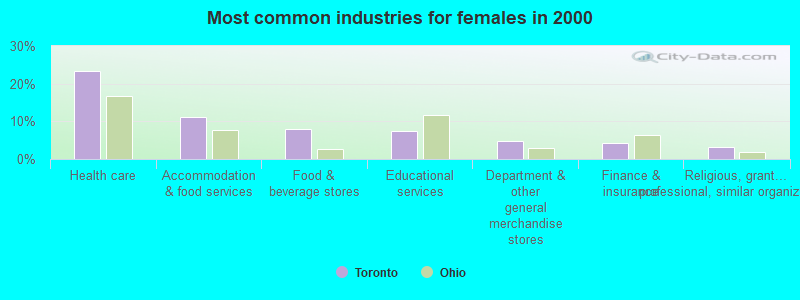
- Health care (23.4%)
- Accommodation & food services (11.2%)
- Food & beverage stores (8.0%)
- Educational services (7.5%)
- Department & other general merchandise stores (4.8%)
- Finance & insurance (4.2%)
- Religious, grantmaking, civic, professional, similar organizations (3.3%)
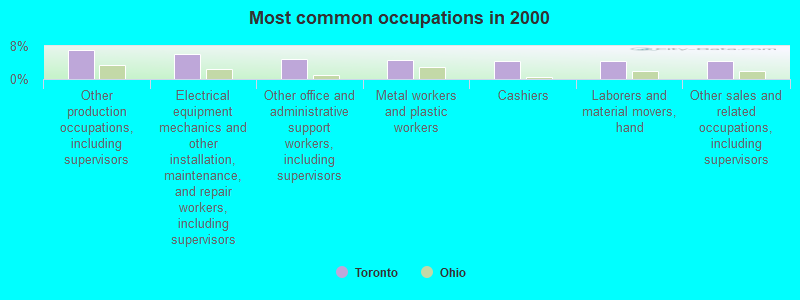
- Other production occupations, including supervisors (6.9%)
- Electrical equipment mechanics and other installation, maintenance, and repair workers, including supervisors (6.0%)
- Other office and administrative support workers, including supervisors (4.8%)
- Metal workers and plastic workers (4.6%)
- Cashiers (4.5%)
- Laborers and material movers, hand (4.5%)
- Other sales and related occupations, including supervisors (4.4%)
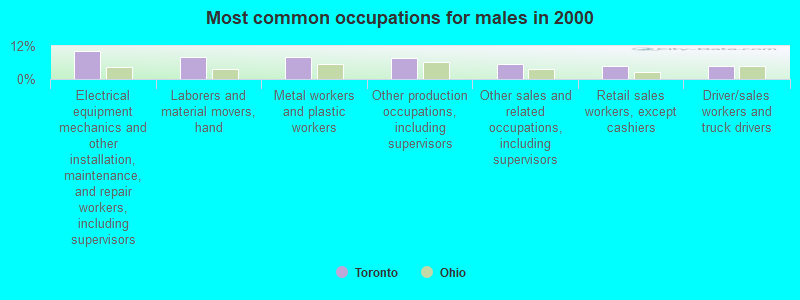
- Electrical equipment mechanics and other installation, maintenance, and repair workers, including supervisors (10.3%)
- Laborers and material movers, hand (7.9%)
- Metal workers and plastic workers (7.9%)
- Other production occupations, including supervisors (7.6%)
- Other sales and related occupations, including supervisors (5.5%)
- Retail sales workers, except cashiers (4.9%)
- Driver/sales workers and truck drivers (4.9%)
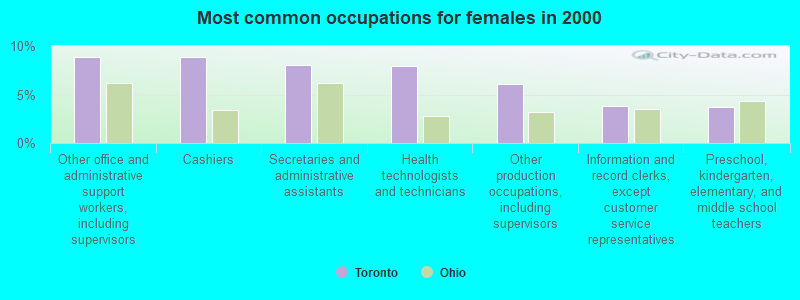
- Other office and administrative support workers, including supervisors (8.8%)
- Cashiers (8.8%)
- Secretaries and administrative assistants (8.1%)
- Health technologists and technicians (8.0%)
- Other production occupations, including supervisors (6.1%)
- Information and record clerks, except customer service representatives (3.8%)
- Preschool, kindergarten, elementary, and middle school teachers (3.8%)
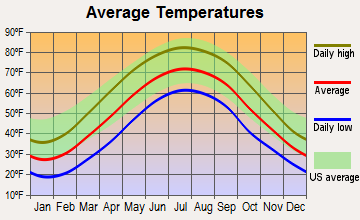
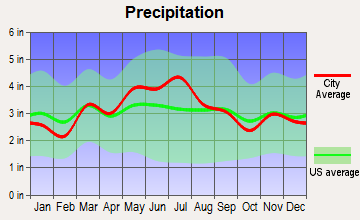
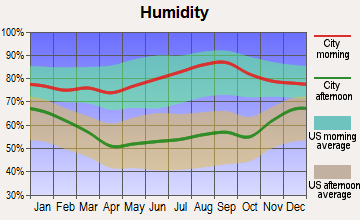
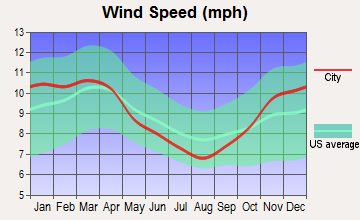
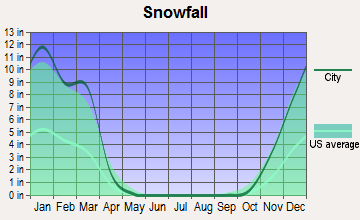
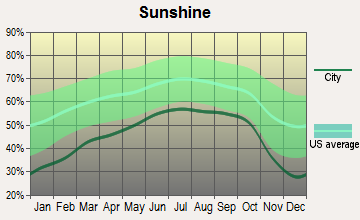
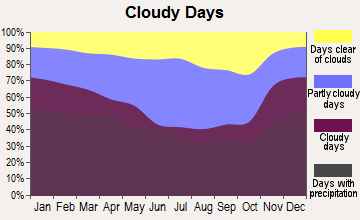
Average climate in Toronto, Ohio
Based on data reported by over 4,000 weather stations
|
|

(lower is better)
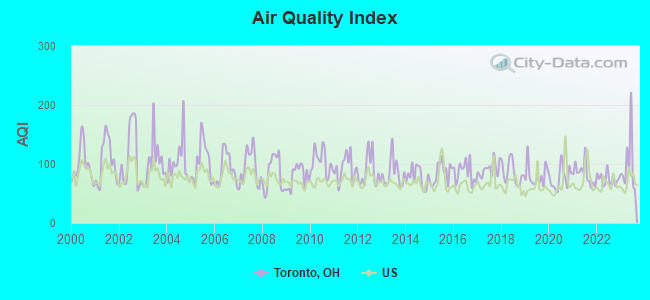
Air Quality Index (AQI) level in 2023 was 98.4. This is worse than average.
| City: | 98.4 |
| U.S.: | 72.6 |
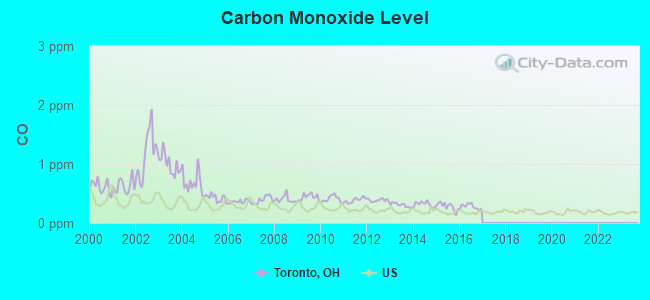
Carbon Monoxide (CO) [ppm] level in 2016 was 0.279. This is about average. Closest monitor was 2.5 miles away from the city center.
| City: | 0.279 |
| U.S.: | 0.251 |
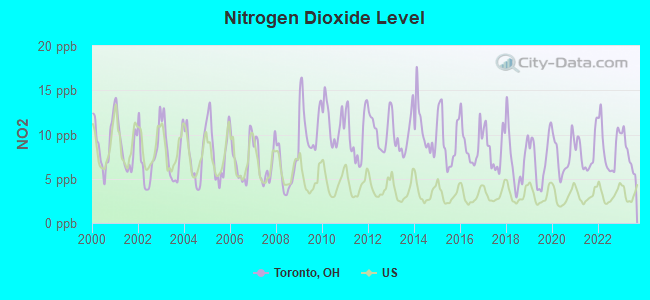
Nitrogen Dioxide (NO2) [ppb] level in 2023 was 7.85. This is significantly worse than average. Closest monitor was 0.2 miles away from the city center.
| City: | 7.85 |
| U.S.: | 5.11 |
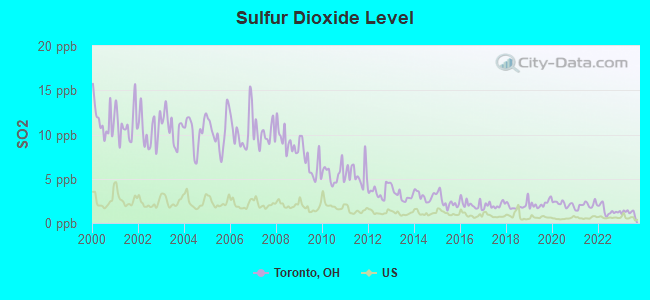
Sulfur Dioxide (SO2) [ppb] level in 2023 was 1.19. This is better than average. Closest monitor was 0.7 miles away from the city center.
| City: | 1.19 |
| U.S.: | 1.51 |
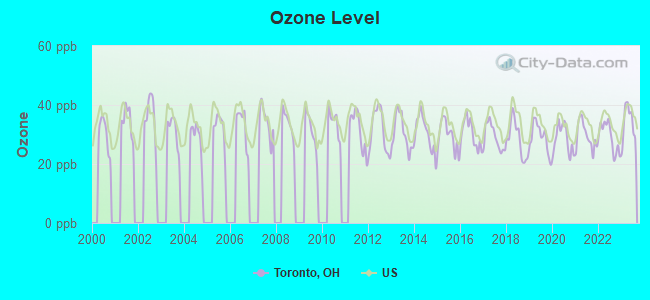
Ozone [ppb] level in 2023 was 34.0. This is about average. Closest monitor was 1.5 miles away from the city center.
| City: | 34.0 |
| U.S.: | 33.3 |
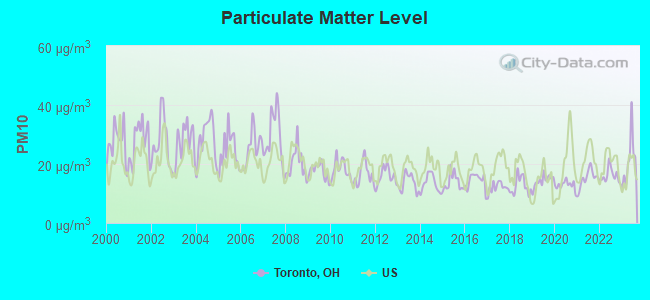
Particulate Matter (PM10) [µg/m3] level in 2023 was 21.3. This is about average. Closest monitor was 1.9 miles away from the city center.
| City: | 21.3 |
| U.S.: | 19.2 |
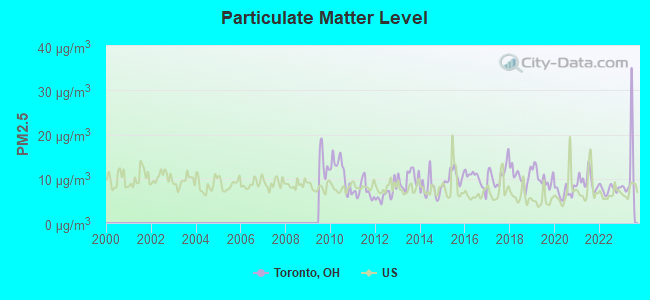
Particulate Matter (PM2.5) [µg/m3] level in 2023 was 12.1. This is significantly worse than average. Closest monitor was 2.5 miles away from the city center.
| City: | 12.1 |
| U.S.: | 8.1 |
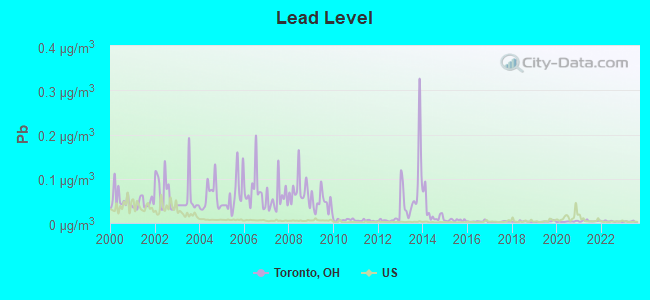
Lead (Pb) [µg/m3] level in 2022 was 0.00359. This is significantly better than average. Closest monitor was 1.5 miles away from the city center.
| City: | 0.00359 |
| U.S.: | 0.00931 |
Tornado activity:
Toronto-area historical tornado activity is slightly below Ohio state average. It is 14% smaller than the overall U.S. average.
On 5/31/1985, a category F5 (max. wind speeds 261-318 mph) tornado 55.3 miles away from the Toronto city center killed 18 people and injured 310 people and caused between $50,000,000 and $500,000,000 in damages.
On 5/31/1985, a category F3 (max. wind speeds 158-206 mph) tornado 25.7 miles away from the city center killed 9 people and injured 120 people and caused between $5,000,000 and $50,000,000 in damages.
Earthquake activity:
Toronto-area historical earthquake activity is significantly above Ohio state average. It is 51% smaller than the overall U.S. average.On 9/25/1998 at 19:52:52, a magnitude 5.2 (4.8 MB, 4.3 MS, 5.2 LG, 4.5 MW, Depth: 3.1 mi, Class: Moderate, Intensity: VI - VII) earthquake occurred 72.0 miles away from the city center
On 8/23/2011 at 17:51:04, a magnitude 5.8 (5.8 MW, Depth: 3.7 mi) earthquake occurred 227.2 miles away from Toronto center
On 1/31/1986 at 16:46:43, a magnitude 5.0 (5.0 MB) earthquake occurred 84.0 miles away from the city center
On 7/27/1980 at 18:52:21, a magnitude 5.2 (5.1 MB, 4.7 MS, 5.0 UK, 5.2 UK) earthquake occurred 237.2 miles away from Toronto center
On 12/31/2011 at 20:05:01, a magnitude 4.0 (4.0 ML, Depth: 3.1 mi, Class: Light, Intensity: IV - V) earthquake occurred 45.8 miles away from the city center
On 8/9/2020 at 12:07:37, a magnitude 5.1 (5.1 MW, Depth: 4.7 mi) earthquake occurred 277.0 miles away from the city center
Magnitude types: regional Lg-wave magnitude (LG), body-wave magnitude (MB), local magnitude (ML), surface-wave magnitude (MS), moment magnitude (MW)
Natural disasters:
The number of natural disasters in Jefferson County (20) is greater than the US average (15).Major Disasters (Presidential) Declared: 14
Emergencies Declared: 3
Causes of natural disasters: Floods: 14, Storms: 12, Tornadoes: 5, Landslides: 3, Mudslides: 3, Snowstorms: 2, Winds: 2, Blizzard: 1, Heavy Rain: 1, Hurricane: 1, Tropical Storm: 1, Winter Storm: 1, Other: 1 (Note: some incidents may be assigned to more than one category).

Hospitals and medical centers in Toronto:
Other hospitals and medical centers near Toronto:
- WEIRTON GERIATRIC CENTER (Nursing Home, about 5 miles away; WEIRTON, WV)
- NURSE CONSULTATION AND SERV AGCY HOSPICE (Hospital, about 5 miles away; WEIRTON, WV)
- INTREPID USA HEALTHCARE SERVICES (Home Health Center, about 5 miles away; WEIRTON, WV)
- PROFESSIONAL HOME HEALTH AND HOME CARE (Home Health Center, about 6 miles away; WEIRTON, WV)
- WEIRTON MEDICAL CENTER HOME HEALTH (Home Health Center, about 7 miles away; WEIRTON, WV)
- WEIRTON MEDICAL CENTER Acute Care Hospitals (about 7 miles away; WEIRTON, WV)
- DAVITA - PARIS DIALYSIS (Dialysis Facility, about 7 miles away; PARIS, PA)
Airports located in Toronto:
- Eddie Dew Memorial Airpark Airport (1G8) (Runways: 1, Itinerant Ops: 665, Local Ops: 2,850, Military Ops: 25)
Operable nuclear power plants near Toronto:
- 15 miles: Beaver Valley 1 and 2 in Shippingport, PA.
Colleges/universities with over 2000 students nearest to Toronto:
- Franciscan University of Steubenville (about 7 miles; Steubenville, OH; Full-time enrollment: 2,572)
- West Liberty University (about 21 miles; West Liberty, WV; FT enrollment: 2,728)
- Robert Morris University (about 22 miles; Moon Township, PA; FT enrollment: 4,823)
- Pittsburgh Technical Institute (about 22 miles; Oakdale, PA; FT enrollment: 2,805)
- Community College of Allegheny County (about 31 miles; Pittsburgh, PA; FT enrollment: 13,486)
- Point Park University (about 32 miles; Pittsburgh, PA; FT enrollment: 3,525)
- Duquesne University (about 33 miles; Pittsburgh, PA; FT enrollment: 8,211)
Public high school in Toronto:
Public elementary/middle school in Toronto:
- J T KARAFFA ELEMENTARY SCHOOL (Students: 233, Location: 1307 DENNIS WAY, Grades: PK-5)
User-submitted facts and corrections:
- about 8 miles from Toronto, OH - in Steubenville is the Franciscan University a college that attracts from every state and country. Mel Gibson's daughter attends there. It is a Catholic college.
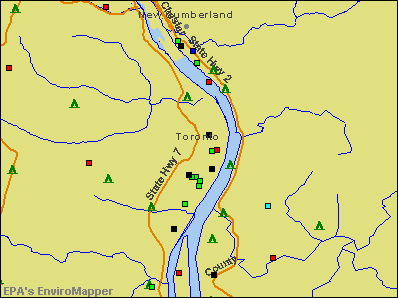
Points of interest:
Notable locations in Toronto: Tems Joint Ambulance District (A), Toronto Branch Library (B), Toronto Fire Department (C). Display/hide their locations on the map
Churches in Toronto include: First Presbyterian Church of Toronto (A), First United Methodist Church of Toronto (B), North River Avenue Church of Christ (C), Riverview United Methodist Church of Toronto (D), First Assembly of God Church (E), First Baptist Church (F), Saint Francis Church (G), Saint Josephs Byzantine Catholic Church (H), Toronto First Church of the Nazarene (I). Display/hide their locations on the map
Streams, rivers, and creeks: Jeddo Run (A). Display/hide its location on the map
Park in Toronto: Memorial Park (1). Display/hide its location on the map
Birthplace of: Bill Peterson - College football coach, Robert Urich - Actor, Clarke Hinkle - Football player, John Comer (American football) - Football player.
| This city: | 2.2 people |
| Ohio: | 2.4 people |
| This city: | 61.2% |
| Whole state: | 65.0% |
| This city: | 6.7% |
| Whole state: | 6.8% |
Likely homosexual households (counted as self-reported same-sex unmarried-partner households)
- Lesbian couples: 0.4% of all households
- Gay men: 0.1% of all households
Banks with branches in Toronto (2011 data):
- The Huntington National Bank: Toronto Branch at 301 S Fourth Street, branch established on 1945/02/28; Toronto Drive-Up at Fourth And Daniels Streets, branch established on 1988/09/28. Info updated 2012/04/02: Bank assets: $54,183.4 mil, Deposits: $44,300.3 mil, headquarters in Columbus, OH, positive income, Commercial Lending Specialization, 878 total offices, Holding Company: Huntington Bancshares Incorporated
- PNC Bank, National Association: Toronto Branch at 120 North Fourth Street, branch established on 1987/05/20. Info updated 2012/03/20: Bank assets: $263,309.6 mil, Deposits: $197,343.0 mil, headquarters in Wilmington, DE, positive income, Commercial Lending Specialization, 3085 total offices, Holding Company: Pnc Financial Services Group, Inc., The
- U.S. Bank National Association: Toronto Branch at 217 North Third Street, branch established on 1979/10/01. Info updated 2012/01/30: Bank assets: $330,470.8 mil, Deposits: $236,091.5 mil, headquarters in Cincinnati, OH, positive income, 3121 total offices, Holding Company: U.S. Bancorp
For population 15 years and over in Toronto:
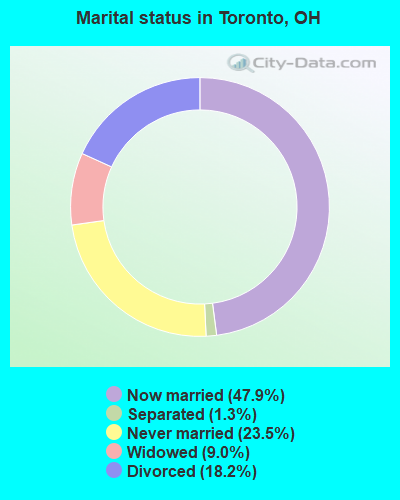
- Never married: 23.5%
- Now married: 47.9%
- Separated: 1.3%
- Widowed: 9.0%
- Divorced: 18.2%
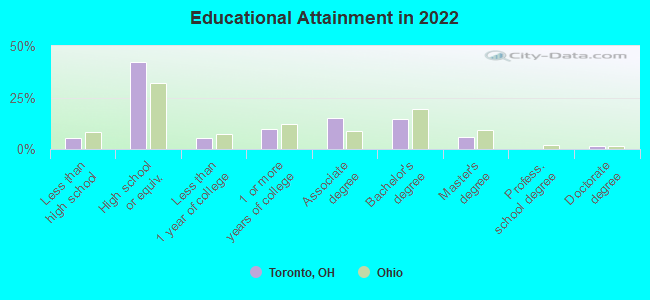
For population 25 years and over in Toronto:
- High school or higher: 94.5%
- Bachelor's degree or higher: 21.3%
- Graduate or professional degree: 7.2%
- Unemployed: 8.4%
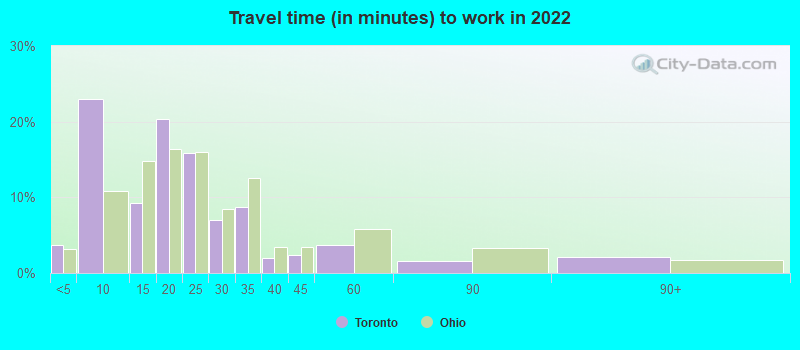
- Mean travel time to work (commute): 17.2 minutes
| Here: | 9.5 |
| Ohio average: | 11.0 |
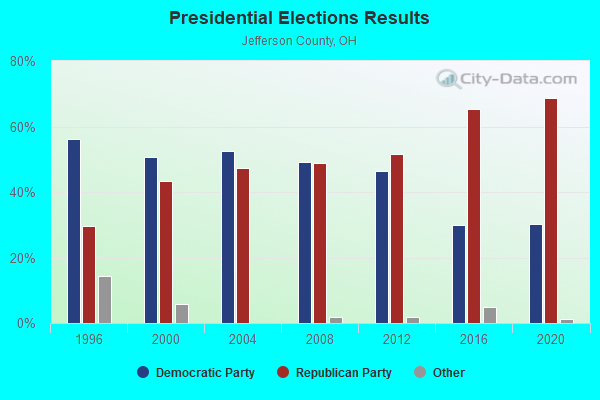
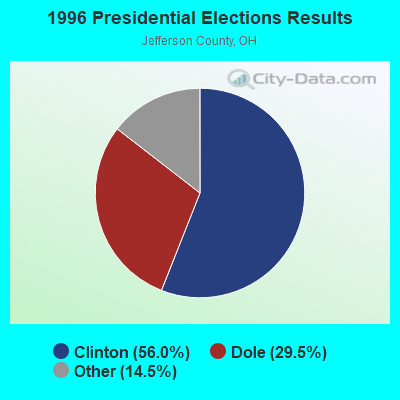
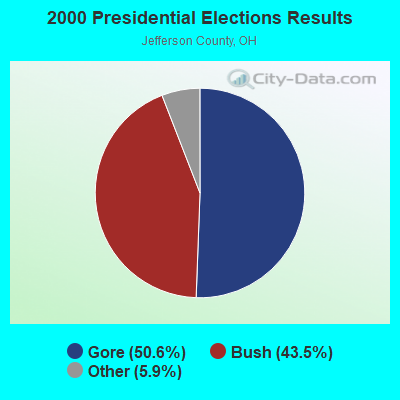
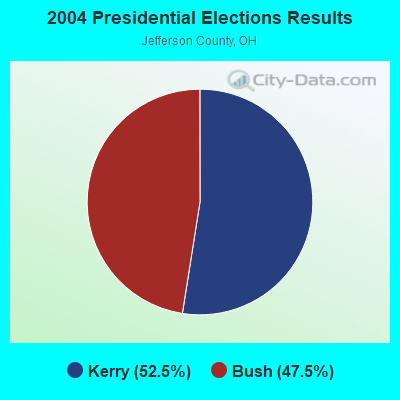
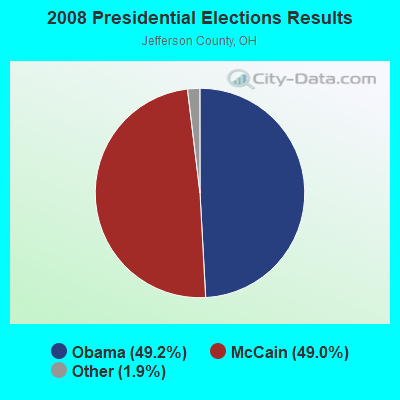
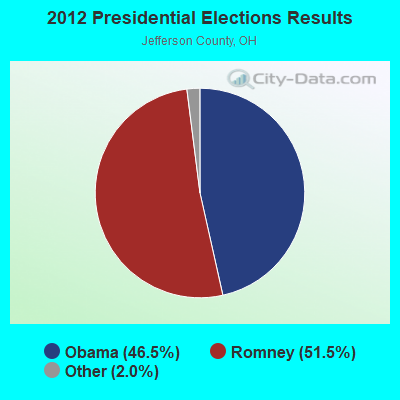
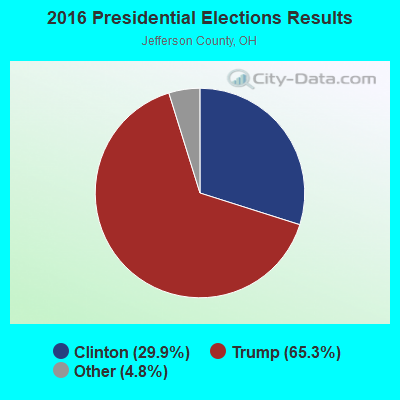
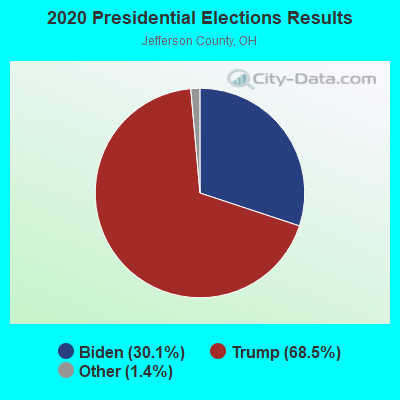
Graphs represent county-level data. Detailed 2008 Election Results
Religion statistics for Toronto, OH (based on Jefferson County data)
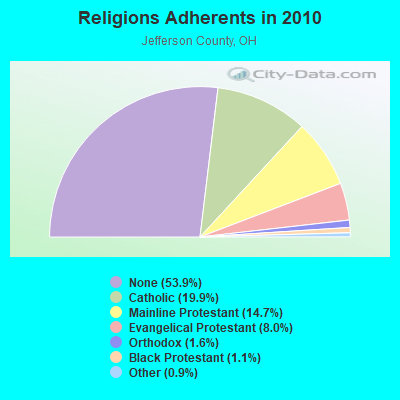
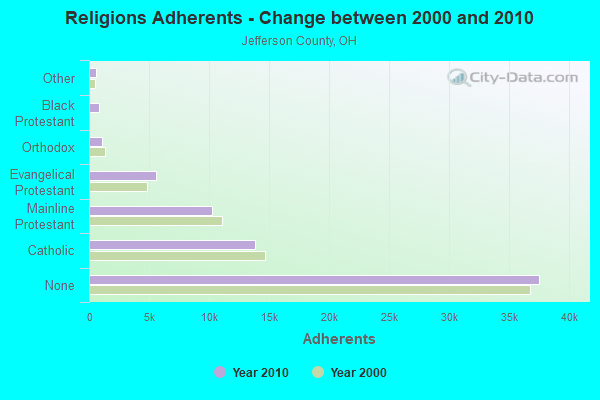
| Religion | Adherents | Congregations |
|---|---|---|
| Catholic | 13,851 | 16 |
| Mainline Protestant | 10,273 | 71 |
| Evangelical Protestant | 5,548 | 49 |
| Orthodox | 1,089 | 5 |
| Black Protestant | 796 | 7 |
| Other | 612 | 5 |
| None | 37,540 | - |
Food Environment Statistics:
| This county: | 3.05 / 10,000 pop. |
| State: | 1.89 / 10,000 pop. |
| Jefferson County: | 0.15 / 10,000 pop. |
| Ohio: | 0.13 / 10,000 pop. |
| Jefferson County: | 1.89 / 10,000 pop. |
| Ohio: | 1.25 / 10,000 pop. |
| Jefferson County: | 3.49 / 10,000 pop. |
| Ohio: | 2.93 / 10,000 pop. |
| Jefferson County: | 7.85 / 10,000 pop. |
| Ohio: | 6.25 / 10,000 pop. |
| This county: | 12.4% |
| Ohio: | 10.3% |
| Jefferson County: | 30.8% |
| Ohio: | 29.1% |
| Here: | 10.4% |
| Ohio: | 11.9% |
Health and Nutrition:
| Toronto: | 50.3% |
| State: | 50.4% |
| This city: | 46.4% |
| Ohio: | 47.8% |
| Toronto: | 28.8 |
| State: | 28.7 |
| Toronto: | 23.6% |
| Ohio: | 20.6% |
| Toronto: | 5.8% |
| Ohio: | 10.4% |
| Toronto: | 6.8 |
| Ohio: | 6.8 |
| This city: | 33.2% |
| State: | 34.3% |
| This city: | 57.5% |
| Ohio: | 57.0% |
| Here: | 75.7% |
| Ohio: | 79.1% |
More about Health and Nutrition of Toronto, OH Residents
| Local government employment and payroll (March 2022) | |||||
| Function | Full-time employees | Monthly full-time payroll | Average yearly full-time wage | Part-time employees | Monthly part-time payroll |
|---|---|---|---|---|---|
| Sewerage | 5 | $26,994 | $64,786 | 0 | $0 |
| Streets and Highways | 3 | $1,906 | $7,624 | 7 | $928 |
| Other Government Administration | 1 | $6,041 | $72,492 | 15 | $11,652 |
| Police Protection - Officers | 0 | $0 | 13 | $14,120 | |
| Solid Waste Management | 0 | $0 | 4 | $2,678 | |
| Other and Unallocable | 0 | $0 | 1 | $620 | |
| Financial Administration | 0 | $0 | 4 | $12,593 | |
| Judicial and Legal | 0 | $0 | 2 | $3,000 | |
| Parks and Recreation | 0 | $0 | 3 | $241 | |
| Firefighters | 0 | $0 | 6 | $5,560 | |
| Water Supply | 0 | $0 | 8 | $6,526 | |
| Totals for Government | 9 | $34,940 | $46,587 | 63 | $57,918 |
Toronto government finances - Expenditure in 2021 (per resident):
- Construction - Electric Utilities: $624,000 ($119.24)
Central Staff Services: $171,000 ($32.68)
Police Protection: $171,000 ($32.68)
Sewerage: $38,000 ($7.26)
Financial Administration: $18,000 ($3.44)
- Current Operations - Electric Utilities: $17,376,000 ($3320.47)
Water Utilities: $1,798,000 ($343.59)
Police Protection: $1,731,000 ($330.79)
Sewerage: $1,551,000 ($296.39)
Central Staff Services: $785,000 ($150.01)
Financial Administration: $561,000 ($107.20)
Regular Highways: $185,000 ($35.35)
Parks and Recreation: $132,000 ($25.22)
Judicial and Legal Services: $132,000 ($25.22)
General Public Buildings: $91,000 ($17.39)
- Electric Utilities - Interest on Debt: $408,000 ($77.97)
- General - Interest on Debt: $143,000 ($27.33)
- Intergovernmental to Local - Other - Judicial and Legal Services: $77,000 ($14.71)
Other - Health - Other: $4,000 ($0.76)
- Other Capital Outlay - Electric Utilities: $26,000 ($4.97)
- Total Salaries and Wages: $3,059,000 ($584.56)
- Water Utilities - Interest on Debt: $204,000 ($38.98)
Toronto government finances - Revenue in 2021 (per resident):
- Charges - Sewerage: $1,835,000 ($350.66)
Other: $43,000 ($8.22)
- Local Intergovernmental - General Local Government Support: $203,000 ($38.79)
- Miscellaneous - Fines and Forfeits: $1,256,000 ($240.02)
Interest Earnings: $242,000 ($46.24)
Donations From Private Sources: $68,000 ($12.99)
Rents: $23,000 ($4.40)
- Revenue - Electric Utilities: $20,099,000 ($3840.82)
Water Utilities: $1,902,000 ($363.46)
- State Intergovernmental - Highways: $366,000 ($69.94)
- Tax - Individual Income: $1,702,000 ($325.24)
Public Utilities Sales: $697,000 ($133.19)
Corporation Net Income: $438,000 ($83.70)
Property: $235,000 ($44.91)
Motor Vehicle License: $102,000 ($19.49)
Alcoholic Beverage License: $4,000 ($0.76)
Other License: $4,000 ($0.76)
Toronto government finances - Debt in 2021 (per resident):
- Long Term Debt - Beginning Outstanding - Unspecified Public Purpose: $26,566,000 ($5076.63)
Outstanding Unspecified Public Purpose: $24,870,000 ($4752.53)
Retired Unspecified Public Purpose: $1,696,000 ($324.10)
Toronto government finances - Cash and Securities in 2021 (per resident):
- Other Funds - Cash and Securities: $20,134,000 ($3847.51)
| Businesses in Toronto, OH | ||||
| Name | Count | Name | Count | |
|---|---|---|---|---|
| Domino's Pizza | 1 | McDonald's | 1 | |
| FedEx | 1 | Rite Aid | 1 | |
| H&R Block | 1 | Subway | 1 | |
Strongest AM radio stations in Toronto:
- WEIR (1430 AM; 1 kW; WEIRTON, WV)
- WDIG (950 AM; 1 kW; STEUBENVILLE, OH; Owner: WORLD WITNESS FOR CHRIST MINIST.,INC)
- WWVA (1170 AM; 53 kW; WHEELING, WV; Owner: CAPSTAR TX LIMITED PARTNERSHIP)
- KDKA (1020 AM; 50 kW; PITTSBURGH, PA; Owner: INFINITY BROADCASTING OPERATIONS, INC.)
- WWCS (540 AM; 5 kW; CANONSBURG, PA; Owner: BIRACH BROADCASTING CORPORATION)
- WSTV (1340 AM; 1 kW; STEUBENVILLE, OH; Owner: KEYMARKET LICENSES, LLC)
- WKNR (850 AM; 50 kW; CLEVELAND, OH; Owner: CARON BROADCASTING, INC.)
- WTAM (1100 AM; 50 kW; CLEVELAND, OH; Owner: JACOR BROADCASTING CORPORATION)
- WPIT (730 AM; 5 kW; PITTSBURGH, PA; Owner: PENNSYLVANIA MEDIA ASSOCIATES, INC.)
- WHK (1220 AM; 50 kW; CLEVELAND, OH; Owner: CARON BROADCASTING, INC.)
- WKBN (570 AM; 5 kW; YOUNGSTOWN, OH; Owner: CITICASTERS LICENSES, L.P.)
- WBGG (970 AM; 5 kW; PITTSBURGH, PA; Owner: AMFM RADIO LICENSES, L.L.C.)
- WOHI (1490 AM; 1 kW; EAST LIVERPOOL, OH; Owner: KEYMARKET LICENSES, LLC)
Strongest FM radio stations in Toronto:
- WOGH (103.5 FM; BURGETTSTOWN, PA; Owner: KEYMARKET LICENSES, LLC)
- W215BC (90.9 FM; STEUBENVILLE, OH; Owner: PENSACOLA CHRISTIAN COLLEGE, INC.)
- WOGF (104.3 FM; EAST LIVERPOOL, OH; Owner: KEYMARKET LICENSES, LLC)
- WBJV (88.9 FM; STEUBENVILLE, OH; Owner: AMERICAN FAMILY ASSOCIATION)
- WVNP (89.9 FM; WHEELING, WV; Owner: WEST VIRGINIA EDUCATIONAL BROADCASTING AUTHORITY)
- WOVK (98.7 FM; WHEELING, WV; Owner: CAPSTAR TX LIMITED PARTNERSHIP)
- WEGW (107.5 FM; WHEELING, WV; Owner: CAPSTAR TX LIMITED PARTNERSHIP)
- WMXY (98.9 FM; YOUNGSTOWN, OH; Owner: CITICASTERS LICENSES, L.P.)
- WSHH (99.7 FM; PITTSBURGH, PA; Owner: RENDA B/CING CORP. OF NEVADA)
- WVBC (88.1 FM; BETHANY, WV; Owner: BETHANY COLLEGE)
- WLTJ (92.9 FM; PITTSBURGH, PA; Owner: WPNT, INC.)
- WQXK (105.1 FM; SALEM, OH; Owner: CUMULUS LICENSING CORP.)
- WDVE (102.5 FM; PITTSBURGH, PA; Owner: CAPSTAR TX LIMITED PARTNERSHIP)
- WJJJ (104.7 FM; PITTSBURGH, PA; Owner: CAPSTAR TX LIMITED PARTNERSHIP)
- WWSW-FM (94.5 FM; PITTSBURGH, PA; Owner: AMFM RADIO LICENSES, L.L.C.)
- WDSY-FM (107.9 FM; PITTSBURGH, PA; Owner: INFINITY RADIO SUBSIDIARY OPERATIONS INC.)
- WAMO-FM (106.7 FM; BEAVER FALLS, PA; Owner: MCL/MCM-INC)
- WCDK (106.3 FM; CADIZ, OH; Owner: PRIORITY COMMUNICATIONS OHIO, LLC)
- WEEL (95.7 FM; SHADYSIDE, OH; Owner: OHIO VALLEY COMMUNICATIONS, INC.)
- WZPT (100.7 FM; NEW KENSINGTON, PA; Owner: INFINITY RADIO SUBSIDIARY OPERATIONS INC.)
TV broadcast stations around Toronto:
- W25CI (Channel 25; STEUBENVILLE, OH; Owner: ABACUS TELEVISION)
- W57BH (Channel 57; WEIRTON, WV; Owner: TURNPIKE TELEVISION)
- WTOV-TV (Channel 9; STEUBENVILLE, OH; Owner: WTOV-TV HOLDINGS, INC.)
- WPXI (Channel 11; PITTSBURGH, PA; Owner: WPXI-TV HOLDINGS, INC.)
- WTRF-TV (Channel 7; WHEELING, WV; Owner: WEST VIRGINIA MEDIA HOLDINGS, LLC)
- WKBN-TV (Channel 27; YOUNGSTOWN, OH; Owner: PIEDMONT TELEVISION OF YOUNGSTOWN LICENSE LLC)
- KDKA-TV (Channel 2; PITTSBURGH, PA; Owner: CBS BROADCASTING INC.)
- WBGN-LP (Channel 59; PITTSBURGH, PA; Owner: BRUNO GOODWORTH NETWORK, INC.)
- WPTG-LP (Channel 69; PITTSBURGH, PA; Owner: ABACUS TELEVISION)
- W66BQ (Channel 66; BEAVER, PA; Owner: BRUNO-GOODWORTH NETWORK, INC.)
- WOUC-TV (Channel 44; CAMBRIDGE, OH; Owner: OHIO UNIVERSITY)
- WQEX (Channel 16; PITTSBURGH, PA; Owner: WQED MULTIMEDIA)
- WPGH-TV (Channel 53; PITTSBURGH, PA; Owner: WPGH LICENSEE, LLC)
- W65CG (Channel 65; PITTSBURGH, PA; Owner: TRINITY BROADCASTING NETWORK)
- WFMJ-TV (Channel 21; YOUNGSTOWN, OH; Owner: WFMJ TELEVISION, INC.)
- WTAE-TV (Channel 4; PITTSBURGH, PA; Owner: WTAE HEARST-ARGYLE TV, INC. (CA CORP.))
- WDLI (Channel 17; CANTON, OH; Owner: TRINITY BROADCASTING NETWORK, INC.)
- WNEO (Channel 45; ALLIANCE, OH; Owner: NORTHEASTERN EDUCATIONAL TELEVISION OF OHIO, INC.)
- WBPA-LP (Channel 29; PITTSBURGH, PA; Owner: VENTURE TECHNOLOGIES GROUP, LLC)
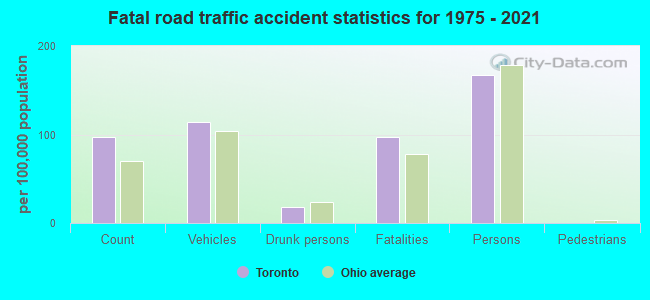
Toronto fatal accident list:
Jun 8, 1998 00:59 AM, Jeddo Ro, Vehicles: 1, Persons: 2, Fatalities: 1, Drunk persons involved: 1
Aug 6, 1993 09:37 PM, Clarkst, Vehicles: 2, Persons: 3, Fatalities: 1
Nov 4, 1989 08:53 PM, Euclidaven, Vehicles: 1, Persons: 1, Fatalities: 1
Dec 14, 1980 10:15 PM, Vehicles: 1, Persons: 1, Fatalities: 1
Nov 18, 1977 07:00 PM, Vehicles: 1, Persons: 1, Fatalities: 1
- National Bridge Inventory (NBI) Statistics
- 20Number of bridges
- 197ft / 59.9mTotal length
- $600,000Total costs
- 83,235Total average daily traffic
- 8,216Total average daily truck traffic
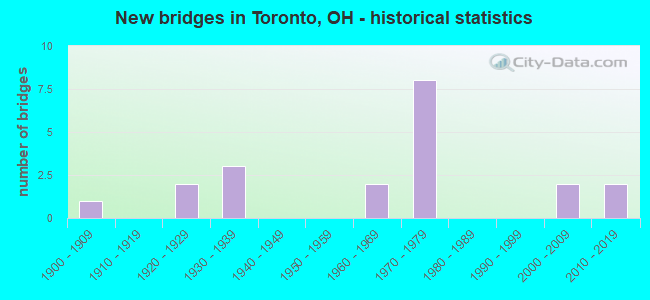
- New bridges - historical statistics
- 11900-1909
- 21920-1929
- 31930-1939
- 21960-1969
- 81970-1979
- 22000-2009
- 22010-2019
FCC Registered Cell Phone Towers:
2 (See the full list of FCC Registered Cell Phone Towers in Toronto)FCC Registered Antenna Towers:
29 (See the full list of FCC Registered Antenna Towers)FCC Registered Broadcast Land Mobile Towers:
7- Toronto Out Post Sedge Toronto Empire Exit Sr 7 Old Sr7 (Lat: 40.459778 Lon: -80.619250), Structure height: 30 m, Call Sign: KFA294, Licensee ID: L00007339,
Assigned Frequencies: 47.0200 MHz, 47.2200 MHz, 47.3400 MHz, Grant Date: 01/25/2014, Expiration Date: 04/21/2024, Cancellation Date: 02/13/2015, Registrant: State Of Ohio, 1980 W Broad St, Columbus, OH 43223, Phone: (614) 752-0404
- MOBILES L3, Lat: 40.485444 Lon: -80.608111, Call Sign: KFG223,
Assigned Frequencies: 160.860 MHz, 160.770 MHz, Grant Date: 01/11/2022, Expiration Date: 12/20/2031, Certifier: Jerry R Celio, Registrant: Norfolk Southern Railway Company, 650 West Peachtree St, Nw, Box 41, Atlanta, GA 30308, Phone: (404) 660-4050, Fax: (404) 582-6209, Email:
- Lat: 40.451722 Lon: -80.431444, Call Sign: WPTW962,
Assigned Frequencies: 452.187 MHz, 457.187 MHz, Grant Date: 12/09/2021, Expiration Date: 01/04/2032, Certifier: George Fisher, Registrant: Business Radio Licensing, 30251 Golden Lantern, Suite E # 501, Laguna Niguel, CA 92677, Phone: (949) 348-8510, Fax: (949) 348-8514, Email:
- MOBILES, Lat: 40.480278 Lon: -80.606111, Call Sign: WQTH640, Licensee ID: L00008014,
Assigned Frequencies: 161.535 MHz, Grant Date: 11/20/2023, Expiration Date: 02/04/2034, Certifier: Jerry R Celio/Pc, Registrant: Norfolk Southern Railway Company, 650 West Peachtree St, Nw, Box 41, Atlanta, GA 30308, Phone: (404) 660-4050, Email:
- Lat: 40.447222 Lon: -80.610917, Call Sign: WQVW701,
Assigned Frequencies: 464.087 MHz, 469.087 MHz, 464.237 MHz, 464.337 MHz, 463.275 MHz, Grant Date: 06/01/2015, Expiration Date: 06/01/2025, Certifier: Brian Cunningham, Registrant: Business Radio Licensing, 30251 Golden Lantern, Suite E, Laguna Niguel, CA 92677, Phone: (949) 348-8510, Fax: (949) 348-8514, Email:
- KNOX STANDPIPE, Near I-152 (Lat: 40.491333 Lon: -80.673889), Type: Tank, Structure height: 18.3 m, Overall height: 21.3 m, Call Sign: WQZE311,
Assigned Frequencies: 217.668 MHz, Grant Date: 04/20/2017, Expiration Date: 04/20/2027, Certifier: Kathy Teramana, Registrant: J & K Communications, Inc., 222 South Towerview Drive, Columbia City, IN 46725, Phone: (260) 244-7975, Fax: (260) 244-3253, Email:
- NEW SOMERSET VAULT, Near 12019 Sr 213 (Lat: 40.518361 Lon: -80.708361), Type: Pole, Structure height: 9.1 m, Call Sign: WQZE314,
Assigned Frequencies: 219.150 MHz, Grant Date: 04/20/2017, Expiration Date: 04/20/2027, Certifier: Kathy Teramana, Registrant: J & K Communications, Inc., 222 South Towerview Drive, Columbia City, IN 46725, Phone: (260) 244-7975, Fax: (260) 244-3253, Email:
FCC Registered Microwave Towers:
7- SUGAR GROVE, 2200' S Of Srs 7 & 152 (Lat: 40.502056 Lon: -80.623972), Type: Tower, Structure height: 74.7 m, Overall height: 80.5 m, Call Sign: WPNN208,
Assigned Frequencies: 6004.50 MHz, Grant Date: 05/28/2008, Expiration Date: 05/12/2018, Cancellation Date: 02/19/2014, Certifier: John T Scott Iii, Registrant: Verizon Wireless, 1120 Sanctuary Pkwy, #150 Gasa5reg, Alpharetta, GA 30009-7630, Phone: (770) 797-1070, Fax: (770) 797-1036, Email:
- SUGAR GROVE, 2200' S Of Srs 7 & 152 (Lat: 40.502056 Lon: -80.623972), Type: Tower, Structure height: 74.7 m, Overall height: 80.5 m, Call Sign: WPOR696,
Assigned Frequencies: 6093.45 MHz, Grant Date: 01/23/2008, Expiration Date: 02/01/2018, Cancellation Date: 02/19/2014, Certifier: Glenn S Rabin, Registrant: Verizon Wireless, 1120 Sanctuary Pkwy, #150 Gasa5reg, Alpharetta, GA 30009-7630, Phone: (770) 797-1070, Fax: (770) 797-1036, Email:
- STATION, 3l251 Edison Rd Rt 1 (Lat: 40.528667 Lon: -80.644222), Type: Tower, Structure height: 96.4 m, Call Sign: WQLS552, Licensee ID: L00288741,
Assigned Frequencies: 6152.75 MHz, 6034.15 MHz, Grant Date: 04/15/2010, Expiration Date: 10/12/2010, Cancellation Date: 12/25/2010, Certifier: Rodney D Kaufman, Registrant: Felhc, Inc., 76 South Main Street, Akron, OH 44308, Phone: (330) 436-2226, Fax: (330) 761-7203, Email:
- OH081B001, 11330 State Route 213 / Us-Oh-5201 (Lat: 40.512806 Lon: -80.700056), Type: Ltower, Structure height: 76.2 m, Overall height: 79.2 m, Call Sign: WREZ339,
Assigned Frequencies: 11405.0 MHz, 11405.0 MHz, 11645.0 MHz, 11645.0 MHz, 11405.0 MHz, 11405.0 MHz, 11645.0 MHz, 11645.0 MHz, 11405.0 MHz, 11405.0 MHz... (+34 more), Grant Date: 01/08/2020, Expiration Date: 01/08/2030, Certifier: Rob Contrael, Registrant: Agile Network Builders LLC, 213 Market Ave N, Suite 310, Canton, OH 44702, Phone: (888) 494-0549, Fax: (330) 451-5720, Email:
- STRATTON TWR, 3l251 Edison Rd Rt 1 (Lat: 40.528611 Lon: -80.644167), Type: Gtower, Structure height: 96.4 m, Call Sign: WRNV787, Licensee ID: L01600450,
Assigned Frequencies: 11015.0 MHz, 11015.0 MHz, 11015.0 MHz, 11015.0 MHz, 11015.0 MHz, 11015.0 MHz, 11015.0 MHz, 11015.0 MHz, 11055.0 MHz, 11095.0 MHz... (+22 more), Grant Date: 08/31/2021, Expiration Date: 08/31/2031, Certifier: Jeremy Ober, Registrant: Hancock County, 102 N Court St, New Cumberland, WV 26047, Phone: (304) 564-4040, Email:
- OH081B006, 2200' S Of Srs 7 & 152 (Sugar Grove - 100050810) (Lat: 40.501944 Lon: -80.623889), Type: Ltower, Structure height: 74.7 m, Overall height: 80.5 m, Call Sign: WRXF791,
Assigned Frequencies: 17980.0 MHz, 17980.0 MHz, 17980.0 MHz, 17980.0 MHz, 17980.0 MHz, 17980.0 MHz, 17980.0 MHz, 17980.0 MHz, 17980.0 MHz, 17980.0 MHz... (+62 more), Grant Date: 05/08/2023, Expiration Date: 05/08/2033, Certifier: Rob Contrael, Registrant: Agile Network Builders LLC, 213 Market Ave N, Suite 310, Canton, OH 44702, Phone: (888) 494-0549, Fax: (330) 451-5720, Email:
- SAMMIS, 3l251 Edison Rd Rt 1 (Lat: 40.528667 Lon: -80.644222), Type: Gtower, Structure height: 96.4 m, Call Sign: WAV692,
Assigned Frequencies: 6735.00 MHz, 6152.75 MHz, 6034.15 MHz, 6123.10 MHz, Grant Date: 02/26/2019, Expiration Date: 03/02/2029, Certifier: Steven F Lux, Registrant: Felhc. Inc, 341 White Pond Dr., Akron, OH 44320, Phone: (330) 436-2208, Fax: (330) 761-7203, Email:
FCC Registered Amateur Radio Licenses:
64 (See the full list of FCC Registered Amateur Radio Licenses in Toronto)FAA Registered Aircraft:
6- Aircraft: PIPER PA-28R-200 (Category: Land, Seats: 4, Weight: Up to 12,499 Pounds, Speed: 107 mph), Engine: LYCOMING I0360 SER (180 HP) (Reciprocating)
N-Number: 1411T, N1411T, N-1411T, Serial Number: 28R-7235282, Year manufactured: 1972, Certificate Issue Date: 10/02/2008
Registrant (Co-Owned): Marsha A Cable, 945 Township Hwy 285a, Toronto, OH 43964, Other Owners: William B Cable - Aircraft: PIPER PA-28-180 (Category: Land, Seats: 4, Weight: Up to 12,499 Pounds, Speed: 107 mph), Engine: LYCOMING O&VO-360 SER (180 HP) (Reciprocating)
N-Number: 180LR, N180LR, N-180LR, Serial Number: 28-872, Year manufactured: 1962, Airworthiness Date: 11/07/1962, Certificate Issue Date: 04/17/2018
Registrant (Individual): Edward D Porter, 2853 Township Road 249, Toronto, OH 43964 - Aircraft: PIPER PA-24 (Category: Land, Seats: 4, Weight: Up to 12,499 Pounds, Speed: 120 mph), Engine: LYCOMING O&VO-360 SER (180 HP) (Reciprocating)
N-Number: 6821P, N6821P, N-6821P, Serial Number: 24-1954, Year manufactured: 1960, Airworthiness Date: 03/17/1960, Certificate Issue Date: 10/31/2017
Registrant (Individual): John M Lewis, 629 Henry St, Toronto, OH 43964 - Aircraft: HAUPT CHARLES FOXTROT (Category: Land, Seats: 4, Weight: Up to 12,499 Pounds), Engine: LYCOMING IO-540 SER (300 HP) (Reciprocating)
N-Number: 747F, N747F, N-747F, Serial Number: F001, Year manufactured: 2001, Airworthiness Date: 09/21/2001, Certificate Issue Date: 05/17/2012
Registrant (Co-Owned): James P Foglio, 613 N River Ave, Toronto, OH 43964, Other Owners: Dorothy A Foglio - Aircraft: STINSON 108-2 (Category: Land, Seats: 4, Weight: Up to 12,499 Pounds, Speed: 90 mph), Engine: FRANKLIN 6A4165 SERIES (165 HP) (Reciprocating)
N-Number: 9725K, N9725K, N-9725K, Serial Number: 108-2725, Year manufactured: 1947, Airworthiness Date: 08/29/1955, Certificate Issue Date: 08/15/2017
Registrant (Individual): Francis J Grygo, 709 E Fernwood Dr, Toronto, OH 43964 - Aircraft: ERCOUPE 415-C (Category: Land, Seats: 2, Weight: Up to 12,499 Pounds, Speed: 90 mph), Engine: CONT MOTOR A&C65 SERIES (65 HP) (Reciprocating)
N-Number: 37120, N37120, N-37120, Serial Number: 87, Year manufactured: 1941
Registrant (Individual): Walter B Wheeler, 406 N 4th St, Toronto, OH 43964
Deregistered: Cancel Date: 11/18/2017
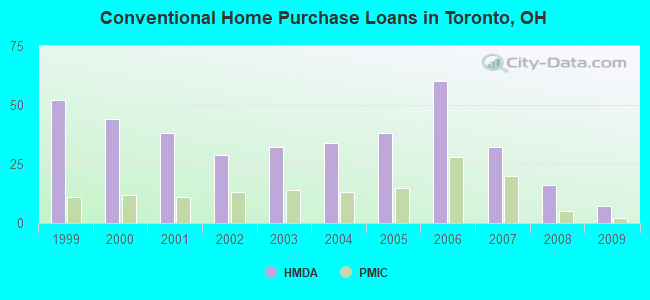
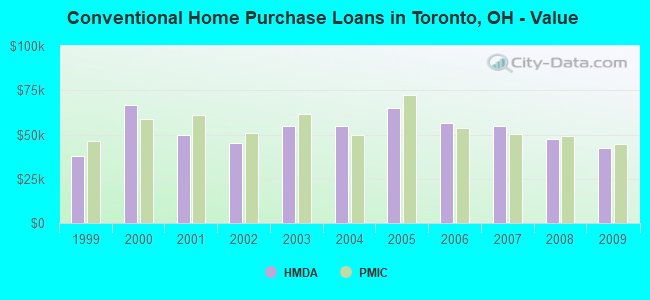
| Home Mortgage Disclosure Act Aggregated Statistics For Year 2009 (Based on 1 full and 1 partial tracts) | ||||||||||||||
| A) FHA, FSA/RHS & VA Home Purchase Loans | B) Conventional Home Purchase Loans | C) Refinancings | D) Home Improvement Loans | E) Loans on Dwellings For 5+ Families | F) Non-occupant Loans on < 5 Family Dwellings (A B C & D) | G) Loans On Manufactured Home Dwelling (A B C & D) | ||||||||
|---|---|---|---|---|---|---|---|---|---|---|---|---|---|---|
| Number | Average Value | Number | Average Value | Number | Average Value | Number | Average Value | Number | Average Value | Number | Average Value | Number | Average Value | |
| LOANS ORIGINATED | 11 | $58,306 | 7 | $42,149 | 33 | $75,937 | 6 | $26,690 | 0 | $0 | 1 | $20,970 | 0 | $0 |
| APPLICATIONS APPROVED, NOT ACCEPTED | 1 | $23,490 | 0 | $0 | 3 | $50,377 | 1 | $47,240 | 1 | $334,630 | 0 | $0 | 0 | $0 |
| APPLICATIONS DENIED | 4 | $45,812 | 2 | $83,040 | 29 | $56,710 | 11 | $21,477 | 0 | $0 | 2 | $45,765 | 1 | $130,010 |
| APPLICATIONS WITHDRAWN | 0 | $0 | 1 | $15,750 | 2 | $81,675 | 0 | $0 | 0 | $0 | 0 | $0 | 0 | $0 |
| FILES CLOSED FOR INCOMPLETENESS | 0 | $0 | 1 | $68,890 | 3 | $58,717 | 1 | $65,430 | 0 | $0 | 2 | $48,705 | 0 | $0 |
Detailed HMDA statistics for the following Tracts: 0112.00 , 0113.00
| Private Mortgage Insurance Companies Aggregated Statistics For Year 2009 (Based on 1 full and 1 partial tracts) | ||
| A) Conventional Home Purchase Loans | ||
|---|---|---|
| Number | Average Value | |
| LOANS ORIGINATED | 2 | $44,425 |
| APPLICATIONS APPROVED, NOT ACCEPTED | 0 | $0 |
| APPLICATIONS DENIED | 0 | $0 |
| APPLICATIONS WITHDRAWN | 0 | $0 |
| FILES CLOSED FOR INCOMPLETENESS | 0 | $0 |
Detailed PMIC statistics for the following Tracts: 0112.00 , 0113.00
2002 - 2018 National Fire Incident Reporting System (NFIRS) incidents
- Fire incident types reported to NFIRS in Toronto, OH
- 50551.4%Structure Fires
- 32733.3%Outside Fires
- 15115.4%Mobile Property/Vehicle Fires
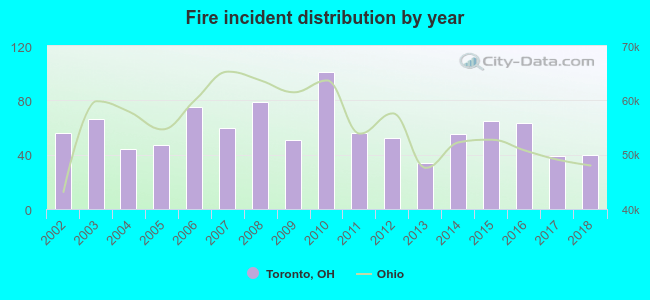 Based on the data from the years 2002 - 2018 the average number of fires per year is 58. The highest number of fires - 101 took place in 2010, and the least - 34 in 2013. The data has a decreasing trend.
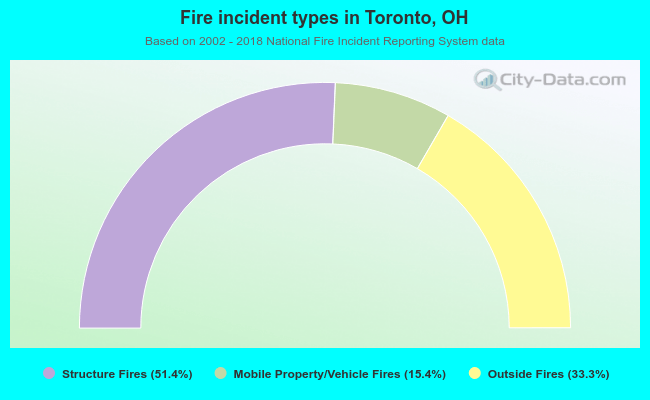 When looking into fire subcategories, the most incidents belonged to: Structure Fires (51.4%), and Outside Fires (33.3%).
| Most common first names in Toronto, OH among deceased individuals | ||
| Name | Count | Lived (average) |
|---|---|---|
| John | 171 | 75.2 years |
| Mary | 159 | 80.1 years |
| William | 157 | 74.2 years |
| James | 95 | 71.3 years |
| Robert | 80 | 69.7 years |
| George | 79 | 74.3 years |
| Joseph | 70 | 75.3 years |
| Charles | 64 | 73.8 years |
| Margaret | 60 | 78.2 years |
| Paul | 57 | 70.8 years |
| Most common last names in Toronto, OH among deceased individuals | ||
| Last name | Count | Lived (average) |
|---|---|---|
| Smith | 45 | 74.9 years |
| Miller | 32 | 77.8 years |
| Davis | 30 | 75.4 years |
| Wilson | 25 | 75.6 years |
| Scott | 21 | 77.6 years |
| Cooper | 20 | 74.2 years |
| Thompson | 20 | 76.0 years |
| Rawson | 19 | 68.6 years |
| Grimm | 19 | 68.2 years |
| Taylor | 18 | 68.9 years |
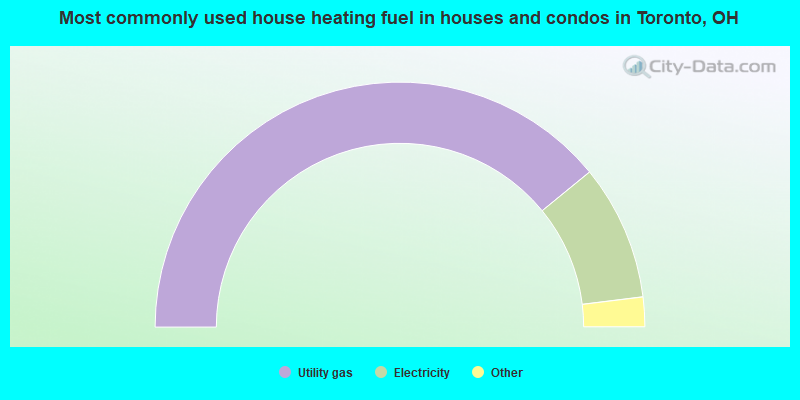
- 78.2%Utility gas
- 17.9%Electricity
- 2.3%Fuel oil, kerosene, etc.
- 1.6%Bottled, tank, or LP gas
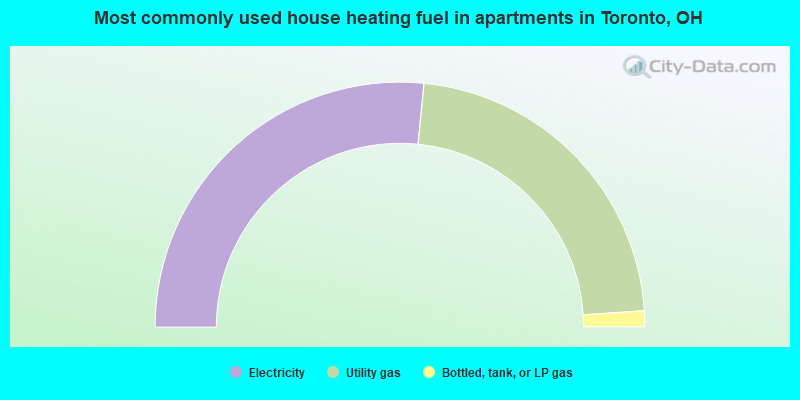
- 53.1%Electricity
- 44.7%Utility gas
- 2.1%Bottled, tank, or LP gas
Toronto compared to Ohio state average:
- Median house value below state average.
- Black race population percentage significantly below state average.
- Hispanic race population percentage significantly below state average.
- Foreign-born population percentage significantly below state average.
- Length of stay since moving in significantly above state average.
- House age above state average.
- Number of college students below state average.

|
Total of 1 patent application in 2008-2024.