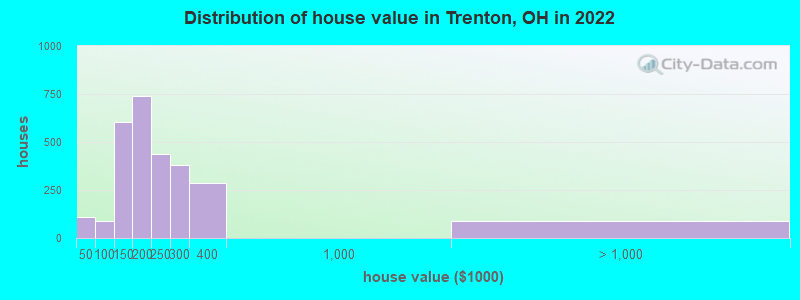
Estimated median house or condo value in 2022: $222,503 (it was $111,100 in 2000)
Trenton:
$222,503
OH:
$204,100
Mean prices in 2022:all housing units: $262,711; detached houses: $277,690; townhouses or other attached units: $192,205; in 2-unit structures: $165,872; in 3-to-4-unit structures: $168,139; in 5-or-more-unit structures: $132,222; mobile homes: $19,587
Median gross rent in 2022: $1,219.
March 2022 cost of living index in Trenton: 88.5 (less than average, U.S. average is 100)
Percentage of residents living in poverty in 2022: 4.4%
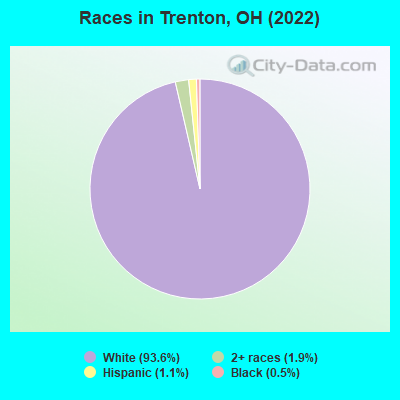
(4.5% for White Non-Hispanic residents, 10.9% for Hispanic or Latino residents, 4.7% for two or more races residents)
According to our research of Ohio and other state lists, there were 20 registered sex offenders living in Trenton, Ohio as of April 19, 2024. The ratio of all residents to sex offenders in Trenton is 630 to 1. The ratio of registered sex offenders to all residents in this city is near the state average.
Crime rates in Trenton by year
Type
2010
2011
Murders (per 100,000)
1 (8.4)
0 (0.0)
Rapes (per 100,000)
4 (33.7)
0 (0.0)
Robberies (per 100,000)
3 (25.3)
4 (33.7)
Assaults (per 100,000)
3 (25.3)
4 (33.7)
Burglaries (per 100,000)
48 (404.4)
49 (412.5)
Thefts (per 100,000)
246 (2,073)
244 (2,054)
Auto thefts (per 100,000)
5 (42.1)
4 (33.7)
Arson (per 100,000)
0 (0.0)
0 (0.0)
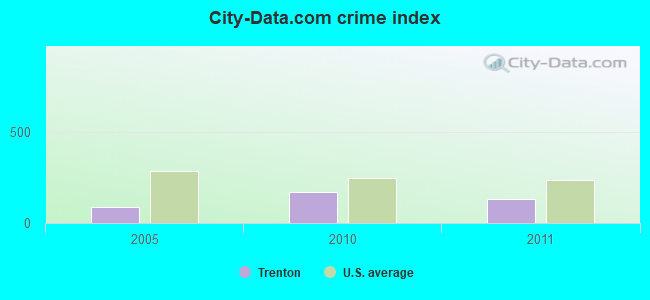
City-Data.com crime index
171.0
130.6
The City-Data.com crime index weighs serious crimes and violent crimes more heavily. Higher means more crime, U.S. average is 246.1. It adjusts for the number of visitors and daily workers commuting into cities.
Latest news from Trenton, OH collected exclusively by city-data.com from local newspapers, TV, and radio stations
Ancestries: Irish (25.7%), American (15.6%), German (11.2%), Italian (9.9%), English (6.5%), Scottish (2.1%).
Current Local Time: EST time zone
Incorporated in 1971
Elevation: 653 feet
Land area: 3.79 square miles.
Population density: 3,563 people per square mile (average).
269 residents are foreign born (1.0% North America, 0.4% Asia, 0.3% Europe, 0.2% Africa).
This city:
2.0%
Ohio:
4.9%
Median real estate property taxes paid for housing units with mortgages in 2022: $2,180 (0.9%) Median real estate property taxes paid for housing units with no mortgage in 2022: $2,180 (1.3%)
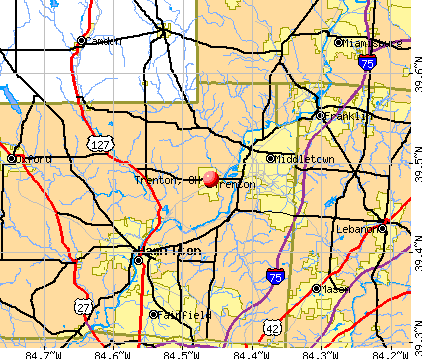
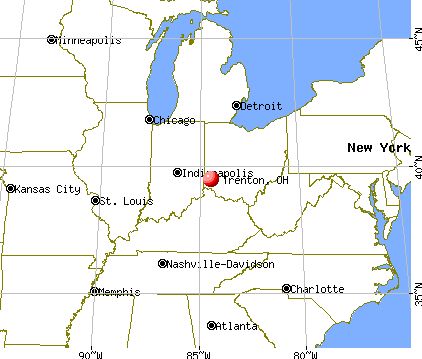
Nearest city with pop. 50,000+: Middletown, OH (4.8 miles , pop. 51,605).
Nearest city with pop. 200,000+: Cincinnati, OH (24.0 miles , pop. 331,285).
Nearest city with pop. 1,000,000+: Chicago, IL (234.8 miles , pop. 2,896,016).
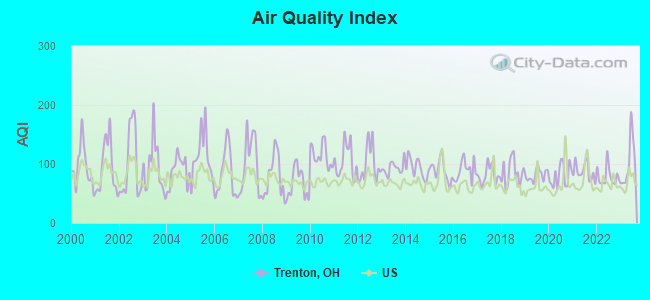
Air Quality Index (AQI) level in 2023 was 102. This is significantly worse than average.
City:
102
U.S.:
73
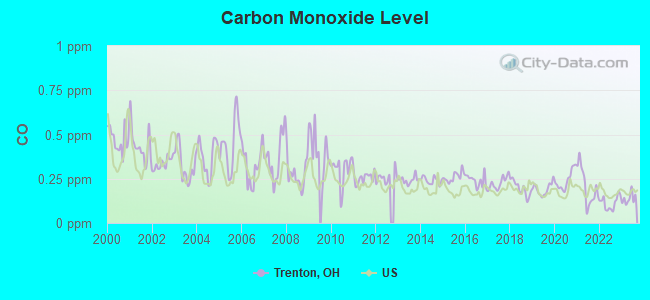
Carbon Monoxide (CO) [ppm] level in 2023 was 0.138. This is significantly better than average.Closest monitor was 14.9 miles away from the city center.
City:
0.138
U.S.:
0.251
Nitrogen Dioxide (NO2) [ppb] level in 2023 was 8.28. This is significantly worse than average.Closest monitor was 4.7 miles away from the city center.
City:
8.28
U.S.:
5.11
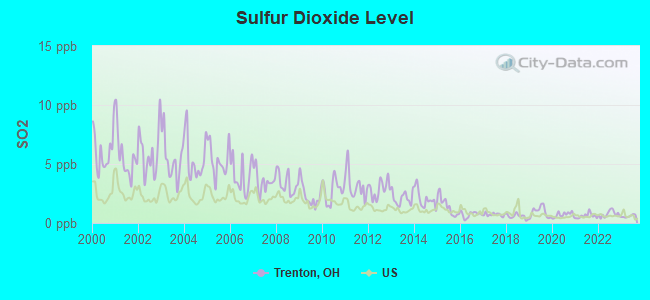
Sulfur Dioxide (SO2) [ppb] level in 2023 was 0.580. This is significantly better than average.Closest monitor was 3.9 miles away from the city center.
City:
0.580
U.S.:
1.515
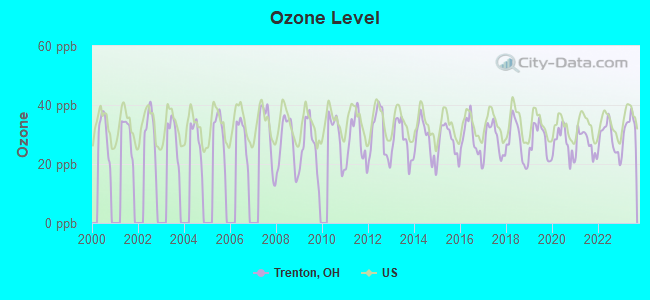
Ozone [ppb] level in 2023 was 32.5. This is about average.Closest monitor was 4.7 miles away from the city center.
City:
32.5
U.S.:
33.3
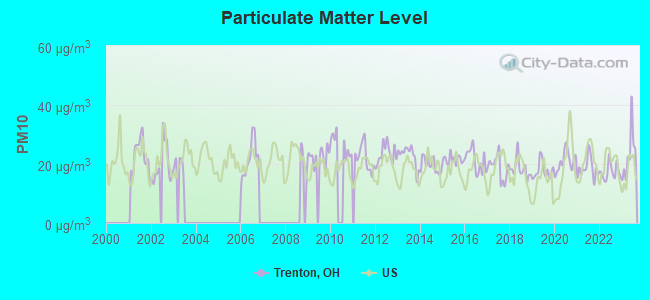
Particulate Matter (PM10) [µg/m3] level in 2023 was 23.2. This is worse than average.Closest monitor was 3.4 miles away from the city center.
City:
23.2
U.S.:
19.2
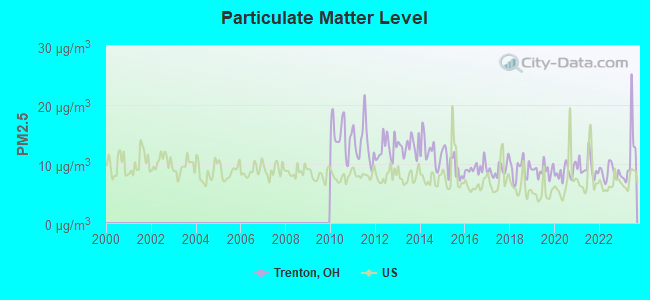
Particulate Matter (PM2.5) [µg/m3] level in 2023 was 11.4. This is worse than average.Closest monitor was 5.1 miles away from the city center.
City:
11.4
U.S.:
8.1
Tornado activity:
Trenton-area historical tornado activity is slightly above Ohio state average. It is 71% greater than the overall U.S. average.
On 4/3/1974, a category F5 (max. wind speeds 261-318 mph) tornado 20.3 miles away from the Trenton city center killed 3 peopleand injured 210 people.
On 4/3/1974, a category F5 tornado 24.1 miles away from the city center killed 36 peopleand injured 1150 peopleand causedbetween $50,000,000 and $500,000,000 in damages.
Earthquake activity:
Trenton-area historical earthquake activity is significantly above Ohio state average. It is 39% greater than the overall U.S. average.
On 7/27/1980 at 18:52:21, a magnitude 5.2 (5.1 MB, 4.7 MS, 5.0 UK, 5.2 UK, Class: Moderate, Intensity: VI - VII) earthquake occurred 92.6 miles away from Trenton center On 4/18/2008 at 09:36:59, a magnitude 5.4 (5.1 MB, 4.8 MS, 5.4 MW, 5.2 MW) earthquake occurred 197.5 miles away from the city center On 4/18/2008 at 09:36:59, a magnitude 5.2 (5.2 MW, Depth: 8.9 mi) earthquake occurred 197.6 miles away from the city center On 6/10/1987 at 23:48:54, a magnitude 5.1 (4.9 MB, 4.4 MS, 4.6 MS, 5.1 LG) earthquake occurred 189.3 miles away from Trenton center On 7/12/1986 at 08:19:37, a magnitude 4.5 (4.5 MB, Class: Light, Intensity: IV - V) earthquake occurred 73.1 miles away from the city center On 9/7/1988 at 02:28:09, a magnitude 4.6 (4.5 MB, 4.6 LG) earthquake occurred 97.8 miles away from Trenton center Magnitude types: regional Lg-wave magnitude (LG), body-wave magnitude (MB), surface-wave magnitude (MS), moment magnitude (MW)
Natural disasters:
The number of natural disasters in Butler County (11) is smaller than the US average (15). Major Disasters (Presidential) Declared: 7 Emergencies Declared: 3
Causes of natural disasters: Floods: 5, Storms: 4, Tornadoes: 2, Blizzard: 1, Heavy Rain: 1, Hurricane: 1, Snow: 1, Snowstorm: 1, Tropical Depression: 1, Wind: 1, Other: 1 (Note: some incidents may be assigned to more than one category).
Hospitals and medical centers near Trenton:
GARDEN MANOR EXTENDED CARE CENTER, INC (Nursing Home, about 3 miles away; MIDDLETOWN, OH)
COLONIAL MANOR (Nursing Home, about 4 miles away; MIDDLETOWN, OH)
GRACEWORKS ENHANCED LIVING-CURTIS HOME (Hospital, about 4 miles away; MIDDLETOWN, OH)
HAWTHORN GLEN NURSING CENTER (Nursing Home, about 4 miles away; MIDDLETOWN, OH)
MIDDLETOWN QUALITY CARE CTR (Nursing Home, about 4 miles away; MIDDLETOWN, OH)
HOSPICE CARE OF MIDDLETOWN (Hospital, about 4 miles away; MIDDLETOWN, OH)
PHYSICIANS CHOICE INC (Home Health Center, about 4 miles away; HAMILTON, OH)
Amtrak station near Trenton:
9 miles: HAMILTON (M. L. KING BLVD AT HENRY ST.) . Services: public payphones, free short-term parking, call for taxi service, public transit connection.
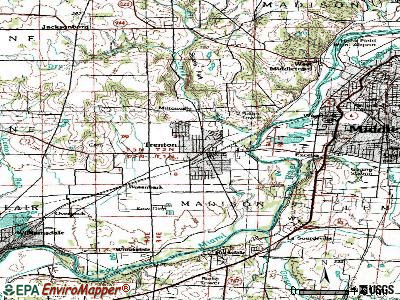
Notable locations in Trenton: Trenton Rescue Squad (A), City of Trenton Fire Department Station 1 Headquarters (B), City of Trenton Fire Department Station 2 (C), Trenton Library (D). Display/hide their locations on the map
Churches in Trenton include: Trenton First Church of God (A), Trenton Church of the Nazarene (B), Saint Peter Lutheran Church (C), Holy Name Catholic Church (D). Display/hide their locations on the map
Butler County has a predicted average indoor radon screening level greater than 4 pCi/L (pico curies per liter) - Highest Potential
Average household size:
This city:
2.9 people
Ohio:
2.4 people
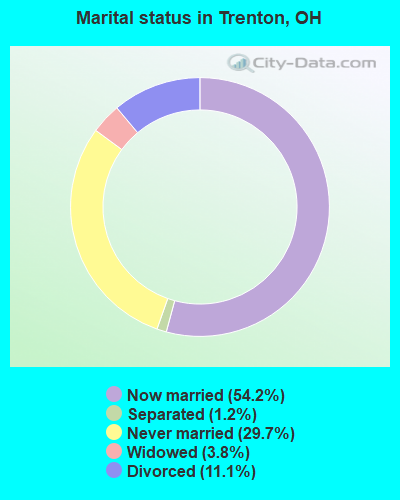
Percentage of family households:
This city:
78.3%
Whole state:
65.0%
Percentage of households with unmarried partners:
This city:
7.8%
Whole state:
6.8%
Likely homosexual households (counted as self-reported same-sex unmarried-partner households)
Lesbian couples: 0.4% of all households
Gay men: 0.3% of all households
Banks with branches in Trenton (2011 data):
Fifth Third Bank: Trenton Branch at 805 West State Street, branch established on 1982/02/22. Info updated 2009/10/05: Bank assets: $114,540.4 mil, Deposits: $89,689.1 mil, headquarters in Cincinnati, OH, positive income, Commercial Lending Specialization, 1378 total offices, Holding Company: Fifth Third Bancorp
First Financial Bank, National Association: Trenton Branch at 125 East State Street, branch established on 1955/12/05. Info updated 2009/09/21: Bank assets: $6,663.4 mil, Deposits: $5,754.9 mil, headquarters in Hamilton, OH, positive income, Commercial Lending Specialization, 101 total offices, Holding Company: First Financial Bancorp
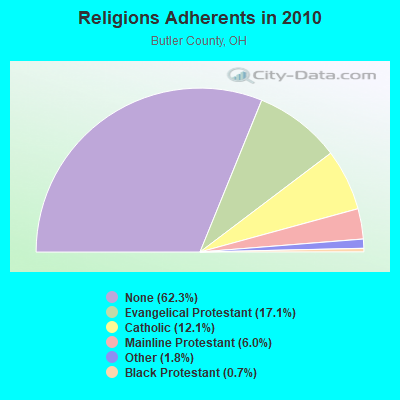
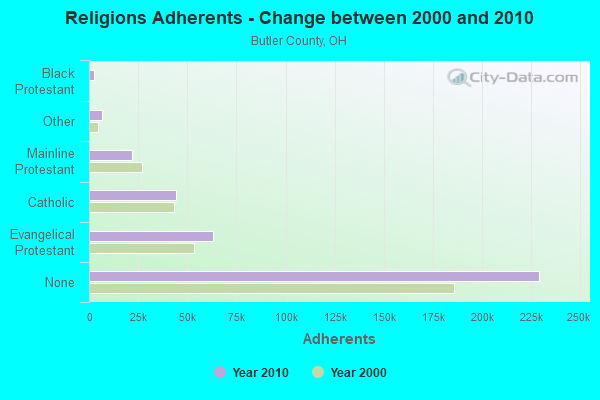
Religion statistics for Trenton, OH (based on Butler County data)
Religion
Adherents
Congregations
Evangelical Protestant
63,088
210
Catholic
44,417
13
Mainline Protestant
22,088
68
Other
6,647
28
Black Protestant
2,609
13
Orthodox
90
1
None
229,191
-
Source: Clifford Grammich, Kirk Hadaway, Richard Houseal, Dale E.Jones, Alexei Krindatch, Richie Stanley and Richard H.Taylor. 2012. 2010 U.S.Religion Census: Religious Congregations & Membership Study. Association of Statisticians of American Religious Bodies. Jones, Dale E., et al. 2002. Congregations and Membership in the United States 2000. Nashville, TN: Glenmary Research Center. Graphs represent county-level data
Aircraft: VANS AIRCRAFT INC RV-12 (Category: Land, Seats: 2, Weight: Up to 12,499 Pounds), Engine: ROTAX 912ULS SERIES (100 HP) (4 Cycle) N-Number: 716Z, N716Z, N-716Z, Serial Number: 120956, Year manufactured: 2018, Airworthiness Date: 10/10/2018, Certificate Issue Date: 02/13/2018 Registrant (Individual): Joseph Marconi, 712 W State St, Trenton, OH 45067
Aircraft: CESSNA P206C (Category: Land, Seats: 6, Weight: Up to 12,499 Pounds, Speed: 132 mph), Engine: CONT MOTOR IO 520 SERIES (285 HP) (Reciprocating) N-Number: 8715Z, N8715Z, N-8715Z, Serial Number: P206-0515, Year manufactured: 1968, Airworthiness Date: 07/30/1968, Certificate Issue Date: 09/29/2014 Registrant (Individual): Joseph Marconi, 712 W State St, Trenton, OH 45067
Aircraft: STITS SA6B (Category: Land, Seats: 2, Weight: Up to 12,499 Pounds, Speed: 78 mph), Engine: CONT MOTOR C90 SERIES (95 HP) (Reciprocating) N-Number: 551A, N551A, N-551A, Serial Number: 1027, Year manufactured: 1962 Registrant (Individual): Paul E Myers, 111 Keith Ave, Trenton, OH 45067
Home Mortgage Disclosure Act Aggregated Statistics For Year 2009 (Based on 2 partial tracts)
A) FHA, FSA/RHS & VA Home Purchase Loans
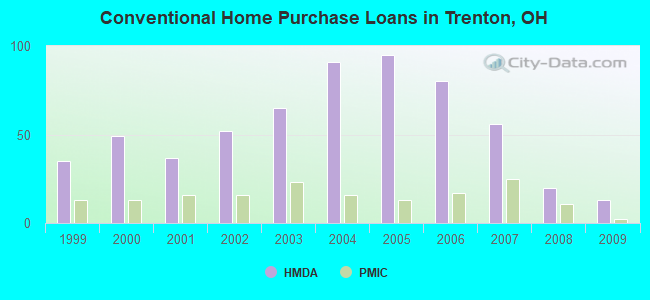
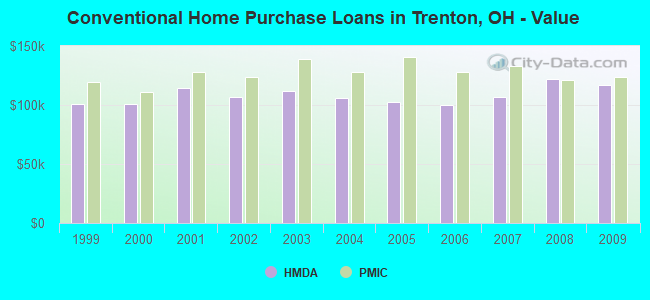
B) Conventional Home Purchase Loans
C) Refinancings
D) Home Improvement Loans
F) Non-occupant Loans on < 5 Family Dwellings (A B C & D)
G) Loans On Manufactured Home Dwelling (A B C & D)
Number
Average Value
Number
Average Value
Number
Average Value
Number
Average Value
Number
Average Value
Number
Average Value
LOANS ORIGINATED
36
$122,632
13
$116,815
97
$124,045
2
$17,625
9
$109,908
1
$34,660
APPLICATIONS APPROVED, NOT ACCEPTED
2
$127,800
2
$132,985
10
$134,456
0
$0
0
$0
0
$0
APPLICATIONS DENIED
9
$127,529
3
$85,253
39
$126,147
4
$20,120
7
$102,234
0
$0
APPLICATIONS WITHDRAWN
7
$131,677
2
$121,875
18
$125,679
0
$0
1
$152,510
0
$0
FILES CLOSED FOR INCOMPLETENESS
1
$189,040
1
$94,270
9
$143,376
0
$0
0
$0
0
$0
Aggregated Statistics For Year 2008 (Based on 2 partial tracts)
A) FHA, FSA/RHS & VA Home Purchase Loans
B) Conventional Home Purchase Loans
C) Refinancings
D) Home Improvement Loans
F) Non-occupant Loans on < 5 Family Dwellings (A B C & D)
G) Loans On Manufactured Home Dwelling (A B C & D)
Number
Average Value
Number
Average Value
Number
Average Value
Number
Average Value
Number
Average Value
Number
Average Value
LOANS ORIGINATED
25
$129,568
20
$122,286
47
$127,736
3
$22,737
9
$111,158
0
$0
APPLICATIONS APPROVED, NOT ACCEPTED
1
$107,290
3
$108,503
12
$121,289
0
$0
1
$77,060
0
$0
APPLICATIONS DENIED
12
$114,657
5
$109,048
52
$122,997
8
$31,761
5
$111,624
1
$23,630
APPLICATIONS WITHDRAWN
4
$100,420
3
$119,920
21
$146,861
1
$57,520
1
$51,250
0
$0
FILES CLOSED FOR INCOMPLETENESS
1
$248,870
0
$0
8
$134,664
0
$0
1
$197,990
0
$0
Aggregated Statistics For Year 2007 (Based on 2 partial tracts)
A) FHA, FSA/RHS & VA Home Purchase Loans
B) Conventional Home Purchase Loans
C) Refinancings
D) Home Improvement Loans
E) Loans on Dwellings For 5+ Families
F) Non-occupant Loans on < 5 Family Dwellings (A B C & D)
G) Loans On Manufactured Home Dwelling (A B C & D)
Number
Average Value
Number
Average Value
Number
Average Value
Number
Average Value
Number
Average Value
Number
Average Value
Number
Average Value
LOANS ORIGINATED
12
$143,208
56
$106,830
68
$123,287
4
$24,988
1
$438,940
21
$96,617
0
$0
APPLICATIONS APPROVED, NOT ACCEPTED
1
$108,900
7
$121,471
15
$130,949
1
$31,420
0
$0
1
$81,320
0
$0
APPLICATIONS DENIED
3
$154,120
11
$125,934
91
$121,288
9
$29,814
0
$0
7
$89,616
1
$28,910
APPLICATIONS WITHDRAWN
2
$161,450
6
$132,498
25
$132,972
0
$0
0
$0
0
$0
0
$0
FILES CLOSED FOR INCOMPLETENESS
0
$0
1
$132,790
8
$147,362
0
$0
0
$0
0
$0
0
$0
Aggregated Statistics For Year 2006 (Based on 2 partial tracts)
A) FHA, FSA/RHS & VA Home Purchase Loans
B) Conventional Home Purchase Loans
C) Refinancings
D) Home Improvement Loans
F) Non-occupant Loans on < 5 Family Dwellings (A B C & D)
G) Loans On Manufactured Home Dwelling (A B C & D)
Number
Average Value
Number
Average Value
Number
Average Value
Number
Average Value
Number
Average Value
Number
Average Value
LOANS ORIGINATED
15
$143,621
80
$100,220
86
$107,294
7
$41,690
19
$88,934
0
$0
APPLICATIONS APPROVED, NOT ACCEPTED
0
$0
7
$86,137
22
$108,821
2
$38,765
1
$58,580
0
$0
APPLICATIONS DENIED
2
$163,825
14
$94,375
94
$121,656
13
$51,690
5
$134,292
1
$18,100
APPLICATIONS WITHDRAWN
1
$196,050
11
$93,840
42
$131,758
3
$83,417
3
$90,270
0
$0
FILES CLOSED FOR INCOMPLETENESS
0
$0
3
$93,157
13
$135,735
0
$0
0
$0
0
$0
Aggregated Statistics For Year 2005 (Based on 2 partial tracts)
A) FHA, FSA/RHS & VA Home Purchase Loans
B) Conventional Home Purchase Loans
C) Refinancings
D) Home Improvement Loans
E) Loans on Dwellings For 5+ Families
F) Non-occupant Loans on < 5 Family Dwellings (A B C & D)
G) Loans On Manufactured Home Dwelling (A B C & D)
Number
Average Value
Number
Average Value
Number
Average Value
Number
Average Value
Number
Average Value
Number
Average Value
Number
Average Value
LOANS ORIGINATED
15
$141,713
95
$102,125
123
$105,723
9
$55,903
1
$227,520
20
$109,707
1
$12,170
APPLICATIONS APPROVED, NOT ACCEPTED
1
$82,390
11
$100,229
27
$113,007
2
$57,425
0
$0
2
$95,795
1
$33,690
APPLICATIONS DENIED
1
$153,460
16
$109,938
99
$117,992
20
$26,866
0
$0
1
$178,940
1
$16,090
APPLICATIONS WITHDRAWN
0
$0
8
$128,920
64
$132,319
4
$115,158
0
$0
1
$133,660
0
$0
FILES CLOSED FOR INCOMPLETENESS
1
$71,150
4
$112,530
12
$110,983
1
$16,220
0
$0
0
$0
0
$0
Aggregated Statistics For Year 2004 (Based on 2 partial tracts)
A) FHA, FSA/RHS & VA Home Purchase Loans
B) Conventional Home Purchase Loans
C) Refinancings
D) Home Improvement Loans
E) Loans on Dwellings For 5+ Families
F) Non-occupant Loans on < 5 Family Dwellings (A B C & D)
Number
Average Value
Number
Average Value
Number
Average Value
Number
Average Value
Number
Average Value
Number
Average Value
LOANS ORIGINATED
24
$148,165
91
$106,282
125
$108,705
9
$29,601
1
$542,020
17
$97,051
APPLICATIONS APPROVED, NOT ACCEPTED
2
$155,930
15
$111,304
23
$202,266
2
$15,970
0
$0
2
$131,335
APPLICATIONS DENIED
4
$139,842
17
$106,364
86
$109,157
17
$27,498
0
$0
2
$92,500
APPLICATIONS WITHDRAWN
3
$143,103
9
$123,914
46
$119,274
6
$19,563
0
$0
0
$0
FILES CLOSED FOR INCOMPLETENESS
0
$0
4
$103,410
7
$121,134
2
$38,485
0
$0
0
$0
Aggregated Statistics For Year 2003 (Based on 2 partial tracts)
A) FHA, FSA/RHS & VA Home Purchase Loans
B) Conventional Home Purchase Loans
C) Refinancings
D) Home Improvement Loans
F) Non-occupant Loans on < 5 Family Dwellings (A B C & D)
Number
Average Value
Number
Average Value
Number
Average Value
Number
Average Value
Number
Average Value
LOANS ORIGINATED
40
$132,788
65
$111,582
227
$111,165
9
$20,596
18
$106,645
APPLICATIONS APPROVED, NOT ACCEPTED
1
$155,900
6
$90,928
41
$110,132
1
$16,930
1
$61,070
APPLICATIONS DENIED
5
$117,726
13
$106,186
89
$118,203
9
$18,417
2
$83,340
APPLICATIONS WITHDRAWN
2
$122,560
9
$113,550
70
$125,068
1
$44,500
1
$119,090
FILES CLOSED FOR INCOMPLETENESS
1
$142,320
4
$121,380
24
$123,742
1
$18,800
0
$0
Aggregated Statistics For Year 2002 (Based on 2 partial tracts)
A) FHA, FSA/RHS & VA Home Purchase Loans
B) Conventional Home Purchase Loans
C) Refinancings
D) Home Improvement Loans
E) Loans on Dwellings For 5+ Families
F) Non-occupant Loans on < 5 Family Dwellings (A B C & D)
Number
Average Value
Number
Average Value
Number
Average Value
Number
Average Value
Number
Average Value
Number
Average Value
LOANS ORIGINATED
28
$121,457
52
$107,127
181
$104,249
6
$25,633
2
$213,815
7
$114,220
APPLICATIONS APPROVED, NOT ACCEPTED
0
$0
8
$110,124
50
$112,984
3
$61,613
0
$0
1
$64,340
APPLICATIONS DENIED
2
$145,830
11
$91,489
87
$109,043
15
$21,947
0
$0
3
$67,930
APPLICATIONS WITHDRAWN
2
$118,900
7
$100,003
69
$121,364
3
$55,807
0
$0
2
$190,395
FILES CLOSED FOR INCOMPLETENESS
1
$73,840
1
$83,780
14
$109,352
1
$76,690
0
$0
0
$0
Aggregated Statistics For Year 2001 (Based on 2 partial tracts)
A) FHA, FSA/RHS & VA Home Purchase Loans
B) Conventional Home Purchase Loans
C) Refinancings
D) Home Improvement Loans
E) Loans on Dwellings For 5+ Families
F) Non-occupant Loans on < 5 Family Dwellings (A B C & D)
Number
Average Value
Number
Average Value
Number
Average Value
Number
Average Value
Number
Average Value
Number
Average Value
LOANS ORIGINATED
46
$118,749
37
$114,772
172
$98,663
9
$10,778
1
$163,160
10
$89,577
APPLICATIONS APPROVED, NOT ACCEPTED
1
$136,360
4
$67,855
37
$103,549
3
$11,933
0
$0
0
$0
APPLICATIONS DENIED
2
$107,375
8
$80,021
93
$96,654
15
$10,587
0
$0
1
$50,030
APPLICATIONS WITHDRAWN
1
$181,400
4
$115,052
68
$109,647
6
$16,005
0
$0
1
$95,510
FILES CLOSED FOR INCOMPLETENESS
0
$0
1
$83,180
8
$116,449
0
$0
0
$0
0
$0
Aggregated Statistics For Year 2000 (Based on 2 partial tracts)
A) FHA, FSA/RHS & VA Home Purchase Loans
B) Conventional Home Purchase Loans
C) Refinancings
D) Home Improvement Loans
E) Loans on Dwellings For 5+ Families
F) Non-occupant Loans on < 5 Family Dwellings (A B C & D)
Number
Average Value
Number
Average Value
Number
Average Value
Number
Average Value
Number
Average Value
Number
Average Value
LOANS ORIGINATED
40
$112,813
49
$100,798
45
$85,503
17
$17,052
1
$99,220
6
$88,865
APPLICATIONS APPROVED, NOT ACCEPTED
3
$99,167
10
$85,406
15
$83,237
5
$8,350
0
$0
0
$0
APPLICATIONS DENIED
3
$123,077
15
$82,535
51
$78,332
16
$19,916
0
$0
1
$78,540
APPLICATIONS WITHDRAWN
2
$93,510
7
$85,557
23
$76,436
2
$30,635
0
$0
1
$58,940
FILES CLOSED FOR INCOMPLETENESS
1
$103,970
1
$82,460
7
$89,671
1
$16,260
0
$0
0
$0
Aggregated Statistics For Year 1999 (Based on 2 partial tracts)
A) FHA, FSA/RHS & VA Home Purchase Loans
B) Conventional Home Purchase Loans
C) Refinancings
D) Home Improvement Loans
E) Loans on Dwellings For 5+ Families
F) Non-occupant Loans on < 5 Family Dwellings (A B C & D)
Detailed PMIC statistics for the following Tracts:0118.01
, 0118.02
2002 - 2018 National Fire Incident Reporting System (NFIRS) incidents
Based on the data from the years 2002 - 2018 the average number of fires per year is 40. The highest number of reported fires - 61 took place in 2007, and the least - 23 in 2005. The data has a dropping trend.
When looking into fire subcategories, the most incidents belonged to: Structure Fires (51.7%), and Outside Fires (35.1%).
Fire incident types reported to NFIRS in Trenton, OH
#37 on the list of "Top 101 cities with the lowest number of assaults per 100,000 residents (population 5,000+)"
#62 (45067) on the list of "Top 101 zip codes with the lowest 2012 average net capital gain/loss (pop 5,000+)"
#52 on the list of "Top 101 counties with the highest ground withdrawal of fresh water for public supply"
#56 on the list of "Top 101 counties with the highest Particulate Matter (PM2.5) Annual air pollution readings in 2012 (µg/m3)"
#60 on the list of "Top 101 counties with the highest number of infant deaths per 1000 residents 2007-2013 (pop. 50,000+)"
#92 on the list of "Top 101 counties with the largest decrease in the number of infant deaths per 1000 residents 2000-2006 to 2007-2013 (pop. 50,000+)"


 Recent articles from our blog. Our writers, many of them Ph.D. graduates or candidates, create easy-to-read articles on a wide variety of topics.

 (4.8 miles


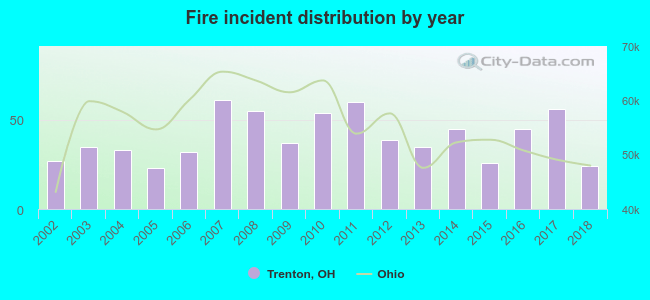 Based on the data from the years 2002 - 2018 the average number of fires per year is 40. The highest number of reported fires - 61 took place in 2007, and the least - 23 in 2005. The data has a dropping trend.
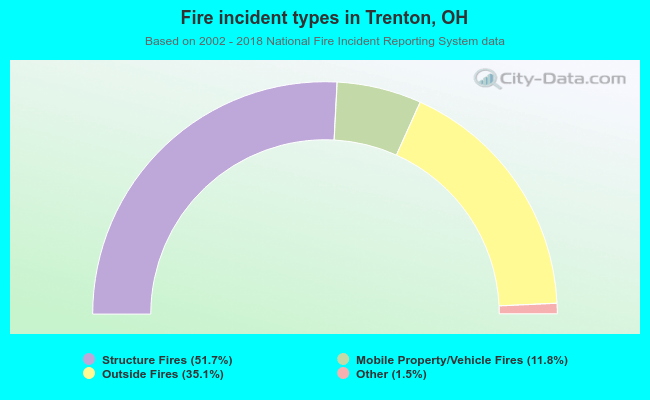 When looking into fire subcategories, the most incidents belonged to: Structure Fires (51.7%), and Outside Fires (35.1%).