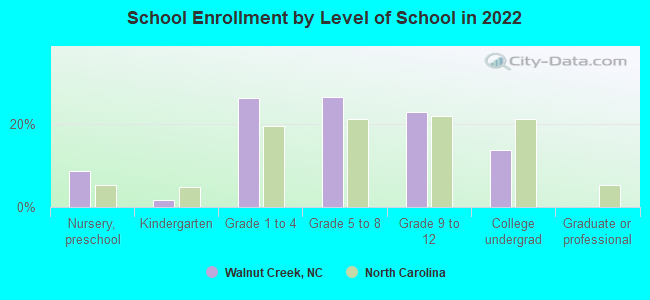
Walnut Creek, North Carolina
Submit your own pictures of this village and show them to the world
(5.8% for White Non-Hispanic residents, 12.5% for Black residents)
Full-time law enforcement employees in 2021, including police officers: 4 (3 officers - 3 male; 0 female).
| Officers per 1,000 residents here: | 3.47 |
| North Carolina average: | 2.27 |
 Recent articles from our blog. Our writers, many of them Ph.D. graduates or candidates, create easy-to-read articles on a wide variety of topics.
| Here: | 3.5% |
| North Carolina: | 3.2% |
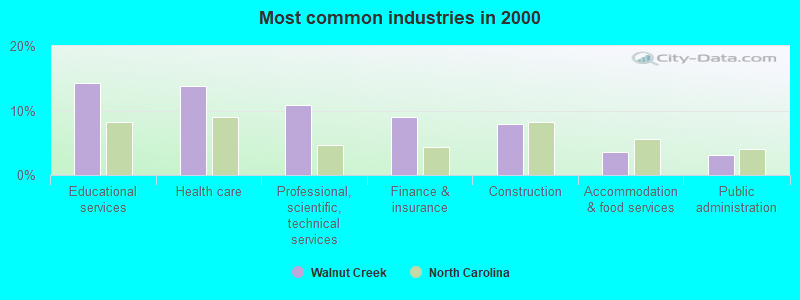
- Educational services (14.3%)
- Health care (13.8%)
- Professional, scientific, technical services (10.9%)
- Finance & insurance (9.0%)
- Construction (7.8%)
- Accommodation & food services (3.6%)
- Public administration (3.1%)
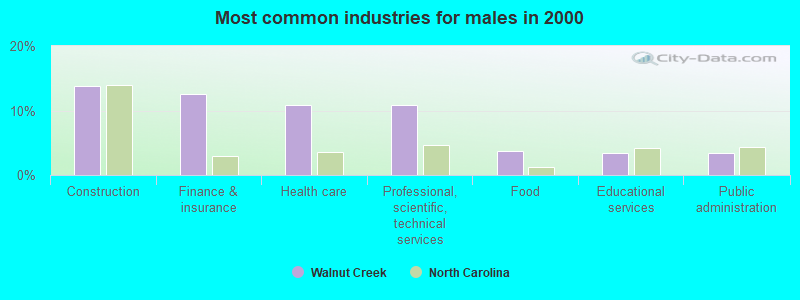
- Construction (13.8%)
- Finance & insurance (12.6%)
- Health care (10.9%)
- Professional, scientific, technical services (10.9%)
- Food (3.8%)
- Educational services (3.3%)
- Public administration (3.3%)
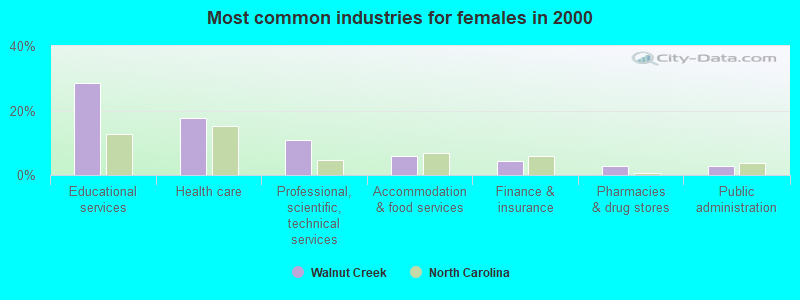
- Educational services (28.6%)
- Health care (17.6%)
- Professional, scientific, technical services (11.0%)
- Accommodation & food services (6.0%)
- Finance & insurance (4.4%)
- Pharmacies & drug stores (2.7%)
- Public administration (2.7%)
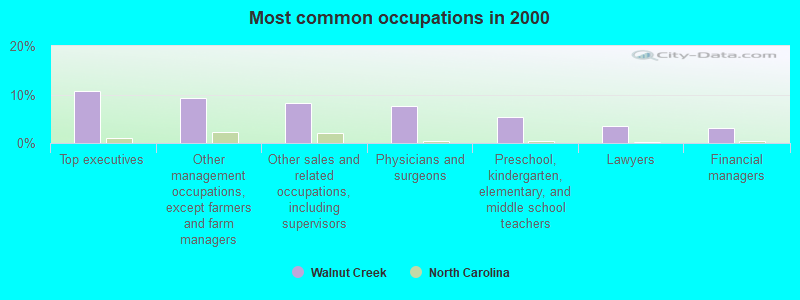
- Top executives (10.7%)
- Other management occupations, except farmers and farm managers (9.3%)
- Other sales and related occupations, including supervisors (8.3%)
- Physicians and surgeons (7.6%)
- Preschool, kindergarten, elementary, and middle school teachers (5.5%)
- Lawyers (3.6%)
- Financial managers (3.1%)
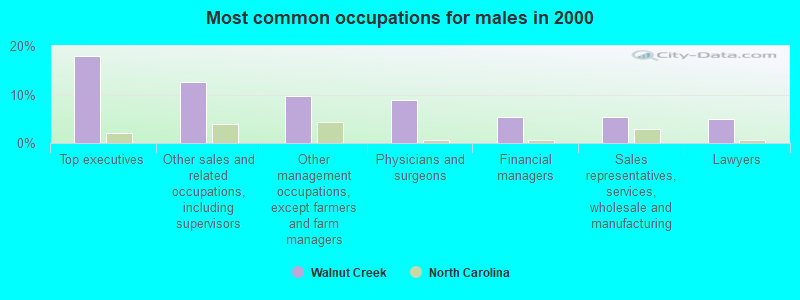
- Top executives (18.0%)
- Other sales and related occupations, including supervisors (12.6%)
- Other management occupations, except farmers and farm managers (9.6%)
- Physicians and surgeons (8.8%)
- Financial managers (5.4%)
- Sales representatives, services, wholesale and manufacturing (5.4%)
- Lawyers (5.0%)
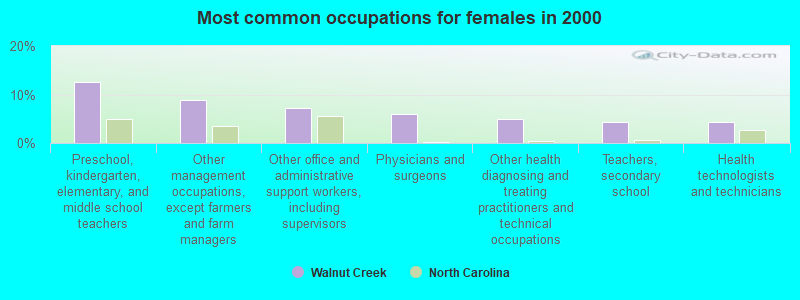
- Preschool, kindergarten, elementary, and middle school teachers (12.6%)
- Other management occupations, except farmers and farm managers (8.8%)
- Other office and administrative support workers, including supervisors (7.1%)
- Physicians and surgeons (6.0%)
- Other health diagnosing and treating practitioners and technical occupations (4.9%)
- Teachers, secondary school (4.4%)
- Health technologists and technicians (4.4%)
Average climate in Walnut Creek, North Carolina
Based on data reported by over 4,000 weather stations


(lower is better)
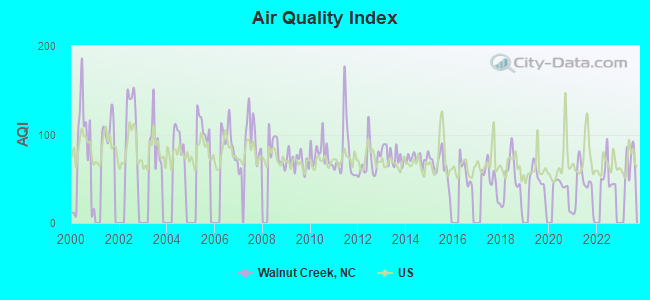
Air Quality Index (AQI) level in 2022 was 53.3. This is better than average.
| City: | 53.3 |
| U.S.: | 72.6 |
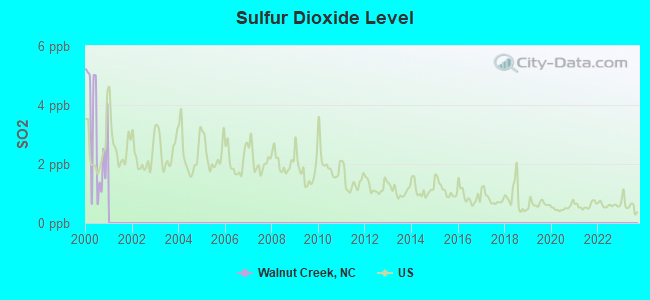
Sulfur Dioxide (SO2) [ppb] level in 2000 was 3.09. This is significantly worse than average. Closest monitor was 8.9 miles away from the city center.
| City: | 3.09 |
| U.S.: | 1.51 |
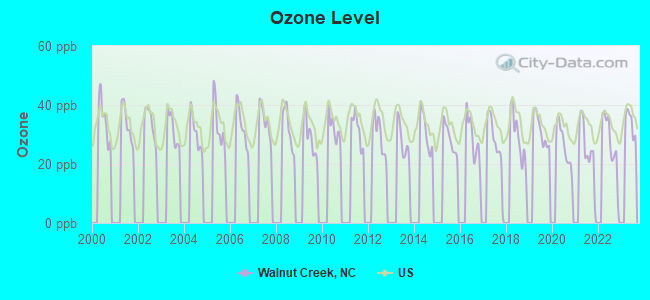
Ozone [ppb] level in 2022 was 27.2. This is better than average. Closest monitor was 17.8 miles away from the city center.
| City: | 27.2 |
| U.S.: | 33.3 |
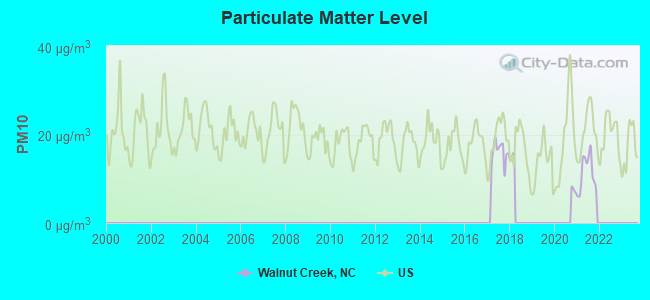
Particulate Matter (PM10) [µg/m3] level in 2021 was 11.3. This is significantly better than average. Closest monitor was 8.2 miles away from the city center.
| City: | 11.3 |
| U.S.: | 19.2 |
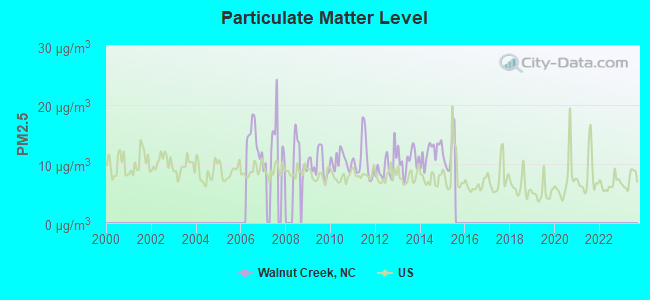
Particulate Matter (PM2.5) [µg/m3] level in 2015 was 11.9. This is significantly worse than average. Closest monitor was 8.2 miles away from the city center.
| City: | 11.9 |
| U.S.: | 8.1 |
Tornado activity:
Walnut Creek-area historical tornado activity is slightly above North Carolina state average. It is 16% greater than the overall U.S. average.
On 3/28/1984, a category F4 (max. wind speeds 207-260 mph) tornado 4.5 miles away from the Walnut Creek village center killed 3 people and injured 149 people and caused between $5,000,000 and $50,000,000 in damages.
On 3/28/1984, a category F4 tornado 5.1 miles away from the village center killed 16 people and injured 153 people and caused between $5,000,000 and $50,000,000 in damages.
Earthquake activity:
Walnut Creek-area historical earthquake activity is significantly above North Carolina state average. It is 60% smaller than the overall U.S. average.On 8/23/2011 at 17:51:04, a magnitude 5.8 (5.8 MW, Depth: 3.7 mi, Class: Moderate, Intensity: VI - VII) earthquake occurred 179.9 miles away from the city center
On 8/9/2020 at 12:07:37, a magnitude 5.1 (5.1 MW, Depth: 4.7 mi) earthquake occurred 197.9 miles away from the city center
On 12/9/2003 at 20:59:14, a magnitude 4.5 (4.5 MB, 4.5 LG, Class: Light, Intensity: IV - V) earthquake occurred 157.6 miles away from Walnut Creek center
On 12/9/2003 at 20:59:18, a magnitude 4.5 (4.5 ML, Depth: 6.2 mi) earthquake occurred 171.0 miles away from Walnut Creek center
On 11/22/1974 at 05:25:55, a magnitude 4.7 (4.7 MB) earthquake occurred 211.6 miles away from the city center
On 8/25/2011 at 05:07:52, a magnitude 4.5 (4.5 ML, Depth: 4.2 mi) earthquake occurred 182.5 miles away from the city center
Magnitude types: regional Lg-wave magnitude (LG), body-wave magnitude (MB), local magnitude (ML), moment magnitude (MW)
Natural disasters:
The number of natural disasters in Wayne County (20) is greater than the US average (15).Major Disasters (Presidential) Declared: 10
Emergencies Declared: 6
Causes of natural disasters: Hurricanes: 13, Storms: 3, Tornadoes: 3, Floods: 2, Ice Storms: 2, Drought: 1, Other: 1 (Note: some incidents may be assigned to more than one category).

Hospitals and medical centers near Walnut Creek:
- RHA/HOWELL'S CHILD CARE CENTER INC/LAGRANGE (Hospital, about 3 miles away; LA GRANGE, NC)
- WASHINGTON STREET EAST GROUP HOME (Hospital, about 4 miles away; LA GRANGE, NC)
- LAGRANGE HOME (Hospital, about 4 miles away; LA GRANGE, NC)
- CAROLINA EAST HOME CARE AND HOSPICE INC (Hospital, about 6 miles away; SEVEN SPRINGS, NC)
- SKILL CREATIONS OF GOLDSBORO (Hospital, about 8 miles away; GOLDSBORO, NC)
- HOLLY STREET HOME (Hospital, about 8 miles away; GOLDSBORO, NC)
- WAYNE MEMORIAL HOSPITAL Acute Care Hospitals (about 8 miles away; GOLDSBORO, NC)
Colleges/universities with over 2000 students nearest to Walnut Creek:
- Wayne Community College (about 8 miles; Goldsboro, NC; Full-time enrollment: 3,174)
- Mount Olive College (about 14 miles; Mount Olive, NC; FT enrollment: 3,097)
- Lenoir Community College (about 18 miles; Kinston, NC; FT enrollment: 2,555)
- Johnston Community College (about 30 miles; Smithfield, NC; FT enrollment: 3,657)
- Pitt Community College (about 31 miles; Winterville, NC; FT enrollment: 7,026)
- East Carolina University (about 35 miles; Greenville, NC; FT enrollment: 23,943)
- Edgecombe Community College (about 43 miles; Tarboro, NC; FT enrollment: 2,058)
Points of interest:
Reservoirs: Lake Wackena (A), Spring Lake (B). Display/hide their locations on the map
Streams, rivers, and creeks: Mira Branch (A). Display/hide its location on the map
| This village: | 2.4 people |
| North Carolina: | 2.5 people |
| This village: | 83.9% |
| Whole state: | 66.7% |
| This village: | 1.8% |
| Whole state: | 5.9% |
Likely homosexual households (counted as self-reported same-sex unmarried-partner households)
- Lesbian couples: 0.3% of all households
- Gay men: 0.6% of all households
| Here: | 9.8 |
| North Carolina average: | 11.7 |
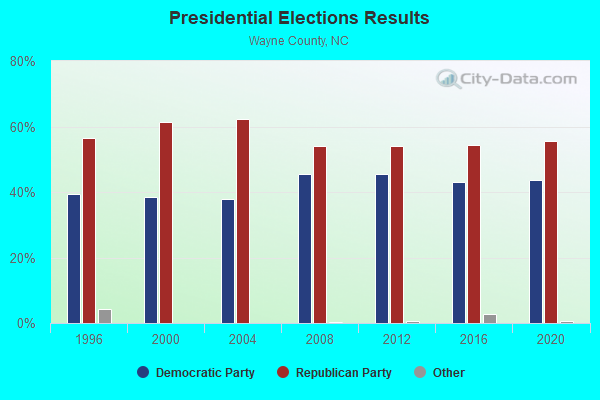
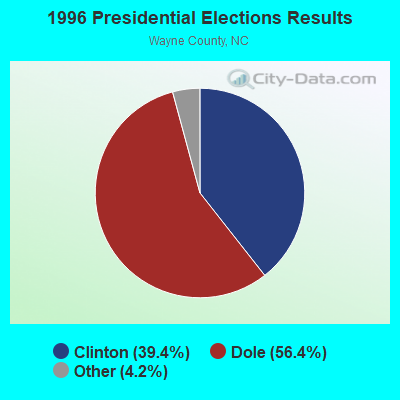
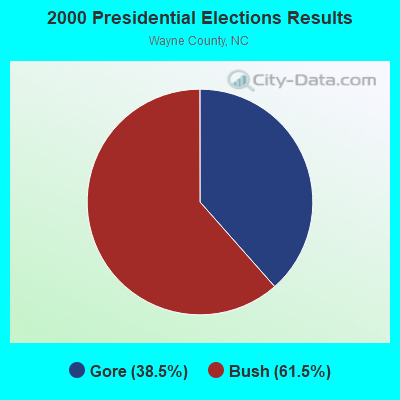
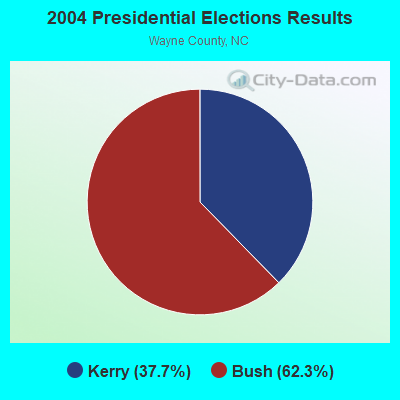
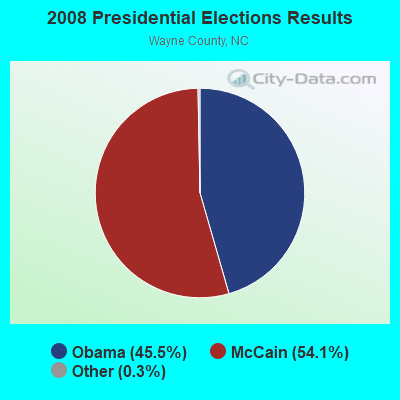
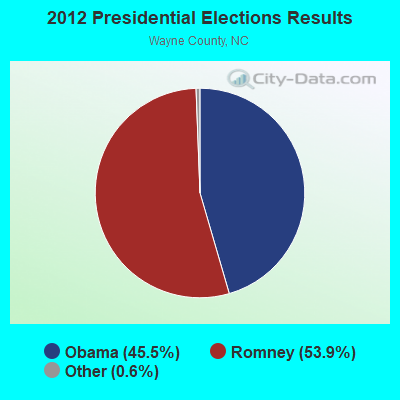
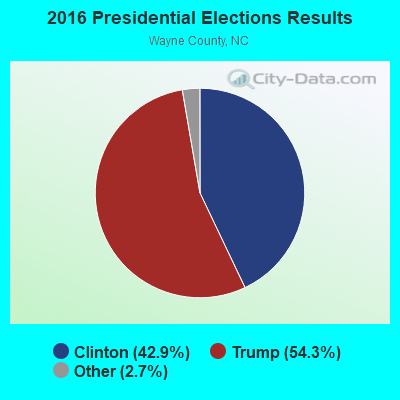
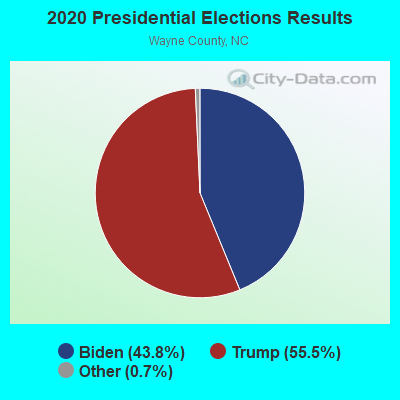
Graphs represent county-level data. Detailed 2008 Election Results
Religion statistics for Walnut Creek, NC (based on Wayne County data)
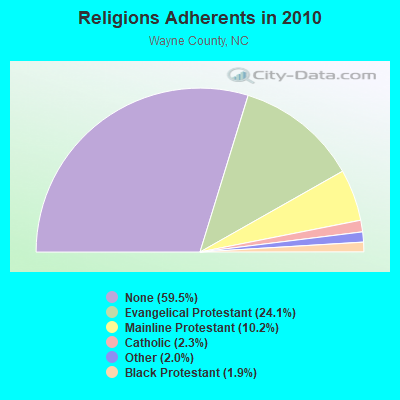
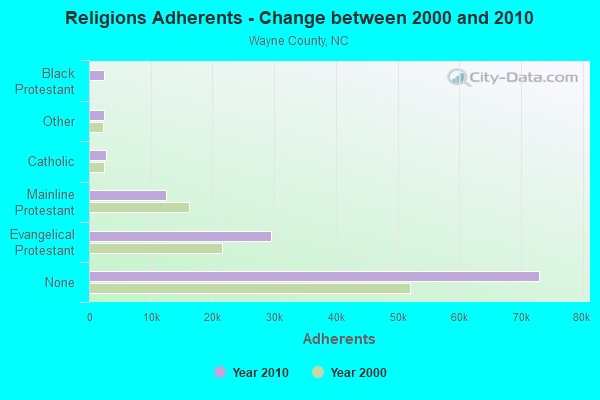
| Religion | Adherents | Congregations |
|---|---|---|
| Evangelical Protestant | 29,543 | 157 |
| Mainline Protestant | 12,482 | 64 |
| Catholic | 2,800 | 2 |
| Other | 2,438 | 10 |
| Black Protestant | 2,384 | 34 |
| None | 72,976 | - |
Food Environment Statistics:
| Here: | 1.94 / 10,000 pop. |
| North Carolina: | 2.05 / 10,000 pop. |
| Wayne County: | 0.18 / 10,000 pop. |
| North Carolina: | 0.14 / 10,000 pop. |
| This county: | 0.97 / 10,000 pop. |
| North Carolina: | 0.92 / 10,000 pop. |
| Wayne County: | 5.38 / 10,000 pop. |
| North Carolina: | 4.75 / 10,000 pop. |
| Here: | 6.61 / 10,000 pop. |
| North Carolina: | 7.57 / 10,000 pop. |
| This county: | 10.4% |
| State: | 9.8% |
| Wayne County: | 30.8% |
| State: | 28.3% |
| Here: | 17.6% |
| North Carolina: | 15.6% |
Health and Nutrition:
| Walnut Creek: | 56.8% |
| North Carolina: | 48.9% |
| This city: | 55.5% |
| North Carolina: | 46.1% |
| Walnut Creek: | 28.5 |
| State: | 28.8 |
| Walnut Creek: | 19.8% |
| North Carolina: | 20.7% |
| Walnut Creek: | 8.6% |
| North Carolina: | 10.7% |
| This city: | 6.9 |
| State: | 6.8 |
| This city: | 37.4% |
| North Carolina: | 33.7% |
| Here: | 60.6% |
| North Carolina: | 55.8% |
| Walnut Creek: | 77.9% |
| North Carolina: | 79.7% |
More about Health and Nutrition of Walnut Creek, NC Residents
| Local government employment and payroll (March 2022) | |||||
| Function | Full-time employees | Monthly full-time payroll | Average yearly full-time wage | Part-time employees | Monthly part-time payroll |
|---|---|---|---|---|---|
| Police Protection - Officers | 3 | $14,294 | $57,176 | 1 | $400 |
| Other Government Administration | 1 | $4,167 | $50,004 | 0 | $0 |
| Other and Unallocable | 0 | $0 | 2 | $4,353 | |
| Totals for Government | 4 | $18,461 | $55,383 | 3 | $4,753 |
7.19% of this county's 2021 resident taxpayers lived in other counties in 2020 ($44,417 average adjusted gross income)
| Here: | 7.19% |
| North Carolina average: | 8.85% |
0.28% of residents moved from foreign countries ($2,002 average AGI)
Wayne County: 0.28% North Carolina average: 0.04%
Top counties from which taxpayers relocated into this county between 2020 and 2021:
| from Johnston County, NC | |
| from Wake County, NC | |
| from Lenoir County, NC |
7.49% of this county's 2020 resident taxpayers moved to other counties in 2021 ($45,703 average adjusted gross income)
| Here: | 7.49% |
| North Carolina average: | 7.89% |
0.31% of residents moved to foreign countries ($2,272 average AGI)
Wayne County: 0.31% North Carolina average: 0.03%
Top counties to which taxpayers relocated from this county between 2020 and 2021:
| to Johnston County, NC | |
| to Wake County, NC | |
| to Lenoir County, NC |
Strongest AM radio stations in Walnut Creek:
- WGBR (1150 AM; 5 kW; GOLDSBORO, NC; Owner: NEW AGE COMMUNICATIONS, LTD.)
- WDJS (1430 AM; 10 kW; MOUNT OLIVE, NC; Owner: MOUNT OLIVE BROADCASTING CO.)
- WRNS (960 AM; 5 kW; KINSTON, NC; Owner: NM LICENSING, LLC)
- WPTF (680 AM; 50 kW; RALEIGH, NC; Owner: FIRST STATE COMMUNICATIONS)
- WFMC (730 AM; 1 kW; GOLDSBORO, NC; Owner: NEW AGE COMMUNICATIONS, INC)
- WNCT (1070 AM; 10 kW; GREENVILLE, NC; Owner: WNCT LICENSE LIMITED PARTNERSHIP)
- WGTM (590 AM; 5 kW; WILSON, NC; Owner: SPIRIT BROADCASTING, INC.)
- WFTK (1030 AM; daytime; 50 kW; WAKE FOREST, NC; Owner: POSITIVE RADIO GROUP, INC.)
- WELS (1010 AM; 1 kW; KINSTON, NC; Owner: KINSTON CHRISTIAN RADIO, INC.)
- WSSG (1300 AM; 1 kW; GOLDSBORO, NC)
- WSMO (1120 AM; 20 kW; CAMP LEJEUNE, NC; Owner: CTC MEDIA GROUP, INC.)
- WGHB (1250 AM; 5 kW; FARMVILLE, NC; Owner: CONNER MEDIA, INC.)
- WETC (540 AM; 8 kW; WENDELL-ZEBULON, NC; Owner: CAROLINA REGIONAL BROADCASTING CORPORATION)
Strongest FM radio stations in Walnut Creek:
- WZUP (104.7 FM; ROSE HILL, NC; Owner: CONNER MEDIA CORPORATION)
- WRNS-FM (95.1 FM; KINSTON, NC; Owner: NM LICENSING, LLC)
- WKIX (102.3 FM; GOLDSBORO, NC; Owner: NEW AGE COMMUNICATIONS, INC.)
- WYMY (96.9 FM; GOLDSBORO, NC; Owner: NEW AGE COMMUNICATIONS, LTD.)
- WERO (93.3 FM; WASHINGTON, NC; Owner: NM LICENSING, LLC)
- WNCT-FM (107.9 FM; GREENVILLE, NC; Owner: WNCT LICENSE LIMITED PARTNERSHIP)
- WKNS (90.3 FM; KINSTON, NC; Owner: CRAVEN COMMUNITY COLLEGE)
- WTRG (100.7 FM; ROCKY MOUNT, NC; Owner: CAPSTAR TX LIMITED PARTNERSHIP)
- WRDU (106.1 FM; WILSON, NC; Owner: CAPSTAR TX LIMITED PARTNERSHIP)
- WELS-FM (102.9 FM; KINSTON, NC; Owner: KINSTON CHRISTIAN RADIO, INC.)
- WRAL (101.5 FM; RALEIGH, NC; Owner: WRAL-FM, INC.)
- WFXK (104.3 FM; TARBORO, NC; Owner: RADIO ONE LICENSES, LLC)
- W276AX (103.1 FM; PRINCETON, ETC., NC; Owner: GRACE CHRISTIAN SCHOOL)
- WSFL-FM (106.5 FM; NEW BERN, NC; Owner: WSFL LICENSE LIMITED PARTNERSHIP)
- WIKS (101.9 FM; NEW BERN, NC; Owner: WIKS LICENSE LIMITED PARTNERSHIP)
- WZBR (97.7 FM; KINSTON, NC; Owner: ABG NORTH CAROLINA, LLC)
- WXNR (99.5 FM; GRIFTON, NC; Owner: WXNR LICENSE LIMITED PARTNERSHIP)
- WAGO (88.7 FM; SNOW HILL, NC; Owner: PATHWAY CHRISTIAN ACADEMY, INC.)
- WRQM (90.9 FM; ROCKY MOUNT, NC; Owner: BOARD OF TRUSTEES UNIVERSITY OF NC AT CHAPEL HILL)
- W287AI (105.3 FM; GOLDSBORO, NC; Owner: BIBLE BROADCASTING NETWORK, INC.)
TV broadcast stations around Walnut Creek:
- WITN-TV (Channel 7; WASHINGTON, NC; Owner: WITN LICENSEE CORP.)
- WNCT-TV (Channel 9; GREENVILLE, NC; Owner: MEDIA GENERAL COMMUNICATIONS, INC.)
- WHFL-LP (Channel 56; GOLDSBORO, NC; Owner: FREE LIFE MINISTRIES, INC.)
- WUNK-TV (Channel 25; GREENVILLE, NC; Owner: UNIVERSITY OF NORTH CAROLINA)
- WCTI-TV (Channel 12; NEW BERN, NC; Owner: EASTERN NORTH CAROLINA BROADCASTING CORPORATION)
- WUNM-TV (Channel 19; JACKSONVILLE, NC; Owner: UNIVERSITY OF NORTH CAROLINA)
- WTVD (Channel 11; DURHAM, NC; Owner: ABC, INC.)
- WRAL-TV (Channel 5; RALEIGH, NC; Owner: CAPITOL BROADCASTING COMPANY, INC.)
- W63CW (Channel 63; GOLDSBORO, NC; Owner: TRINITY BROADCASTING NETWORK)
- WNCN (Channel 17; GOLDSBORO, NC; Owner: OUTLET BROADCASTING, INC.)
- WRAY-TV (Channel 30; WILSON, NC; Owner: WRAY, INC.)
- WLFL (Channel 22; RALEIGH, NC; Owner: WLFL LICENSEE, LLC)
- W64AZ (Channel 64; KINSTON-GREENVILLE, NC; Owner: GOCOM TELEVISION, L.P.,)
- WRDC (Channel 28; DURHAM, NC; Owner: RALEIGH (WRDC-TV) LICENSEE, INC.)
- WRAZ (Channel 50; RALEIGH, NC; Owner: WRAZ-TV, INC.)
- WECT (Channel 6; WILMINGTON, NC; Owner: RAYCOM AMERICA, INC.)
- WRPX (Channel 47; ROCKY MOUNT, NC; Owner: PAXSON RALEIGH LICENSE, INC.)
- WYDO (Channel 14; GREENVILLE, NC; Owner: PIEDMONT TELEVISION OF EASTERN CAROLINA LICENSE LLC)
- WEPX (Channel 38; GREENVILLE, NC; Owner: PAXSON GREENVILLE LICENSE, INC.)
- National Bridge Inventory (NBI) Statistics
- 12Number of bridges
- 138ft / 41.8mTotal length
- 124,930Total average daily traffic
- 15,355Total average daily truck traffic
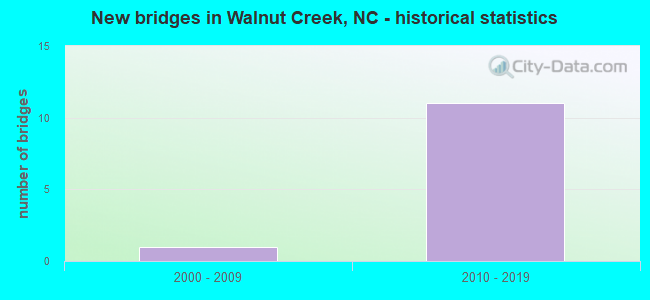
- New bridges - historical statistics
- 12000-2009
- 112010-2019
FCC Registered Antenna Towers:
10 (See the full list of FCC Registered Antenna Towers in Walnut Creek)FCC Registered Microwave Towers:
1- SLEEPY CREEK, Arrington Bridge Rd (Lat: 35.262806 Lon: -77.957583), Type: Gtower, Structure height: 84.1 m, Overall height: 85.6 m, Call Sign: WQOF770,
Assigned Frequencies: 10915.0 MHz, Grant Date: 08/17/2021, Expiration Date: 09/13/2031, Certifier: Steven T Campbell, Registrant: Wilkinson Barker Knauer, LLP, 1800 M Street Nw, Suite 800n, Washington, DC 20036, Phone: (202) 383-3420, Fax: (202) 783-5851, Email:
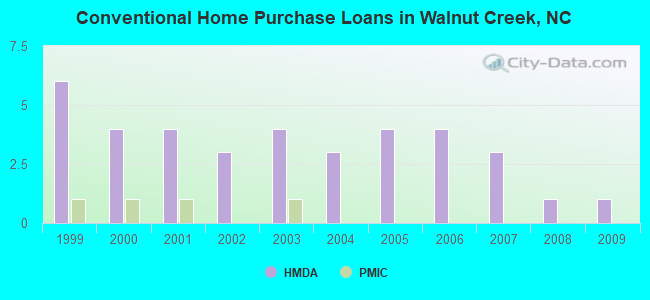
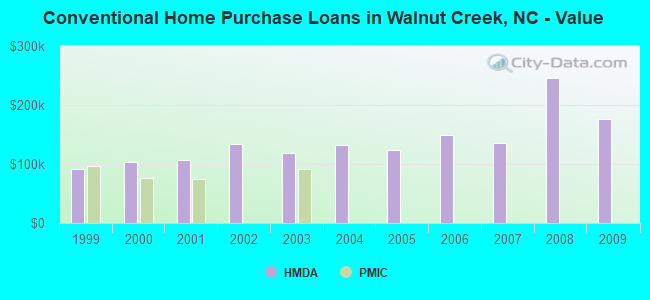
| Home Mortgage Disclosure Act Aggregated Statistics For Year 2009 (Based on 1 partial tract) | ||||||
| A) FHA, FSA/RHS & VA Home Purchase Loans | B) Conventional Home Purchase Loans | C) Refinancings | ||||
|---|---|---|---|---|---|---|
| Number | Average Value | Number | Average Value | Number | Average Value | |
| LOANS ORIGINATED | 2 | $133,845 | 1 | $175,900 | 5 | $176,572 |
| APPLICATIONS APPROVED, NOT ACCEPTED | 0 | $0 | 0 | $0 | 0 | $0 |
| APPLICATIONS DENIED | 0 | $0 | 0 | $0 | 1 | $132,710 |
| APPLICATIONS WITHDRAWN | 0 | $0 | 0 | $0 | 1 | $184,820 |
| FILES CLOSED FOR INCOMPLETENESS | 0 | $0 | 0 | $0 | 0 | $0 |
Detailed HMDA statistics for the following Tracts: 0004.00
| Private Mortgage Insurance Companies Aggregated Statistics For Year 2003 (Based on 1 partial tract) | ||||
| A) Conventional Home Purchase Loans | B) Refinancings | |||
|---|---|---|---|---|
| Number | Average Value | Number | Average Value | |
| LOANS ORIGINATED | 1 | $91,050 | 1 | $129,290 |
| APPLICATIONS APPROVED, NOT ACCEPTED | 0 | $0 | 0 | $0 |
| APPLICATIONS DENIED | 0 | $0 | 0 | $0 |
| APPLICATIONS WITHDRAWN | 0 | $0 | 0 | $0 |
| FILES CLOSED FOR INCOMPLETENESS | 0 | $0 | 0 | $0 |
Detailed PMIC statistics for the following Tracts: 0004.00
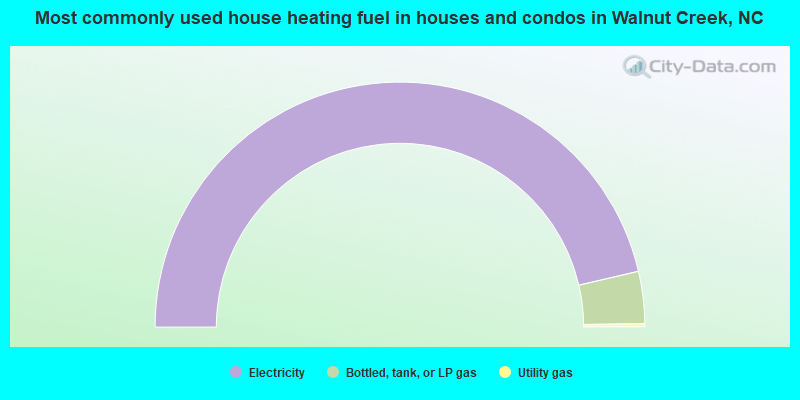
- 92.7%Electricity
- 6.9%Bottled, tank, or LP gas
- 0.4%Utility gas
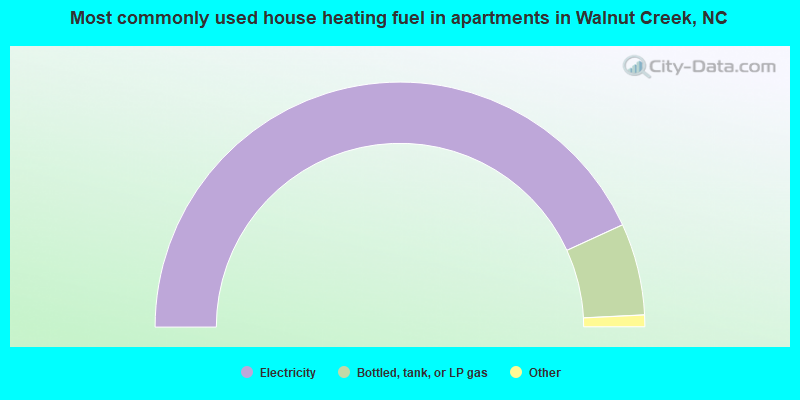
- 87.7%Electricity
- 12.3%Bottled, tank, or LP gas
Walnut Creek compared to North Carolina state average:
- Median household income significantly above state average.
- Median house value above state average.
- Unemployed percentage significantly below state average.
- Black race population percentage significantly below state average.
- Hispanic race population percentage significantly below state average.
- Median age above state average.
- Renting percentage significantly below state average.
- Number of rooms per house significantly above state average.
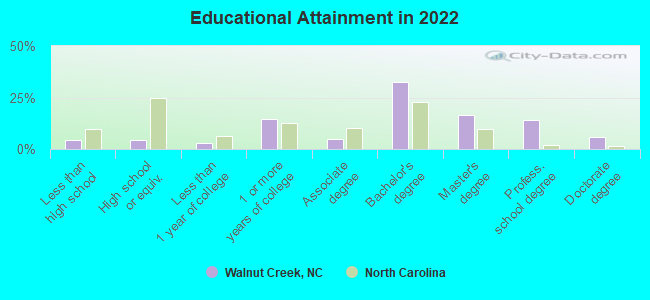
- Percentage of population with a bachelor's degree or higher significantly above state average.