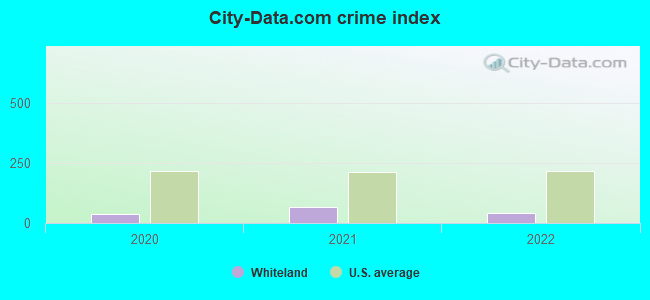
The City-Data.com crime index weighs serious crimes and violent crimes more heavily. Higher means more crime, U.S. average is 246.1. It adjusts for the number of visitors and daily workers commuting into cities.
Latest news from Whiteland, IN collected exclusively by city-data.com from local newspapers, TV, and radio stations
Ancestries: German (15.6%), English (14.2%), American (12.3%), Irish (11.9%), European (4.5%), French Canadian (2.4%).
Current Local Time: EST time zone
Incorporated on 05/03/1886
Elevation: 800 feet
Land area: 2.27 square miles.
Population density: 2,268 people per square mile (low).
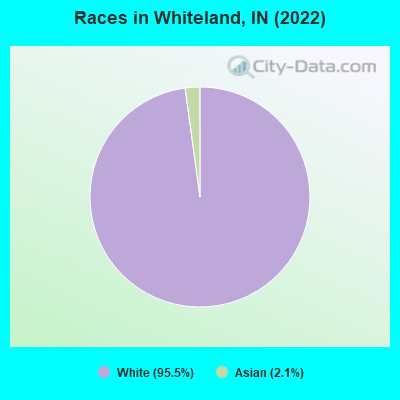
103 residents are foreign born (1.8% Asia).
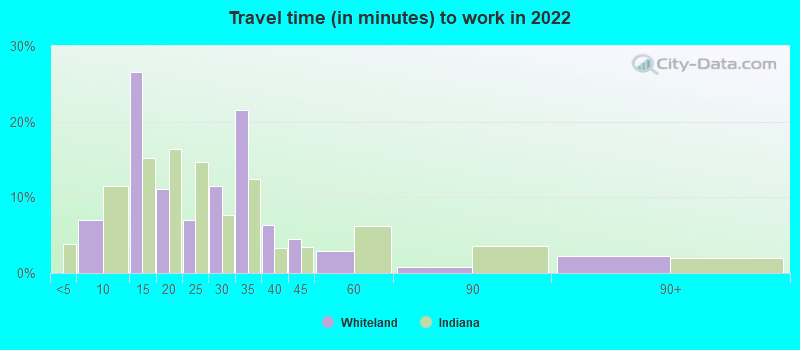
This town:
2.4%
Indiana:
5.6%
Median real estate property taxes paid for housing units with mortgages in 2022: $1,509 (0.8%) Median real estate property taxes paid for housing units with no mortgage in 2022: $1,759 (0.8%)
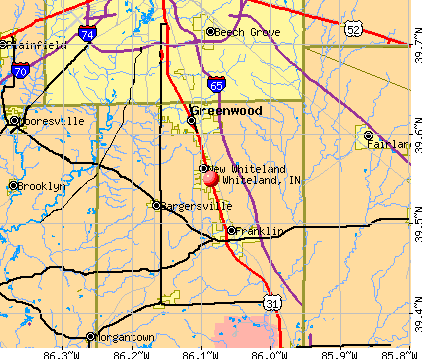
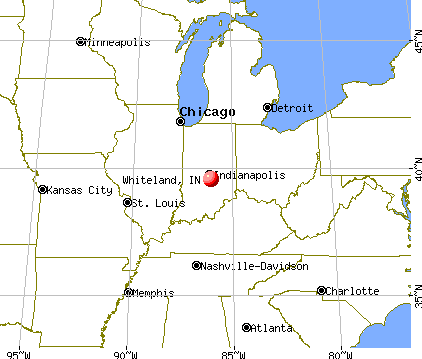
Nearest city with pop. 50,000+: Indianapolis, IN (17.0 miles , pop. 781,870).
Nearest city with pop. 1,000,000+: Chicago, IL (179.2 miles , pop. 2,896,016).
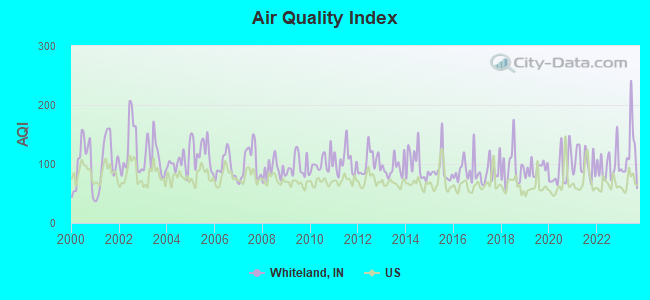
Air Quality Index (AQI) level in 2023 was 118. This is significantly worse than average.
City:
118
U.S.:
73
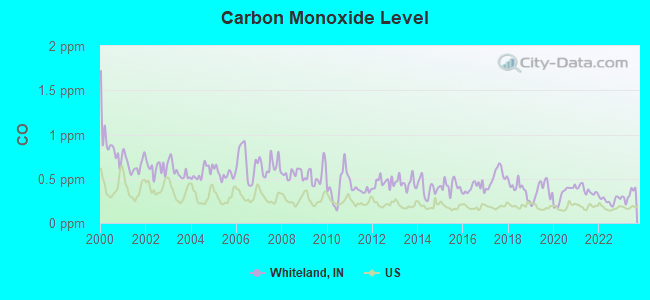
Carbon Monoxide (CO) [ppm] level in 2023 was 0.319. This is worse than average.Closest monitor was 14.8 miles away from the city center.
City:
0.319
U.S.:
0.251
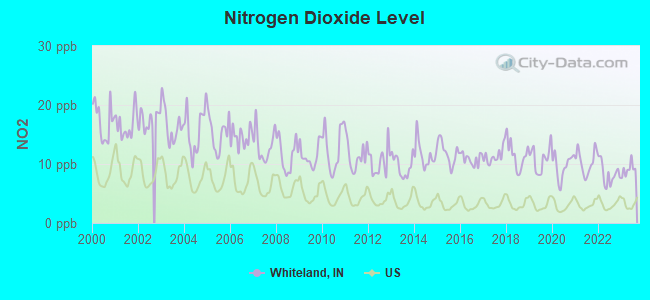
Nitrogen Dioxide (NO2) [ppb] level in 2023 was 9.07. This is significantly worse than average.Closest monitor was 11.7 miles away from the city center.
City:
9.07
U.S.:
5.11
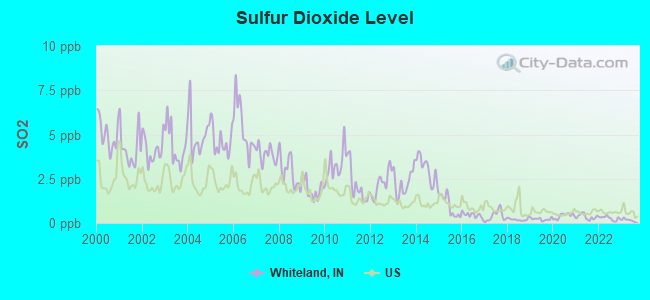
Sulfur Dioxide (SO2) [ppb] level in 2023 was 0.165. This is significantly better than average.Closest monitor was 11.0 miles away from the city center.
City:
0.165
U.S.:
1.515
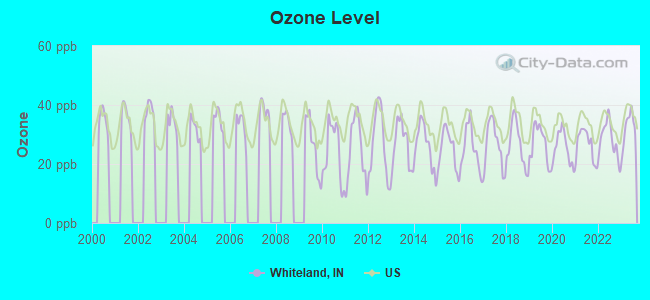
Ozone [ppb] level in 2023 was 32.1. This is about average.Closest monitor was 5.7 miles away from the city center.
City:
32.1
U.S.:
33.3
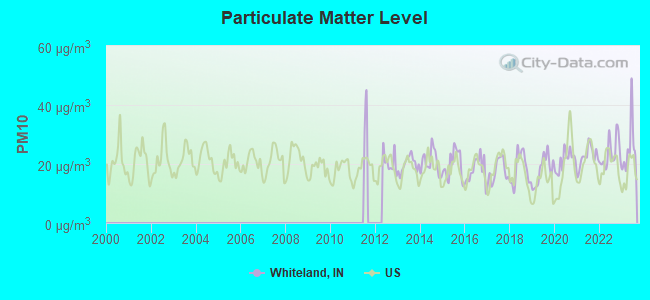
Particulate Matter (PM10) [µg/m3] level in 2023 was 25.4. This is worse than average.Closest monitor was 11.0 miles away from the city center.
City:
25.4
U.S.:
19.2
Particulate Matter (PM2.5) [µg/m3] level in 2023 was 13.5. This is significantly worse than average.Closest monitor was 11.0 miles away from the city center.
City:
13.5
U.S.:
8.1
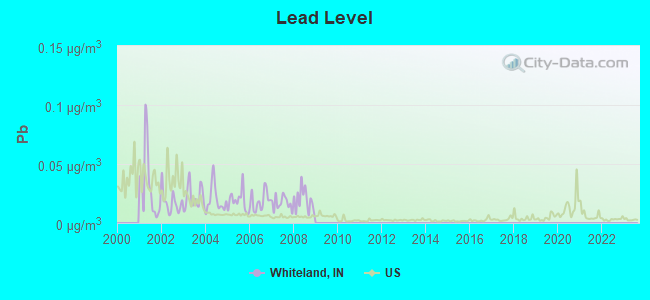
Lead (Pb) [µg/m3] level in 2008 was 0.0196. This is significantly worse than average.Closest monitor was 11.0 miles away from the city center.
City:
0.0196
U.S.:
0.0093
Tornado activity:
Whiteland-area historical tornado activity is slightly above Indiana state average. It is 124% greater than the overall U.S. average.
On 5/14/1972, a category F4 (max. wind speeds 207-260 mph) tornado 15.3 miles away from the Whiteland town center injured 20 peopleand causedbetween $50,000 and $500,000 in damages.
On 4/25/1961, a category F4 tornado 15.4 miles away from the town center injured 7 peopleand causedbetween $500,000 and $5,000,000 in damages.
Earthquake activity:
Whiteland-area historical earthquake activity is significantly above Indiana state average. It is 86% greater than the overall U.S. average.
On 4/18/2008 at 09:36:59, a magnitude 5.4 (5.1 MB, 4.8 MS, 5.4 MW, 5.2 MW, Class: Moderate, Intensity: VI - VII) earthquake occurred 123.0 miles away from Whiteland center On 4/18/2008 at 09:36:59, a magnitude 5.2 (5.2 MW, Depth: 8.9 mi) earthquake occurred 123.0 miles away from Whiteland center On 6/10/1987 at 23:48:54, a magnitude 5.1 (4.9 MB, 4.4 MS, 4.6 MS, 5.1 LG) earthquake occurred 108.8 miles away from the city center On 7/27/1980 at 18:52:21, a magnitude 5.2 (5.1 MB, 4.7 MS, 5.0 UK, 5.2 UK) earthquake occurred 148.2 miles away from Whiteland center On 6/18/2002 at 17:37:15, a magnitude 5.0 (4.3 MB, 4.6 MW, 5.0 LG) earthquake occurred 141.5 miles away from Whiteland center On 4/18/2008 at 15:14:16, a magnitude 4.8 (4.5 MB, 4.8 MW, 4.6 MW, Class: Light, Intensity: IV - V) earthquake occurred 120.3 miles away from the city center Magnitude types: regional Lg-wave magnitude (LG), body-wave magnitude (MB), surface-wave magnitude (MS), moment magnitude (MW)
Natural disasters:
The number of natural disasters in Johnson County (13) is near the US average (15). Major Disasters (Presidential) Declared: 9 Emergencies Declared: 3
Causes of natural disasters: Floods: 6, Storms: 6, Tornadoes: 4, Winter Storms: 3, Blizzard: 1, Hurricane: 1, Snow: 1, Snowstorm: 1, Other: 1 (Note: some incidents may be assigned to more than one category).
Hospitals and medical centers near Whiteland:
GREENWOOD VILLAGE SOUTH (Nursing Home, about 4 miles away; GREENWOOD, IN)
ST FRANCIS HOME HEALTH AND HOSPICE (Home Health Center, about 5 miles away; GREENWOOD, IN)
ST FRANCIS HOSPICE (Hospital, about 5 miles away; GREENWOOD, IN)
AMERICARE HOME HEALTH SERVICES (Home Health Center, about 5 miles away; FRANKLIN, IN)
HICKORY CREEK AT FRANKLIN (Nursing Home, about 5 miles away; FRANKLIN, IN)
AMERICARE HOSPICE (Hospital, about 5 miles away; FRANKLIN, IN)
RECORDS AUTUMN CARE RETIREMEN (Nursing Home, about 5 miles away; FRANKLIN, IN)
Amtrak station near Whiteland:
16 miles: INDIANAPOLIS (350 S. ILLINOIS ST.) . Services: ticket office, partially wheelchair accessible, public payphones, full-service food facilities, free short-term parking, paid long-term parking, call for car rental service, taxi stand, intercity bus service.
Churches in Whiteland include: Church of God (A), Victory Baptist Church (B), Solid Rock Church (C), Whiteland United Methodist Church (D), Saint Thomas Episcopal Church (E). Display/hide their locations on the map
Birthplace of: George Crowe - MLB player, David Inabnit - College basketball player (Chicago St Cougars), Jim Duggan (baseball) - Baseball player.
Johnson County has a predicted average indoor radon screening level greater than 4 pCi/L (pico curies per liter) - Highest Potential
Drinking water stations with addresses in Whiteland and their reported violations in the past:
OLD UNION UNITED CHURCH (Population served: 25, Groundwater):
Past monitoring violations:
2 routine major monitoring violations
Average household size:
This town:
2.8 people
Indiana:
2.5 people
Percentage of family households:
This town:
79.2%
Whole state:
66.9%
Percentage of households with unmarried partners:
This town:
7.0%
Whole state:
6.9%
Likely homosexual households (counted as self-reported same-sex unmarried-partner households)
Lesbian couples: 0.1% of all households
Gay men: 0.1% of all households
Banks with branches in Whiteland (2011 data):
MainSource Bank: Whiteland Branch at 989 North U.S. 31, Ste. #1300, branch established on 1999/07/28. Info updated 2009/12/09: Bank assets: $2,729.1 mil, Deposits: $2,167.0 mil, headquarters in Greensburg, IN, positive income, 86 total offices, Holding Company: Mainsource Financial Group, Inc.
KeyBank National Association: Whiteland Branch at 39 N. Us Highway 31, branch established on 1966/02/03. Info updated 2008/03/03: Bank assets: $86,198.8 mil, Deposits: $64,214.8 mil, headquarters in Cleveland, OH, positive income, Commercial Lending Specialization, 1067 total offices, Holding Company: Keycorp
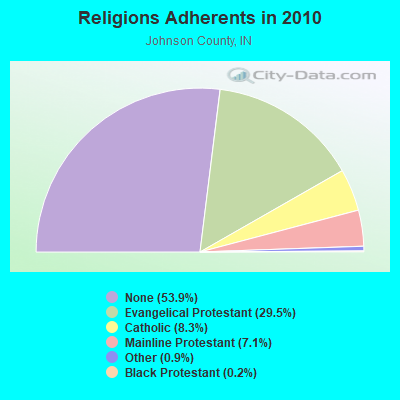
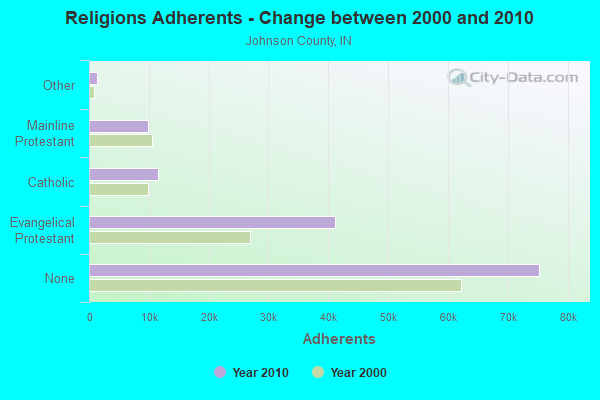
Religion statistics for Whiteland, IN (based on Johnson County data)
Religion
Adherents
Congregations
Evangelical Protestant
41,166
98
Catholic
11,589
4
Mainline Protestant
9,942
31
Other
1,325
3
Black Protestant
314
2
Orthodox
27
1
None
75,291
-
Source: Clifford Grammich, Kirk Hadaway, Richard Houseal, Dale E.Jones, Alexei Krindatch, Richie Stanley and Richard H.Taylor. 2012. 2010 U.S.Religion Census: Religious Congregations & Membership Study. Association of Statisticians of American Religious Bodies. Jones, Dale E., et al. 2002. Congregations and Membership in the United States 2000. Nashville, TN: Glenmary Research Center. Graphs represent county-level data
41 N Us 31 (Lat: 39.550056 Lon: -86.086917), Type: Pole, Structure height: 5 m, Overall height: 12 m, Call Sign: WPJR729, Assigned Frequencies: 47.4200 MHz, Grant Date: 06/28/2001, Expiration Date: 09/25/2011, Cancellation Date: 08/10/2011, Certifier: Robert J Bavis Iii, Registrant: American National Red Cross, 2025 E Street Nw, Nw2-131, Washington, DC 20006, Phone: (202) 303-4126, Fax: (202) 303-0230, Email:
260 N Front St (Lat: 39.553667 Lon: -86.078583), Call Sign: KZC221, Licensee ID: L00056806, Assigned Frequencies: 451.725 MHz, 451.725 MHz, Grant Date: 07/05/2000, Expiration Date: 08/27/2005, Cancellation Date: 06/10/2004, Registrant: Joe R Kelsay, Whiteland, IN 46184, Phone: (317) 535-9150
Aircraft: TRUITT JAMES B VANS RV-8A (Category: Land, Seats: 2, Weight: Up to 12,499 Pounds), Engine: AMA/EXPR UNKNOWN ENG (Reciprocating) N-Number: 627TT, N627TT, N-627TT, Serial Number: 81610, Year manufactured: 2003, Airworthiness Date: 09/15/2003, Certificate Issue Date: 05/12/2003 Registrant (Co-Owned): James B Truitt, 213 Park Forest Dr N, Whiteland, IN 46184, Other Owners: Terri A Truitt
Aircraft: BEECH D55 (Category: Land, Engines: 2, Seats: 6, Weight: Up to 12,499 Pounds, Speed: 165 mph), Engine: CONT MOTOR IO 520 SERIES (285 HP) (Reciprocating) N-Number: 377W, N377W, N-377W, Serial Number: TE-683, Airworthiness Date: 06/09/1976, Certificate Issue Date: 05/04/2016 Registrant (LLC): Bradley Aviation LLC, 6432 N 25 W, Whiteland, IN 46184
Aircraft: CESSNA T337G (Category: Land, Engines: 2, Seats: 6, Weight: Up to 12,499 Pounds, Speed: 142 mph), Engine: CONT MOTOR IO-360 SER (300 HP) (Reciprocating) N-Number: 8CS, N8CS, N-8CS, Serial Number: P3370103, Year manufactured: 1973, Airworthiness Date: 05/08/1973, Certificate Issue Date: 03/27/2012 Registrant (Corporation): Bradley Aviation LLC, 6432 N 25 W, Whiteland, IN 46184
Aircraft: CESSNA 310K (Category: Land, Engines: 2, Seats: 6, Weight: Up to 12,499 Pounds, Speed: 167 mph), Engine: CONT MOTOR I0-470 SERIES (260 HP) (Reciprocating) N-Number: 969GT, N969GT, N-969GT, Serial Number: 310K0194, Year manufactured: 1966, Airworthiness Date: 07/16/1966, Certificate Issue Date: 12/03/2008 Registrant (Corporation): Three Ten LLC, 2986 Branch St, Whiteland, IN 46184 Deregistered:Cancel Date: 03/08/2018
Home Mortgage Disclosure Act Aggregated Statistics For Year 2009 (Based on 1 partial tract)
A) FHA, FSA/RHS & VA Home Purchase Loans
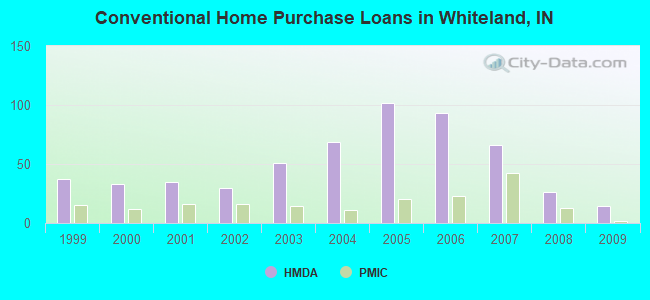
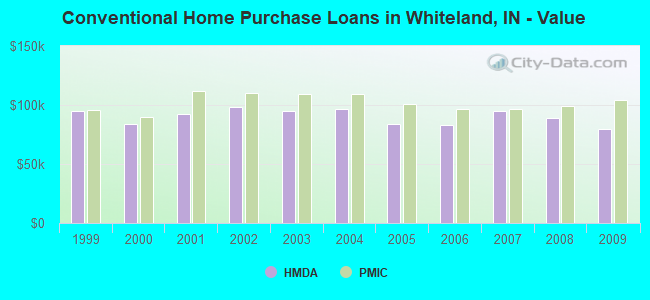
B) Conventional Home Purchase Loans
C) Refinancings
D) Home Improvement Loans
F) Non-occupant Loans on < 5 Family Dwellings (A B C & D)
Number
Average Value
Number
Average Value
Number
Average Value
Number
Average Value
Number
Average Value
LOANS ORIGINATED
37
$95,236
14
$79,693
93
$106,191
4
$30,780
10
$66,335
APPLICATIONS APPROVED, NOT ACCEPTED
4
$107,510
1
$58,890
8
$108,291
0
$0
1
$80,740
APPLICATIONS DENIED
10
$92,075
3
$63,793
38
$107,862
3
$15,020
2
$76,505
APPLICATIONS WITHDRAWN
3
$101,710
1
$114,650
23
$104,484
1
$36,580
1
$94,570
FILES CLOSED FOR INCOMPLETENESS
2
$111,970
0
$0
6
$90,633
0
$0
0
$0
Aggregated Statistics For Year 2008 (Based on 1 partial tract)
A) FHA, FSA/RHS & VA Home Purchase Loans
B) Conventional Home Purchase Loans
C) Refinancings
D) Home Improvement Loans
F) Non-occupant Loans on < 5 Family Dwellings (A B C & D)
G) Loans On Manufactured Home Dwelling (A B C & D)
Number
Average Value
Number
Average Value
Number
Average Value
Number
Average Value
Number
Average Value
Number
Average Value
LOANS ORIGINATED
36
$114,660
26
$88,705
47
$94,241
8
$16,339
17
$64,475
0
$0
APPLICATIONS APPROVED, NOT ACCEPTED
2
$125,355
2
$100,375
7
$92,980
3
$49,070
2
$77,620
0
$0
APPLICATIONS DENIED
9
$102,950
9
$84,066
47
$110,576
16
$29,192
4
$67,360
1
$105,730
APPLICATIONS WITHDRAWN
3
$93,680
4
$81,748
17
$112,444
0
$0
2
$72,490
0
$0
FILES CLOSED FOR INCOMPLETENESS
2
$84,760
0
$0
3
$114,797
0
$0
0
$0
0
$0
Aggregated Statistics For Year 2007 (Based on 1 partial tract)
A) FHA, FSA/RHS & VA Home Purchase Loans
B) Conventional Home Purchase Loans
C) Refinancings
D) Home Improvement Loans
F) Non-occupant Loans on < 5 Family Dwellings (A B C & D)
G) Loans On Manufactured Home Dwelling (A B C & D)
Number
Average Value
Number
Average Value
Number
Average Value
Number
Average Value
Number
Average Value
Number
Average Value
LOANS ORIGINATED
22
$109,010
66
$94,519
70
$95,160
9
$35,490
17
$84,418
1
$79,410
APPLICATIONS APPROVED, NOT ACCEPTED
1
$107,060
4
$99,258
18
$107,609
0
$0
3
$101,860
0
$0
APPLICATIONS DENIED
3
$105,577
12
$84,202
85
$110,265
17
$49,124
3
$86,097
1
$29,000
APPLICATIONS WITHDRAWN
2
$118,885
9
$103,644
29
$98,434
1
$136,060
2
$59,110
0
$0
FILES CLOSED FOR INCOMPLETENESS
0
$0
2
$88,550
10
$111,168
0
$0
1
$102,160
0
$0
Aggregated Statistics For Year 2006 (Based on 1 partial tract)
A) FHA, FSA/RHS & VA Home Purchase Loans
B) Conventional Home Purchase Loans
C) Refinancings
D) Home Improvement Loans
F) Non-occupant Loans on < 5 Family Dwellings (A B C & D)
G) Loans On Manufactured Home Dwelling (A B C & D)
Number
Average Value
Number
Average Value
Number
Average Value
Number
Average Value
Number
Average Value
Number
Average Value
LOANS ORIGINATED
21
$125,205
93
$83,310
79
$82,438
11
$28,956
24
$75,781
0
$0
APPLICATIONS APPROVED, NOT ACCEPTED
2
$126,915
8
$100,372
18
$88,427
2
$10,485
2
$102,380
1
$42,380
APPLICATIONS DENIED
6
$121,562
29
$83,405
102
$106,753
17
$30,282
6
$66,097
1
$13,830
APPLICATIONS WITHDRAWN
4
$116,878
20
$88,194
46
$99,897
3
$36,283
5
$77,978
0
$0
FILES CLOSED FOR INCOMPLETENESS
1
$116,880
6
$94,425
13
$97,147
0
$0
2
$48,400
0
$0
Aggregated Statistics For Year 2005 (Based on 1 partial tract)
A) FHA, FSA/RHS & VA Home Purchase Loans
B) Conventional Home Purchase Loans
C) Refinancings
D) Home Improvement Loans
F) Non-occupant Loans on < 5 Family Dwellings (A B C & D)
Number
Average Value
Number
Average Value
Number
Average Value
Number
Average Value
Number
Average Value
LOANS ORIGINATED
41
$114,321
102
$83,495
83
$95,374
10
$21,993
14
$81,126
APPLICATIONS APPROVED, NOT ACCEPTED
4
$112,975
10
$79,317
14
$96,421
2
$21,860
1
$105,730
APPLICATIONS DENIED
3
$105,130
28
$83,946
87
$103,454
17
$28,078
3
$67,957
APPLICATIONS WITHDRAWN
5
$121,786
14
$87,977
48
$104,415
3
$83,867
4
$75,725
FILES CLOSED FOR INCOMPLETENESS
1
$70,930
6
$82,677
17
$106,671
0
$0
1
$92,790
Aggregated Statistics For Year 2004 (Based on 1 partial tract)
A) FHA, FSA/RHS & VA Home Purchase Loans
B) Conventional Home Purchase Loans
C) Refinancings
D) Home Improvement Loans
F) Non-occupant Loans on < 5 Family Dwellings (A B C & D)
G) Loans On Manufactured Home Dwelling (A B C & D)
Number
Average Value
Number
Average Value
Number
Average Value
Number
Average Value
Number
Average Value
Number
Average Value
LOANS ORIGINATED
58
$121,301
69
$96,429
126
$90,696
12
$31,041
13
$70,895
1
$60,220
APPLICATIONS APPROVED, NOT ACCEPTED
3
$115,093
5
$110,098
26
$106,618
3
$4,907
2
$72,270
0
$0
APPLICATIONS DENIED
6
$118,812
25
$90,880
82
$105,878
16
$30,391
4
$99,258
2
$16,060
APPLICATIONS WITHDRAWN
6
$112,045
9
$107,312
45
$96,001
3
$64,240
2
$70,705
0
$0
FILES CLOSED FOR INCOMPLETENESS
3
$98,290
2
$69,815
19
$114,531
1
$26,770
0
$0
0
$0
Aggregated Statistics For Year 2003 (Based on 1 partial tract)
A) FHA, FSA/RHS & VA Home Purchase Loans
B) Conventional Home Purchase Loans
C) Refinancings
D) Home Improvement Loans
F) Non-occupant Loans on < 5 Family Dwellings (A B C & D)
Number
Average Value
Number
Average Value
Number
Average Value
Number
Average Value
Number
Average Value
LOANS ORIGINATED
55
$116,951
51
$94,809
238
$93,936
11
$16,344
22
$83,806
APPLICATIONS APPROVED, NOT ACCEPTED
4
$108,402
5
$132,760
40
$95,120
3
$5,353
4
$102,715
APPLICATIONS DENIED
6
$113,458
11
$83,583
96
$95,568
9
$16,407
5
$70,306
APPLICATIONS WITHDRAWN
1
$145,430
4
$83,978
36
$99,765
0
$0
2
$88,330
FILES CLOSED FOR INCOMPLETENESS
1
$164,610
2
$135,170
10
$91,406
0
$0
0
$0
Aggregated Statistics For Year 2002 (Based on 1 partial tract)
A) FHA, FSA/RHS & VA Home Purchase Loans
B) Conventional Home Purchase Loans
C) Refinancings
D) Home Improvement Loans
F) Non-occupant Loans on < 5 Family Dwellings (A B C & D)
Number
Average Value
Number
Average Value
Number
Average Value
Number
Average Value
Number
Average Value
LOANS ORIGINATED
41
$105,367
30
$98,172
177
$90,125
8
$13,216
25
$70,484
APPLICATIONS APPROVED, NOT ACCEPTED
1
$173,090
5
$103,228
36
$84,871
2
$19,180
2
$100,820
APPLICATIONS DENIED
4
$107,845
9
$91,450
58
$88,566
9
$11,500
0
$0
APPLICATIONS WITHDRAWN
3
$127,733
3
$68,103
26
$105,726
3
$14,573
4
$92,900
FILES CLOSED FOR INCOMPLETENESS
0
$0
2
$69,815
13
$103,872
0
$0
0
$0
Aggregated Statistics For Year 2001 (Based on 1 partial tract)
A) FHA, FSA/RHS & VA Home Purchase Loans
B) Conventional Home Purchase Loans
C) Refinancings
D) Home Improvement Loans
F) Non-occupant Loans on < 5 Family Dwellings (A B C & D)
Number
Average Value
Number
Average Value
Number
Average Value
Number
Average Value
Number
Average Value
LOANS ORIGINATED
44
$99,369
35
$92,394
141
$91,868
15
$14,245
11
$78,919
APPLICATIONS APPROVED, NOT ACCEPTED
2
$122,010
3
$66,170
31
$77,808
4
$32,230
2
$60,895
APPLICATIONS DENIED
2
$98,140
7
$73,734
69
$76,425
19
$14,064
4
$67,472
APPLICATIONS WITHDRAWN
2
$113,980
4
$105,280
40
$82,194
4
$17,620
3
$70,930
FILES CLOSED FOR INCOMPLETENESS
0
$0
0
$0
12
$100,670
0
$0
0
$0
Aggregated Statistics For Year 2000 (Based on 1 partial tract)
A) FHA, FSA/RHS & VA Home Purchase Loans
B) Conventional Home Purchase Loans
C) Refinancings
D) Home Improvement Loans
F) Non-occupant Loans on < 5 Family Dwellings (A B C & D)
Number
Average Value
Number
Average Value
Number
Average Value
Number
Average Value
Number
Average Value
LOANS ORIGINATED
26
$99,326
33
$84,015
50
$70,796
20
$14,186
7
$83,803
APPLICATIONS APPROVED, NOT ACCEPTED
1
$118,660
4
$93,122
18
$78,266
7
$24,409
1
$85,650
APPLICATIONS DENIED
2
$75,615
9
$57,746
48
$65,846
16
$21,664
3
$56,953
APPLICATIONS WITHDRAWN
5
$115,718
5
$87,882
21
$67,510
1
$66,470
1
$46,840
FILES CLOSED FOR INCOMPLETENESS
0
$0
0
$0
7
$78,004
0
$0
0
$0
Aggregated Statistics For Year 1999 (Based on 1 partial tract)
A) FHA, FSA/RHS & VA Home Purchase Loans
B) Conventional Home Purchase Loans
C) Refinancings
D) Home Improvement Loans
F) Non-occupant Loans on < 5 Family Dwellings (A B C & D)
Detailed PMIC statistics for the following Tracts:6105.00
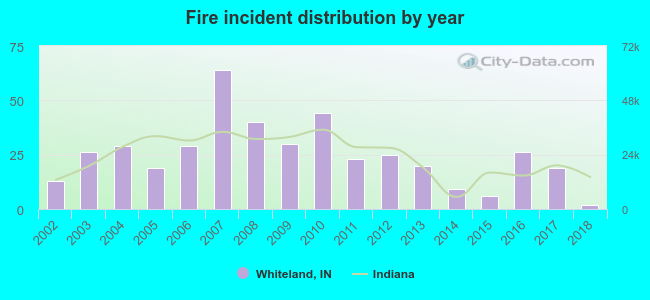
2002 - 2018 National Fire Incident Reporting System (NFIRS) incidents
Based on the data from the years 2002 - 2018 the average number of fires per year is 25. The highest number of fire incidents - 64 took place in 2007, and the least - 2 in 2018. The data has a declining trend.
When looking into fire subcategories, the most reports belonged to: Structure Fires (35.6%), and Outside Fires (31.6%).
Fire incident types reported to NFIRS in Whiteland, IN


 Recent articles from our blog. Our writers, many of them Ph.D. graduates or candidates, create easy-to-read articles on a wide variety of topics.

 (17.0 miles


 Based on the data from the years 2002 - 2018 the average number of fires per year is 25. The highest number of fire incidents - 64 took place in 2007, and the least - 2 in 2018. The data has a declining trend.
 When looking into fire subcategories, the most reports belonged to: Structure Fires (35.6%), and Outside Fires (31.6%).