Willow Springs, Illinois Submit your own pictures of this village and show them to the world
OSM Map
General Map
Google Map
MSN Map
OSM Map
General Map
Google Map
MSN Map
OSM Map
General Map
Google Map
MSN Map
OSM Map
General Map
Google Map
MSN Map
Please wait while loading the map...
Population in 2022: 5,745 (100% urban, 0% rural). Population change since 2000: +14.3%Males: 2,897 Females: 2,848
March 2022 cost of living index in Willow Springs: 101.4 (near average, U.S. average is 100) Percentage of residents living in poverty in 2022: 3.8%for White Non-Hispanic residents , 2.4% for Hispanic or Latino residents , 33.5% for other race residents )
Profiles of local businesses
Business Search - 14 Million verified businesses
Data:
Median household income ($)
Median household income (% change since 2000)
Household income diversity
Ratio of average income to average house value (%)
Ratio of average income to average rent
Median household income ($) - White
Median household income ($) - Black or African American
Median household income ($) - Asian
Median household income ($) - Hispanic or Latino
Median household income ($) - American Indian and Alaska Native
Median household income ($) - Multirace
Median household income ($) - Other Race
Median household income for houses/condos with a mortgage ($)
Median household income for apartments without a mortgage ($)
Races - White alone (%)
Races - White alone (% change since 2000)
Races - Black alone (%)
Races - Black alone (% change since 2000)
Races - American Indian alone (%)
Races - American Indian alone (% change since 2000)
Races - Asian alone (%)
Races - Asian alone (% change since 2000)
Races - Hispanic (%)
Races - Hispanic (% change since 2000)
Races - Native Hawaiian and Other Pacific Islander alone (%)
Races - Native Hawaiian and Other Pacific Islander alone (% change since 2000)
Races - Two or more races (%)
Races - Two or more races (% change since 2000)
Races - Other race alone (%)
Races - Other race alone (% change since 2000)
Racial diversity
Unemployment (%)
Unemployment (% change since 2000)
Unemployment (%) - White
Unemployment (%) - Black or African American
Unemployment (%) - Asian
Unemployment (%) - Hispanic or Latino
Unemployment (%) - American Indian and Alaska Native
Unemployment (%) - Multirace
Unemployment (%) - Other Race
Population density (people per square mile)
Population - Males (%)
Population - Females (%)
Population - Males (%) - White
Population - Males (%) - Black or African American
Population - Males (%) - Asian
Population - Males (%) - Hispanic or Latino
Population - Males (%) - American Indian and Alaska Native
Population - Males (%) - Multirace
Population - Males (%) - Other Race
Population - Females (%) - White
Population - Females (%) - Black or African American
Population - Females (%) - Asian
Population - Females (%) - Hispanic or Latino
Population - Females (%) - American Indian and Alaska Native
Population - Females (%) - Multirace
Population - Females (%) - Other Race
Coronavirus confirmed cases (Apr 18, 2024)
Deaths caused by coronavirus (Apr 18, 2024)
Coronavirus confirmed cases (per 100k population) (Apr 18, 2024)
Deaths caused by coronavirus (per 100k population) (Apr 18, 2024)
Daily increase in number of cases (Apr 18, 2024)
Weekly increase in number of cases (Apr 18, 2024)
Cases doubled (in days) (Apr 18, 2024)
Hospitalized patients (Apr 18, 2022)
Negative test results (Apr 18, 2022)
Total test results (Apr 18, 2022)
COVID Vaccine doses distributed (per 100k population) (Sep 19, 2023)
COVID Vaccine doses administered (per 100k population) (Sep 19, 2023)
COVID Vaccine doses distributed (Sep 19, 2023)
COVID Vaccine doses administered (Sep 19, 2023)
Likely homosexual households (%)
Likely homosexual households (% change since 2000)
Likely homosexual households - Lesbian couples (%)
Likely homosexual households - Lesbian couples (% change since 2000)
Likely homosexual households - Gay men (%)
Likely homosexual households - Gay men (% change since 2000)
Cost of living index
Median gross rent ($)
Median contract rent ($)
Median monthly housing costs ($)
Median house or condo value ($)
Median house or condo value ($ change since 2000)
Mean house or condo value by units in structure - 1, detached ($)
Mean house or condo value by units in structure - 1, attached ($)
Mean house or condo value by units in structure - 2 ($)
Mean house or condo value by units in structure by units in structure - 3 or 4 ($)
Mean house or condo value by units in structure - 5 or more ($)
Mean house or condo value by units in structure - Boat, RV, van, etc. ($)
Mean house or condo value by units in structure - Mobile home ($)
Median house or condo value ($) - White
Median house or condo value ($) - Black or African American
Median house or condo value ($) - Asian
Median house or condo value ($) - Hispanic or Latino
Median house or condo value ($) - American Indian and Alaska Native
Median house or condo value ($) - Multirace
Median house or condo value ($) - Other Race
Median resident age
Resident age diversity
Median resident age - Males
Median resident age - Females
Median resident age - White
Median resident age - Black or African American
Median resident age - Asian
Median resident age - Hispanic or Latino
Median resident age - American Indian and Alaska Native
Median resident age - Multirace
Median resident age - Other Race
Median resident age - Males - White
Median resident age - Males - Black or African American
Median resident age - Males - Asian
Median resident age - Males - Hispanic or Latino
Median resident age - Males - American Indian and Alaska Native
Median resident age - Males - Multirace
Median resident age - Males - Other Race
Median resident age - Females - White
Median resident age - Females - Black or African American
Median resident age - Females - Asian
Median resident age - Females - Hispanic or Latino
Median resident age - Females - American Indian and Alaska Native
Median resident age - Females - Multirace
Median resident age - Females - Other Race
Commute - mean travel time to work (minutes)
Travel time to work - Less than 5 minutes (%)
Travel time to work - Less than 5 minutes (% change since 2000)
Travel time to work - 5 to 9 minutes (%)
Travel time to work - 5 to 9 minutes (% change since 2000)
Travel time to work - 10 to 19 minutes (%)
Travel time to work - 10 to 19 minutes (% change since 2000)
Travel time to work - 20 to 29 minutes (%)
Travel time to work - 20 to 29 minutes (% change since 2000)
Travel time to work - 30 to 39 minutes (%)
Travel time to work - 30 to 39 minutes (% change since 2000)
Travel time to work - 40 to 59 minutes (%)
Travel time to work - 40 to 59 minutes (% change since 2000)
Travel time to work - 60 to 89 minutes (%)
Travel time to work - 60 to 89 minutes (% change since 2000)
Travel time to work - 90 or more minutes (%)
Travel time to work - 90 or more minutes (% change since 2000)
Marital status - Never married (%)
Marital status - Now married (%)
Marital status - Separated (%)
Marital status - Widowed (%)
Marital status - Divorced (%)
Median family income ($)
Median family income (% change since 2000)
Median non-family income ($)
Median non-family income (% change since 2000)
Median per capita income ($)
Median per capita income (% change since 2000)
Median family income ($) - White
Median family income ($) - Black or African American
Median family income ($) - Asian
Median family income ($) - Hispanic or Latino
Median family income ($) - American Indian and Alaska Native
Median family income ($) - Multirace
Median family income ($) - Other Race
Median year house/condo built
Median year apartment built
Year house built - Built 2005 or later (%)
Year house built - Built 2000 to 2004 (%)
Year house built - Built 1990 to 1999 (%)
Year house built - Built 1980 to 1989 (%)
Year house built - Built 1970 to 1979 (%)
Year house built - Built 1960 to 1969 (%)
Year house built - Built 1950 to 1959 (%)
Year house built - Built 1940 to 1949 (%)
Year house built - Built 1939 or earlier (%)
Average household size
Household density (households per square mile)
Average household size - White
Average household size - Black or African American
Average household size - Asian
Average household size - Hispanic or Latino
Average household size - American Indian and Alaska Native
Average household size - Multirace
Average household size - Other Race
Occupied housing units (%)
Vacant housing units (%)
Owner occupied housing units (%)
Renter occupied housing units (%)
Vacancy status - For rent (%)
Vacancy status - For sale only (%)
Vacancy status - Rented or sold, not occupied (%)
Vacancy status - For seasonal, recreational, or occasional use (%)
Vacancy status - For migrant workers (%)
Vacancy status - Other vacant (%)
Residents with income below the poverty level (%)
Residents with income below 50% of the poverty level (%)
Children below poverty level (%)
Poor families by family type - Married-couple family (%)
Poor families by family type - Male, no wife present (%)
Poor families by family type - Female, no husband present (%)
Poverty status for native-born residents (%)
Poverty status for foreign-born residents (%)
Poverty among high school graduates not in families (%)
Poverty among people who did not graduate high school not in families (%)
Residents with income below the poverty level (%) - White
Residents with income below the poverty level (%) - Black or African American
Residents with income below the poverty level (%) - Asian
Residents with income below the poverty level (%) - Hispanic or Latino
Residents with income below the poverty level (%) - American Indian and Alaska Native
Residents with income below the poverty level (%) - Multirace
Residents with income below the poverty level (%) - Other Race
Air pollution - Air Quality Index (AQI)
Air pollution - CO
Air pollution - NO2
Air pollution - SO2
Air pollution - Ozone
Air pollution - PM10
Air pollution - PM25
Air pollution - Pb
Crime - Murders per 100,000 population
Crime - Rapes per 100,000 population
Crime - Robberies per 100,000 population
Crime - Assaults per 100,000 population
Crime - Burglaries per 100,000 population
Crime - Thefts per 100,000 population
Crime - Auto thefts per 100,000 population
Crime - Arson per 100,000 population
Crime - City-data.com crime index
Crime - Violent crime index
Crime - Property crime index
Crime - Murders per 100,000 population (5 year average)
Crime - Rapes per 100,000 population (5 year average)
Crime - Robberies per 100,000 population (5 year average)
Crime - Assaults per 100,000 population (5 year average)
Crime - Burglaries per 100,000 population (5 year average)
Crime - Thefts per 100,000 population (5 year average)
Crime - Auto thefts per 100,000 population (5 year average)
Crime - Arson per 100,000 population (5 year average)
Crime - City-data.com crime index (5 year average)
Crime - Violent crime index (5 year average)
Crime - Property crime index (5 year average)
1996 Presidential Elections Results (%) - Democratic Party (Clinton)
1996 Presidential Elections Results (%) - Republican Party (Dole)
1996 Presidential Elections Results (%) - Other
2000 Presidential Elections Results (%) - Democratic Party (Gore)
2000 Presidential Elections Results (%) - Republican Party (Bush)
2000 Presidential Elections Results (%) - Other
2004 Presidential Elections Results (%) - Democratic Party (Kerry)
2004 Presidential Elections Results (%) - Republican Party (Bush)
2004 Presidential Elections Results (%) - Other
2008 Presidential Elections Results (%) - Democratic Party (Obama)
2008 Presidential Elections Results (%) - Republican Party (McCain)
2008 Presidential Elections Results (%) - Other
2012 Presidential Elections Results (%) - Democratic Party (Obama)
2012 Presidential Elections Results (%) - Republican Party (Romney)
2012 Presidential Elections Results (%) - Other
2016 Presidential Elections Results (%) - Democratic Party (Clinton)
2016 Presidential Elections Results (%) - Republican Party (Trump)
2016 Presidential Elections Results (%) - Other
2020 Presidential Elections Results (%) - Democratic Party (Biden)
2020 Presidential Elections Results (%) - Republican Party (Trump)
2020 Presidential Elections Results (%) - Other
Ancestries Reported - Arab (%)
Ancestries Reported - Czech (%)
Ancestries Reported - Danish (%)
Ancestries Reported - Dutch (%)
Ancestries Reported - English (%)
Ancestries Reported - French (%)
Ancestries Reported - French Canadian (%)
Ancestries Reported - German (%)
Ancestries Reported - Greek (%)
Ancestries Reported - Hungarian (%)
Ancestries Reported - Irish (%)
Ancestries Reported - Italian (%)
Ancestries Reported - Lithuanian (%)
Ancestries Reported - Norwegian (%)
Ancestries Reported - Polish (%)
Ancestries Reported - Portuguese (%)
Ancestries Reported - Russian (%)
Ancestries Reported - Scotch-Irish (%)
Ancestries Reported - Scottish (%)
Ancestries Reported - Slovak (%)
Ancestries Reported - Subsaharan African (%)
Ancestries Reported - Swedish (%)
Ancestries Reported - Swiss (%)
Ancestries Reported - Ukrainian (%)
Ancestries Reported - United States (%)
Ancestries Reported - Welsh (%)
Ancestries Reported - West Indian (%)
Ancestries Reported - Other (%)
Educational Attainment - No schooling completed (%)
Educational Attainment - Less than high school (%)
Educational Attainment - High school or equivalent (%)
Educational Attainment - Less than 1 year of college (%)
Educational Attainment - 1 or more years of college (%)
Educational Attainment - Associate degree (%)
Educational Attainment - Bachelor's degree (%)
Educational Attainment - Master's degree (%)
Educational Attainment - Professional school degree (%)
Educational Attainment - Doctorate degree (%)
School Enrollment - Nursery, preschool (%)
School Enrollment - Kindergarten (%)
School Enrollment - Grade 1 to 4 (%)
School Enrollment - Grade 5 to 8 (%)
School Enrollment - Grade 9 to 12 (%)
School Enrollment - College undergrad (%)
School Enrollment - Graduate or professional (%)
School Enrollment - Not enrolled in school (%)
School enrollment - Public schools (%)
School enrollment - Private schools (%)
School enrollment - Not enrolled (%)
Median number of rooms in houses and condos
Median number of rooms in apartments
Housing units lacking complete plumbing facilities (%)
Housing units lacking complete kitchen facilities (%)
Density of houses
Urban houses (%)
Rural houses (%)
Households with people 60 years and over (%)
Households with people 65 years and over (%)
Households with people 75 years and over (%)
Households with one or more nonrelatives (%)
Households with no nonrelatives (%)
Population in households (%)
Family households (%)
Nonfamily households (%)
Population in families (%)
Family households with own children (%)
Median number of bedrooms in owner occupied houses
Mean number of bedrooms in owner occupied houses
Median number of bedrooms in renter occupied houses
Mean number of bedrooms in renter occupied houses
Median number of vehichles in owner occupied houses
Mean number of vehichles in owner occupied houses
Median number of vehichles in renter occupied houses
Mean number of vehichles in renter occupied houses
Mortgage status - with mortgage (%)
Mortgage status - with second mortgage (%)
Mortgage status - with home equity loan (%)
Mortgage status - with both second mortgage and home equity loan (%)
Mortgage status - without a mortgage (%)
Average family size
Average family size - White
Average family size - Black or African American
Average family size - Asian
Average family size - Hispanic or Latino
Average family size - American Indian and Alaska Native
Average family size - Multirace
Average family size - Other Race
Geographical mobility - Same house 1 year ago (%)
Geographical mobility - Moved within same county (%)
Geographical mobility - Moved from different county within same state (%)
Geographical mobility - Moved from different state (%)
Geographical mobility - Moved from abroad (%)
Place of birth - Born in state of residence (%)
Place of birth - Born in other state (%)
Place of birth - Native, outside of US (%)
Place of birth - Foreign born (%)
Housing units in structures - 1, detached (%)
Housing units in structures - 1, attached (%)
Housing units in structures - 2 (%)
Housing units in structures - 3 or 4 (%)
Housing units in structures - 5 to 9 (%)
Housing units in structures - 10 to 19 (%)
Housing units in structures - 20 to 49 (%)
Housing units in structures - 50 or more (%)
Housing units in structures - Mobile home (%)
Housing units in structures - Boat, RV, van, etc. (%)
House/condo owner moved in on average (years ago)
Renter moved in on average (years ago)
Year householder moved into unit - Moved in 1999 to March 2000 (%)
Year householder moved into unit - Moved in 1995 to 1998 (%)
Year householder moved into unit - Moved in 1990 to 1994 (%)
Year householder moved into unit - Moved in 1980 to 1989 (%)
Year householder moved into unit - Moved in 1970 to 1979 (%)
Year householder moved into unit - Moved in 1969 or earlier (%)
Means of transportation to work - Drove car alone (%)
Means of transportation to work - Carpooled (%)
Means of transportation to work - Public transportation (%)
Means of transportation to work - Bus or trolley bus (%)
Means of transportation to work - Streetcar or trolley car (%)
Means of transportation to work - Subway or elevated (%)
Means of transportation to work - Railroad (%)
Means of transportation to work - Ferryboat (%)
Means of transportation to work - Taxicab (%)
Means of transportation to work - Motorcycle (%)
Means of transportation to work - Bicycle (%)
Means of transportation to work - Walked (%)
Means of transportation to work - Other means (%)
Working at home (%)
Industry diversity
Most Common Industries - Agriculture, forestry, fishing and hunting, and mining (%)
Most Common Industries - Agriculture, forestry, fishing and hunting (%)
Most Common Industries - Mining, quarrying, and oil and gas extraction (%)
Most Common Industries - Construction (%)
Most Common Industries - Manufacturing (%)
Most Common Industries - Wholesale trade (%)
Most Common Industries - Retail trade (%)
Most Common Industries - Transportation and warehousing, and utilities (%)
Most Common Industries - Transportation and warehousing (%)
Most Common Industries - Utilities (%)
Most Common Industries - Information (%)
Most Common Industries - Finance and insurance, and real estate and rental and leasing (%)
Most Common Industries - Finance and insurance (%)
Most Common Industries - Real estate and rental and leasing (%)
Most Common Industries - Professional, scientific, and management, and administrative and waste management services (%)
Most Common Industries - Professional, scientific, and technical services (%)
Most Common Industries - Management of companies and enterprises (%)
Most Common Industries - Administrative and support and waste management services (%)
Most Common Industries - Educational services, and health care and social assistance (%)
Most Common Industries - Educational services (%)
Most Common Industries - Health care and social assistance (%)
Most Common Industries - Arts, entertainment, and recreation, and accommodation and food services (%)
Most Common Industries - Arts, entertainment, and recreation (%)
Most Common Industries - Accommodation and food services (%)
Most Common Industries - Other services, except public administration (%)
Most Common Industries - Public administration (%)
Occupation diversity
Most Common Occupations - Management, business, science, and arts occupations (%)
Most Common Occupations - Management, business, and financial occupations (%)
Most Common Occupations - Management occupations (%)
Most Common Occupations - Business and financial operations occupations (%)
Most Common Occupations - Computer, engineering, and science occupations (%)
Most Common Occupations - Computer and mathematical occupations (%)
Most Common Occupations - Architecture and engineering occupations (%)
Most Common Occupations - Life, physical, and social science occupations (%)
Most Common Occupations - Education, legal, community service, arts, and media occupations (%)
Most Common Occupations - Community and social service occupations (%)
Most Common Occupations - Legal occupations (%)
Most Common Occupations - Education, training, and library occupations (%)
Most Common Occupations - Arts, design, entertainment, sports, and media occupations (%)
Most Common Occupations - Healthcare practitioners and technical occupations (%)
Most Common Occupations - Health diagnosing and treating practitioners and other technical occupations (%)
Most Common Occupations - Health technologists and technicians (%)
Most Common Occupations - Service occupations (%)
Most Common Occupations - Healthcare support occupations (%)
Most Common Occupations - Protective service occupations (%)
Most Common Occupations - Fire fighting and prevention, and other protective service workers including supervisors (%)
Most Common Occupations - Law enforcement workers including supervisors (%)
Most Common Occupations - Food preparation and serving related occupations (%)
Most Common Occupations - Building and grounds cleaning and maintenance occupations (%)
Most Common Occupations - Personal care and service occupations (%)
Most Common Occupations - Sales and office occupations (%)
Most Common Occupations - Sales and related occupations (%)
Most Common Occupations - Office and administrative support occupations (%)
Most Common Occupations - Natural resources, construction, and maintenance occupations (%)
Most Common Occupations - Farming, fishing, and forestry occupations (%)
Most Common Occupations - Construction and extraction occupations (%)
Most Common Occupations - Installation, maintenance, and repair occupations (%)
Most Common Occupations - Production, transportation, and material moving occupations (%)
Most Common Occupations - Production occupations (%)
Most Common Occupations - Transportation occupations (%)
Most Common Occupations - Material moving occupations (%)
People in Group quarters - Institutionalized population (%)
People in Group quarters - Correctional institutions (%)
People in Group quarters - Federal prisons and detention centers (%)
People in Group quarters - Halfway houses (%)
People in Group quarters - Local jails and other confinement facilities (including police lockups) (%)
People in Group quarters - Military disciplinary barracks (%)
People in Group quarters - State prisons (%)
People in Group quarters - Other types of correctional institutions (%)
People in Group quarters - Nursing homes (%)
People in Group quarters - Hospitals/wards, hospices, and schools for the handicapped (%)
People in Group quarters - Hospitals/wards and hospices for chronically ill (%)
People in Group quarters - Hospices or homes for chronically ill (%)
People in Group quarters - Military hospitals or wards for chronically ill (%)
People in Group quarters - Other hospitals or wards for chronically ill (%)
People in Group quarters - Hospitals or wards for drug/alcohol abuse (%)
People in Group quarters - Mental (Psychiatric) hospitals or wards (%)
People in Group quarters - Schools, hospitals, or wards for the mentally retarded (%)
People in Group quarters - Schools, hospitals, or wards for the physically handicapped (%)
People in Group quarters - Institutions for the deaf (%)
People in Group quarters - Institutions for the blind (%)
People in Group quarters - Orthopedic wards and institutions for the physically handicapped (%)
People in Group quarters - Wards in general hospitals for patients who have no usual home elsewhere (%)
People in Group quarters - Wards in military hospitals for patients who have no usual home elsewhere (%)
People in Group quarters - Juvenile institutions (%)
People in Group quarters - Long-term care (%)
People in Group quarters - Homes for abused, dependent, and neglected children (%)
People in Group quarters - Residential treatment centers for emotionally disturbed children (%)
People in Group quarters - Training schools for juvenile delinquents (%)
People in Group quarters - Short-term care, detention or diagnostic centers for delinquent children (%)
People in Group quarters - Type of juvenile institution unknown (%)
People in Group quarters - Noninstitutionalized population (%)
People in Group quarters - College dormitories (includes college quarters off campus) (%)
People in Group quarters - Military quarters (%)
People in Group quarters - On base (%)
People in Group quarters - Barracks, unaccompanied personnel housing (UPH), (Enlisted/Officer), ;and similar group living quarters for military personnel (%)
People in Group quarters - Transient quarters for temporary residents (%)
People in Group quarters - Military ships (%)
People in Group quarters - Group homes (%)
People in Group quarters - Homes or halfway houses for drug/alcohol abuse (%)
People in Group quarters - Homes for the mentally ill (%)
People in Group quarters - Homes for the mentally retarded (%)
People in Group quarters - Homes for the physically handicapped (%)
People in Group quarters - Other group homes (%)
People in Group quarters - Religious group quarters (%)
People in Group quarters - Dormitories (%)
People in Group quarters - Agriculture workers' dormitories on farms (%)
People in Group quarters - Job Corps and vocational training facilities (%)
People in Group quarters - Other workers' dormitories (%)
People in Group quarters - Crews of maritime vessels (%)
People in Group quarters - Other nonhousehold living situations (%)
People in Group quarters - Other noninstitutional group quarters (%)
Residents speaking English at home (%)
Residents speaking English at home - Born in the United States (%)
Residents speaking English at home - Native, born elsewhere (%)
Residents speaking English at home - Foreign born (%)
Residents speaking Spanish at home (%)
Residents speaking Spanish at home - Born in the United States (%)
Residents speaking Spanish at home - Native, born elsewhere (%)
Residents speaking Spanish at home - Foreign born (%)
Residents speaking other language at home (%)
Residents speaking other language at home - Born in the United States (%)
Residents speaking other language at home - Native, born elsewhere (%)
Residents speaking other language at home - Foreign born (%)
Class of Workers - Employee of private company (%)
Class of Workers - Self-employed in own incorporated business (%)
Class of Workers - Private not-for-profit wage and salary workers (%)
Class of Workers - Local government workers (%)
Class of Workers - State government workers (%)
Class of Workers - Federal government workers (%)
Class of Workers - Self-employed workers in own not incorporated business and Unpaid family workers (%)
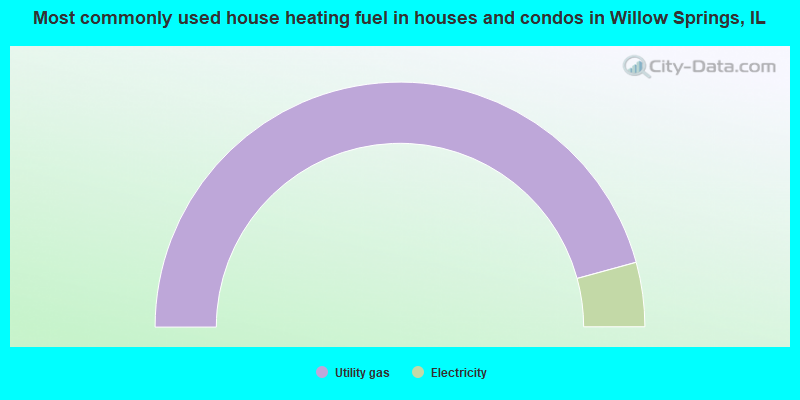
House heating fuel used in houses and condos - Utility gas (%)
House heating fuel used in houses and condos - Bottled, tank, or LP gas (%)
House heating fuel used in houses and condos - Electricity (%)
House heating fuel used in houses and condos - Fuel oil, kerosene, etc. (%)
House heating fuel used in houses and condos - Coal or coke (%)
House heating fuel used in houses and condos - Wood (%)
House heating fuel used in houses and condos - Solar energy (%)
House heating fuel used in houses and condos - Other fuel (%)
House heating fuel used in houses and condos - No fuel used (%)
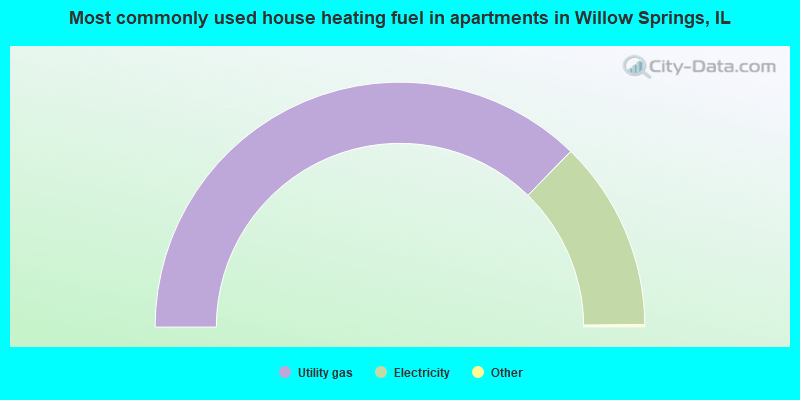
House heating fuel used in apartments - Utility gas (%)
House heating fuel used in apartments - Bottled, tank, or LP gas (%)
House heating fuel used in apartments - Electricity (%)
House heating fuel used in apartments - Fuel oil, kerosene, etc. (%)
House heating fuel used in apartments - Coal or coke (%)
House heating fuel used in apartments - Wood (%)
House heating fuel used in apartments - Solar energy (%)
House heating fuel used in apartments - Other fuel (%)
House heating fuel used in apartments - No fuel used (%)
Armed forces status - In Armed Forces (%)
Armed forces status - Civilian (%)
Armed forces status - Civilian - Veteran (%)
Armed forces status - Civilian - Nonveteran (%)
Fatal accidents locations in years 2005-2021
Fatal accidents locations in 2005
Fatal accidents locations in 2006
Fatal accidents locations in 2007
Fatal accidents locations in 2008
Fatal accidents locations in 2009
Fatal accidents locations in 2010
Fatal accidents locations in 2011
Fatal accidents locations in 2012
Fatal accidents locations in 2013
Fatal accidents locations in 2014
Fatal accidents locations in 2015
Fatal accidents locations in 2016
Fatal accidents locations in 2017
Fatal accidents locations in 2018
Fatal accidents locations in 2019
Fatal accidents locations in 2020
Fatal accidents locations in 2021
Alcohol use - People drinking some alcohol every month (%)
Alcohol use - People not drinking at all (%)
Alcohol use - Average days/month drinking alcohol
Alcohol use - Average drinks/week
Alcohol use - Average days/year people drink much
Audiometry - Average condition of hearing (%)
Audiometry - People that can hear a whisper from across a quiet room (%)
Audiometry - People that can hear normal voice from across a quiet room (%)
Audiometry - Ears ringing, roaring, buzzing (%)
Audiometry - Had a job exposure to loud noise (%)
Audiometry - Had off-work exposure to loud noise (%)
Blood Pressure & Cholesterol - Has high blood pressure (%)
Blood Pressure & Cholesterol - Checking blood pressure at home (%)
Blood Pressure & Cholesterol - Frequently checking blood cholesterol (%)
Blood Pressure & Cholesterol - Has high cholesterol level (%)
Consumer Behavior - Money monthly spent on food at supermarket/grocery store
Consumer Behavior - Money monthly spent on food at other stores
Consumer Behavior - Money monthly spent on eating out
Consumer Behavior - Money monthly spent on carryout/delivered foods
Consumer Behavior - Income spent on food at supermarket/grocery store (%)
Consumer Behavior - Income spent on food at other stores (%)
Consumer Behavior - Income spent on eating out (%)
Consumer Behavior - Income spent on carryout/delivered foods (%)
Current Health Status - General health condition (%)
Current Health Status - Blood donors (%)
Current Health Status - Has blood ever tested for HIV virus (%)
Current Health Status - Left-handed people (%)
Dermatology - People using sunscreen (%)
Diabetes - Diabetics (%)
Diabetes - Had a blood test for high blood sugar (%)
Diabetes - People taking insulin (%)
Diet Behavior & Nutrition - Diet health (%)
Diet Behavior & Nutrition - Milk product consumption (# of products/month)
Diet Behavior & Nutrition - Meals not home prepared (#/week)
Diet Behavior & Nutrition - Meals from fast food or pizza place (#/week)
Diet Behavior & Nutrition - Ready-to-eat foods (#/month)
Diet Behavior & Nutrition - Frozen meals/pizza (#/month)
Drug Use - People that ever used marijuana or hashish (%)
Drug Use - Ever used hard drugs (%)
Drug Use - Ever used any form of cocaine (%)
Drug Use - Ever used heroin (%)
Drug Use - Ever used methamphetamine (%)
Health Insurance - People covered by health insurance (%)
Kidney Conditions-Urology - Avg. # of times urinating at night
Medical Conditions - People with asthma (%)
Medical Conditions - People with anemia (%)
Medical Conditions - People with psoriasis (%)
Medical Conditions - People with overweight (%)
Medical Conditions - Elderly people having difficulties in thinking or remembering (%)
Medical Conditions - People who ever received blood transfusion (%)
Medical Conditions - People having trouble seeing even with glass/contacts (%)
Medical Conditions - People with arthritis (%)
Medical Conditions - People with gout (%)
Medical Conditions - People with congestive heart failure (%)
Medical Conditions - People with coronary heart disease (%)
Medical Conditions - People with angina pectoris (%)
Medical Conditions - People who ever had heart attack (%)
Medical Conditions - People who ever had stroke (%)
Medical Conditions - People with emphysema (%)
Medical Conditions - People with thyroid problem (%)
Medical Conditions - People with chronic bronchitis (%)
Medical Conditions - People with any liver condition (%)
Medical Conditions - People who ever had cancer or malignancy (%)
Mental Health - People who have little interest in doing things (%)
Mental Health - People feeling down, depressed, or hopeless (%)
Mental Health - People who have trouble sleeping or sleeping too much (%)
Mental Health - People feeling tired or having little energy (%)
Mental Health - People with poor appetite or overeating (%)
Mental Health - People feeling bad about themself (%)
Mental Health - People who have trouble concentrating on things (%)
Mental Health - People moving or speaking slowly or too fast (%)
Mental Health - People having thoughts they would be better off dead (%)
Oral Health - Average years since last visit a dentist
Oral Health - People embarrassed because of mouth (%)
Oral Health - People with gum disease (%)
Oral Health - General health of teeth and gums (%)
Oral Health - Average days a week using dental floss/device
Oral Health - Average days a week using mouthwash for dental problem
Oral Health - Average number of teeth
Pesticide Use - Households using pesticides to control insects (%)
Pesticide Use - Households using pesticides to kill weeds (%)
Physical Activity - People doing vigorous-intensity work activities (%)
Physical Activity - People doing moderate-intensity work activities (%)
Physical Activity - People walking or bicycling (%)
Physical Activity - People doing vigorous-intensity recreational activities (%)
Physical Activity - People doing moderate-intensity recreational activities (%)
Physical Activity - Average hours a day doing sedentary activities
Physical Activity - Average hours a day watching TV or videos
Physical Activity - Average hours a day using computer
Physical Functioning - People having limitations keeping them from working (%)
Physical Functioning - People limited in amount of work they can do (%)
Physical Functioning - People that need special equipment to walk (%)
Physical Functioning - People experiencing confusion/memory problems (%)
Physical Functioning - People requiring special healthcare equipment (%)
Prescription Medications - Average number of prescription medicines taking
Preventive Aspirin Use - Adults 40+ taking low-dose aspirin (%)
Reproductive Health - Vaginal deliveries (%)
Reproductive Health - Cesarean deliveries (%)
Reproductive Health - Deliveries resulted in a live birth (%)
Reproductive Health - Pregnancies resulted in a delivery (%)
Reproductive Health - Women breastfeeding newborns (%)
Reproductive Health - Women that had a hysterectomy (%)
Reproductive Health - Women that had both ovaries removed (%)
Reproductive Health - Women that have ever taken birth control pills (%)
Reproductive Health - Women taking birth control pills (%)
Reproductive Health - Women that have ever used Depo-Provera or injectables (%)
Reproductive Health - Women that have ever used female hormones (%)
Sexual Behavior - People 18+ that ever had sex (vaginal, anal, or oral) (%)
Sexual Behavior - Males 18+ that ever had vaginal sex with a woman (%)
Sexual Behavior - Males 18+ that ever performed oral sex on a woman (%)
Sexual Behavior - Males 18+ that ever had anal sex with a woman (%)
Sexual Behavior - Males 18+ that ever had any sex with a man (%)
Sexual Behavior - Females 18+ that ever had vaginal sex with a man (%)
Sexual Behavior - Females 18+ that ever performed oral sex on a man (%)
Sexual Behavior - Females 18+ that ever had anal sex with a man (%)
Sexual Behavior - Females 18+ that ever had any kind of sex with a woman (%)
Sexual Behavior - Average age people first had sex
Sexual Behavior - Average number of female sex partners in lifetime (males 18+)
Sexual Behavior - Average number of female vaginal sex partners in lifetime (males 18+)
Sexual Behavior - Average age people first performed oral sex on a woman (18+)
Sexual Behavior - Average number of woman performed oral sex on in lifetime (18+)
Sexual Behavior - Average number of male sex partners in lifetime (males 18+)
Sexual Behavior - Average number of male anal sex partners in lifetime (males 18+)
Sexual Behavior - Average age people first performed oral sex on a man (18+)
Sexual Behavior - Average number of male oral sex partners in lifetime (18+)
Sexual Behavior - People using protection when performing oral sex (%)
Sexual Behavior - Average number of times people have vaginal or anal sex a year
Sexual Behavior - People having sex without condom (%)
Sexual Behavior - Average number of male sex partners in lifetime (females 18+)
Sexual Behavior - Average number of male vaginal sex partners in lifetime (females 18+)
Sexual Behavior - Average number of female sex partners in lifetime (females 18+)
Sexual Behavior - Circumcised males 18+ (%)
Sleep Disorders - Average hours sleeping at night
Sleep Disorders - People that has trouble sleeping (%)
Smoking-Cigarette Use - People smoking cigarettes (%)
Taste & Smell - People 40+ having problems with smell (%)
Taste & Smell - People 40+ having problems with taste (%)
Taste & Smell - People 40+ that ever had wisdom teeth removed (%)
Taste & Smell - People 40+ that ever had tonsils teeth removed (%)
Taste & Smell - People 40+ that ever had a loss of consciousness because of a head injury (%)
Taste & Smell - People 40+ that ever had a broken nose or other serious injury to face or skull (%)
Taste & Smell - People 40+ that ever had two or more sinus infections (%)
Weight - Average height (inches)
Weight - Average weight (pounds)
Weight - Average BMI
Weight - People that are obese (%)
Weight - People that ever were obese (%)
Weight - People trying to lose weight (%)
According to our research of Illinois and other state lists, there were 3 registered sex offenders living in Willow Springs, Illinois as of April 18, 2024 . The ratio of all residents to sex offenders in Willow Springs is 1,883 to 1.The ratio of registered sex offenders to all residents in this city is lower than the state average.
Officers per 1,000 residents here:
1.61Illinois average:
3.04
Latest news from Willow Springs, IL collected exclusively by city-data.com from local newspapers, TV, and radio stations
Ancestries: Polish (19.8%), Italian (14.4%), German (5.4%), Irish (5.1%), Lithuanian (5.0%), American (3.3%).
Current Local Time:
Incorporated on 08/23/1892
Land area: 3.87 square miles.
Population density: 1,485 people per square mile (low).
1,100 residents are foreign born (8.9% Latin America , 8.3% Europe ).
This village:
19.2%Illinois:
14.1%
Median real estate property taxes paid for housing units with mortgages in 2022: $8,092 (2.1%)Median real estate property taxes paid for housing units with no mortgage in 2022: $7,018 (2.0%)
Nearest city with pop. 50,000+: Oak Lawn, IL
Nearest city with pop. 200,000+: Chicago, IL
Nearest cities:
Latitude: 41.74 N, Longitude: 87.88 W
Daytime population change due to commuting: -1,233 (-21.5%)Workers who live and work in this village: 553 (18.0%)
Single-family new house construction building permits:
2022: 1 building , cost: $350,0002021: 3 buildings , average cost: $326,7002020: 3 buildings , average cost: $253,3002019: 3 buildings , average cost: $264,3002017: 2 buildings , average cost: $450,0002016: 6 buildings , average cost: $457,0002015: 2 buildings , average cost: $374,2002014: 4 buildings , average cost: $463,3002013: 2 buildings , average cost: $259,0002011: 1 building , cost: $650,0002009: 1 building , cost: $500,0002008: 1 building , cost: $544,1002007: 2 buildings , average cost: $270,0002006: 4 buildings , average cost: $187,5002005: 7 buildings , average cost: $298,6002004: 23 buildings , average cost: $270,4002003: 16 buildings , average cost: $259,0002002: 55 buildings , average cost: $185,6002001: 124 buildings , average cost: $188,7002000: 143 buildings , average cost: $195,4001999: 16 buildings , average cost: $204,4001998: 14 buildings , average cost: $127,7001997: 22 buildings , average cost: $128,900Unemployment in December 2023:
Population change in the 1990s: +527 (+11.7%).
Most common occupations in Willow Springs, IL (%)
Both Males Females
Other management occupations, except farmers and farm managers (6.0%)
Driver/sales workers and truck drivers (5.5%)
Secretaries and administrative assistants (4.1%)
Other sales and related occupations, including supervisors (4.1%)
Other office and administrative support workers, including supervisors (4.0%)
Electrical equipment mechanics and other installation, maintenance, and repair workers, including supervisors (3.6%)
Preschool, kindergarten, elementary, and middle school teachers (3.6%)
Driver/sales workers and truck drivers (9.2%)
Other management occupations, except farmers and farm managers (5.9%)
Electrical equipment mechanics and other installation, maintenance, and repair workers, including supervisors (5.8%)
Metal workers and plastic workers (4.1%)
Laborers and material movers, hand (3.8%)
Sales representatives, services, wholesale and manufacturing (3.8%)
Building and grounds cleaning and maintenance occupations (3.4%)
Secretaries and administrative assistants (9.0%)
Preschool, kindergarten, elementary, and middle school teachers (8.0%)
Other sales and related occupations, including supervisors (8.0%)
Bookkeeping, accounting, and auditing clerks (6.6%)
Other office and administrative support workers, including supervisors (6.4%)
Other management occupations, except farmers and farm managers (6.0%)
Retail sales workers, except cashiers (4.3%)
Tornado activity:
Willow Springs-area historical tornado activity is near Illinois state average. It is 53% greater than the overall U.S. average.
On 8/28/1990, a category F5 (max. wind speeds 261-318 mph) tornado 18.9 miles away from the Willow Springs village center killed 29 people and injured 350 people and caused between $50,000 and $500,000 in damages.
On 6/13/1976, a category F4 (max. wind speeds 207-260 mph) tornado 2.2 miles away from the village center killed 2 people and injured 23 people and caused between $500,000 and $5,000,000 in damages.
Earthquake activity:
Willow Springs-area historical earthquake activity is significantly above Illinois state average. It is 45% greater than the overall U.S. average. On 4/18/2008 at 09:36:59, a magnitude 5.4 (5.1 MB, 4.8 MS, 5.4 MW, 5.2 MW, Class: Moderate, Intensity: VI - VII) earthquake occurred 227.3 miles away from Willow Springs center On 6/10/1987 at 23:48:54, a magnitude 5.1 (4.9 MB, 4.4 MS, 4.6 MS, 5.1 LG) earthquake occurred 201.7 miles away from Willow Springs center On 4/18/2008 at 09:36:59, a magnitude 5.2 (5.2 MW, Depth: 8.9 mi) earthquake occurred 227.3 miles away from the city center On 6/28/2004 at 06:10:52, a magnitude 4.2 (4.2 MW, Depth: 6.2 mi, Class: Light, Intensity: IV - V) earthquake occurred 56.3 miles away from the city center On 6/18/2002 at 17:37:15, a magnitude 5.0 (4.3 MB, 4.6 MW, 5.0 LG) earthquake occurred 259.5 miles away from Willow Springs center On 4/18/2008 at 15:14:16, a magnitude 4.8 (4.5 MB, 4.8 MW, 4.6 MW) earthquake occurred 225.6 miles away from the city center Magnitude types: regional Lg-wave magnitude (LG), body-wave magnitude (MB), surface-wave magnitude (MS), moment magnitude (MW) Natural disasters: The number of natural disasters in Cook County (20) is greater than the US average (15).Major Disasters (Presidential) Declared: 15Emergencies Declared: 4Floods: 13, Storms: 12, Tornadoes: 3, Snowstorms: 2, Winter Storms: 2, Blizzard: 1, Hurricane: 1, Snow: 1, Wind: 1, Other: 1 (Note: some incidents may be assigned to more than one category). Hospitals and medical centers near Willow Springs: FOREST MED-SURG CENTER (Hospital, about 2 miles away; JUSTICE, IL)
UNITED CAREGIVERS, INC (Home Health Center, about 2 miles away; BURR RIDGE, IL)
BRIAR PLACE (Nursing Home, about 3 miles away; INDIAN HEAD PARK, IL)
BRIAR PLACE NURSING CENTER (Nursing Home, about 3 miles away; INDIAN HEAD PARK, IL)
MEDSHARES HOSPICE OF WESTERN CHICAGO (Hospital, about 3 miles away; LA GRANGE, IL)
CARE ONE HOME HEALTH SERVICES, INC (Home Health Center, about 3 miles away; BURR RIDGE, IL)
ADVENTIST ST THOMAS HOSPICE (Hospital, about 3 miles away; BURR RIDGE, IL)
Amtrak stations near Willow Springs: 6 miles: SUMMIT (ARCHER & CENTER AVE.) Services: public payphones, free short-term parking, free long-term parking, call for taxi service, public transit connection.
6 miles: LA GRANGE ROAD (LA GRANGE, 25 W. BURLINGTON AVE.) Services: enclosed waiting area, public payphones, taxi stand, public transit connection.
15 miles: NAPERVILLE (E. 4TH & ELLSWORTH AVE.) Services: ticket office, partially wheelchair accessible, enclosed waiting area, public restrooms, public payphones, free short-term parking, free long-term parking, call for taxi service, public transit connection.
Colleges/universities with over 2000 students nearest to Willow Springs:
Moraine Valley Community College (about 4 miles; Palos Hills, IL ; Full-time enrollment: 12,008)
City Colleges of Chicago-Richard J Daley College (about 9 miles; Chicago, IL ; FT enrollment: 7,497)
Morton College (about 9 miles; Cicero, IL ; FT enrollment: 3,236)
Saint Xavier University (about 9 miles; Chicago, IL ; FT enrollment: 3,576)
Benedictine University (about 12 miles; Lisle, IL ; FT enrollment: 5,694)
Concordia University-Chicago (about 12 miles; River Forest, IL ; FT enrollment: 3,944)
Elmhurst College (about 12 miles; Elmhurst, IL ; FT enrollment: 3,364)
Public elementary/middle school in Willow Springs:
See full list of schools located in Willow Springs Cook County has a predicted average indoor radon screening level between 2 and 4 pCi/L (pico curies per liter) - Moderate Potential Average household size: This village:
2.5 peopleIllinois:
2.6 people
Percentage of family households: This village:
69.3%Whole state:
65.8%
Percentage of households with unmarried partners: This village:
4.0%Whole state:
6.3%
Likely homosexual households (counted as self-reported same-sex unmarried-partner households)
Lesbian couples: 0.1% of all households Gay men: 0.2% of all households
Banks with branches in Willow Springs (2011 data):
Firstmerit Bank, National Association: Willow Springs Branch at 8480 South Archer Avenue, branch established on 1996/07/12. Info updated 2010/05/17: Bank assets: $14,420.6 mil, Deposits: $11,497.6 mil, headquarters in Akron, OH, positive income , Commercial Lending Specialization, 213 total offices , Holding Company: Firstmerit Corporation
For population 15 years and over in Willow Springs:
Never married: 30.5%Now married: 52.1%Separated: 0.2%Widowed: 4.6%Divorced: 12.6% For population 25 years and over in Willow Springs:
High school or higher: 92.5%Bachelor's degree or higher: 36.5%Graduate or professional degree: 11.4%Unemployed: 5.5%Mean travel time to work (commute): 23.8 minutes
Education Gini index (Inequality in education) Here:
11.1Illinois average:
12.5
Religion statistics for Willow Springs, IL (based on Cook County data)
Religion Adherents Congregations Catholic 1,947,223 376 Evangelical Protestant 432,975 1,484 Other 312,636 403 Mainline Protestant 202,114 630 Black Protestant 148,895 395 Orthodox 53,276 66 None 2,097,556 -
Source: Clifford Grammich, Kirk Hadaway, Richard Houseal, Dale E.Jones, Alexei Krindatch, Richie Stanley and Richard H.Taylor. 2012. 2010 U.S.Religion Census: Religious Congregations & Membership Study. Association of Statisticians of American Religious Bodies. Jones, Dale E., et al. 2002. Congregations and Membership in the United States 2000. Nashville, TN: Glenmary Research Center. Graphs represent county-level data
Food Environment Statistics: Number of grocery stores : 1,460Cook County :
2.77 / 10,000 pop.Illinois :
2.24 / 10,000 pop.
Number of supercenters and club stores : 23Cook County :
0.04 / 10,000 pop.Illinois :
0.08 / 10,000 pop.
Number of convenience stores (no gas) : 490Here :
0.93 / 10,000 pop.Illinois :
0.75 / 10,000 pop.
Number of convenience stores (with gas) : 806This county :
1.53 / 10,000 pop.Illinois :
2.61 / 10,000 pop.
Number of full-service restaurants : 3,516This county :
6.67 / 10,000 pop.State :
6.86 / 10,000 pop.
Adult diabetes rate : Cook County :
8.4%Illinois :
8.3%
Low-income preschool obesity rate : Health and Nutrition:
Average overall health of teeth and gums : This city:
46.5%State:
47.2%
People feeling badly about themselves : Willow Springs:
22.6%Illinois:
20.5%
People not drinking alcohol at all : Willow Springs:
8.7%State:
10.8%
Average hours sleeping at night : This city:
6.8Illinois:
6.8
Overweight people : This city:
34.6%State:
33.4%
General health condition : Average condition of hearing : Willow Springs:
78.2%State:
79.9%
More about Health and Nutrition of Willow Springs, IL Residents
Local government employment and payroll (March 2022)
Function
Full-time employees
Monthly full-time payroll
Average yearly full-time wage
Part-time employees
Monthly part-time payroll
Police Protection - Officers
10 $74,883 $89,860 9 $6,983 Streets and Highways
6 $28,528 $57,056 4 $5,593 Other Government Administration
2 $14,844 $89,064 5 $2,000 Police - Other
1 $4,065 $48,780 6 $1,154 Financial Administration
0 $0 6 $20,687
Totals for Government
19 $122,320 $77,255 30 $36,417
Willow Springs government finances - Expenditure in 2017 (per resident):
Construction - General - Other: $332,000 ($57.79)
Police Protection: $31,000 ($5.40)Current Operations - Police Protection: $3,041,000 ($529.33)
Financial Administration: $1,507,000 ($262.32)Solid Waste Management: $898,000 ($156.31)Local Fire Protection: $380,000 ($66.14)Regular Highways: $291,000 ($50.65)Sewerage: $289,000 ($50.30)General - Other: $66,000 ($11.49)General Public Buildings: $27,000 ($4.70)Parking Facilities: $26,000 ($4.53)General - Interest on Debt: $677,000 ($117.84)
Other Capital Outlay - Regular Highways: $192,000 ($33.42)
Willow Springs government finances - Revenue in 2017 (per resident):
Charges - Solid Waste Management: $900,000 ($156.66)
Sewerage: $550,000 ($95.74)Parking Facilities: $26,000 ($4.53)Other: $1,000 ($0.17)Miscellaneous - Fines and Forfeits: $107,000 ($18.62)
General Revenue - Other: $69,000 ($12.01)Interest Earnings: $5,000 ($0.87)State Intergovernmental - General Local Government Support: $769,000 ($133.86)
Highways: $145,000 ($25.24)Tax - Property: $4,312,000 ($750.57)
Other License: $750,000 ($130.55)Public Utilities Sales: $397,000 ($69.10)Other Selective Sales: $358,000 ($62.32)
Willow Springs government finances - Debt in 2017 (per resident):
Long Term Debt - Beginning Outstanding - Unspecified Public Purpose: $16,289,000 ($2835.34)
Outstanding Unspecified Public Purpose: $14,784,000 ($2573.37)Retired Unspecified Public Purpose: $2,255,000 ($392.52)Issue, Unspecified Public Purpose: $750,000 ($130.55)
Willow Springs government finances - Cash and Securities in 2017 (per resident):
Other Funds - Cash and Securities: $3,732,000 ($649.61)
3.53% of this county's 2021 resident taxpayers lived in other counties in 2020 ($82,405 average adjusted gross income )
Here:
3.53%Illinois average:
5.09%
0.01% of residents moved from foreign countries ($114 average AGI )Cook County:
0.01%Illinois average:
0.01%
Top counties from which taxpayers relocated into this county between 2020 and 2021:
5.44% of this county's 2020 resident taxpayers moved to other counties in 2021 ($120,340 average adjusted gross income )
Here:
5.44%Illinois average:
6.10%
0.01% of residents moved to foreign countries ($140 average AGI )Cook County:
0.01%Illinois average:
0.01%
Top counties to which taxpayers relocated from this county between 2020 and 2021:
Businesses in Willow Springs, IL
Name Count Name Count
7-Eleven 1 Subway 1 Dunkin Donuts 1 UPS 1
Strongest AM radio stations in Willow Springs:
WMVP (1000 AM; 50 kW; CHICAGO, IL; Owner: ABC, INC.)
WLS (890 AM; 50 kW; CHICAGO, IL; Owner: WLS, INC.)
WYLL (1160 AM; 50 kW; CHICAGO, IL; Owner: SCA LICENSE CORPORATION)
WSCR (670 AM; 50 kW; CHICAGO, IL; Owner: INFINITY BROADCASTING OPERATIONS, INC.)
WBBM (780 AM; 50 kW; CHICAGO, IL; Owner: INFINITY BROADCASTING OPERATIONS, INC.)
WGN (720 AM; 50 kW; CHICAGO, IL; Owner: WGN CONTINENTAL BROADCASTING CO.)
WVIV (1200 AM; 20 kW; CHICAGO, IL; Owner: WLXX-AM LICENSE CORP.)
WRDZ (1300 AM; 4 kW; LA GRANGE, IL; Owner: ABC, INC.)
WGCI (1390 AM; 5 kW; CHICAGO, IL; Owner: AMFM RADIO LICENSES, L.L.C.)
WCSN (820 AM; 5 kW; CHICAGO, IL; Owner: WYPA, INC.)
WMBI (1110 AM; daytime; 5 kW; CHICAGO, IL; Owner: THE MOODY BIBLE INSTITUTE OF CHICAGO)
WTMJ (620 AM; 50 kW; MILWAUKEE, WI; Owner: JOURNAL BROADCAST CORPORATION)
WNTD (950 AM; 5 kW; CHICAGO, IL; Owner: RADIO UNICA OF CHICAGO LICENSE CORP.)
Strongest FM radio stations in Willow Springs:
WLEY-FM (107.9 FM; AURORA, IL; Owner: WLEY LICENSING, INC.)
WCKG (105.9 FM; ELMWOOD PARK, IL; Owner: INFINITY HOLDINGS CORPORATION OF ORLANDO)
WLIT-FM (93.9 FM; CHICAGO, IL; Owner: AMFM RADIO LICENSES, L.L.C.)
WJMK (104.3 FM; CHICAGO, IL; Owner: INFINITY BROADCASTING CORP. OF ILLINOIS)
WNUA (95.5 FM; CHICAGO, IL; Owner: AMFM RADIO LICENSES, L.L.C.)
WTMX (101.9 FM; SKOKIE, IL; Owner: BONNEVILLE HOLDING COMPANY)
WBBM-FM (96.3 FM; CHICAGO, IL; Owner: INFINITY BROADCASTING OPERATIONS, INC.)
WKSC-FM (103.5 FM; CHICAGO, IL; Owner: AMFM RADIO LICENSES, L.L.C.)
WFMT (98.7 FM; CHICAGO, IL; Owner: WINDOW TO THE WORLD COMMUNICATIONS)
WGCI-FM (107.5 FM; CHICAGO, IL; Owner: AMFM RADIO LICENSES, L.L.C.)
WZZN (94.7 FM; CHICAGO, IL; Owner: ABC CHICAGO FM RADIO,INC.)
WBEZ (91.5 FM; CHICAGO, IL; Owner: THE WBEZ ALLIANCE, INC.)
WKQX (101.1 FM; CHICAGO, IL; Owner: EMMIS RADIO LICENSE CORPORATION)
WLUP-FM (97.9 FM; CHICAGO, IL; Owner: BONNEVILLE HOLDING COMPANY)
WNND (100.3 FM; CHICAGO, IL; Owner: BONNEVILLE HOLDING COMPANY)
WOJO (105.1 FM; EVANSTON, IL; Owner: TICHENOR LICENSE CORPORATION ("TLC"))
WUSN (99.5 FM; CHICAGO, IL; Owner: INFINITY BROADCASTING CORPORATION OF CHICAGO)
WVAZ (102.7 FM; OAK PARK, IL; Owner: AMFM RADIO LICENSES, L.L.C.)
WDRV (97.1 FM; CHICAGO, IL; Owner: BONNEVILLE HOLDING COMPANY)
WXRT-FM (93.1 FM; CHICAGO, IL; Owner: INFINITY BROADCASTING OPERATIONS, INC.)
TV broadcast stations around Willow Springs:
WLS-TV (Channel 7; CHICAGO, IL; Owner: WLS TELEVISION, INC.)
WMAQ-TV (Channel 5; CHICAGO, IL; Owner: NBC SUBSIDIARY (WMAQ-TV), INC.)
WTTW (Channel 11; CHICAGO, IL; Owner: WINDOW TO THE WORLD COMMUNICATIONS, INC.)
WGN-TV (Channel 9; CHICAGO, IL; Owner: WGN CONTINENTAL BROADCASTING COMPANY)
WGBO-TV (Channel 66; JOLIET, IL; Owner: WGBO LICENSE PARTNERSHIP, G.P.)
WBBM-TV (Channel 2; CHICAGO, IL; Owner: CBS BROADCASTING INC.)
WPWR-TV (Channel 50; GARY, IN; Owner: FOX TELEVISION STATIONS, INC.)
WXFT (Channel 60; AURORA, IL; Owner: TELEFUTURA CHICAGO LLC)
WCIU-TV (Channel 26; CHICAGO, IL; Owner: WCIU-TV LIMITED PARTNERSHIP)
WCPX (Channel 38; CHICAGO, IL; Owner: PAXSON CHICAGO LICENSE, INC.)
WFLD (Channel 32; CHICAGO, IL; Owner: FOX TELEVISION STATIONS, INC.)
W68DO (Channel 68; PALATINE, IL; Owner: TRINITY BROADCASTING NETWORK)
WFBT-CA (Channel 23; CHICAGO, IL; Owner: CHANNEL 23 LIMITED PARTNERSHIP)
WJYS (Channel 62; HAMMOND, IN; Owner: JOVON BROADCASTING CORPORATION)
WSNS-TV (Channel 44; CHICAGO, IL; Owner: TELEMUNDO OF CHICAGO, INC.)
WOCH-LP (Channel 28; CHICAGO, IL; Owner: KM LPTV OF CHICAGO-28, L.L.C.)
WYCC (Channel 20; CHICAGO, IL; Owner: COLLEGE DIST. #508, COUNTY OF COOK)
WOCK-CA (Channel 13; CHICAGO, IL; Owner: KM LPTV OF CHICAGO-13, L.L.C.)
W34CK (Channel 34; ARLINGTON HEIGHTS, IL; Owner: FIRST UNITED, INC.)
WYIN (Channel 56; GARY, IN; Owner: NORTHWEST INDIANA PUBLIC BROADCASTING, INC.)
W54AP (Channel 54; BLUE ISLAND, IL; Owner: CATHOLIC VIEWS BROADCASTS, INC.)
W64CQ (Channel 64; ARLINGTON HEIGHTS, IL; Owner: TRINITY BROADCASTING NETWORK)
W24AJ (Channel 24; AURORA, IL; Owner: NELSON TV, INC.)
W57DN (Channel 57; ELGIN, IL; Owner: TRINITY BROADCASTING NETWORK)
National Bridge Inventory (NBI) Statistics 18 Number of bridges548ft / 167m Total length $6,837,000 Total costs538,950 Total average daily traffic63,803 Total average daily truck traffic
New bridges - historical statistics
1 1930-1939 1 1940-1949 6 1950-1959 2 1960-1969 2 1970-1979 1 1980-1989 2 1990-1999 3 2000-2009
See full National Bridge Inventory statistics for Willow Springs, IL
FCC Registered Antenna Towers: 27 (
See the full list of FCC Registered Antenna Towers in Willow Springs )
FCC Registered Broadcast Land Mobile Towers: 2
MOB, Lat: 41.694583 Lon: -87.875111, Call Sign: WQTN469, Assigned Frequencies: 451.187 MHz, 451.437 MHz, 451.362 MHz, 452.087 MHz, 452.662 MHz, Grant Date: 03/11/2014, Expiration Date: 03/11/2024, Cancellation Date: 06/02/2023, Certifier: Daniel Heintz, Registrant: Univar Solutions, 3 Waterway Square Place, Suite 1000, The Woodlands, TX 77380, Phone: (704) 497-3180, Email:
Willow Springs DED, Lat: 41.732583 Lon: -87.879417, Call Sign: WQVF984, Assigned Frequencies: 160.920 MHz, 161.190 MHz, Grant Date: 01/30/2015, Expiration Date: 01/30/2025, Certifier: Theodore K Kalick, Registrant: Cn, 17641 South Ashland Avenue, Homewood, IL 60430, Phone: (708) 332-6750, Email:
FCC Registered Microwave Towers: 2
STATION, 10157 W 5th Ave Cutoff (Lat: 41.752806 Lon: -87.872278), Overall height: 16.5 m, Call Sign: WNEK567, Assigned Frequencies: 953.550 MHz, Grant Date: 04/09/1997, Expiration Date: 01/13/1999, Cancellation Date: 11/12/1998, Phone: (202) 955-0828 STATION, Pl34 2200' S Of I55 & 2400' E Of Willow Springs Rd On I294 (Lat: 41.754750 Lon: -87.877833), Overall height: 44.2 m, Call Sign: WNTR280, Assigned Frequencies: 19015.0 MHz, 10533.7 MHz, Grant Date: 12/11/2001, Expiration Date: 02/25/2012, Cancellation Date: 05/29/2002, Phone: (630) 241-6800 FCC Registered Amateur Radio Licenses: 14 (
See the full list of FCC Registered Amateur Radio Licenses in Willow Springs )
FAA Registered Aircraft: 2
Aircraft: CESSNA 182G (Category: Land, Seats: 4, Weight: Up to 12,499 Pounds, Speed: 119 mph), Engine: CONT MOTOR O-470 SERIES (230 HP) (Reciprocating)N-Number: 5035T, N5035T, N-5035T, Serial Number: 18255231, Year manufactured: 1964, Airworthiness Date: 01/15/1964, Certificate Issue Date: 06/22/2012Registrant (Co-Owned): Enterprise Group Ltd Tjm, 9040 Ridge Ct, Willow Springs, IL 60480, Other Owners: Tim MahlerAircraft: CESSNA 140 (Category: Land, Seats: 2, Weight: Up to 12,499 Pounds, Speed: 105 mph), Engine: CONT MOTOR C85 SERIES (85 HP) (Reciprocating)N-Number: 89264, N89264, N-89264, Serial Number: 8288, Year manufactured: 1946, Airworthiness Date: 11/05/1955, Certificate Issue Date: 07/15/2002Registrant (LLC): Clydes Best LLC, Po Box 74, Willow Springs, IL 60480
Home Mortgage Disclosure Act Aggregated Statistics For Year 2009(Based on 4 partial tracts) A) FHA, FSA/RHS & VA B) Conventional C) Refinancings D) Home Improvement Loans F) Non-occupant Loans on Number Average Value Number Average Value Number Average Value Number Average Value Number Average Value
LOANS ORIGINATED 6 $188,760 23 $230,701 116 $253,013 2 $166,865 4 $232,612 APPLICATIONS APPROVED, NOT ACCEPTED 0 $0 6 $230,785 11 $241,348 1 $66,540 1 $162,760 APPLICATIONS DENIED 2 $238,485 6 $203,377 37 $307,511 1 $85,390 1 $321,830 APPLICATIONS WITHDRAWN 1 $172,010 2 $207,445 22 $255,015 1 $163,360 1 $265,670 FILES CLOSED FOR INCOMPLETENESS 0 $0 1 $250,890 7 $337,671 1 $96,480 0 $0
Aggregated Statistics For Year 2008(Based on 4 partial tracts) A) FHA, FSA/RHS & VA B) Conventional C) Refinancings D) Home Improvement Loans E) Loans on Dwellings For 5+ Families F) Non-occupant Loans on G) Loans On Manufactured Number Average Value Number Average Value Number Average Value Number Average Value Number Average Value Number Average Value Number Average Value
LOANS ORIGINATED 6 $188,590 21 $242,231 74 $276,071 4 $154,258 1 $582,160 3 $506,257 0 $0 APPLICATIONS APPROVED, NOT ACCEPTED 0 $0 2 $242,340 12 $262,512 1 $49,530 0 $0 1 $128,640 0 $0 APPLICATIONS DENIED 2 $299,600 9 $448,956 36 $274,988 3 $88,240 0 $0 3 $146,543 1 $11,310 APPLICATIONS WITHDRAWN 0 $0 3 $280,660 16 $273,478 0 $0 0 $0 1 $135,040 0 $0 FILES CLOSED FOR INCOMPLETENESS 0 $0 1 $270,000 7 $380,789 1 $89,850 0 $0 0 $0 0 $0
Aggregated Statistics For Year 2007(Based on 4 partial tracts) B) Conventional C) Refinancings D) Home Improvement Loans E) Loans on Dwellings For 5+ Families F) Non-occupant Loans on G) Loans On Manufactured Number Average Value Number Average Value Number Average Value Number Average Value Number Average Value Number Average Value
LOANS ORIGINATED 59 $262,730 97 $265,918 10 $98,655 2 $5,719,760 6 $241,963 1 $12,820 APPLICATIONS APPROVED, NOT ACCEPTED 9 $332,560 20 $259,584 2 $256,665 0 $0 1 $261,450 1 $39,900 APPLICATIONS DENIED 16 $313,716 53 $263,937 9 $131,647 0 $0 4 $437,928 2 $20,975 APPLICATIONS WITHDRAWN 6 $181,015 22 $280,669 4 $158,380 0 $0 2 $138,880 0 $0 FILES CLOSED FOR INCOMPLETENESS 1 $283,560 7 $277,146 1 $183,370 0 $0 0 $0 0 $0
Aggregated Statistics For Year 2006(Based on 4 partial tracts) A) FHA, FSA/RHS & VA B) Conventional C) Refinancings D) Home Improvement Loans E) Loans on Dwellings For 5+ Families F) Non-occupant Loans on G) Loans On Manufactured Number Average Value Number Average Value Number Average Value Number Average Value Number Average Value Number Average Value Number Average Value
LOANS ORIGINATED 1 $126,060 97 $218,357 105 $266,107 13 $106,099 1 $1,656,550 8 $174,169 2 $41,420 APPLICATIONS APPROVED, NOT ACCEPTED 0 $0 13 $206,674 21 $189,020 2 $57,730 0 $0 1 $149,070 0 $0 APPLICATIONS DENIED 0 $0 25 $188,325 42 $238,878 8 $167,646 0 $0 1 $39,780 1 $44,010 APPLICATIONS WITHDRAWN 0 $0 9 $231,992 25 $275,452 2 $266,880 0 $0 2 $192,320 0 $0 FILES CLOSED FOR INCOMPLETENESS 0 $0 3 $281,390 11 $234,774 0 $0 0 $0 1 $173,890 0 $0
Aggregated Statistics For Year 2005(Based on 4 partial tracts) A) FHA, FSA/RHS & VA B) Conventional C) Refinancings D) Home Improvement Loans E) Loans on Dwellings For 5+ Families F) Non-occupant Loans on G) Loans On Manufactured Number Average Value Number Average Value Number Average Value Number Average Value Number Average Value Number Average Value Number Average Value
LOANS ORIGINATED 1 $215,690 106 $224,478 130 $234,082 13 $124,857 3 $978,100 12 $187,408 1 $22,770 APPLICATIONS APPROVED, NOT ACCEPTED 0 $0 13 $239,015 17 $188,106 2 $174,620 0 $0 1 $125,920 0 $0 APPLICATIONS DENIED 1 $177,080 22 $191,591 47 $202,336 6 $79,878 0 $0 4 $119,120 1 $27,260 APPLICATIONS WITHDRAWN 0 $0 11 $315,135 38 $273,605 4 $203,145 1 $614,560 3 $347,557 0 $0 FILES CLOSED FOR INCOMPLETENESS 0 $0 2 $219,730 9 $248,687 0 $0 0 $0 1 $132,600 0 $0
Aggregated Statistics For Year 2004(Based on 4 partial tracts) A) FHA, FSA/RHS & VA B) Conventional C) Refinancings D) Home Improvement Loans E) Loans on Dwellings For 5+ Families F) Non-occupant Loans on G) Loans On Manufactured Number Average Value Number Average Value Number Average Value Number Average Value Number Average Value Number Average Value Number Average Value
LOANS ORIGINATED 2 $175,395 97 $211,861 125 $219,019 8 $56,206 2 $269,020 5 $172,482 2 $52,280 APPLICATIONS APPROVED, NOT ACCEPTED 0 $0 10 $211,890 18 $233,792 1 $84,110 0 $0 2 $183,420 0 $0 APPLICATIONS DENIED 0 $0 14 $194,204 39 $216,908 6 $90,395 0 $0 1 $129,280 2 $37,820 APPLICATIONS WITHDRAWN 0 $0 9 $275,214 37 $241,605 2 $104,950 0 $0 1 $264,110 0 $0 FILES CLOSED FOR INCOMPLETENESS 0 $0 3 $178,537 9 $330,819 0 $0 0 $0 0 $0 0 $0
Aggregated Statistics For Year 2003(Based on 4 partial tracts) A) FHA, FSA/RHS & VA B) Conventional C) Refinancings D) Home Improvement Loans E) Loans on Dwellings For 5+ Families F) Non-occupant Loans on Number Average Value Number Average Value Number Average Value Number Average Value Number Average Value Number Average Value
LOANS ORIGINATED 5 $153,000 94 $205,126 331 $191,143 9 $72,752 3 $397,640 11 $172,975 APPLICATIONS APPROVED, NOT ACCEPTED 0 $0 9 $243,448 33 $183,227 2 $18,155 0 $0 1 $146,320 APPLICATIONS DENIED 1 $177,500 18 $185,518 54 $166,893 2 $31,220 0 $0 3 $141,947 APPLICATIONS WITHDRAWN 0 $0 6 $218,065 48 $194,931 1 $39,410 0 $0 1 $137,980 FILES CLOSED FOR INCOMPLETENESS 0 $0 4 $300,802 8 $288,348 0 $0 0 $0 1 $182,730
Aggregated Statistics For Year 2002(Based on 4 partial tracts) A) FHA, FSA/RHS & VA B) Conventional C) Refinancings D) Home Improvement Loans E) Loans on Dwellings For 5+ Families F) Non-occupant Loans on Number Average Value Number Average Value Number Average Value Number Average Value Number Average Value Number Average Value
LOANS ORIGINATED 8 $154,210 90 $177,922 259 $196,879 7 $40,546 6 $1,284,842 9 $141,753 APPLICATIONS APPROVED, NOT ACCEPTED 0 $0 10 $300,314 28 $172,396 2 $55,745 0 $0 0 $0 APPLICATIONS DENIED 2 $113,395 11 $191,362 51 $154,956 4 $52,300 1 $6,078,800 1 $111,590 APPLICATIONS WITHDRAWN 1 $142,950 9 $150,316 37 $173,465 3 $59,980 0 $0 1 $182,460 FILES CLOSED FOR INCOMPLETENESS 0 $0 1 $168,760 12 $172,299 0 $0 0 $0 0 $0
Aggregated Statistics For Year 2001(Based on 4 partial tracts) A) FHA, FSA/RHS & VA B) Conventional C) Refinancings D) Home Improvement Loans E) Loans on Dwellings For 5+ Families F) Non-occupant Loans on Number Average Value Number Average Value Number Average Value Number Average Value Number Average Value Number Average Value
LOANS ORIGINATED 5 $194,706 128 $182,639 170 $163,858 12 $37,226 5 $238,962 3 $120,480 APPLICATIONS APPROVED, NOT ACCEPTED 1 $117,340 9 $193,397 17 $161,322 4 $24,750 0 $0 0 $0 APPLICATIONS DENIED 1 $157,240 16 $109,970 36 $116,959 6 $19,023 0 $0 1 $61,040 APPLICATIONS WITHDRAWN 1 $100,560 8 $145,060 27 $132,864 3 $37,517 0 $0 2 $84,500 FILES CLOSED FOR INCOMPLETENESS 0 $0 3 $242,957 9 $168,959 0 $0 0 $0 0 $0
Aggregated Statistics For Year 2000(Based on 4 partial tracts) A) FHA, FSA/RHS & VA B) Conventional C) Refinancings D) Home Improvement Loans E) Loans on Dwellings For 5+ Families F) Non-occupant Loans on Number Average Value Number Average Value Number Average Value Number Average Value Number Average Value Number Average Value
LOANS ORIGINATED 10 $132,936 85 $165,939 42 $145,848 9 $31,074 4 $277,572 2 $158,210 APPLICATIONS APPROVED, NOT ACCEPTED 0 $0 6 $121,360 11 $141,005 4 $22,372 0 $0 1 $72,010 APPLICATIONS DENIED 1 $106,460 26 $86,182 25 $114,976 7 $30,383 0 $0 1 $26,150 APPLICATIONS WITHDRAWN 0 $0 6 $157,927 12 $112,442 3 $74,693 0 $0 1 $64,320 FILES CLOSED FOR INCOMPLETENESS 0 $0 1 $218,910 6 $112,962 0 $0 0 $0 0 $0
Aggregated Statistics For Year 1999(Based on 3 partial tracts) A) FHA, FSA/RHS & VA B) Conventional C) Refinancings D) Home Improvement Loans E) Loans on Dwellings For 5+ Families F) Non-occupant Loans on Number Average Value Number Average Value Number Average Value Number Average Value Number Average Value Number Average Value
LOANS ORIGINATED 7 $128,289 90 $144,162 97 $140,843 13 $25,126 5 $270,038 7 $99,690 APPLICATIONS APPROVED, NOT ACCEPTED 0 $0 7 $149,149 17 $118,127 2 $14,080 0 $0 1 $78,690 APPLICATIONS DENIED 1 $170,480 14 $119,948 29 $114,367 6 $19,035 0 $0 1 $69,900 APPLICATIONS WITHDRAWN 1 $98,560 8 $131,031 19 $114,060 2 $62,340 0 $0 0 $0 FILES CLOSED FOR INCOMPLETENESS 0 $0 2 $162,840 11 $141,601 0 $0 0 $0 0 $0
Detailed HMDA statistics for the following Tracts:
8202.01
, 8202.02 , 8206.02
Private Mortgage Insurance Companies Aggregated Statistics For Year 2009(Based on 4 partial tracts) A) Conventional B) Refinancings Number Average Value Number Average Value
LOANS ORIGINATED 3 $191,857 1 $252,340 APPLICATIONS APPROVED, NOT ACCEPTED 3 $244,653 1 $180,310 APPLICATIONS DENIED 0 $0 0 $0 APPLICATIONS WITHDRAWN 0 $0 0 $0 FILES CLOSED FOR INCOMPLETENESS 0 $0 0 $0
Aggregated Statistics For Year 2008(Based on 4 partial tracts) A) Conventional B) Refinancings C) Non-occupant Loans on Number Average Value Number Average Value Number Average Value
LOANS ORIGINATED 7 $160,624 6 $227,280 0 $0 APPLICATIONS APPROVED, NOT ACCEPTED 4 $182,598 4 $266,768 0 $0 APPLICATIONS DENIED 1 $218,100 1 $381,070 1 $205,610 APPLICATIONS WITHDRAWN 1 $116,020 2 $226,550 0 $0 FILES CLOSED FOR INCOMPLETENESS 0 $0 1 $166,200 0 $0
Aggregated Statistics For Year 2007(Based on 4 partial tracts) A) Conventional B) Refinancings Number Average Value Number Average Value
LOANS ORIGINATED 18 $220,633 10 $235,408 APPLICATIONS APPROVED, NOT ACCEPTED 2 $193,475 2 $223,295 APPLICATIONS DENIED 0 $0 1 $218,430 APPLICATIONS WITHDRAWN 1 $119,900 0 $0 FILES CLOSED FOR INCOMPLETENESS 0 $0 0 $0
Aggregated Statistics For Year 2006(Based on 4 partial tracts) A) Conventional B) Refinancings C) Non-occupant Loans on Number Average Value Number Average Value Number Average Value
LOANS ORIGINATED 8 $191,121 4 $287,670 1 $61,300 APPLICATIONS APPROVED, NOT ACCEPTED 1 $192,290 1 $214,370 0 $0 APPLICATIONS DENIED 0 $0 0 $0 0 $0 APPLICATIONS WITHDRAWN 0 $0 0 $0 0 $0 FILES CLOSED FOR INCOMPLETENESS 0 $0 0 $0 0 $0
Aggregated Statistics For Year 2005(Based on 4 partial tracts) A) Conventional B) Refinancings Number Average Value Number Average Value
LOANS ORIGINATED 15 $201,595 7 $195,433 APPLICATIONS APPROVED, NOT ACCEPTED 3 $169,473 2 $126,305 APPLICATIONS DENIED 0 $0 0 $0 APPLICATIONS WITHDRAWN 0 $0 1 $70,140 FILES CLOSED FOR INCOMPLETENESS 0 $0 0 $0
Aggregated Statistics For Year 2004(Based on 4 partial tracts) A) Conventional B) Refinancings Number Average Value Number Average Value
LOANS ORIGINATED 17 $193,566 7 $151,239 APPLICATIONS APPROVED, NOT ACCEPTED 4 $176,588 4 $187,748 APPLICATIONS DENIED 0 $0 0 $0 APPLICATIONS WITHDRAWN 1 $235,800 1 $199,730 FILES CLOSED FOR INCOMPLETENESS 0 $0 0 $0
Aggregated Statistics For Year 2003(Based on 4 partial tracts) A) Conventional B) Refinancings Number Average Value Number Average Value
LOANS ORIGINATED 24 $169,026 15 $179,428 APPLICATIONS APPROVED, NOT ACCEPTED 4 $160,390 4 $169,020 APPLICATIONS DENIED 1 $130,300 1 $108,900 APPLICATIONS WITHDRAWN 2 $152,810 1 $313,500 FILES CLOSED FOR INCOMPLETENESS 0 $0 0 $0
Aggregated Statistics For Year 2002(Based on 4 partial tracts) A) Conventional B) Refinancings Number Average Value Number Average Value
LOANS ORIGINATED 31 $153,090 15 $164,759 APPLICATIONS APPROVED, NOT ACCEPTED 5 $140,784 3 $160,160 APPLICATIONS DENIED 0 $0 0 $0 APPLICATIONS WITHDRAWN 1 $142,570 1 $175,420 FILES CLOSED FOR INCOMPLETENESS 0 $0 0 $0
Aggregated Statistics For Year 2001(Based on 4 partial tracts) A) Conventional B) Refinancings Number Average Value Number Average Value
LOANS ORIGINATED 33 $186,135 8 $139,860 APPLICATIONS APPROVED, NOT ACCEPTED 2 $213,680 2 $157,015 APPLICATIONS DENIED 0 $0 0 $0 APPLICATIONS WITHDRAWN 0 $0 1 $262,610 FILES CLOSED FOR INCOMPLETENESS 0 $0 0 $0
Aggregated Statistics For Year 2000(Based on 4 partial tracts) A) Conventional B) Refinancings Number Average Value Number Average Value
LOANS ORIGINATED 15 $143,477 2 $199,405 APPLICATIONS APPROVED, NOT ACCEPTED 4 $142,525 0 $0 APPLICATIONS DENIED 2 $105,615 0 $0 APPLICATIONS WITHDRAWN 0 $0 0 $0 FILES CLOSED FOR INCOMPLETENESS 0 $0 0 $0
Aggregated Statistics For Year 1999(Based on 3 partial tracts) A) Conventional B) Refinancings Number Average Value Number Average Value
LOANS ORIGINATED 22 $148,667 7 $133,590 APPLICATIONS APPROVED, NOT ACCEPTED 2 $135,705 2 $139,245 APPLICATIONS DENIED 1 $171,160 0 $0 APPLICATIONS WITHDRAWN 1 $189,710 0 $0 FILES CLOSED FOR INCOMPLETENESS 0 $0 0 $0
Detailed PMIC statistics for the following Tracts:
8202.01
, 8202.02 , 8206.02
Most common first names in Willow Springs, IL among deceased individuals Name Count Lived (average)
John 43 74.0 years Joseph 25 77.3 years Mary 22 82.0 years Edward 19 75.5 years Frank 17 75.4 years James 15 71.7 years Anna 15 80.5 years William 15 80.8 years George 14 70.9 years Robert 14 72.3 years
Most common last names in Willow Springs, IL among deceased individuals Last name Count Lived (average)
Pankow 12 66.1 years Johnson 9 71.6 years Doogan 6 68.5 years Laatz 6 78.2 years Jones 5 74.0 years Williams 5 77.8 years Banks 4 77.0 years Smith 4 80.3 years Riha 4 80.3 years Spadoni 4 83.2 years
Willow Springs compared to Illinois state average:
Unemployed percentage below state average. Black race population percentage significantly below state average. Median age above state average. Foreign-born population percentage above state average. Renting percentage significantly below state average. Length of stay since moving in significantly above state average. Willow Springs on our top lists :
#6 on the list of "Top 101 cities with largest percentage of males in industries: wholesale trade (population 5,000+)"
#11 on the list of "Top 101 cities with largest percentage of females in industries: wholesale trade (population 5,000+)"
#20 on the list of "Top 101 cities with largest percentage of males in occupations: sales and related occupations (population 5,000+)"
#23 on the list of "Top 101 cities with the most residents born in Lebanon (population 500+)"
#46 on the list of "Top 101 cities with the most residents born in Poland (population 500+)"
#58 on the list of "Top 101 cities with the most residents born in Eastern Europe (population 500+)"
#80 on the list of "Top 101 cities with largest percentage of females in occupations: architecture and engineering occupations (population 5,000+)"
#87 on the list of "Top 101 cities with the smallest city-data.com crime index per police officer (population 5,000+)"
#92 on the list of "Top 101 cities with the largest city-data.com crime index decrease from 2002 to 2012 (population 5,000+)"
#100 on the list of "Top 100 safest cities (lowest city-data.com crime index) (pop. 5,000+)"
#1 on the list of "Top 101 counties with the most Black Protestant congregations"
#1 on the list of "Top 101 counties with the most Catholic congregations"
#1 on the list of "Top 101 counties with the highest surface withdrawal of fresh water for public supply"
#2 on the list of "Top 101 counties with the most Black Protestant adherents"
#2 on the list of "Top 101 counties with the most Orthodox congregations (pop. 50,000+)"
Top Patent Applicants
Adam C. Lack (11)
Scott Stecker (8)
Thomas W. Becker (6)
Greg Kida (3)
Kiminobu Sugaya (3)
Jonathan Burr (2)
Quang C. Nguyen (2)
Joshua D. Zimmerman (1)
Rex E. Gerald, Ii (1)
Randy C. Marten (1)
Total of 47 patent applications in 2008-2024.


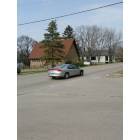
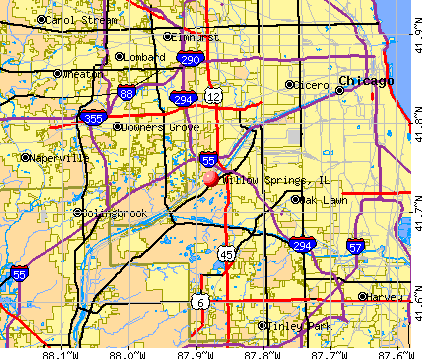


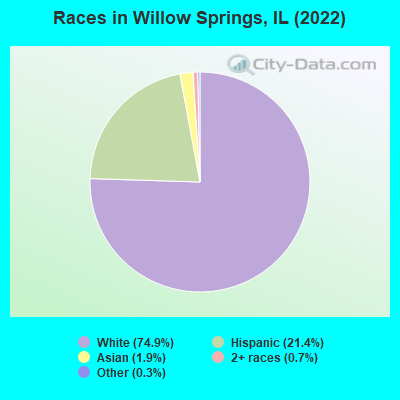
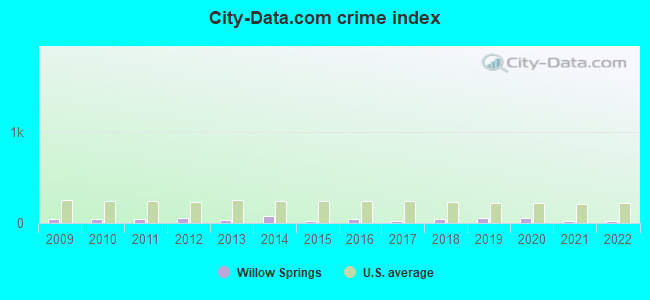
 Recent articles from our blog. Our writers, many of them Ph.D. graduates or candidates, create easy-to-read articles on a wide variety of topics.

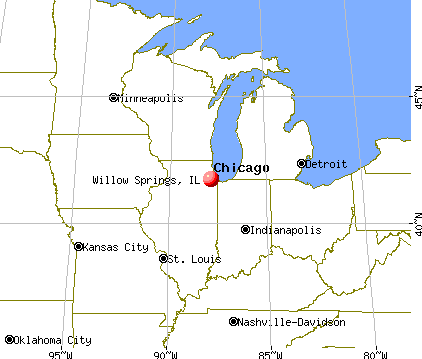
 (6.6 miles
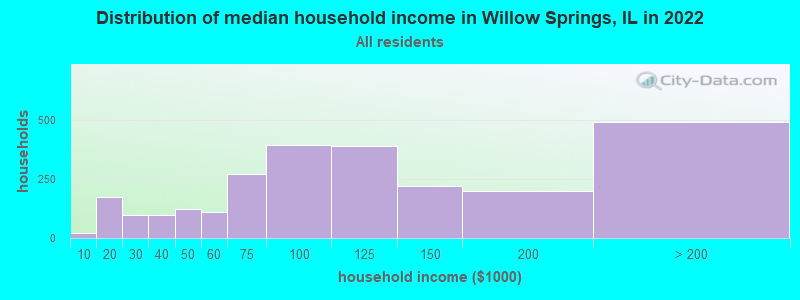
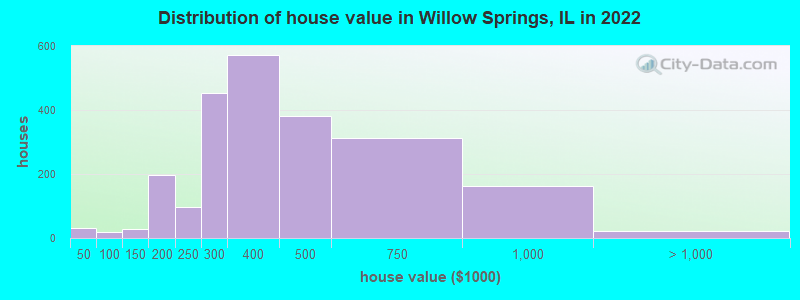
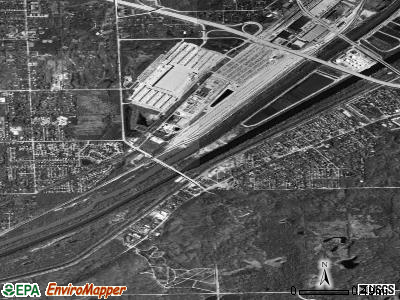
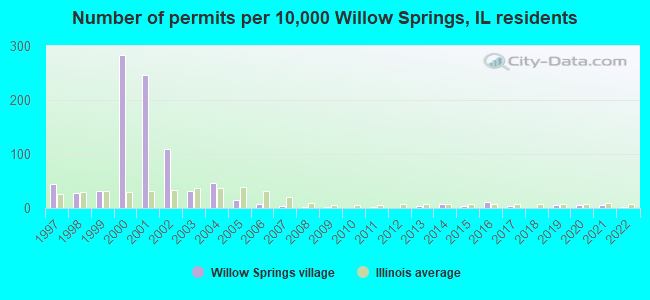
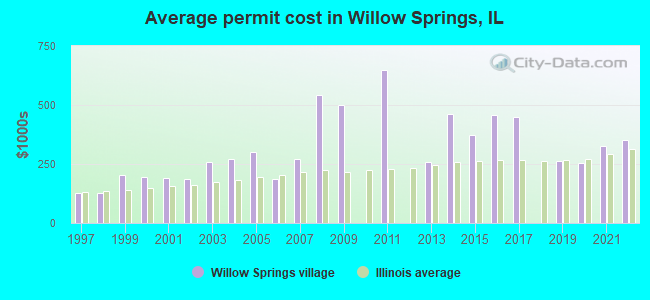
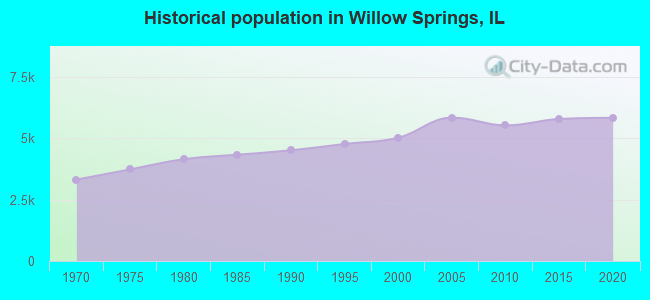
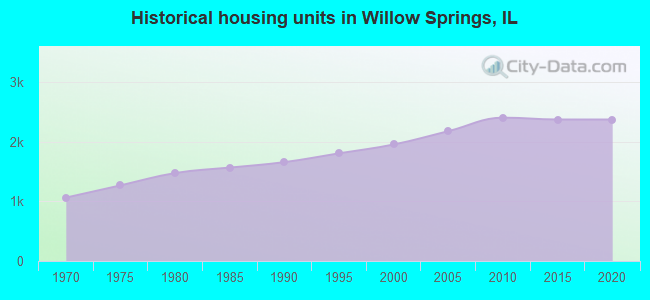
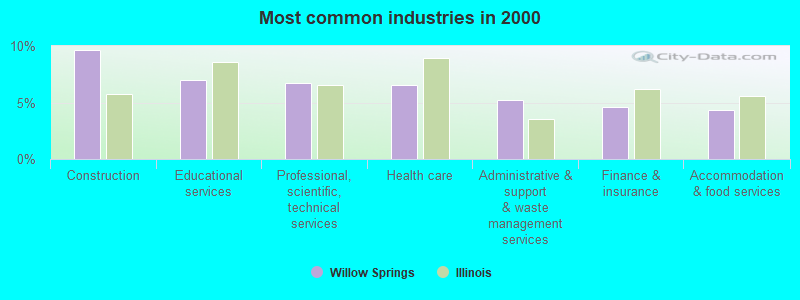
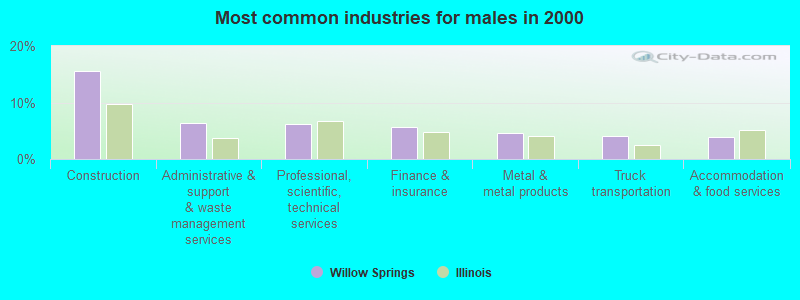
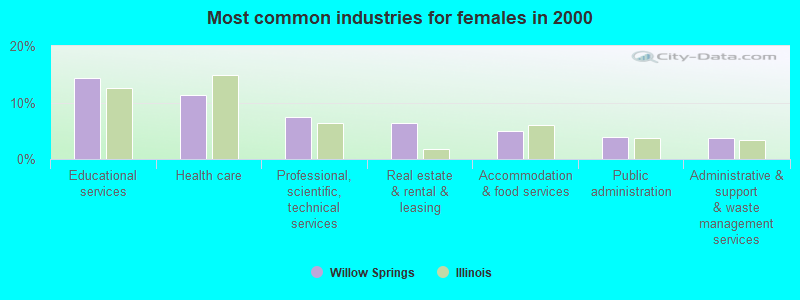
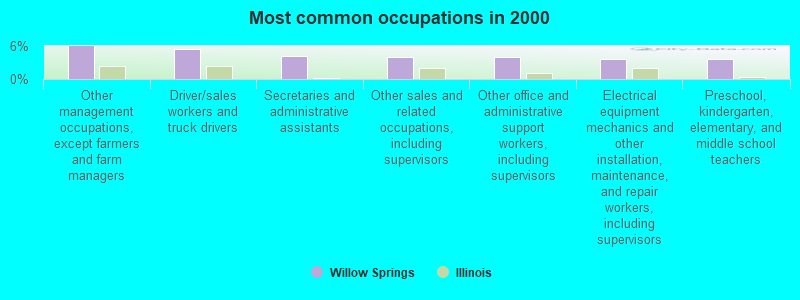
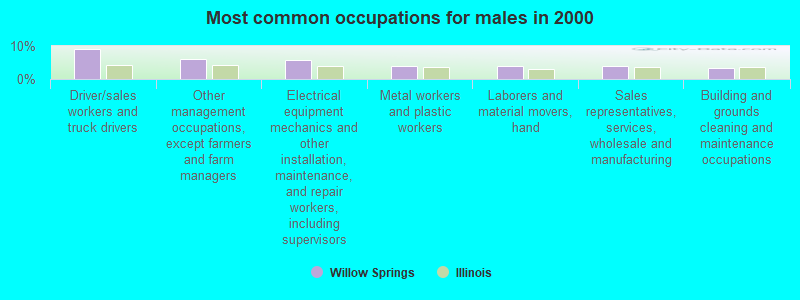
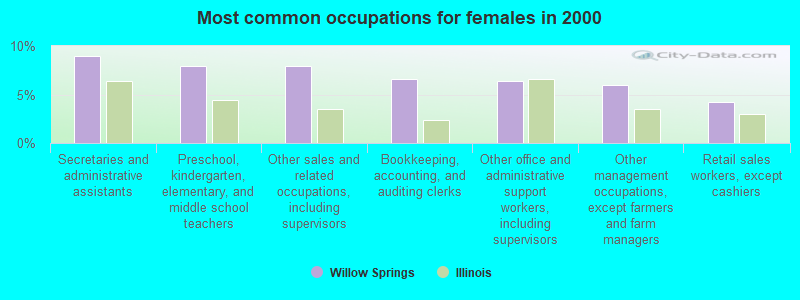
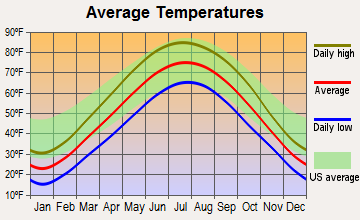
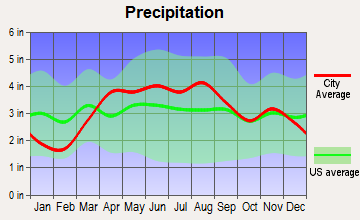
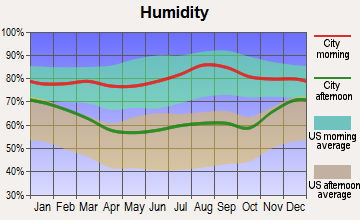
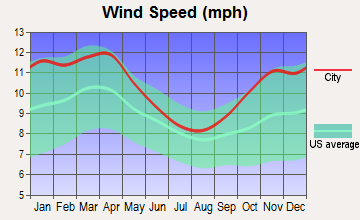
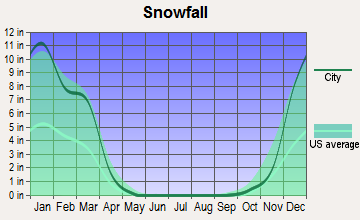
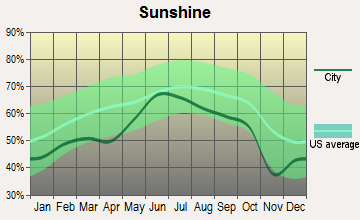
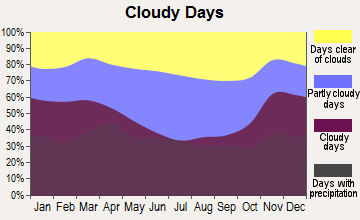
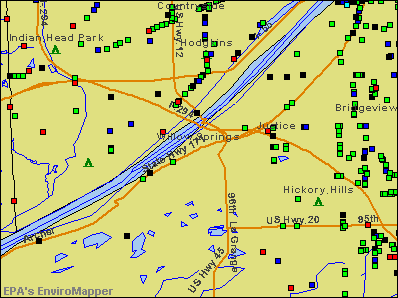

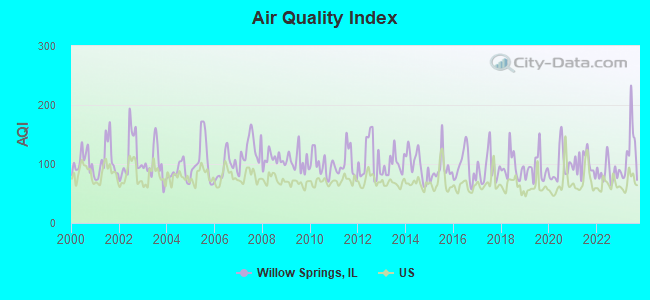
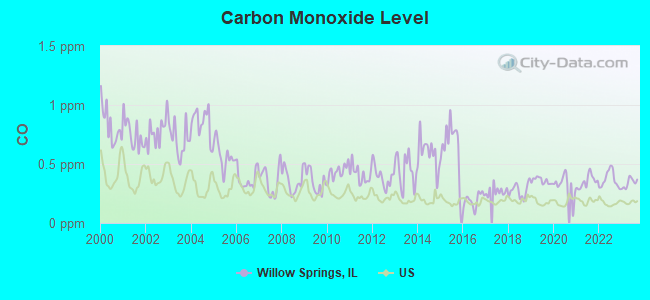
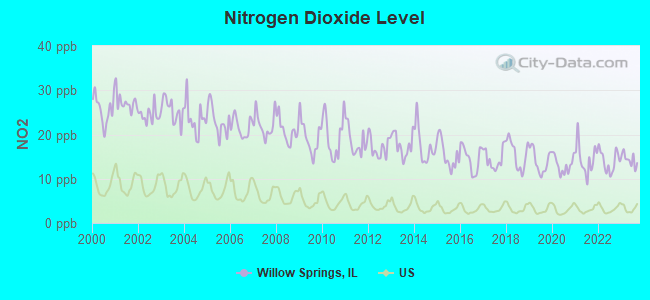
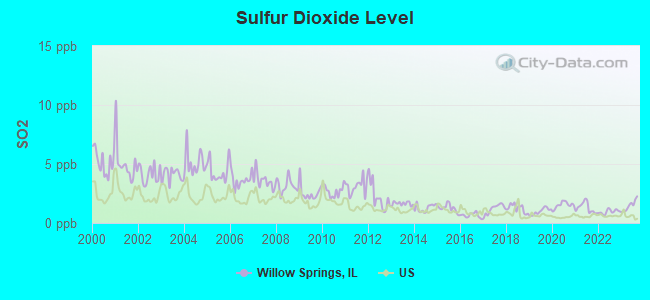
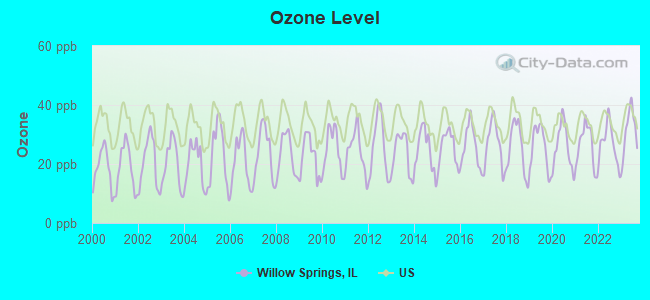
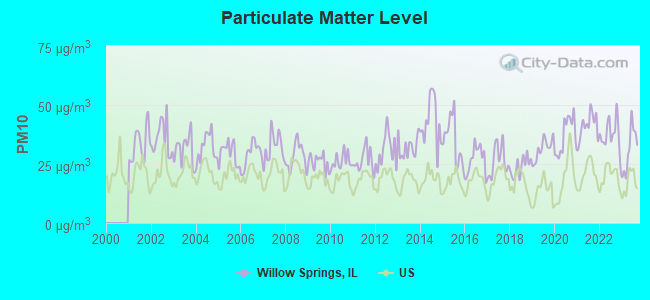
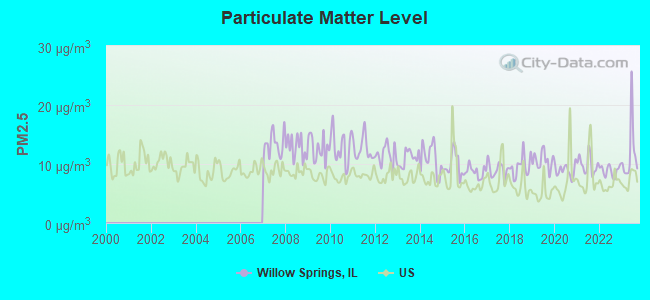
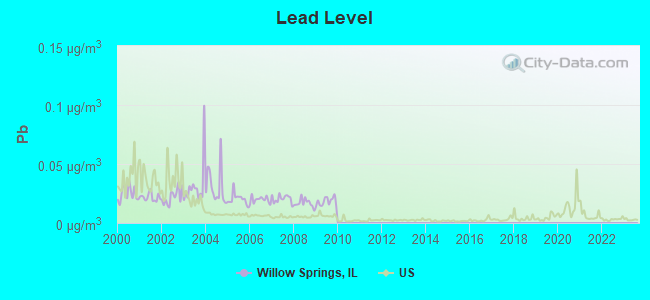
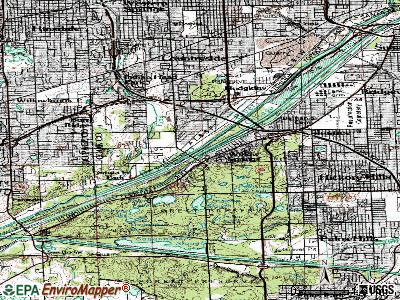
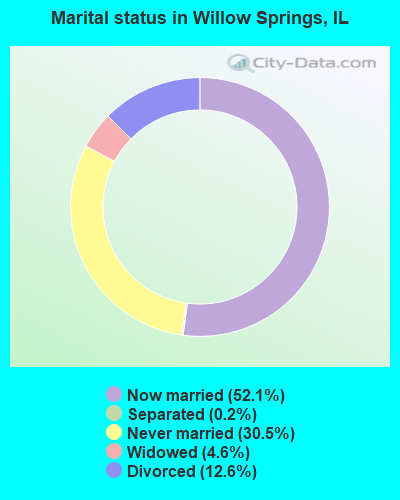
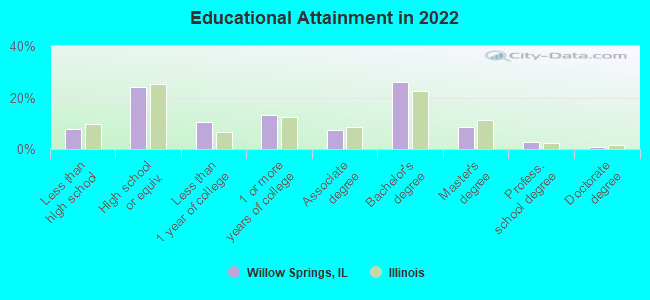
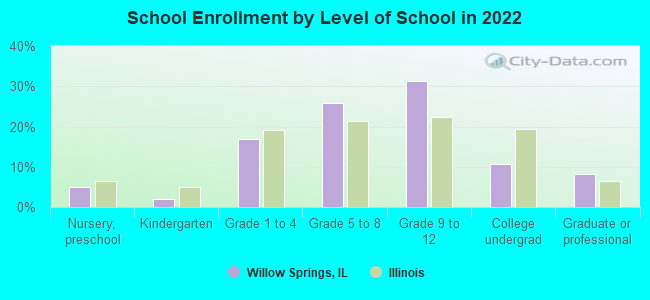
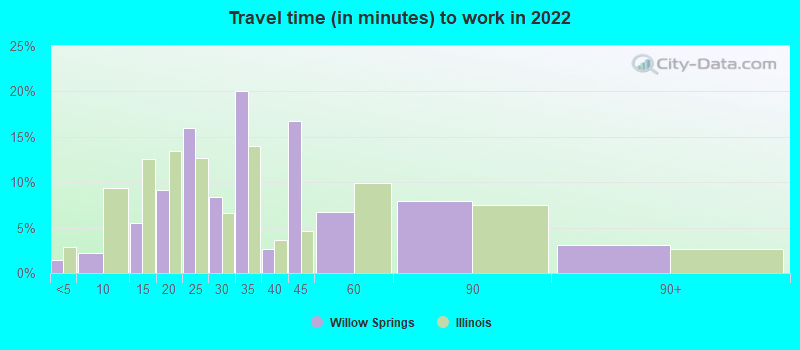
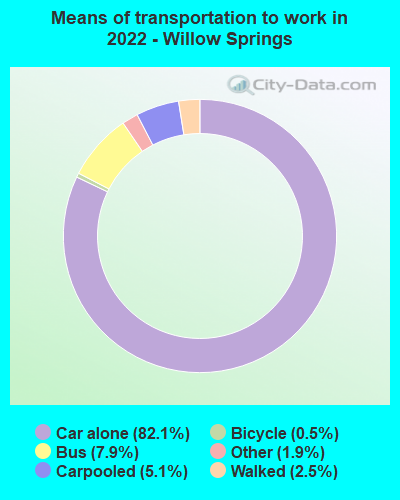


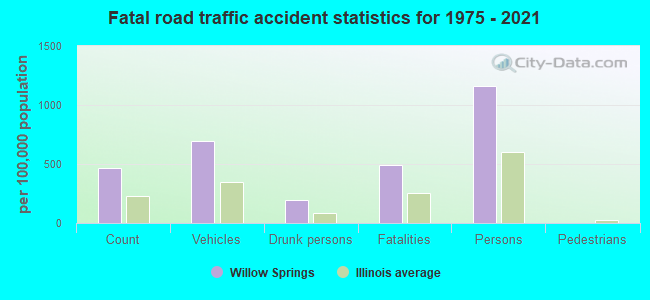
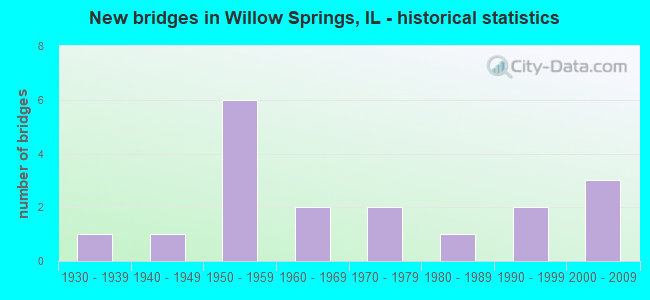
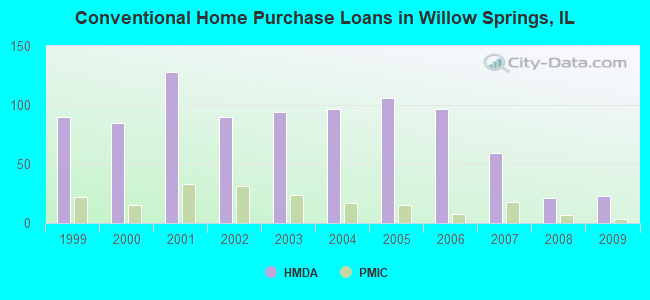
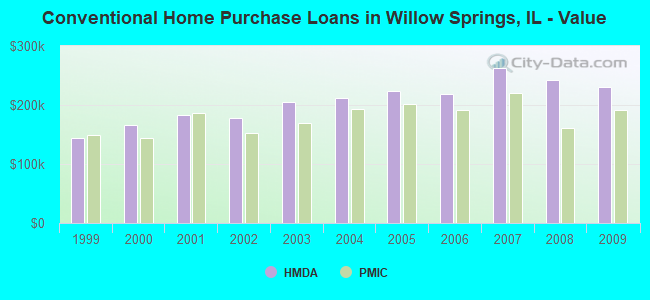
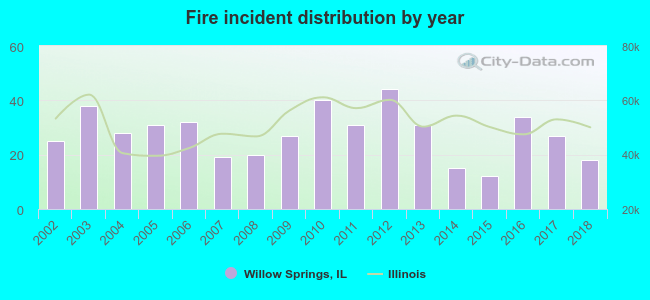 Based on the data from the years 2002 - 2018 the average number of fire incidents per year is 28. The highest number of fire incidents - 44 took place in 2012, and the least - 12 in 2015. The data has a declining trend.
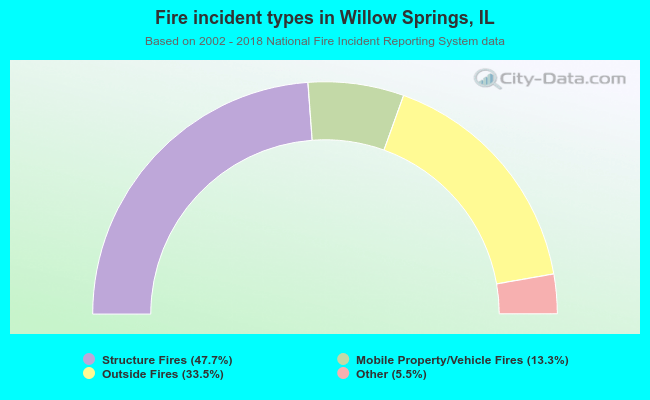 When looking into fire subcategories, the most reports belonged to: Structure Fires (47.7%), and Outside Fires (33.5%).