Aurora, Indiana Submit your own pictures of this city and show them to the world
OSM Map
General Map
Google Map
MSN Map
OSM Map
General Map
Google Map
MSN Map
OSM Map
General Map
Google Map
MSN Map
OSM Map
General Map
Google Map
MSN Map
Please wait while loading the map...
Population in 2022: 3,502 (98% urban, 2% rural). Population change since 2000: -11.7%Males: 1,805 Females: 1,697
March 2022 cost of living index in Aurora: 87.1 (less than average, U.S. average is 100) Percentage of residents living in poverty in 2022: 22.0%for White Non-Hispanic residents , 41.7% for Black residents , 9.1% for two or more races residents )
Profiles of local businesses
Business Search - 14 Million verified businesses
Data:
Median household income ($)
Median household income (% change since 2000)
Household income diversity
Ratio of average income to average house value (%)
Ratio of average income to average rent
Median household income ($) - White
Median household income ($) - Black or African American
Median household income ($) - Asian
Median household income ($) - Hispanic or Latino
Median household income ($) - American Indian and Alaska Native
Median household income ($) - Multirace
Median household income ($) - Other Race
Median household income for houses/condos with a mortgage ($)
Median household income for apartments without a mortgage ($)
Races - White alone (%)
Races - White alone (% change since 2000)
Races - Black alone (%)
Races - Black alone (% change since 2000)
Races - American Indian alone (%)
Races - American Indian alone (% change since 2000)
Races - Asian alone (%)
Races - Asian alone (% change since 2000)
Races - Hispanic (%)
Races - Hispanic (% change since 2000)
Races - Native Hawaiian and Other Pacific Islander alone (%)
Races - Native Hawaiian and Other Pacific Islander alone (% change since 2000)
Races - Two or more races (%)
Races - Two or more races (% change since 2000)
Races - Other race alone (%)
Races - Other race alone (% change since 2000)
Racial diversity
Unemployment (%)
Unemployment (% change since 2000)
Unemployment (%) - White
Unemployment (%) - Black or African American
Unemployment (%) - Asian
Unemployment (%) - Hispanic or Latino
Unemployment (%) - American Indian and Alaska Native
Unemployment (%) - Multirace
Unemployment (%) - Other Race
Population density (people per square mile)
Population - Males (%)
Population - Females (%)
Population - Males (%) - White
Population - Males (%) - Black or African American
Population - Males (%) - Asian
Population - Males (%) - Hispanic or Latino
Population - Males (%) - American Indian and Alaska Native
Population - Males (%) - Multirace
Population - Males (%) - Other Race
Population - Females (%) - White
Population - Females (%) - Black or African American
Population - Females (%) - Asian
Population - Females (%) - Hispanic or Latino
Population - Females (%) - American Indian and Alaska Native
Population - Females (%) - Multirace
Population - Females (%) - Other Race
Coronavirus confirmed cases (Apr 24, 2024)
Deaths caused by coronavirus (Apr 24, 2024)
Coronavirus confirmed cases (per 100k population) (Apr 24, 2024)
Deaths caused by coronavirus (per 100k population) (Apr 24, 2024)
Daily increase in number of cases (Apr 24, 2024)
Weekly increase in number of cases (Apr 24, 2024)
Cases doubled (in days) (Apr 24, 2024)
Hospitalized patients (Apr 18, 2022)
Negative test results (Apr 18, 2022)
Total test results (Apr 18, 2022)
COVID Vaccine doses distributed (per 100k population) (Sep 19, 2023)
COVID Vaccine doses administered (per 100k population) (Sep 19, 2023)
COVID Vaccine doses distributed (Sep 19, 2023)
COVID Vaccine doses administered (Sep 19, 2023)
Likely homosexual households (%)
Likely homosexual households (% change since 2000)
Likely homosexual households - Lesbian couples (%)
Likely homosexual households - Lesbian couples (% change since 2000)
Likely homosexual households - Gay men (%)
Likely homosexual households - Gay men (% change since 2000)
Cost of living index
Median gross rent ($)
Median contract rent ($)
Median monthly housing costs ($)
Median house or condo value ($)
Median house or condo value ($ change since 2000)
Mean house or condo value by units in structure - 1, detached ($)
Mean house or condo value by units in structure - 1, attached ($)
Mean house or condo value by units in structure - 2 ($)
Mean house or condo value by units in structure by units in structure - 3 or 4 ($)
Mean house or condo value by units in structure - 5 or more ($)
Mean house or condo value by units in structure - Boat, RV, van, etc. ($)
Mean house or condo value by units in structure - Mobile home ($)
Median house or condo value ($) - White
Median house or condo value ($) - Black or African American
Median house or condo value ($) - Asian
Median house or condo value ($) - Hispanic or Latino
Median house or condo value ($) - American Indian and Alaska Native
Median house or condo value ($) - Multirace
Median house or condo value ($) - Other Race
Median resident age
Resident age diversity
Median resident age - Males
Median resident age - Females
Median resident age - White
Median resident age - Black or African American
Median resident age - Asian
Median resident age - Hispanic or Latino
Median resident age - American Indian and Alaska Native
Median resident age - Multirace
Median resident age - Other Race
Median resident age - Males - White
Median resident age - Males - Black or African American
Median resident age - Males - Asian
Median resident age - Males - Hispanic or Latino
Median resident age - Males - American Indian and Alaska Native
Median resident age - Males - Multirace
Median resident age - Males - Other Race
Median resident age - Females - White
Median resident age - Females - Black or African American
Median resident age - Females - Asian
Median resident age - Females - Hispanic or Latino
Median resident age - Females - American Indian and Alaska Native
Median resident age - Females - Multirace
Median resident age - Females - Other Race
Commute - mean travel time to work (minutes)
Travel time to work - Less than 5 minutes (%)
Travel time to work - Less than 5 minutes (% change since 2000)
Travel time to work - 5 to 9 minutes (%)
Travel time to work - 5 to 9 minutes (% change since 2000)
Travel time to work - 10 to 19 minutes (%)
Travel time to work - 10 to 19 minutes (% change since 2000)
Travel time to work - 20 to 29 minutes (%)
Travel time to work - 20 to 29 minutes (% change since 2000)
Travel time to work - 30 to 39 minutes (%)
Travel time to work - 30 to 39 minutes (% change since 2000)
Travel time to work - 40 to 59 minutes (%)
Travel time to work - 40 to 59 minutes (% change since 2000)
Travel time to work - 60 to 89 minutes (%)
Travel time to work - 60 to 89 minutes (% change since 2000)
Travel time to work - 90 or more minutes (%)
Travel time to work - 90 or more minutes (% change since 2000)
Marital status - Never married (%)
Marital status - Now married (%)
Marital status - Separated (%)
Marital status - Widowed (%)
Marital status - Divorced (%)
Median family income ($)
Median family income (% change since 2000)
Median non-family income ($)
Median non-family income (% change since 2000)
Median per capita income ($)
Median per capita income (% change since 2000)
Median family income ($) - White
Median family income ($) - Black or African American
Median family income ($) - Asian
Median family income ($) - Hispanic or Latino
Median family income ($) - American Indian and Alaska Native
Median family income ($) - Multirace
Median family income ($) - Other Race
Median year house/condo built
Median year apartment built
Year house built - Built 2005 or later (%)
Year house built - Built 2000 to 2004 (%)
Year house built - Built 1990 to 1999 (%)
Year house built - Built 1980 to 1989 (%)
Year house built - Built 1970 to 1979 (%)
Year house built - Built 1960 to 1969 (%)
Year house built - Built 1950 to 1959 (%)
Year house built - Built 1940 to 1949 (%)
Year house built - Built 1939 or earlier (%)
Average household size
Household density (households per square mile)
Average household size - White
Average household size - Black or African American
Average household size - Asian
Average household size - Hispanic or Latino
Average household size - American Indian and Alaska Native
Average household size - Multirace
Average household size - Other Race
Occupied housing units (%)
Vacant housing units (%)
Owner occupied housing units (%)
Renter occupied housing units (%)
Vacancy status - For rent (%)
Vacancy status - For sale only (%)
Vacancy status - Rented or sold, not occupied (%)
Vacancy status - For seasonal, recreational, or occasional use (%)
Vacancy status - For migrant workers (%)
Vacancy status - Other vacant (%)
Residents with income below the poverty level (%)
Residents with income below 50% of the poverty level (%)
Children below poverty level (%)
Poor families by family type - Married-couple family (%)
Poor families by family type - Male, no wife present (%)
Poor families by family type - Female, no husband present (%)
Poverty status for native-born residents (%)
Poverty status for foreign-born residents (%)
Poverty among high school graduates not in families (%)
Poverty among people who did not graduate high school not in families (%)
Residents with income below the poverty level (%) - White
Residents with income below the poverty level (%) - Black or African American
Residents with income below the poverty level (%) - Asian
Residents with income below the poverty level (%) - Hispanic or Latino
Residents with income below the poverty level (%) - American Indian and Alaska Native
Residents with income below the poverty level (%) - Multirace
Residents with income below the poverty level (%) - Other Race
Air pollution - Air Quality Index (AQI)
Air pollution - CO
Air pollution - NO2
Air pollution - SO2
Air pollution - Ozone
Air pollution - PM10
Air pollution - PM25
Air pollution - Pb
Crime - Murders per 100,000 population
Crime - Rapes per 100,000 population
Crime - Robberies per 100,000 population
Crime - Assaults per 100,000 population
Crime - Burglaries per 100,000 population
Crime - Thefts per 100,000 population
Crime - Auto thefts per 100,000 population
Crime - Arson per 100,000 population
Crime - City-data.com crime index
Crime - Violent crime index
Crime - Property crime index
Crime - Murders per 100,000 population (5 year average)
Crime - Rapes per 100,000 population (5 year average)
Crime - Robberies per 100,000 population (5 year average)
Crime - Assaults per 100,000 population (5 year average)
Crime - Burglaries per 100,000 population (5 year average)
Crime - Thefts per 100,000 population (5 year average)
Crime - Auto thefts per 100,000 population (5 year average)
Crime - Arson per 100,000 population (5 year average)
Crime - City-data.com crime index (5 year average)
Crime - Violent crime index (5 year average)
Crime - Property crime index (5 year average)
1996 Presidential Elections Results (%) - Democratic Party (Clinton)
1996 Presidential Elections Results (%) - Republican Party (Dole)
1996 Presidential Elections Results (%) - Other
2000 Presidential Elections Results (%) - Democratic Party (Gore)
2000 Presidential Elections Results (%) - Republican Party (Bush)
2000 Presidential Elections Results (%) - Other
2004 Presidential Elections Results (%) - Democratic Party (Kerry)
2004 Presidential Elections Results (%) - Republican Party (Bush)
2004 Presidential Elections Results (%) - Other
2008 Presidential Elections Results (%) - Democratic Party (Obama)
2008 Presidential Elections Results (%) - Republican Party (McCain)
2008 Presidential Elections Results (%) - Other
2012 Presidential Elections Results (%) - Democratic Party (Obama)
2012 Presidential Elections Results (%) - Republican Party (Romney)
2012 Presidential Elections Results (%) - Other
2016 Presidential Elections Results (%) - Democratic Party (Clinton)
2016 Presidential Elections Results (%) - Republican Party (Trump)
2016 Presidential Elections Results (%) - Other
2020 Presidential Elections Results (%) - Democratic Party (Biden)
2020 Presidential Elections Results (%) - Republican Party (Trump)
2020 Presidential Elections Results (%) - Other
Ancestries Reported - Arab (%)
Ancestries Reported - Czech (%)
Ancestries Reported - Danish (%)
Ancestries Reported - Dutch (%)
Ancestries Reported - English (%)
Ancestries Reported - French (%)
Ancestries Reported - French Canadian (%)
Ancestries Reported - German (%)
Ancestries Reported - Greek (%)
Ancestries Reported - Hungarian (%)
Ancestries Reported - Irish (%)
Ancestries Reported - Italian (%)
Ancestries Reported - Lithuanian (%)
Ancestries Reported - Norwegian (%)
Ancestries Reported - Polish (%)
Ancestries Reported - Portuguese (%)
Ancestries Reported - Russian (%)
Ancestries Reported - Scotch-Irish (%)
Ancestries Reported - Scottish (%)
Ancestries Reported - Slovak (%)
Ancestries Reported - Subsaharan African (%)
Ancestries Reported - Swedish (%)
Ancestries Reported - Swiss (%)
Ancestries Reported - Ukrainian (%)
Ancestries Reported - United States (%)
Ancestries Reported - Welsh (%)
Ancestries Reported - West Indian (%)
Ancestries Reported - Other (%)
Educational Attainment - No schooling completed (%)
Educational Attainment - Less than high school (%)
Educational Attainment - High school or equivalent (%)
Educational Attainment - Less than 1 year of college (%)
Educational Attainment - 1 or more years of college (%)
Educational Attainment - Associate degree (%)
Educational Attainment - Bachelor's degree (%)
Educational Attainment - Master's degree (%)
Educational Attainment - Professional school degree (%)
Educational Attainment - Doctorate degree (%)
School Enrollment - Nursery, preschool (%)
School Enrollment - Kindergarten (%)
School Enrollment - Grade 1 to 4 (%)
School Enrollment - Grade 5 to 8 (%)
School Enrollment - Grade 9 to 12 (%)
School Enrollment - College undergrad (%)
School Enrollment - Graduate or professional (%)
School Enrollment - Not enrolled in school (%)
School enrollment - Public schools (%)
School enrollment - Private schools (%)
School enrollment - Not enrolled (%)
Median number of rooms in houses and condos
Median number of rooms in apartments
Housing units lacking complete plumbing facilities (%)
Housing units lacking complete kitchen facilities (%)
Density of houses
Urban houses (%)
Rural houses (%)
Households with people 60 years and over (%)
Households with people 65 years and over (%)
Households with people 75 years and over (%)
Households with one or more nonrelatives (%)
Households with no nonrelatives (%)
Population in households (%)
Family households (%)
Nonfamily households (%)
Population in families (%)
Family households with own children (%)
Median number of bedrooms in owner occupied houses
Mean number of bedrooms in owner occupied houses
Median number of bedrooms in renter occupied houses
Mean number of bedrooms in renter occupied houses
Median number of vehichles in owner occupied houses
Mean number of vehichles in owner occupied houses
Median number of vehichles in renter occupied houses
Mean number of vehichles in renter occupied houses
Mortgage status - with mortgage (%)
Mortgage status - with second mortgage (%)
Mortgage status - with home equity loan (%)
Mortgage status - with both second mortgage and home equity loan (%)
Mortgage status - without a mortgage (%)
Average family size
Average family size - White
Average family size - Black or African American
Average family size - Asian
Average family size - Hispanic or Latino
Average family size - American Indian and Alaska Native
Average family size - Multirace
Average family size - Other Race
Geographical mobility - Same house 1 year ago (%)
Geographical mobility - Moved within same county (%)
Geographical mobility - Moved from different county within same state (%)
Geographical mobility - Moved from different state (%)
Geographical mobility - Moved from abroad (%)
Place of birth - Born in state of residence (%)
Place of birth - Born in other state (%)
Place of birth - Native, outside of US (%)
Place of birth - Foreign born (%)
Housing units in structures - 1, detached (%)
Housing units in structures - 1, attached (%)
Housing units in structures - 2 (%)
Housing units in structures - 3 or 4 (%)
Housing units in structures - 5 to 9 (%)
Housing units in structures - 10 to 19 (%)
Housing units in structures - 20 to 49 (%)
Housing units in structures - 50 or more (%)
Housing units in structures - Mobile home (%)
Housing units in structures - Boat, RV, van, etc. (%)
House/condo owner moved in on average (years ago)
Renter moved in on average (years ago)
Year householder moved into unit - Moved in 1999 to March 2000 (%)
Year householder moved into unit - Moved in 1995 to 1998 (%)
Year householder moved into unit - Moved in 1990 to 1994 (%)
Year householder moved into unit - Moved in 1980 to 1989 (%)
Year householder moved into unit - Moved in 1970 to 1979 (%)
Year householder moved into unit - Moved in 1969 or earlier (%)
Means of transportation to work - Drove car alone (%)
Means of transportation to work - Carpooled (%)
Means of transportation to work - Public transportation (%)
Means of transportation to work - Bus or trolley bus (%)
Means of transportation to work - Streetcar or trolley car (%)
Means of transportation to work - Subway or elevated (%)
Means of transportation to work - Railroad (%)
Means of transportation to work - Ferryboat (%)
Means of transportation to work - Taxicab (%)
Means of transportation to work - Motorcycle (%)
Means of transportation to work - Bicycle (%)
Means of transportation to work - Walked (%)
Means of transportation to work - Other means (%)
Working at home (%)
Industry diversity
Most Common Industries - Agriculture, forestry, fishing and hunting, and mining (%)
Most Common Industries - Agriculture, forestry, fishing and hunting (%)
Most Common Industries - Mining, quarrying, and oil and gas extraction (%)
Most Common Industries - Construction (%)
Most Common Industries - Manufacturing (%)
Most Common Industries - Wholesale trade (%)
Most Common Industries - Retail trade (%)
Most Common Industries - Transportation and warehousing, and utilities (%)
Most Common Industries - Transportation and warehousing (%)
Most Common Industries - Utilities (%)
Most Common Industries - Information (%)
Most Common Industries - Finance and insurance, and real estate and rental and leasing (%)
Most Common Industries - Finance and insurance (%)
Most Common Industries - Real estate and rental and leasing (%)
Most Common Industries - Professional, scientific, and management, and administrative and waste management services (%)
Most Common Industries - Professional, scientific, and technical services (%)
Most Common Industries - Management of companies and enterprises (%)
Most Common Industries - Administrative and support and waste management services (%)
Most Common Industries - Educational services, and health care and social assistance (%)
Most Common Industries - Educational services (%)
Most Common Industries - Health care and social assistance (%)
Most Common Industries - Arts, entertainment, and recreation, and accommodation and food services (%)
Most Common Industries - Arts, entertainment, and recreation (%)
Most Common Industries - Accommodation and food services (%)
Most Common Industries - Other services, except public administration (%)
Most Common Industries - Public administration (%)
Occupation diversity
Most Common Occupations - Management, business, science, and arts occupations (%)
Most Common Occupations - Management, business, and financial occupations (%)
Most Common Occupations - Management occupations (%)
Most Common Occupations - Business and financial operations occupations (%)
Most Common Occupations - Computer, engineering, and science occupations (%)
Most Common Occupations - Computer and mathematical occupations (%)
Most Common Occupations - Architecture and engineering occupations (%)
Most Common Occupations - Life, physical, and social science occupations (%)
Most Common Occupations - Education, legal, community service, arts, and media occupations (%)
Most Common Occupations - Community and social service occupations (%)
Most Common Occupations - Legal occupations (%)
Most Common Occupations - Education, training, and library occupations (%)
Most Common Occupations - Arts, design, entertainment, sports, and media occupations (%)
Most Common Occupations - Healthcare practitioners and technical occupations (%)
Most Common Occupations - Health diagnosing and treating practitioners and other technical occupations (%)
Most Common Occupations - Health technologists and technicians (%)
Most Common Occupations - Service occupations (%)
Most Common Occupations - Healthcare support occupations (%)
Most Common Occupations - Protective service occupations (%)
Most Common Occupations - Fire fighting and prevention, and other protective service workers including supervisors (%)
Most Common Occupations - Law enforcement workers including supervisors (%)
Most Common Occupations - Food preparation and serving related occupations (%)
Most Common Occupations - Building and grounds cleaning and maintenance occupations (%)
Most Common Occupations - Personal care and service occupations (%)
Most Common Occupations - Sales and office occupations (%)
Most Common Occupations - Sales and related occupations (%)
Most Common Occupations - Office and administrative support occupations (%)
Most Common Occupations - Natural resources, construction, and maintenance occupations (%)
Most Common Occupations - Farming, fishing, and forestry occupations (%)
Most Common Occupations - Construction and extraction occupations (%)
Most Common Occupations - Installation, maintenance, and repair occupations (%)
Most Common Occupations - Production, transportation, and material moving occupations (%)
Most Common Occupations - Production occupations (%)
Most Common Occupations - Transportation occupations (%)
Most Common Occupations - Material moving occupations (%)
People in Group quarters - Institutionalized population (%)
People in Group quarters - Correctional institutions (%)
People in Group quarters - Federal prisons and detention centers (%)
People in Group quarters - Halfway houses (%)
People in Group quarters - Local jails and other confinement facilities (including police lockups) (%)
People in Group quarters - Military disciplinary barracks (%)
People in Group quarters - State prisons (%)
People in Group quarters - Other types of correctional institutions (%)
People in Group quarters - Nursing homes (%)
People in Group quarters - Hospitals/wards, hospices, and schools for the handicapped (%)
People in Group quarters - Hospitals/wards and hospices for chronically ill (%)
People in Group quarters - Hospices or homes for chronically ill (%)
People in Group quarters - Military hospitals or wards for chronically ill (%)
People in Group quarters - Other hospitals or wards for chronically ill (%)
People in Group quarters - Hospitals or wards for drug/alcohol abuse (%)
People in Group quarters - Mental (Psychiatric) hospitals or wards (%)
People in Group quarters - Schools, hospitals, or wards for the mentally retarded (%)
People in Group quarters - Schools, hospitals, or wards for the physically handicapped (%)
People in Group quarters - Institutions for the deaf (%)
People in Group quarters - Institutions for the blind (%)
People in Group quarters - Orthopedic wards and institutions for the physically handicapped (%)
People in Group quarters - Wards in general hospitals for patients who have no usual home elsewhere (%)
People in Group quarters - Wards in military hospitals for patients who have no usual home elsewhere (%)
People in Group quarters - Juvenile institutions (%)
People in Group quarters - Long-term care (%)
People in Group quarters - Homes for abused, dependent, and neglected children (%)
People in Group quarters - Residential treatment centers for emotionally disturbed children (%)
People in Group quarters - Training schools for juvenile delinquents (%)
People in Group quarters - Short-term care, detention or diagnostic centers for delinquent children (%)
People in Group quarters - Type of juvenile institution unknown (%)
People in Group quarters - Noninstitutionalized population (%)
People in Group quarters - College dormitories (includes college quarters off campus) (%)
People in Group quarters - Military quarters (%)
People in Group quarters - On base (%)
People in Group quarters - Barracks, unaccompanied personnel housing (UPH), (Enlisted/Officer), ;and similar group living quarters for military personnel (%)
People in Group quarters - Transient quarters for temporary residents (%)
People in Group quarters - Military ships (%)
People in Group quarters - Group homes (%)
People in Group quarters - Homes or halfway houses for drug/alcohol abuse (%)
People in Group quarters - Homes for the mentally ill (%)
People in Group quarters - Homes for the mentally retarded (%)
People in Group quarters - Homes for the physically handicapped (%)
People in Group quarters - Other group homes (%)
People in Group quarters - Religious group quarters (%)
People in Group quarters - Dormitories (%)
People in Group quarters - Agriculture workers' dormitories on farms (%)
People in Group quarters - Job Corps and vocational training facilities (%)
People in Group quarters - Other workers' dormitories (%)
People in Group quarters - Crews of maritime vessels (%)
People in Group quarters - Other nonhousehold living situations (%)
People in Group quarters - Other noninstitutional group quarters (%)
Residents speaking English at home (%)
Residents speaking English at home - Born in the United States (%)
Residents speaking English at home - Native, born elsewhere (%)
Residents speaking English at home - Foreign born (%)
Residents speaking Spanish at home (%)
Residents speaking Spanish at home - Born in the United States (%)
Residents speaking Spanish at home - Native, born elsewhere (%)
Residents speaking Spanish at home - Foreign born (%)
Residents speaking other language at home (%)
Residents speaking other language at home - Born in the United States (%)
Residents speaking other language at home - Native, born elsewhere (%)
Residents speaking other language at home - Foreign born (%)
Class of Workers - Employee of private company (%)
Class of Workers - Self-employed in own incorporated business (%)
Class of Workers - Private not-for-profit wage and salary workers (%)
Class of Workers - Local government workers (%)
Class of Workers - State government workers (%)
Class of Workers - Federal government workers (%)
Class of Workers - Self-employed workers in own not incorporated business and Unpaid family workers (%)
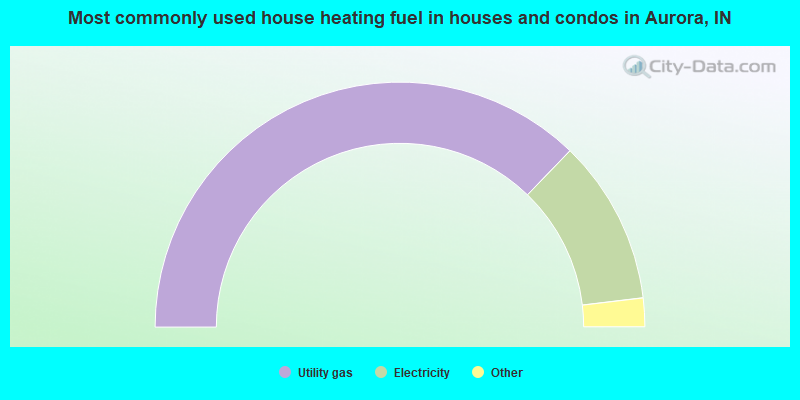
House heating fuel used in houses and condos - Utility gas (%)
House heating fuel used in houses and condos - Bottled, tank, or LP gas (%)
House heating fuel used in houses and condos - Electricity (%)
House heating fuel used in houses and condos - Fuel oil, kerosene, etc. (%)
House heating fuel used in houses and condos - Coal or coke (%)
House heating fuel used in houses and condos - Wood (%)
House heating fuel used in houses and condos - Solar energy (%)
House heating fuel used in houses and condos - Other fuel (%)
House heating fuel used in houses and condos - No fuel used (%)
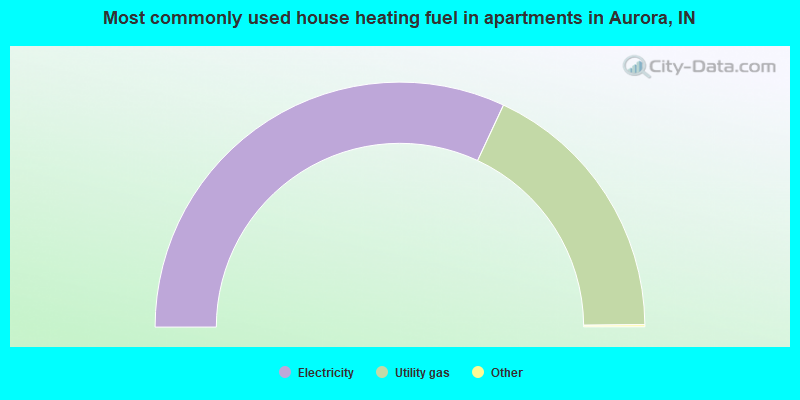
House heating fuel used in apartments - Utility gas (%)
House heating fuel used in apartments - Bottled, tank, or LP gas (%)
House heating fuel used in apartments - Electricity (%)
House heating fuel used in apartments - Fuel oil, kerosene, etc. (%)
House heating fuel used in apartments - Coal or coke (%)
House heating fuel used in apartments - Wood (%)
House heating fuel used in apartments - Solar energy (%)
House heating fuel used in apartments - Other fuel (%)
House heating fuel used in apartments - No fuel used (%)
Armed forces status - In Armed Forces (%)
Armed forces status - Civilian (%)
Armed forces status - Civilian - Veteran (%)
Armed forces status - Civilian - Nonveteran (%)
Fatal accidents locations in years 2005-2021
Fatal accidents locations in 2005
Fatal accidents locations in 2006
Fatal accidents locations in 2007
Fatal accidents locations in 2008
Fatal accidents locations in 2009
Fatal accidents locations in 2010
Fatal accidents locations in 2011
Fatal accidents locations in 2012
Fatal accidents locations in 2013
Fatal accidents locations in 2014
Fatal accidents locations in 2015
Fatal accidents locations in 2016
Fatal accidents locations in 2017
Fatal accidents locations in 2018
Fatal accidents locations in 2019
Fatal accidents locations in 2020
Fatal accidents locations in 2021
Alcohol use - People drinking some alcohol every month (%)
Alcohol use - People not drinking at all (%)
Alcohol use - Average days/month drinking alcohol
Alcohol use - Average drinks/week
Alcohol use - Average days/year people drink much
Audiometry - Average condition of hearing (%)
Audiometry - People that can hear a whisper from across a quiet room (%)
Audiometry - People that can hear normal voice from across a quiet room (%)
Audiometry - Ears ringing, roaring, buzzing (%)
Audiometry - Had a job exposure to loud noise (%)
Audiometry - Had off-work exposure to loud noise (%)
Blood Pressure & Cholesterol - Has high blood pressure (%)
Blood Pressure & Cholesterol - Checking blood pressure at home (%)
Blood Pressure & Cholesterol - Frequently checking blood cholesterol (%)
Blood Pressure & Cholesterol - Has high cholesterol level (%)
Consumer Behavior - Money monthly spent on food at supermarket/grocery store
Consumer Behavior - Money monthly spent on food at other stores
Consumer Behavior - Money monthly spent on eating out
Consumer Behavior - Money monthly spent on carryout/delivered foods
Consumer Behavior - Income spent on food at supermarket/grocery store (%)
Consumer Behavior - Income spent on food at other stores (%)
Consumer Behavior - Income spent on eating out (%)
Consumer Behavior - Income spent on carryout/delivered foods (%)
Current Health Status - General health condition (%)
Current Health Status - Blood donors (%)
Current Health Status - Has blood ever tested for HIV virus (%)
Current Health Status - Left-handed people (%)
Dermatology - People using sunscreen (%)
Diabetes - Diabetics (%)
Diabetes - Had a blood test for high blood sugar (%)
Diabetes - People taking insulin (%)
Diet Behavior & Nutrition - Diet health (%)
Diet Behavior & Nutrition - Milk product consumption (# of products/month)
Diet Behavior & Nutrition - Meals not home prepared (#/week)
Diet Behavior & Nutrition - Meals from fast food or pizza place (#/week)
Diet Behavior & Nutrition - Ready-to-eat foods (#/month)
Diet Behavior & Nutrition - Frozen meals/pizza (#/month)
Drug Use - People that ever used marijuana or hashish (%)
Drug Use - Ever used hard drugs (%)
Drug Use - Ever used any form of cocaine (%)
Drug Use - Ever used heroin (%)
Drug Use - Ever used methamphetamine (%)
Health Insurance - People covered by health insurance (%)
Kidney Conditions-Urology - Avg. # of times urinating at night
Medical Conditions - People with asthma (%)
Medical Conditions - People with anemia (%)
Medical Conditions - People with psoriasis (%)
Medical Conditions - People with overweight (%)
Medical Conditions - Elderly people having difficulties in thinking or remembering (%)
Medical Conditions - People who ever received blood transfusion (%)
Medical Conditions - People having trouble seeing even with glass/contacts (%)
Medical Conditions - People with arthritis (%)
Medical Conditions - People with gout (%)
Medical Conditions - People with congestive heart failure (%)
Medical Conditions - People with coronary heart disease (%)
Medical Conditions - People with angina pectoris (%)
Medical Conditions - People who ever had heart attack (%)
Medical Conditions - People who ever had stroke (%)
Medical Conditions - People with emphysema (%)
Medical Conditions - People with thyroid problem (%)
Medical Conditions - People with chronic bronchitis (%)
Medical Conditions - People with any liver condition (%)
Medical Conditions - People who ever had cancer or malignancy (%)
Mental Health - People who have little interest in doing things (%)
Mental Health - People feeling down, depressed, or hopeless (%)
Mental Health - People who have trouble sleeping or sleeping too much (%)
Mental Health - People feeling tired or having little energy (%)
Mental Health - People with poor appetite or overeating (%)
Mental Health - People feeling bad about themself (%)
Mental Health - People who have trouble concentrating on things (%)
Mental Health - People moving or speaking slowly or too fast (%)
Mental Health - People having thoughts they would be better off dead (%)
Oral Health - Average years since last visit a dentist
Oral Health - People embarrassed because of mouth (%)
Oral Health - People with gum disease (%)
Oral Health - General health of teeth and gums (%)
Oral Health - Average days a week using dental floss/device
Oral Health - Average days a week using mouthwash for dental problem
Oral Health - Average number of teeth
Pesticide Use - Households using pesticides to control insects (%)
Pesticide Use - Households using pesticides to kill weeds (%)
Physical Activity - People doing vigorous-intensity work activities (%)
Physical Activity - People doing moderate-intensity work activities (%)
Physical Activity - People walking or bicycling (%)
Physical Activity - People doing vigorous-intensity recreational activities (%)
Physical Activity - People doing moderate-intensity recreational activities (%)
Physical Activity - Average hours a day doing sedentary activities
Physical Activity - Average hours a day watching TV or videos
Physical Activity - Average hours a day using computer
Physical Functioning - People having limitations keeping them from working (%)
Physical Functioning - People limited in amount of work they can do (%)
Physical Functioning - People that need special equipment to walk (%)
Physical Functioning - People experiencing confusion/memory problems (%)
Physical Functioning - People requiring special healthcare equipment (%)
Prescription Medications - Average number of prescription medicines taking
Preventive Aspirin Use - Adults 40+ taking low-dose aspirin (%)
Reproductive Health - Vaginal deliveries (%)
Reproductive Health - Cesarean deliveries (%)
Reproductive Health - Deliveries resulted in a live birth (%)
Reproductive Health - Pregnancies resulted in a delivery (%)
Reproductive Health - Women breastfeeding newborns (%)
Reproductive Health - Women that had a hysterectomy (%)
Reproductive Health - Women that had both ovaries removed (%)
Reproductive Health - Women that have ever taken birth control pills (%)
Reproductive Health - Women taking birth control pills (%)
Reproductive Health - Women that have ever used Depo-Provera or injectables (%)
Reproductive Health - Women that have ever used female hormones (%)
Sexual Behavior - People 18+ that ever had sex (vaginal, anal, or oral) (%)
Sexual Behavior - Males 18+ that ever had vaginal sex with a woman (%)
Sexual Behavior - Males 18+ that ever performed oral sex on a woman (%)
Sexual Behavior - Males 18+ that ever had anal sex with a woman (%)
Sexual Behavior - Males 18+ that ever had any sex with a man (%)
Sexual Behavior - Females 18+ that ever had vaginal sex with a man (%)
Sexual Behavior - Females 18+ that ever performed oral sex on a man (%)
Sexual Behavior - Females 18+ that ever had anal sex with a man (%)
Sexual Behavior - Females 18+ that ever had any kind of sex with a woman (%)
Sexual Behavior - Average age people first had sex
Sexual Behavior - Average number of female sex partners in lifetime (males 18+)
Sexual Behavior - Average number of female vaginal sex partners in lifetime (males 18+)
Sexual Behavior - Average age people first performed oral sex on a woman (18+)
Sexual Behavior - Average number of woman performed oral sex on in lifetime (18+)
Sexual Behavior - Average number of male sex partners in lifetime (males 18+)
Sexual Behavior - Average number of male anal sex partners in lifetime (males 18+)
Sexual Behavior - Average age people first performed oral sex on a man (18+)
Sexual Behavior - Average number of male oral sex partners in lifetime (18+)
Sexual Behavior - People using protection when performing oral sex (%)
Sexual Behavior - Average number of times people have vaginal or anal sex a year
Sexual Behavior - People having sex without condom (%)
Sexual Behavior - Average number of male sex partners in lifetime (females 18+)
Sexual Behavior - Average number of male vaginal sex partners in lifetime (females 18+)
Sexual Behavior - Average number of female sex partners in lifetime (females 18+)
Sexual Behavior - Circumcised males 18+ (%)
Sleep Disorders - Average hours sleeping at night
Sleep Disorders - People that has trouble sleeping (%)
Smoking-Cigarette Use - People smoking cigarettes (%)
Taste & Smell - People 40+ having problems with smell (%)
Taste & Smell - People 40+ having problems with taste (%)
Taste & Smell - People 40+ that ever had wisdom teeth removed (%)
Taste & Smell - People 40+ that ever had tonsils teeth removed (%)
Taste & Smell - People 40+ that ever had a loss of consciousness because of a head injury (%)
Taste & Smell - People 40+ that ever had a broken nose or other serious injury to face or skull (%)
Taste & Smell - People 40+ that ever had two or more sinus infections (%)
Weight - Average height (inches)
Weight - Average weight (pounds)
Weight - Average BMI
Weight - People that are obese (%)
Weight - People that ever were obese (%)
Weight - People trying to lose weight (%)
According to our research of Indiana and other state lists, there were 3 registered sex offenders living in Aurora, Indiana as of April 24, 2024 . The ratio of all residents to sex offenders in Aurora is 1,240 to 1.The ratio of registered sex offenders to all residents in this city is lower than the state average.
Officers per 1,000 residents here:
2.72Indiana average:
2.27
Latest news from Aurora, IN collected exclusively by city-data.com from local newspapers, TV, and radio stations
Ancestries: German (25.3%), American (15.9%), Irish (11.5%), English (9.0%), Russian (6.8%), Italian (2.5%).
Current Local Time:
Land area: 2.78 square miles.
Population density: 1,261 people per square mile (low).
70 residents are foreign born (1.5% Latin America , 0.4% Africa ).
This city:
2.1%Indiana:
5.6%
Median real estate property taxes paid for housing units with mortgages in 2022: $1,270 (1.0%)Median real estate property taxes paid for housing units with no mortgage in 2022: $1,042 (0.8%)
Nearest city with pop. 50,000+: Cincinnati, OH
Nearest city with pop. 1,000,000+: Chicago, IL
Nearest cities:
Latitude: 39.06 N, Longitude: 84.91 W
Single-family new house construction building permits:
2004: 2 buildings , average cost: $145,5002003: 10 buildings , average cost: $145,5002002: 2 buildings , average cost: $120,0002001: 4 buildings , average cost: $53,8002000: 3 buildings , average cost: $53,4001999: 6 buildings , average cost: $54,3001998: 5 buildings , average cost: $51,6001997: 4 buildings , average cost: $67,500Unemployment in December 2023:
Population change in the 1990s: +36 (+0.9%).
Most common industries in Aurora, IN (%)
Both Males Females
Arts, entertainment, recreation (10.4%)
Accommodation & food services (9.8%)
Health care (9.7%)
Construction (8.7%)
Miscellaneous manufacturing (4.6%)
Other transportation, support activities, couriers (3.5%)
Professional, scientific, technical services (3.1%)
Construction (16.1%)
Miscellaneous manufacturing (7.7%)
Arts, entertainment, recreation (5.5%)
Health care (4.8%)
Other transportation, support activities, couriers (4.8%)
Truck transportation (4.7%)
Accommodation & food services (4.5%)
Arts, entertainment, recreation (16.1%)
Accommodation & food services (16.0%)
Health care (15.4%)
Professional, scientific, technical services (5.8%)
Educational services (5.6%)
Public administration (4.4%)
Finance & insurance (4.2%)
Most common occupations in Aurora, IN (%)
Both Males Females
Building and grounds cleaning and maintenance occupations (4.7%)
Material recording, scheduling, dispatching, and distributing workers (4.5%)
Other office and administrative support workers, including supervisors (4.3%)
Electrical equipment mechanics and other installation, maintenance, and repair workers, including supervisors (4.1%)
Information and record clerks, except customer service representatives (3.7%)
Driver/sales workers and truck drivers (3.5%)
Laborers and material movers, hand (3.2%)
Electrical equipment mechanics and other installation, maintenance, and repair workers, including supervisors (7.3%)
Driver/sales workers and truck drivers (5.8%)
Material recording, scheduling, dispatching, and distributing workers (5.4%)
Metal workers and plastic workers (5.1%)
Laborers and material movers, hand (4.9%)
Carpenters (4.8%)
Vehicle and mobile equipment mechanics, installers, and repairers (4.6%)
Other office and administrative support workers, including supervisors (8.5%)
Other food preparation and serving workers, including supervisors (6.0%)
Building and grounds cleaning and maintenance occupations (5.3%)
Waiters and waitresses (5.1%)
Information and record clerks, except customer service representatives (5.1%)
Supervisors and other personal care and service workers, except child care workers (4.6%)
Cashiers (4.2%)
Tornado activity:
Aurora-area historical tornado activity is near Indiana state average. It is 84% greater than the overall U.S. average.
On 4/3/1974, a category F5 (max. wind speeds 261-318 mph) tornado 6.3 miles away from the Aurora city center killed 3 people and injured 210 people .
On 4/3/1974, a category F4 (max. wind speeds 207-260 mph) tornado 0.7 miles away from the city center injured 104 people and caused between $5,000,000 and $50,000,000 in damages.
Earthquake activity:
Aurora-area historical earthquake activity is significantly above Indiana state average. It is 62% greater than the overall U.S. average. On 7/27/1980 at 18:52:21, a magnitude 5.2 (5.1 MB, 4.7 MS, 5.0 UK, 5.2 UK, Class: Moderate, Intensity: VI - VII) earthquake occurred 78.7 miles away from the city center On 4/18/2008 at 09:36:59, a magnitude 5.4 (5.1 MB, 4.8 MS, 5.4 MW, 5.2 MW) earthquake occurred 166.1 miles away from Aurora center On 4/18/2008 at 09:36:59, a magnitude 5.2 (5.2 MW, Depth: 8.9 mi) earthquake occurred 166.1 miles away from the city center On 6/10/1987 at 23:48:54, a magnitude 5.1 (4.9 MB, 4.4 MS, 4.6 MS, 5.1 LG) earthquake occurred 161.1 miles away from the city center On 9/7/1988 at 02:28:09, a magnitude 4.6 (4.5 MB, 4.6 LG, Class: Light, Intensity: IV - V) earthquake occurred 84.3 miles away from Aurora center On 6/18/2002 at 17:37:15, a magnitude 5.0 (4.3 MB, 4.6 MW, 5.0 LG) earthquake occurred 172.3 miles away from the city center Magnitude types: regional Lg-wave magnitude (LG), body-wave magnitude (MB), surface-wave magnitude (MS), moment magnitude (MW) Natural disasters: The number of natural disasters in Dearborn County (18) is near the US average (15).Major Disasters (Presidential) Declared: 14Emergencies Declared: 2Floods: 13, Storms: 10, Tornadoes: 6, Blizzard: 1, Hurricane: 1, Snow: 1, Wind: 1, Winter Storm: 1, Other: 1 (Note: some incidents may be assigned to more than one category). Hospitals and medical centers in Aurora: VOCA CORPORATION OF INDIANA (511 W. CONWELL STREET) VOCA CORPORATION OF INDIANA (207 HANOVER STREET) Other hospitals and medical centers near Aurora: VOCA CORPORATION OF INDIANA (Hospital, about 4 miles away; LAWRENCEBURG, IN)
DEARBORN COUNTY HOSPITAL (about 4 miles away; LAWRENCEBURG, IN)
PERSONAL TOUCH HOME CARE OF INDIANA INC (Home Health Center, about 4 miles away; LAWRENCEBURG, IN)
COMMUNITY MENTAL HEALTH CENTER INC (Hospital, about 4 miles away; LAWRENCEBURG, IN)
DEARBORN COUNTY HOSPITAL HOME HEALTH AND HOSPICE (Home Health Center, about 5 miles away; LAWRENCEBURG, IN)
WOODLAND HILLS CARE CENTER (Nursing Home, about 5 miles away; LAWRENCEBURG, IN)
DAVITA - LAWRENCEBURG DIALYSIS,LLC (Dialysis Facility, about 5 miles away; LAWRENCEBURG, IN)
Colleges/universities with over 2000 students nearest to Aurora:
College of Mount St Joseph (about 15 miles; Cincinnati, OH ; Full-time enrollment: 2,073)
Gateway Community and Technical College (about 17 miles; Florence, KY ; FT enrollment: 2,422)
Cincinnati State Technical and Community College (about 21 miles; Cincinnati, OH ; FT enrollment: 8,757)
University of Cincinnati-Main Campus (about 22 miles; Cincinnati, OH ; FT enrollment: 28,747)
Northern Kentucky University (about 24 miles; Highland Heights, KY ; FT enrollment: 12,059)
Xavier University (about 24 miles; Cincinnati, OH ; FT enrollment: 6,143)
Miami University-Hamilton (about 29 miles; Hamilton, OH ; FT enrollment: 2,906)
Public high school in Aurora:
Public elementary/middle schools in Aurora:
Private elementary/middle schools in Aurora: ST MARY ELEMENTARY SCHOOL Students: 126, Location: 211 4TH ST, Grades: KG-8)ST JOHN EVANGELICAL LUTHERAN SCHOOL Students: 73, Location: 222 MECHANIC ST, Grades: PK-8)
See full list of schools located in Aurora Library in Aurora: AURORA PUBLIC LIBRARY DISTRICT Operating income: $735,612; Location: 414 2ND STREET; 54,417 books ; 2,383 audio materials ; 3,848 video materials ; 5 local licensed databases ; 37 state licensed databases ; 184 print serial subscriptions )
Creeks: (A) , Hogan Creek (B) . Display/hide their locations on the map
Tourist attractions:
Hotels:
Court:
Birthplace of: Elmer Davis - Politician, Bill Brandt (baseball) - Baseball player, Kirtley Baker - Baseball player, Red Downey - Baseball player.
Dearborn County has a predicted average indoor radon screening level between 2 and 4 pCi/L (pico curies per liter) - Moderate Potential Drinking water stations with addresses in Aurora and their reported violations in the past:
L-M-S CONSERVANCY DISTRICT (Population served: 5,130, Groundwater):
Past monitoring violations:
One minor monitoring violation
Population served: 4,995, Groundwater):
Past health violations:
MCL, Monthly (TCR) - In AUG-2007, Contaminant: Coliform. Follow-up actions: St Public Notif requested (AUG-20-2007), St Violation/Reminder Notice (AUG-20-2007), St Boil Water Order (AUG-20-2007), St Compliance achieved (MAY-17-2010)
Population served: 770, Purch groundwater):
Past monitoring violations:
Follow-up Or Routine LCR Tap M/R - In OCT-01-2012, Contaminant: Lead and Copper Rule. Follow-up actions: St Public Notif requested (DEC-18-2012), St Violation/Reminder Notice (DEC-18-2012), St Public Notif received (JUL-01-2013), St Compliance achieved (NOV-21-2013)
Failure Submit IDSE/Subpart V Plan Rpt - In JUL-02-2010, Contaminant: DBP STAGE 2. Follow-up actions: Fed FAO issued (SEP-30-2010), Fed Compliance achieved (APR-17-2012)
Follow-up Or Routine LCR Tap M/R - In OCT-01-2009, Contaminant: Lead and Copper Rule. Follow-up actions: St Public Notif requested (NOV-09-2009), St Violation/Reminder Notice (NOV-09-2009), St Compliance achieved (DEC-16-2009)
Monitoring, Routine (IDSE) - Between APR-2009 and MAR-2010, Contaminant: TTHM. Follow-up actions: Fed FAO issued (SEP-30-2010), Fed Compliance achieved (APR-17-2012)
Monitoring, Routine (IDSE) - Between APR-2009 and MAR-2010, Contaminant: Total Haloacetic Acids (HAA5). Follow-up actions: Fed FAO issued (SEP-30-2010), Fed Compliance achieved (APR-17-2012)
3 routine major monitoring violations
Drinking water stations with addresses in Aurora that have no violations reported:
AURORA UTILITIES (Population served: 6,750, Primary Water Source Type: Groundwater)
Average household size: This city:
2.5 peopleIndiana:
2.5 people
Percentage of family households: This city:
63.6%Whole state:
66.9%
Percentage of households with unmarried partners: This city:
10.3%Whole state:
6.9%
Likely homosexual households (counted as self-reported same-sex unmarried-partner households)
Lesbian couples: 0.1% of all households Gay men: 0.1% of all households
8 people in other noninstitutional group quarters in 2000people in homes for the mentally retarded in 2000
Banks with branches in Aurora (2011 data):
First Financial Bank, National Association: Aurora Branch at 320 Importing Street, branch established on 1983/01/03. Info updated 2009/09/21: Bank assets: $6,663.4 mil, Deposits: $5,754.9 mil, headquarters in Hamilton, OH, positive income , Commercial Lending Specialization, 101 total offices , Holding Company: First Financial Bancorp
U.S. Bank National Association: Aurora Branch at 340 Second Street, branch established on 1864/12/09. Info updated 2012/01/30: Bank assets: $330,470.8 mil, Deposits: $236,091.5 mil, headquarters in Cincinnati, OH, positive income , 3121 total offices , Holding Company: U.S. Bancorp
Woodforest National Bank: Aurora Wal-Mart Branch at 100 Sycamore Estates Drive, branch established on 2007/04/28. Info updated 2011/05/10: Bank assets: $3,488.9 mil, Deposits: $3,097.6 mil, headquarters in Houston, TX, positive income , Commercial Lending Specialization, 766 total offices , Holding Company: Woodforest Financial Group Employee Stock Ownership Plan (With 401(K) Provisions)
The Merchants Bank and Trust Company: Aurora Branch at 950 Green Boulevard, branch established on 1988/10/03. Info updated 2006/11/03: Bank assets: $210.3 mil, Deposits: $181.4 mil, headquarters in West Harrison, IN, positive income , Commercial Lending Specialization, 6 total offices , Holding Company: Mbt Bancorp
United Community Bank: Aurora Branch at 500 Green Blvd, branch established on 2005/07/01. Info updated 2011/07/21: Bank assets: $468.7 mil, Deposits: $412.1 mil, headquarters in Lawrenceburg, IN, positive income , Mortgage Lending Specialization, 9 total offices
For population 15 years and over in Aurora:
Never married: 34.2%Now married: 38.8%Separated: 1.5%Widowed: 7.2%Divorced: 18.4% For population 25 years and over in Aurora:
High school or higher: 88.0%Bachelor's degree or higher: 14.1%Graduate or professional degree: 2.6%Unemployed: 6.4%Mean travel time to work (commute): 25.3 minutes
Education Gini index (Inequality in education) Here:
7.8Indiana average:
11.3
Religion statistics for Aurora, IN (based on Dearborn County data)
Religion Adherents Congregations Catholic 9,317 7 Mainline Protestant 5,305 33 Evangelical Protestant 5,222 28 Other 336 3 None 29,867 -
Source: Clifford Grammich, Kirk Hadaway, Richard Houseal, Dale E.Jones, Alexei Krindatch, Richie Stanley and Richard H.Taylor. 2012. 2010 U.S.Religion Census: Religious Congregations & Membership Study. Association of Statisticians of American Religious Bodies. Jones, Dale E., et al. 2002. Congregations and Membership in the United States 2000. Nashville, TN: Glenmary Research Center. Graphs represent county-level data
Food Environment Statistics: Number of grocery stores : 7Dearborn County :
1.41 / 10,000 pop.Indiana :
1.73 / 10,000 pop.
Number of supercenters and club stores : 1This county :
0.20 / 10,000 pop.State :
0.21 / 10,000 pop.
Number of convenience stores (no gas) : 2Dearborn County :
0.40 / 10,000 pop.Indiana :
0.50 / 10,000 pop.
Number of convenience stores (with gas) : 19Dearborn County :
3.83 / 10,000 pop.State :
3.57 / 10,000 pop.
Number of full-service restaurants : 33Here :
6.66 / 10,000 pop.State :
6.78 / 10,000 pop.
Adult diabetes rate : This county :
8.8%Indiana :
9.2%
Adult obesity rate : Dearborn County :
27.8%Indiana :
29.0%
Low-income preschool obesity rate : This county :
11.8%State :
14.3%
Health and Nutrition: Healthy diet rate : This city:
48.4%State:
49.3%
Average overall health of teeth and gums : Average BMI : This city:
28.8Indiana:
28.7
People feeling badly about themselves : This city:
19.1%State:
21.3%
People not drinking alcohol at all : Average hours sleeping at night : Overweight people : Aurora:
27.5%Indiana:
33.9%
General health condition : Aurora:
58.1%Indiana:
56.1%
Average condition of hearing : Aurora:
76.1%Indiana:
78.7%
More about Health and Nutrition of Aurora, IN Residents
Local government employment and payroll (March 2022)
Function
Full-time employees
Monthly full-time payroll
Average yearly full-time wage
Part-time employees
Monthly part-time payroll
Water Supply
12 $45,550 $45,550 3 $4,391 Police Protection - Officers
9 $40,769 $54,359 0 $0 Streets and Highways
5 $14,918 $35,803 1 $1,311 Parks and Recreation
2 $5,035 $30,210 8 $4,243 Financial Administration
1 $4,052 $48,624 4 $6,439 Other Government Administration
1 $4,798 $57,576 6 $5,727 Police - Other
1 $3,014 $36,168 0 $0 Firefighters
0 $0 22 $3,860
Totals for Government
31 $118,137 $45,730 44 $25,970
Aurora government finances - Expenditure in 2021 (per resident):
Construction - General - Other: $674,000 ($192.46)
Sewerage: $6,000 ($1.71)Current Operations - General - Other: $2,538,000 ($724.73)
Regular Highways: $1,545,000 ($441.18)Gas Utilities: $1,527,000 ($436.04)Police Protection: $943,000 ($269.27)Sewerage: $910,000 ($259.85)Water Utilities: $604,000 ($172.47)Financial Administration: $260,000 ($74.24)Parks and Recreation: $242,000 ($69.10)Local Fire Protection: $174,000 ($49.69)Health - Other: $83,000 ($23.70)Central Staff Services: $82,000 ($23.42)Judicial and Legal Services: $33,000 ($9.42)General - Interest on Debt: $200,000 ($57.11)
Other Capital Outlay - Local Fire Protection: $109,000 ($31.13)
General - Other: $99,000 ($28.27)Parks and Recreation: $15,000 ($4.28)
Aurora government finances - Revenue in 2021 (per resident):
Charges - Sewerage: $1,810,000 ($516.85)
Solid Waste Management: $429,000 ($122.50)Parks and Recreation: $10,000 ($2.86)Other: $8,000 ($2.28)Federal Intergovernmental - Other: $20,000 ($5.71)
Local Intergovernmental - Highways: $64,000 ($18.28)
Other: $23,000 ($6.57)Miscellaneous - Interest Earnings: $52,000 ($14.85)
Donations From Private Sources: $24,000 ($6.85)Rents: $20,000 ($5.71)Fines and Forfeits: $1,000 ($0.29)Revenue - Gas Utilities: $5,569,000 ($1590.23)
Water Utilities: $1,482,000 ($423.19)State Intergovernmental - Other: $2,043,000 ($583.38)
Highways: $732,000 ($209.02)General Local Government Support: $155,000 ($44.26)Tax - Property: $1,199,000 ($342.38)
Public Utilities Sales: $6,000 ($1.71)Other License: $3,000 ($0.86)
Aurora government finances - Debt in 2021 (per resident):
Long Term Debt - Beginning Outstanding - Unspecified Public Purpose: $4,995,000 ($1426.33)
Outstanding Unspecified Public Purpose: $4,995,000 ($1426.33)
Aurora government finances - Cash and Securities in 2021 (per resident):
Bond Funds - Cash and Securities: $150,000 ($42.83)
Other Funds - Cash and Securities: $8,261,000 ($2358.94)
Sinking Funds - Cash and Securities: $122,000 ($34.84)
Businesses in Aurora, IN
Name Count Name Count
ALDI 1 Payless 1 Burger King 1 RadioShack 1 CVS 1 Subway 1 Cricket Wireless 1 T-Mobile 1 Dairy Queen 1 Taco Bell 1 GameStop 1 U-Haul 1 Lane Furniture 1 Walgreens 1 Long John Silver's 1 Walmart 1 MasterBrand Cabinets 2 White Castle 1 McDonald's 1 YMCA 1 Nike 1
Strongest AM radio stations in Aurora:
WSAI (1530 AM; 50 kW; CINCINNATI, OH; Owner: JACOR BROADCASTING CORPORATION)
WLW (700 AM; 50 kW; CINCINNATI, OH; Owner: JACOR BROADCASTING CORPORATION)
WBOB (1160 AM; 5 kW; FLORENCE, KY; Owner: CARON BROADCASTING, INC.)
WHAS (840 AM; 50 kW; LOUISVILLE, KY; Owner: CLEAR CHANNEL BROADCASTING LICENSES, INC.)
WKRC (550 AM; 5 kW; CINCINNATI, OH; Owner: JACOR BROADCASTING CORPORATION)
WCKY (1360 AM; 5 kW; CINCINNATI, OH; Owner: JACOR BROADCASTING CORPORATION)
WTVN (610 AM; 50 kW; COLUMBUS, OH; Owner: CITICASTERS LICENSES, L.P.)
WCIN (1480 AM; 5 kW; CINCINNATI, OH)
WIBC (1070 AM; 50 kW; INDIANAPOLIS, IN; Owner: EMMIS RADIO LICENSE CORPORATION)
WNOP (740 AM; 1 kW; NEWPORT, KY; Owner: SACRED HEART RADIO, INC.)
WCNW (1560 AM; daytime; 5 kW; FAIRFIELD, OH)
WOWO (1190 AM; 50 kW; FORT WAYNE, IN; Owner: PATHFINDER COMMUNICATIONS CORPORATION)
WTSJ (1050 AM; 1 kW; CINCINNATI, OH; Owner: CARON BROADCASTING, INC.)
Strongest FM radio stations in Aurora:
WSCH (99.3 FM; AURORA, IN; Owner: COLUMBUS RADIO, INC.)
WEBN (102.7 FM; CINCINNATI, OH; Owner: JACOR BROADCASTING CORPORATION)
WVMX (94.1 FM; CINCINNATI, OH; Owner: CITICASTERS LICENSES, L.P.)
WOFX-FM (92.5 FM; CINCINNATI, OH; Owner: JACOR BROADCASTING CORPORATION)
WGRR (103.5 FM; HAMILTON, OH; Owner: INFINITY RADIO OPERATIONS INC.)
WGUC (90.9 FM; CINCINNATI, OH; Owner: CINCINNATI CLASSICAL PUBLIC RADIO, INC.)
WUBE-FM (105.1 FM; CINCINNATI, OH; Owner: INFINITY RADIO OPERATIONS INC.)
WKRQ (101.9 FM; CINCINNATI, OH; Owner: INFINITY RADIO OPERATIONS INC.)
WKFS (107.1 FM; MILFORD, OH; Owner: JACOR BROADCASTING CORPORATION)
WJYC (90.1 FM; DELHI HILLS, OH; Owner: LIFETALK RADIO, INC.)
WMOJ (94.9 FM; FAIRFIELD, OH; Owner: WVAE LICO, INC.)
WRRM (98.5 FM; CINCINNATI, OH; Owner: WRRM LICO, INC)
WNLT (104.3 FM; HARRISON, OH; Owner: VERNON R. BALDWIN, INC.)
WVXU (91.7 FM; CINCINNATI, OH; Owner: XAVIER UNIVERSITY)
WIZF (100.9 FM; ERLANGER, KY; Owner: BLUE CHIP BROADCASTING LICENSES II, LTD.)
WAKW (93.3 FM; CINCINNATI, OH; Owner: PILLAR OF FIRE)
WKID (95.9 FM; VEVAY, IN; Owner: DIAL BROADCASTING INC)
WYGY (96.5 FM; LEBANON, OH; Owner: WVAE LICO, INC.)
WJLR (91.5 FM; SEYMOUR, IN; Owner: MIDWEST MINISTRIES, INC.)
WAIF (88.3 FM; CINCINNATI, OH; Owner: STEPCHILD RADIO OF CINCINNATI, INC.)
TV broadcast stations around Aurora:
WLWT (Channel 5; CINCINNATI, OH; Owner: OHIO/OKLAHOMA HEARST-ARGYLE TV, INC)
WXIX-TV (Channel 19; NEWPORT, KY; Owner: RAYCOM NATIONAL, INC.)
WCPO-TV (Channel 9; CINCINNATI, OH; Owner: SCRIPPS HOWARD BROADCASTING COMPANY)
WSTR-TV (Channel 64; CINCINNATI, OH; Owner: WSTR LICENSEE, INC.)
WCET (Channel 48; CINCINNATI, OH; Owner: THE GREATER CINCINNATI TV EDUC'L. FOUNDATION)
WKRC-TV (Channel 12; CINCINNATI, OH; Owner: CITICASTERS CO.)
WAVE (Channel 3; LOUISVILLE, KY; Owner: LIBCO, INC.)
WBQC-CA (Channel 25; CINCINNATI, OH; Owner: ELLIOTT B. BLOCK)
WOTH-LP (Channel 35; CINCINNATI, OH; Owner: ELLIOTT B. BLOCK)
WPTO (Channel 14; OXFORD, OH; Owner: GREATER DAYTON PUBLIC TELEVISION, INC.)
WKOI (Channel 43; RICHMOND, IN; Owner: TRINITY BROADCASTING OF INDIANA, INC.)
WCVN-TV (Channel 54; COVINGTON, KY; Owner: KENTUCKY AUTHORITY FOR EDUCATIONAL TV)
National Bridge Inventory (NBI) Statistics 31 Number of bridges348ft / 106m Total length $953,000 Total costs136,185 Total average daily traffic9,135 Total average daily truck traffic
New bridges - historical statistics
1 Before 1900 1 1900-1909 1 1910-1919 1 1920-1929 3 1930-1939 2 1950-1959 4 1960-1969 1 1970-1979 4 1980-1989 7 1990-1999 1 2000-2009 4 2010-2019 1 2020-2022
See full National Bridge Inventory statistics for Aurora, IN
FCC Registered Cell Phone Towers: 1 (
See the full list of FCC Registered Cell Phone Towers in Aurora )
FCC Registered Antenna Towers: 45 (
See the full list of FCC Registered Antenna Towers )
FCC Registered Commercial Land Mobile Towers: 1 (
See the full list of FCC Registered Commercial Land Mobile Towers in Aurora, IN )
FCC Registered Private Land Mobile Towers: 1 (
See the full list of FCC Registered Private Land Mobile Towers )
FCC Registered Broadcast Land Mobile Towers: 8 (
See the full list of FCC Registered Broadcast Land Mobile Towers )
FCC Registered Microwave Towers: 12 (
See the full list of FCC Registered Microwave Towers in this town )
FCC Registered Paging Towers: 2 (
See the full list of FCC Registered Paging Towers )
FCC Registered Maritime Coast & Aviation Ground Towers: 2 (
See the full list of FCC Registered Maritime Coast & Aviation Ground Towers )
FCC Registered Amateur Radio Licenses: 46 (
See the full list of FCC Registered Amateur Radio Licenses in Aurora )
FAA Registered Aircraft: 4
Aircraft: POWRACHUTE CORP PC 2000 (Category: Land, Seats: 2, Weight: Up to 12,499 Pounds), Engine: ROTAX 582ULDCDI-99 (65 HP) (2 Cycle)N-Number: 2678N, N2678N, N-2678N, Serial Number: A 255 POW, Year manufactured: 2001, Airworthiness Date: 11/14/2007, Certificate Issue Date: 11/14/2017Registrant (Individual): Tracy N Thomas, 10522 Harmony Hills Dr, Aurora, IN 47001Aircraft: CESSNA 172F (Category: Land, Seats: 4, Weight: Up to 12,499 Pounds, Speed: 105 mph), Engine: CONT MOTOR 0-300 SER (145 HP) (Reciprocating)N-Number: 5406R, N5406R, N-5406R, Serial Number: 17252945, Year manufactured: 1965, Airworthiness Date: 05/18/1965, Certificate Issue Date: 08/21/2018Registrant (LLC): Mmm Enterprises LLC, 8230 Schraeder Ln, Aurora, IN 47001Aircraft: LAMB STARDUSTER II (Category: Land, Seats: 2, Weight: Up to 12,499 Pounds, Speed: 105 mph), Engine: LYCOMING O&VO-360 SER (180 HP) (Reciprocating)N-Number: 548CL, N548CL, N-548CL, Serial Number: 548, Year manufactured: 1977, Airworthiness Date: 03/31/1980, Certificate Issue Date: 11/01/2016Registrant (Individual): Thomas G Spielmann, 7663 Geist Ridge Ln, Aurora, IN 47001Aircraft: INFINITY POWERED PARACHUTES LL INFINITY 2005 (Category: Land, Seats: 2, Weight: Up to 12,499 Pounds), Engine: HIRTH 3701 (100 HP) (2 Cycle)N-Number: 7006X, N7006X, N-7006X, Serial Number: IPP5319, Year manufactured: 2005, Airworthiness Date: 05/08/2007, Certificate Issue Date: 02/09/2007Registrant (Individual): James W Rector, 6612 Soap Hill Rd, Aurora, IN 47001
Home Mortgage Disclosure Act Aggregated Statistics For Year 2009(Based on 1 partial tract) A) FHA, FSA/RHS & VA B) Conventional C) Refinancings D) Home Improvement Loans F) Non-occupant Loans on G) Loans On Manufactured Number Average Value Number Average Value Number Average Value Number Average Value Number Average Value Number Average Value
LOANS ORIGINATED 9 $108,882 5 $102,752 28 $121,556 4 $12,262 2 $123,100 0 $0 APPLICATIONS APPROVED, NOT ACCEPTED 1 $119,940 2 $52,445 2 $114,845 0 $0 2 $51,230 1 $50,020 APPLICATIONS DENIED 1 $151,990 2 $85,465 21 $124,892 0 $0 0 $0 0 $0 APPLICATIONS WITHDRAWN 1 $83,040 0 $0 7 $151,299 0 $0 0 $0 0 $0 FILES CLOSED FOR INCOMPLETENESS 0 $0 0 $0 1 $174,820 0 $0 0 $0 0 $0
Aggregated Statistics For Year 2008(Based on 1 partial tract) A) FHA, FSA/RHS & VA B) Conventional C) Refinancings D) Home Improvement Loans F) Non-occupant Loans on G) Loans On Manufactured Number Average Value Number Average Value Number Average Value Number Average Value Number Average Value Number Average Value
LOANS ORIGINATED 7 $107,040 10 $83,960 23 $123,701 3 $36,097 4 $156,728 1 $56,330 APPLICATIONS APPROVED, NOT ACCEPTED 0 $0 0 $0 1 $49,530 1 $10,200 0 $0 0 $0 APPLICATIONS DENIED 3 $89,997 5 $59,924 20 $110,207 8 $25,372 4 $60,458 1 $44,190 APPLICATIONS WITHDRAWN 0 $0 2 $92,505 9 $97,876 0 $0 0 $0 0 $0 FILES CLOSED FOR INCOMPLETENESS 0 $0 1 $53,420 1 $82,550 0 $0 0 $0 0 $0
Aggregated Statistics For Year 2007(Based on 1 partial tract) A) FHA, FSA/RHS & VA B) Conventional C) Refinancings D) Home Improvement Loans F) Non-occupant Loans on G) Loans On Manufactured Number Average Value Number Average Value Number Average Value Number Average Value Number Average Value Number Average Value
LOANS ORIGINATED 3 $122,210 26 $91,778 29 $124,046 7 $22,754 10 $108,095 1 $105,860 APPLICATIONS APPROVED, NOT ACCEPTED 0 $0 3 $51,150 4 $108,290 1 $14,570 1 $80,120 0 $0 APPLICATIONS DENIED 1 $165,100 13 $84,195 22 $104,890 7 $41,761 4 $59,365 0 $0 APPLICATIONS WITHDRAWN 1 $122,860 2 $71,625 6 $105,780 1 $108,290 1 $114,120 0 $0 FILES CLOSED FOR INCOMPLETENESS 0 $0 1 $127,710 4 $93,962 0 $0 1 $83,520 0 $0
Aggregated Statistics For Year 2006(Based on 1 partial tract) A) FHA, FSA/RHS & VA B) Conventional C) Refinancings D) Home Improvement Loans F) Non-occupant Loans on G) Loans On Manufactured Number Average Value Number Average Value Number Average Value Number Average Value Number Average Value Number Average Value
LOANS ORIGINATED 3 $138,073 33 $90,233 34 $92,992 11 $42,468 14 $93,131 0 $0 APPLICATIONS APPROVED, NOT ACCEPTED 0 $0 2 $98,090 7 $112,451 1 $61,190 0 $0 0 $0 APPLICATIONS DENIED 1 $138,880 6 $66,770 22 $110,209 8 $25,251 2 $22,095 2 $42,735 APPLICATIONS WITHDRAWN 0 $0 5 $64,294 14 $121,400 3 $58,597 3 $120,430 0 $0 FILES CLOSED FOR INCOMPLETENESS 0 $0 1 $72,840 2 $132,085 0 $0 0 $0 0 $0
Aggregated Statistics For Year 2005(Based on 1 partial tract) A) FHA, FSA/RHS & VA B) Conventional C) Refinancings D) Home Improvement Loans F) Non-occupant Loans on G) Loans On Manufactured Number Average Value Number Average Value Number Average Value Number Average Value Number Average Value Number Average Value
LOANS ORIGINATED 5 $126,742 40 $97,970 48 $94,874 8 $26,951 15 $93,138 1 $75,270 APPLICATIONS APPROVED, NOT ACCEPTED 1 $150,050 7 $79,777 6 $122,533 0 $0 1 $94,210 0 $0 APPLICATIONS DENIED 1 $63,130 14 $82,795 32 $93,569 7 $31,633 1 $131,110 1 $67,980 APPLICATIONS WITHDRAWN 0 $0 7 $93,999 22 $115,154 2 $79,155 6 $82,067 1 $255,430 FILES CLOSED FOR INCOMPLETENESS 0 $0 0 $0 6 $116,948 0 $0 0 $0 0 $0
Aggregated Statistics For Year 2004(Based on 1 partial tract) A) FHA, FSA/RHS & VA B) Conventional C) Refinancings D) Home Improvement Loans F) Non-occupant Loans on G) Loans On Manufactured Number Average Value Number Average Value Number Average Value Number Average Value Number Average Value Number Average Value
LOANS ORIGINATED 4 $100,882 31 $88,693 48 $89,087 7 $28,303 16 $87,833 0 $0 APPLICATIONS APPROVED, NOT ACCEPTED 0 $0 5 $85,174 6 $111,365 0 $0 2 $44,190 0 $0 APPLICATIONS DENIED 1 $99,550 8 $67,924 28 $91,085 3 $49,207 2 $101,735 1 $100,030 APPLICATIONS WITHDRAWN 0 $0 8 $77,454 16 $88,622 0 $0 0 $0 0 $0 FILES CLOSED FOR INCOMPLETENESS 1 $78,670 1 $39,330 6 $92,588 0 $0 0 $0 0 $0
Aggregated Statistics For Year 2003(Based on 1 partial tract) A) FHA, FSA/RHS & VA B) Conventional C) Refinancings D) Home Improvement Loans F) Non-occupant Loans on Number Average Value Number Average Value Number Average Value Number Average Value Number Average Value
LOANS ORIGINATED 6 $125,285 28 $98,473 79 $84,445 18 $56,681 11 $89,439 APPLICATIONS APPROVED, NOT ACCEPTED 1 $104,890 1 $124,800 10 $84,154 0 $0 0 $0 APPLICATIONS DENIED 1 $89,840 8 $88,379 43 $86,516 7 $42,177 2 $61,670 APPLICATIONS WITHDRAWN 0 $0 7 $100,450 24 $88,925 0 $0 2 $98,090 FILES CLOSED FOR INCOMPLETENESS 0 $0 1 $187,440 4 $71,748 0 $0 0 $0
Aggregated Statistics For Year 2002(Based on 1 partial tract) A) FHA, FSA/RHS & VA B) Conventional C) Refinancings D) Home Improvement Loans F) Non-occupant Loans on Number Average Value Number Average Value Number Average Value Number Average Value Number Average Value
LOANS ORIGINATED 6 $84,495 28 $90,616 71 $81,595 8 $16,267 12 $56,694 APPLICATIONS APPROVED, NOT ACCEPTED 0 $0 2 $57,060 8 $73,448 1 $72,350 2 $58,030 APPLICATIONS DENIED 1 $115,570 10 $51,716 34 $80,710 6 $19,828 3 $40,303 APPLICATIONS WITHDRAWN 0 $0 0 $0 20 $107,730 0 $0 1 $209,290 FILES CLOSED FOR INCOMPLETENESS 0 $0 0 $0 5 $110,522 0 $0 0 $0
Aggregated Statistics For Year 2001(Based on 1 partial tract) A) FHA, FSA/RHS & VA B) Conventional C) Refinancings D) Home Improvement Loans F) Non-occupant Loans on Number Average Value Number Average Value Number Average Value Number Average Value Number Average Value
LOANS ORIGINATED 12 $87,003 39 $77,509 78 $78,549 14 $7,319 9 $68,578 APPLICATIONS APPROVED, NOT ACCEPTED 0 $0 2 $69,440 4 $98,090 1 $9,230 1 $56,820 APPLICATIONS DENIED 3 $95,177 10 $68,033 30 $80,367 7 $8,671 2 $110,715 APPLICATIONS WITHDRAWN 0 $0 3 $101,813 21 $73,349 1 $11,650 0 $0 FILES CLOSED FOR INCOMPLETENESS 0 $0 1 $31,080 4 $87,892 0 $0 0 $0
Aggregated Statistics For Year 2000(Based on 1 partial tract) A) FHA, FSA/RHS & VA B) Conventional C) Refinancings D) Home Improvement Loans F) Non-occupant Loans on Number Average Value Number Average Value Number Average Value Number Average Value Number Average Value
LOANS ORIGINATED 7 $81,164 33 $74,812 27 $81,869 8 $16,085 7 $52,930 APPLICATIONS APPROVED, NOT ACCEPTED 1 $119,460 4 $93,235 9 $60,592 6 $25,493 1 $118,970 APPLICATIONS DENIED 1 $100,520 7 $68,400 26 $60,401 8 $15,539 1 $54,390 APPLICATIONS WITHDRAWN 1 $109,750 6 $97,930 10 $78,667 0 $0 1 $70,900 FILES CLOSED FOR INCOMPLETENESS 0 $0 1 $67,980 2 $104,405 0 $0 0 $0
Aggregated Statistics For Year 1999(Based on 1 partial tract) A) FHA, FSA/RHS & VA B) Conventional C) Refinancings D) Home Improvement Loans E) Loans on Dwellings For 5+ Families F) Non-occupant Loans on Number Average Value Number Average Value Number Average Value Number Average Value Number Average Value Number Average Value
LOANS ORIGINATED 4 $77,192 41 $79,471 55 $59,034 12 $16,241 1 $118,170 10 $53,416 APPLICATIONS APPROVED, NOT ACCEPTED 0 $0 2 $58,850 14 $69,535 3 $17,313 0 $0 1 $39,070 APPLICATIONS DENIED 0 $0 11 $68,356 30 $61,453 10 $11,388 0 $0 3 $30,020 APPLICATIONS WITHDRAWN 0 $0 6 $75,763 20 $50,366 2 $43,840 0 $0 1 $27,640 FILES CLOSED FOR INCOMPLETENESS 0 $0 2 $177,975 5 $59,468 0 $0 0 $0 1 $75,290
Detailed HMDA statistics for the following Tracts:
0805.00
Private Mortgage Insurance Companies Aggregated Statistics For Year 2009(Based on 1 partial tract) A) Conventional B) Refinancings Number Average Value Number Average Value
LOANS ORIGINATED 0 $0 0 $0 APPLICATIONS APPROVED, NOT ACCEPTED 1 $100,520 1 $274,360 APPLICATIONS DENIED 0 $0 1 $141,800 APPLICATIONS WITHDRAWN 0 $0 0 $0 FILES CLOSED FOR INCOMPLETENESS 0 $0 0 $0
Aggregated Statistics For Year 2008(Based on 1 partial tract) A) Conventional Number Average Value
LOANS ORIGINATED 2 $107,805 APPLICATIONS APPROVED, NOT ACCEPTED 1 $74,300 APPLICATIONS DENIED 0 $0 APPLICATIONS WITHDRAWN 0 $0 FILES CLOSED FOR INCOMPLETENESS 0 $0
Aggregated Statistics For Year 2007(Based on 1 partial tract) A) Conventional B) Refinancings Number Average Value Number Average Value
LOANS ORIGINATED 9 $104,027 1 $130,140 APPLICATIONS APPROVED, NOT ACCEPTED 1 $157,820 1 $135,970 APPLICATIONS DENIED 0 $0 0 $0 APPLICATIONS WITHDRAWN 0 $0 1 $138,880 FILES CLOSED FOR INCOMPLETENESS 0 $0 0 $0
Aggregated Statistics For Year 2006(Based on 1 partial tract) A) Conventional B) Refinancings Number Average Value Number Average Value
LOANS ORIGINATED 6 $83,118 2 $111,930 APPLICATIONS APPROVED, NOT ACCEPTED 0 $0 0 $0 APPLICATIONS DENIED 0 $0 0 $0 APPLICATIONS WITHDRAWN 0 $0 0 $0 FILES CLOSED FOR INCOMPLETENESS 0 $0 0 $0
Aggregated Statistics For Year 2005(Based on 1 partial tract) A) Conventional B) Refinancings C) Non-occupant Loans on Number Average Value Number Average Value Number Average Value
LOANS ORIGINATED 3 $111,203 3 $95,827 2 $64,100 APPLICATIONS APPROVED, NOT ACCEPTED 2 $115,085 0 $0 0 $0 APPLICATIONS DENIED 0 $0 0 $0 0 $0 APPLICATIONS WITHDRAWN 0 $0 1 $113,630 0 $0 FILES CLOSED FOR INCOMPLETENESS 0 $0 0 $0 0 $0
Aggregated Statistics For Year 2004(Based on 1 partial tract) A) Conventional B) Refinancings C) Non-occupant Loans on Number Average Value Number Average Value Number Average Value
LOANS ORIGINATED 3 $64,100 2 $140,825 1 $29,620 APPLICATIONS APPROVED, NOT ACCEPTED 1 $205,410 0 $0 0 $0 APPLICATIONS DENIED 0 $0 0 $0 0 $0 APPLICATIONS WITHDRAWN 1 $134,030 1 $67,010 0 $0 FILES CLOSED FOR INCOMPLETENESS 0 $0 0 $0 0 $0
Aggregated Statistics For Year 2003(Based on 1 partial tract) A) Conventional B) Refinancings Number Average Value Number Average Value
LOANS ORIGINATED 5 $78,376 5 $100,810 APPLICATIONS APPROVED, NOT ACCEPTED 2 $69,925 4 $111,080 APPLICATIONS DENIED 1 $107,320 0 $0 APPLICATIONS WITHDRAWN 0 $0 0 $0 FILES CLOSED FOR INCOMPLETENESS 0 $0 0 $0
Aggregated Statistics For Year 2002(Based on 1 partial tract) A) Conventional B) Refinancings Number Average Value Number Average Value
LOANS ORIGINATED 3 $91,940 7 $103,224 APPLICATIONS APPROVED, NOT ACCEPTED 0 $0 2 $150,535 APPLICATIONS DENIED 0 $0 0 $0 APPLICATIONS WITHDRAWN 0 $0 1 $129,660 FILES CLOSED FOR INCOMPLETENESS 0 $0 0 $0
Aggregated Statistics For Year 2001(Based on 1 partial tract) A) Conventional B) Refinancings C) Non-occupant Loans on Number Average Value Number Average Value Number Average Value
LOANS ORIGINATED 7 $97,190 4 $82,188 2 $80,125 APPLICATIONS APPROVED, NOT ACCEPTED 2 $91,295 0 $0 0 $0 APPLICATIONS DENIED 0 $0 0 $0 0 $0 APPLICATIONS WITHDRAWN 0 $0 0 $0 0 $0 FILES CLOSED FOR INCOMPLETENESS 0 $0 0 $0 0 $0
Aggregated Statistics For Year 2000(Based on 1 partial tract) A) Conventional B) Refinancings Number Average Value Number Average Value
LOANS ORIGINATED 4 $104,648 1 $107,800 APPLICATIONS APPROVED, NOT ACCEPTED 0 $0 0 $0 APPLICATIONS DENIED 0 $0 0 $0 APPLICATIONS WITHDRAWN 0 $0 0 $0 FILES CLOSED FOR INCOMPLETENESS 0 $0 0 $0
Aggregated Statistics For Year 1999(Based on 1 partial tract) A) Conventional B) Refinancings Number Average Value Number Average Value
LOANS ORIGINATED 7 $73,586 2 $84,100 APPLICATIONS APPROVED, NOT ACCEPTED 0 $0 0 $0 APPLICATIONS DENIED 1 $51,940 0 $0 APPLICATIONS WITHDRAWN 0 $0 0 $0 FILES CLOSED FOR INCOMPLETENESS 0 $0 0 $0
Detailed PMIC statistics for the following Tracts:
0805.00
Most common first names in Aurora, IN among deceased individuals Name Count Lived (average)
William 83 72.1 years James 64 72.3 years Mary 61 78.3 years Robert 57 71.3 years John 56 74.7 years Charles 52 74.7 years George 41 76.5 years Harry 37 77.4 years Edward 36 75.6 years Margaret 33 77.8 years
Most common last names in Aurora, IN among deceased individuals Last name Count Lived (average)
Smith 35 78.7 years Miller 26 75.7 years Jackson 24 71.7 years Meyer 20 76.2 years Baker 19 79.1 years Kaiser 17 81.5 years Bennett 16 72.1 years Green 16 79.4 years Taylor 15 73.3 years Martin 15 77.9 years
Aurora compared to Indiana state average:
Median household income below state average. Median house value below state average. Unemployed percentage below state average. Black race population percentage significantly below state average. Foreign-born population percentage significantly below state average. Length of stay since moving in significantly above state average. House age above state average. Number of college students below state average.
Top Patent Applicants
John Andrew Strasemeier (15)
William G. Pittenger (8)
Ronald J. Mulford (4)
Joseph Flanagan (3)
William Gifford Pittenger (2)
John P. Biondo (2)
Linda Carol Jones (2)
Doug Weber (2)
Jason Newkirk (2)
John Andrew Strasmeier (1)
Total of 50 patent applications in 2008-2024.


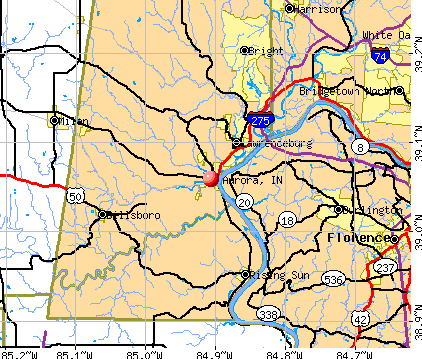


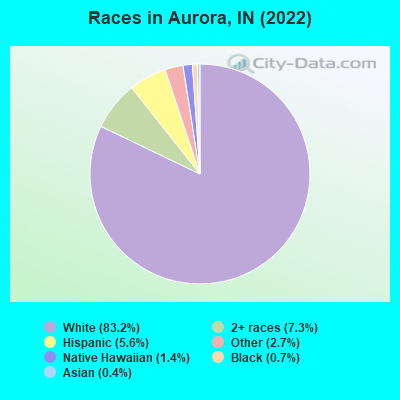
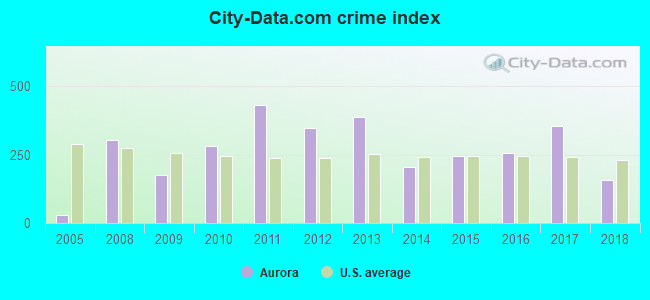
 Recent articles from our blog. Our writers, many of them Ph.D. graduates or candidates, create easy-to-read articles on a wide variety of topics.

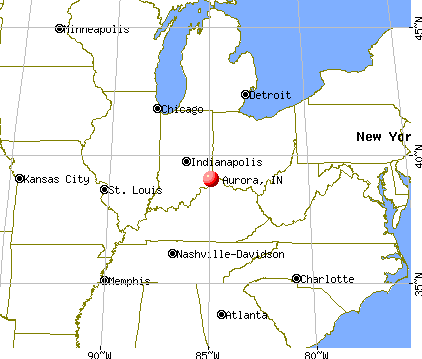
 (22.3 miles
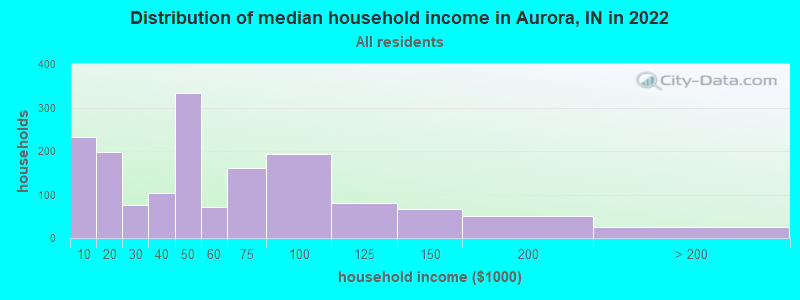
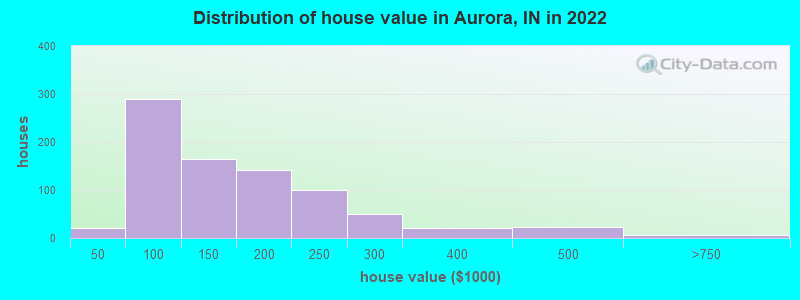
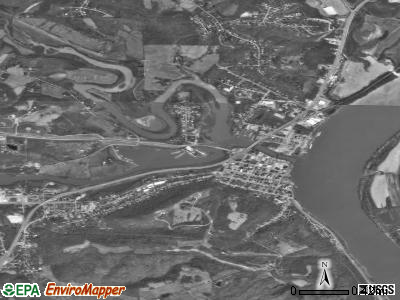
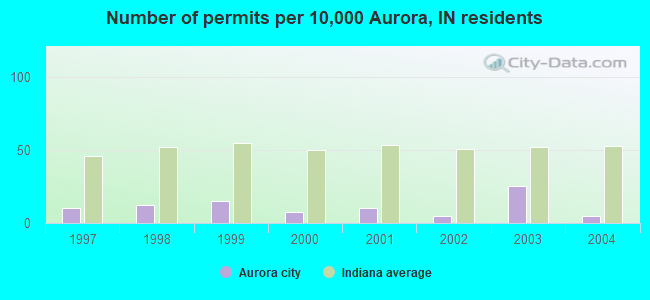
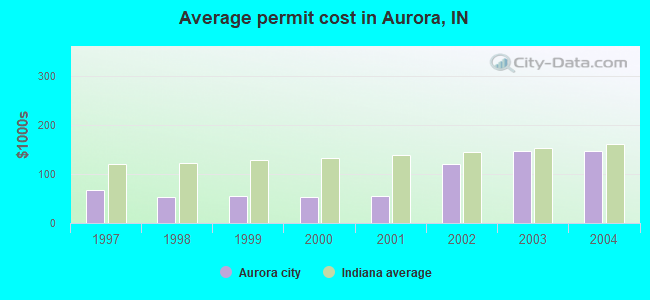
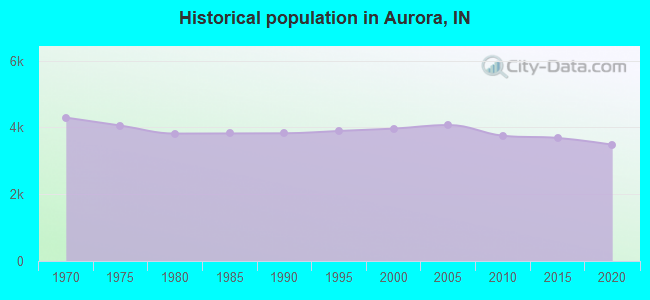
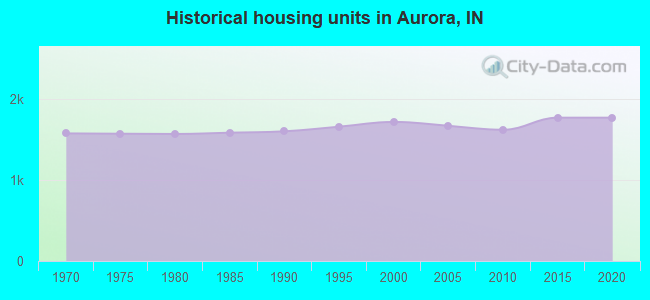
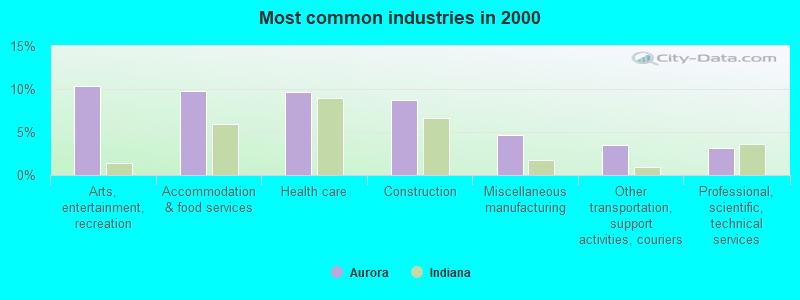
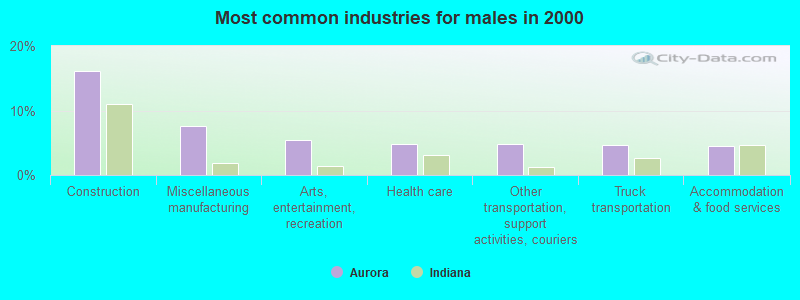
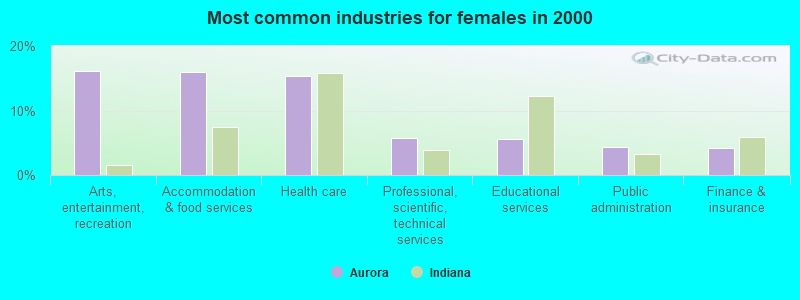
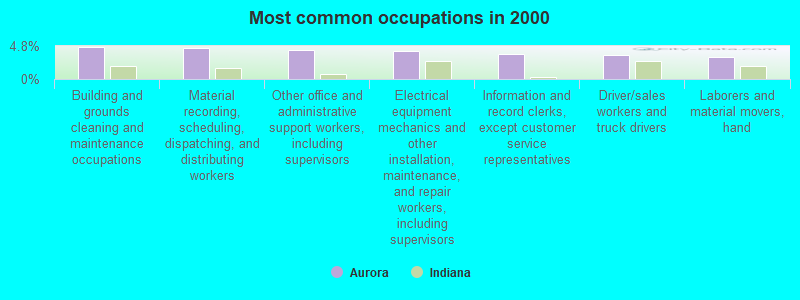
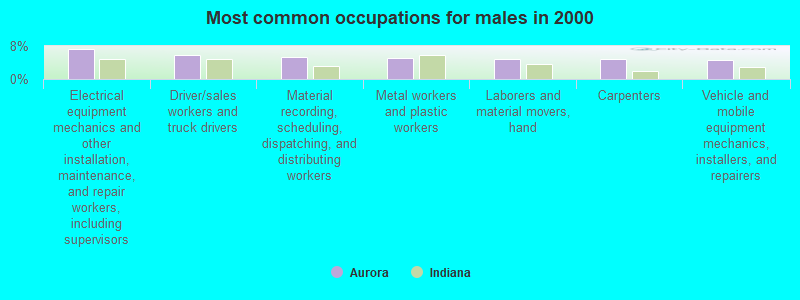
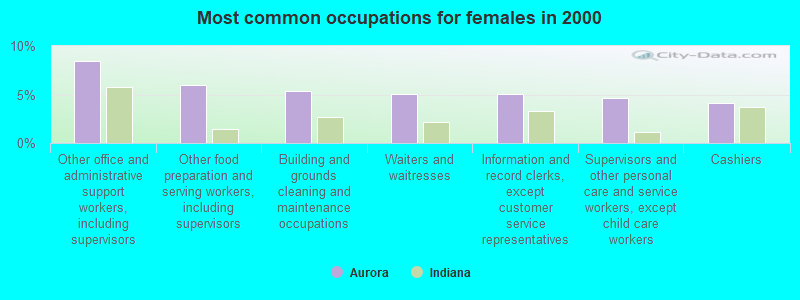
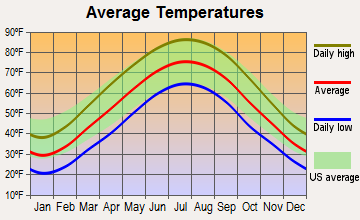
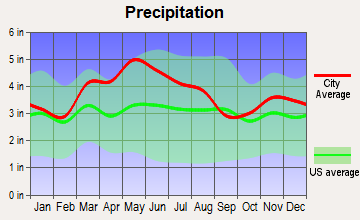
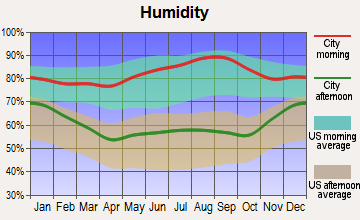
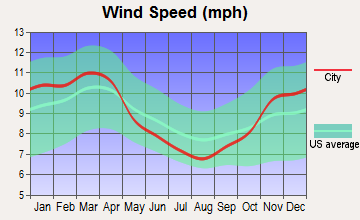
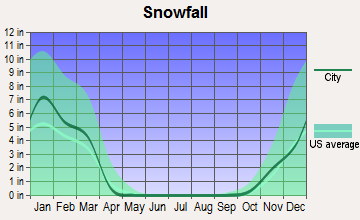
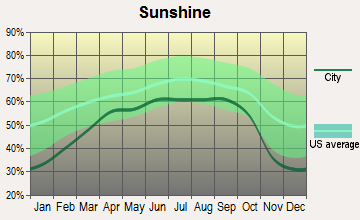
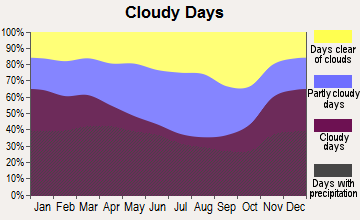
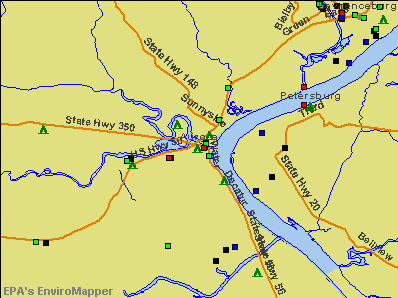

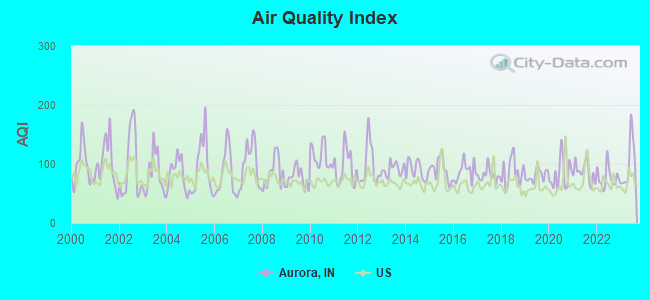
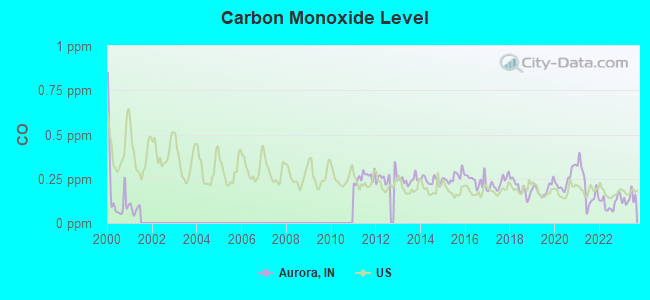
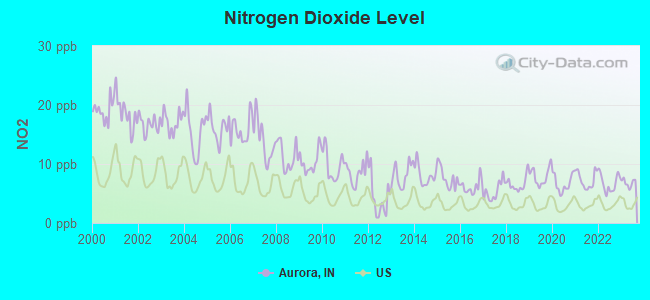
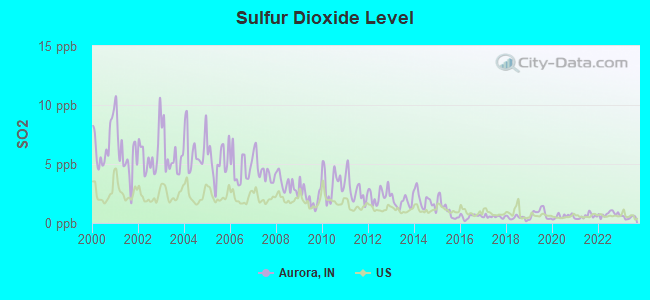
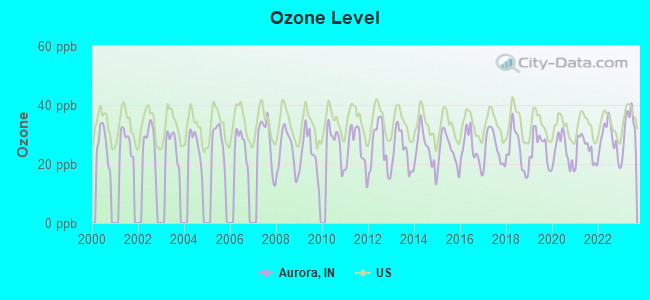
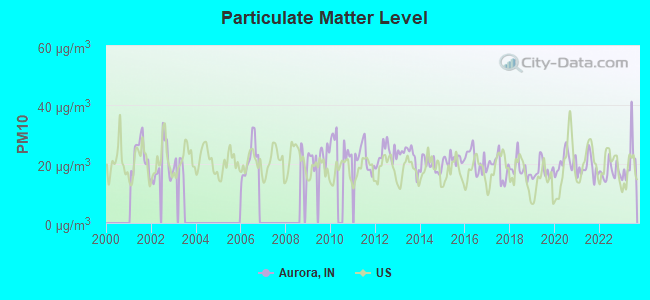
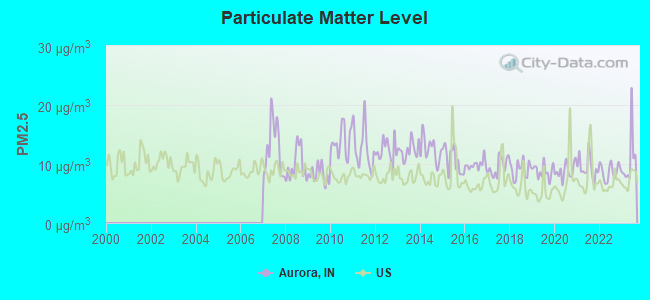

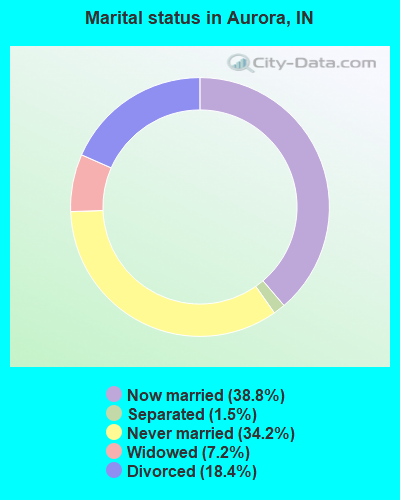
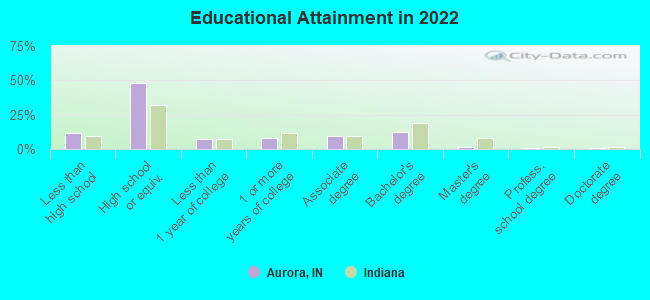
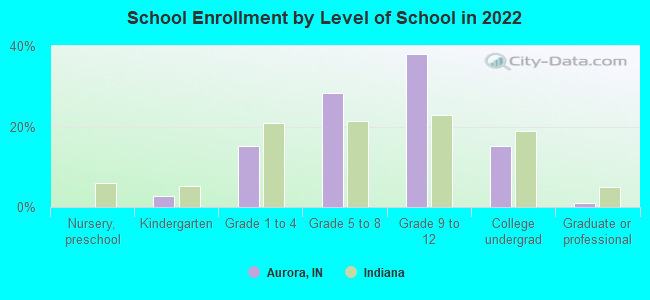
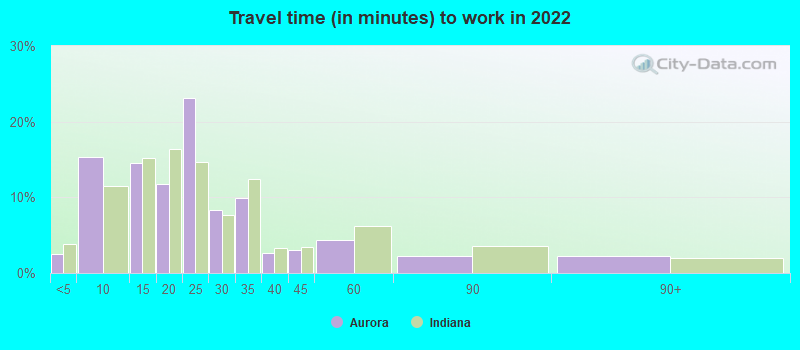
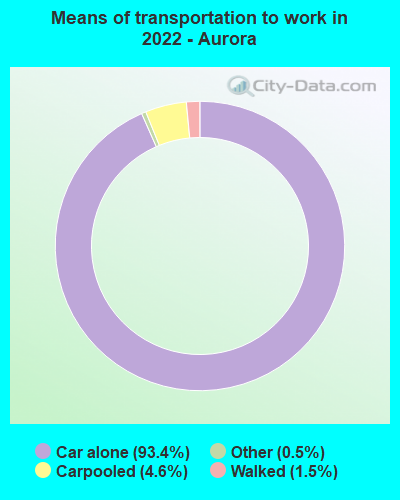
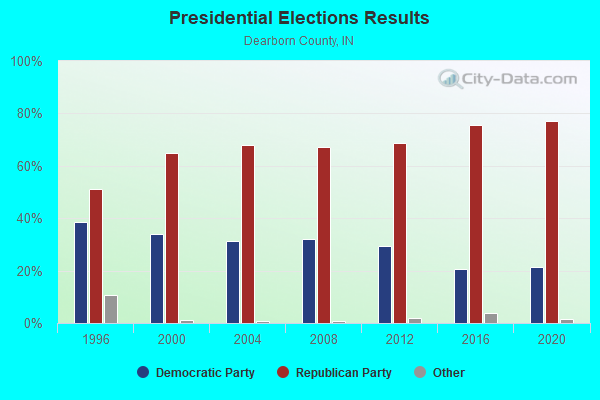
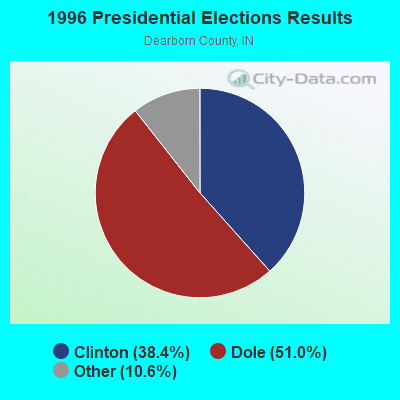

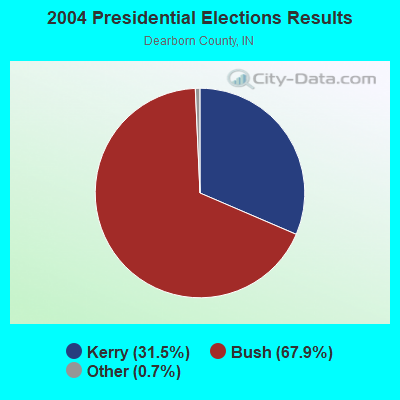
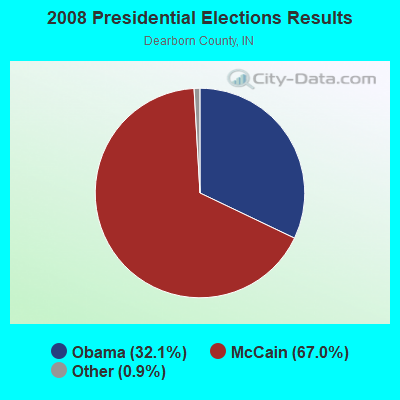

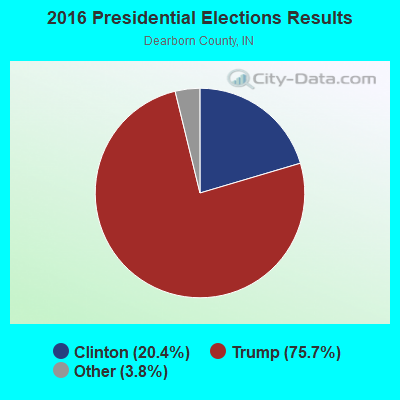
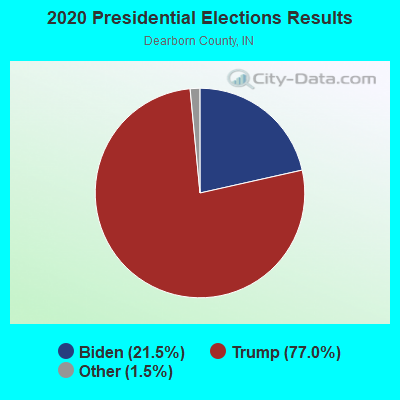
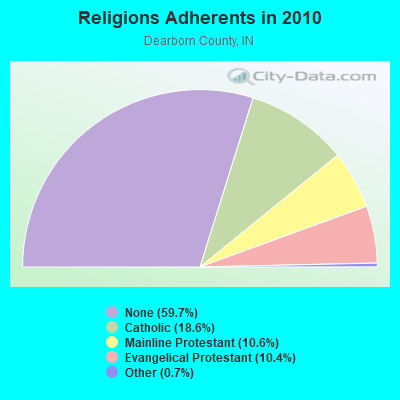
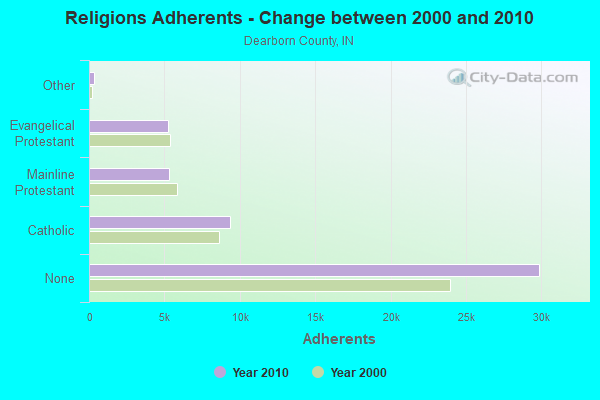
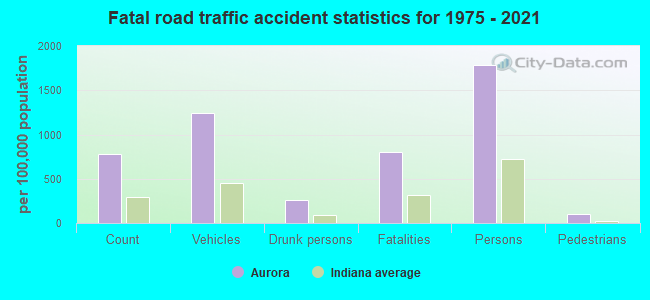
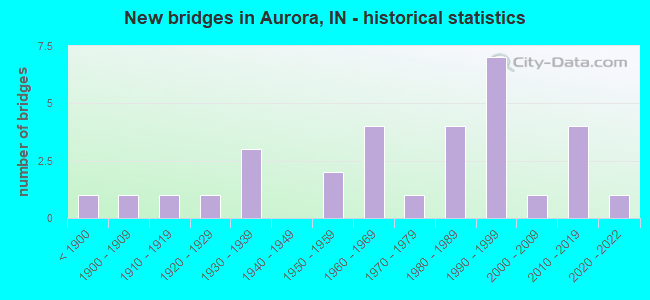
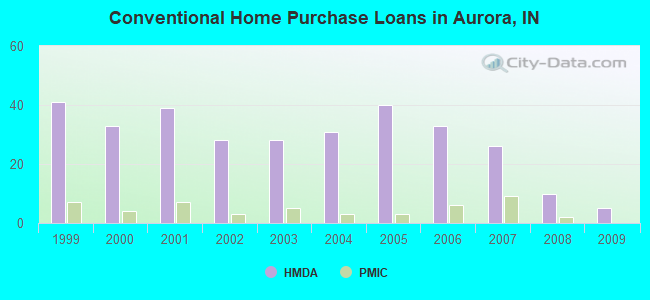
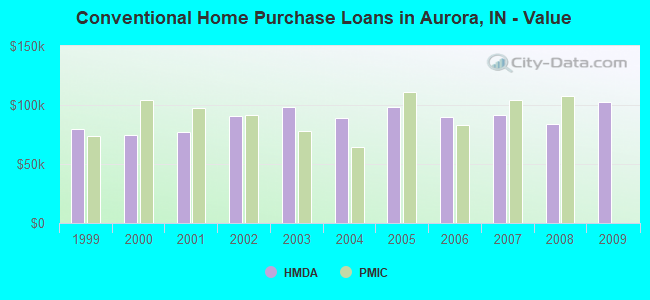
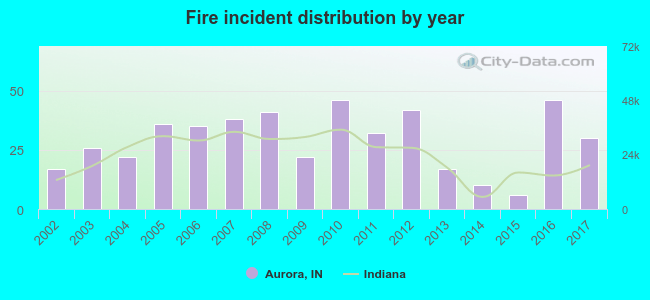 According to the data from the years 2002 - 2017 the average number of fire incidents per year is 29. The highest number of reported fires - 46 took place in 2010, and the least - 6 in 2015. The data has a rising trend.
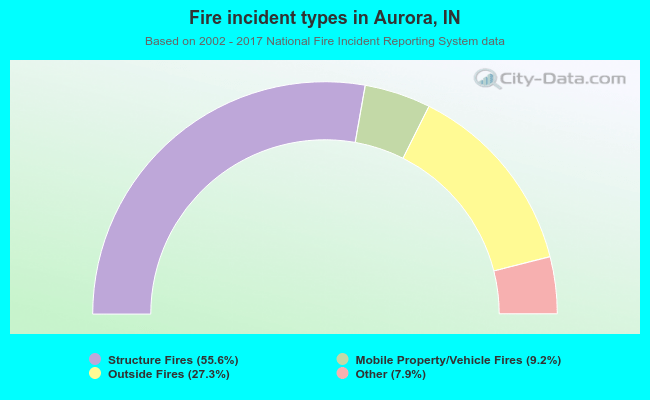 When looking into fire subcategories, the most reports belonged to: Structure Fires (55.6%), and Outside Fires (27.3%).