Belmont, California
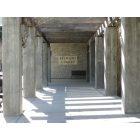
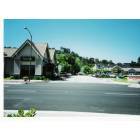
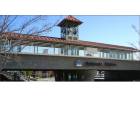
Belmont: Belmont, CA - Library
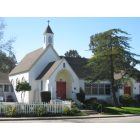
Belmont: Belmont, CA
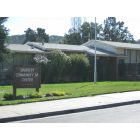
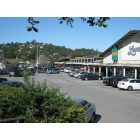
Belmont: Belmont, CA - Community Center
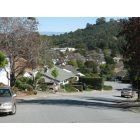
Belmont: Belmont, CA
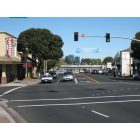
Belmont: Belmont, CA - Downtown. Oracle headquarters in background.
Belmont: Belmont, CA
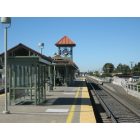
Belmont: Belmont, CA - Train Station
Belmont: downtown Belmont,El Camino Real

Belmont: Old Movie Theatre
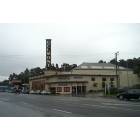
Belmont: 1940's Belmont theatre building preserved by a new business.
Belmont: Belmont Station
- add
your
Submit your own pictures of this city and show them to the world
- OSM Map
- General Map
- Google Map
- MSN Map
Population change since 2000: +6.6%
 |
| Males: 13,782 | |
| Females: 12,991 |
| Median resident age: | 42.0 years |
| California median age: | 37.9 years |
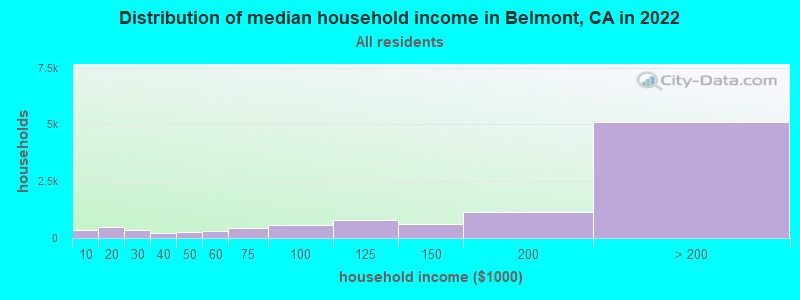
| Belmont: | $180,339 |
| CA: | $91,551 |
Estimated per capita income in 2022: $95,748 (it was $42,812 in 2000)
Belmont city income, earnings, and wages data
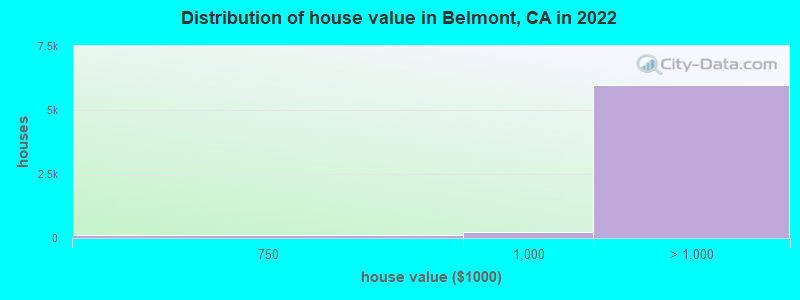
Estimated median house or condo value in 2022: over $1,000,000 (it was $581,800 in 2000)
| Belmont: | over $1,000,000 |
| CA: | $715,900 |
Mean prices in 2022: all housing units: over $1,000,000; detached houses: over $1,000,000; townhouses or other attached units: over $1,000,000; in 2-unit structures: over $1,000,000; in 3-to-4-unit structures: $987,031; in 5-or-more-unit structures: $930,149; mobile homes: $246,733; occupied boats, rvs, vans, etc.: $489,015
Median gross rent in 2022: $2,725.
(6.1% for White Non-Hispanic residents, 15.5% for Black residents, 9.7% for Hispanic or Latino residents, 47.6% for American Indian residents, 4.4% for Native Hawaiian and other Pacific Islander residents, 13.7% for other race residents, 3.5% for two or more races residents)
Detailed information about poverty and poor residents in Belmont, CA


Compare current foreclosures near Belmont, CA:
| Photo | Address | Area | Beds / Baths | Price | Details |
|---|---|---|---|---|---|

|
#1
Miramar Ter
Belmont, CA 94002
|
2,340 sq. feet
|
3 baths 3 beds |
show details | |

|
#2
San Juan Blvd
Belmont, CA 94002
|
1,430 sq. feet
|
2 baths 3 beds |
show details | |

|
#3
Continentals Way Apt 302
Belmont, CA 94002
|
1,107 sq. feet
|
2 baths 2 beds |
show details | |

|
#4
Continentals Way Apt 302
Belmont, CA 94002
|
1,107 sq. feet
|
2 baths 2 beds |
show details | |

|
#5
6th Ave
Belmont, CA 94002
|
1,610 sq. feet
|
2 baths 3 beds |
show details | |

|
#6
Carlmont Dr Apt 401c
Belmont, CA 94002
|
- sq. feet
|
- baths - beds |
show details | |

|
#7
El Camino Real
Belmont, CA 94002
|
- sq. feet
|
- baths - beds |
show details | |

|
#8
Irene Ct Apt 10
Belmont, CA 94002
|
- sq. feet
|
- baths - beds |
show details | |

|
#9
Wickman Pl
San Lorenzo, CA 94580
|
900 sq. feet
|
1 baths 2 beds |
show details | |

|
#10
Joyce St
Hayward, CA 94544
|
1,000 sq. feet
|
1 baths 3 beds |
show details |
| Photo | Address | Area | Beds / Baths | Price | Details |
|---|---|---|---|---|---|

|
#11
Madrid St
San Francisco, CA 94112
|
1,018 sq. feet
|
1 baths 4 beds |
show details | |

|
#12
Lorenzo Ave
San Lorenzo, CA 94580
|
2,037 sq. feet
|
2 baths 2 beds |
show details | |

|
#13
106th Ave
Oakland, CA 94603
|
1,961 sq. feet
|
2 baths 3 beds |
show details | |

|
#14
Tribune Ave
Hayward, CA 94542
|
2,234 sq. feet
|
2 baths 4 beds |
show details | |

|
#15
Euclid Ave
Palo Alto, CA 94303
|
1,600 sq. feet
|
2 baths 4 beds |
show details | |

|
#16
Lorenzo Ave
San Lorenzo, CA 94580
|
1,937 sq. feet
|
1 baths 3 beds |
show details | |

|
#17
Cayuga Ave
San Francisco, CA 94112
|
800 sq. feet
|
1 baths 2 beds |
show details | |

|
#18
D St
Oakland, CA 94603
|
1,140 sq. feet
|
1 baths 3 beds |
show details | |

|
#19
Madrid St
San Francisco, CA 94112
|
1,745 sq. feet
|
2 baths 3 beds |
show details | |

|
#20
Minerva St
San Francisco, CA 94112
|
878 sq. feet
|
1 baths 2 beds |
show details |
| Photo | Address | Area | Beds / Baths | Price | Details |
|---|---|---|---|---|---|

|
#21
Harkness Ave
San Francisco, CA 94134
|
1,412 sq. feet
|
2 baths 3 beds |
show details | |

|
#22
S Humboldt St
San Mateo, CA 94401
|
1,290 sq. feet
|
2 baths 3 beds |
show details | |

|
#23
Cymbidium Cir
South San Francisco, CA 94080
|
1,610 sq. feet
|
2 baths 3 beds |
show details | |

|
#24
Lobos St
San Francisco, CA 94112
|
750 sq. feet
|
1 baths 2 beds |
show details | |

|
#25
Dewey Pl
Fremont, CA 94538
|
1,232 sq. feet
|
2 baths 3 beds |
show details | |

|
#26
Cedar Ct
Daly City, CA 94014
|
1,200 sq. feet
|
2 baths 3 beds |
show details | |

|
#27
Endicott St
San Leandro, CA 94579
|
1,164 sq. feet
|
1 baths 2 beds |
show details | |

|
#28
Alameda De Las Pulgas
Redwood City, CA 94061
|
1,250 sq. feet
|
2 baths 3 beds |
show details | |

|
#29
Marcella St
San Leandro, CA 94578
|
1,426 sq. feet
|
1 baths 3 beds |
show details | |

|
#30
Hollister Ave
San Francisco, CA 94124
|
1,000 sq. feet
|
3 baths 5 beds |
show details |
| Photo | Address | Area | Beds / Baths | Price | Details |
|---|---|---|---|---|---|

|
#31
Cavanaugh St
San Mateo, CA 94401
|
- sq. feet
|
1 baths 2 beds |
show details | |

|
#32
Hempstead Pl
Redwood City, CA 94061
|
1,020 sq. feet
|
1 baths 3 beds |
show details | |

|
#33
Saratoga Ave
Palo Alto, CA 94303
|
750 sq. feet
|
1 baths 3 beds |
show details | |

|
#34
105th Ave
Oakland, CA 94603
|
780 sq. feet
|
1 baths 2 beds |
show details | |

|
#35
F St
Oakland, CA 94603
|
842 sq. feet
|
1 baths 2 beds |
show details | |

|
#36
3rd St
Hayward, CA 94541
|
1,324 sq. feet
|
1 baths 2 beds |
show details | |

|
#37
Cayuga Ave
San Francisco, CA 94112
|
1,340 sq. feet
|
1 baths 3 beds |
show details | |

|
#38
Vienna St
San Francisco, CA 94112
|
760 sq. feet
|
1 baths 3 beds |
show details | |

|
#39
Byxbee St
San Francisco, CA 94132
|
800 sq. feet
|
1 baths 1 beds |
show details | |

|
#40
Acapulco Rd
San Leandro, CA 94577
|
1,196 sq. feet
|
2 baths 3 beds |
show details |
| Photo | Address | Area | Beds / Baths | Price | Details |
|---|---|---|---|---|---|

|
#41
Munich St
San Francisco, CA 94112
|
1,103 sq. feet
|
1 baths 2 beds |
show details | |

|
#42
7th Ave
Menlo Park, CA 94025
|
1,689 sq. feet
|
2 baths 3 beds |
show details | |

|
#43
Fleetwood Dr
San Bruno, CA 94066
|
1,440 sq. feet
|
3 baths 5 beds |
show details | |

|
#44
Toyonita Rd
Los Altos, CA 94024
|
4,833 sq. feet
|
3 baths 5 beds |
show details | |

|
#45
Begonia Dr
San Leandro, CA 94578
|
2,741 sq. feet
|
3 baths 5 beds |
show details | |

|
#46
Mirada Rd
Half Moon Bay, CA 94019
|
2,450 sq. feet
|
4 baths 4 beds |
show details | |

|
#47
Chestnut St
San Carlos, CA 94070
|
1,390 sq. feet
|
2 baths 3 beds |
show details | |

|
#48
Mulberry St
Newark, CA 94560
|
984 sq. feet
|
1 baths 3 beds |
show details | |

|
#49
Alvarado St
San Leandro, CA 94578
|
1,135 sq. feet
|
1 baths 3 beds |
show details | |

|
Check over 1 million property listings on Foreclosure.com!
|
browse all offers | |||


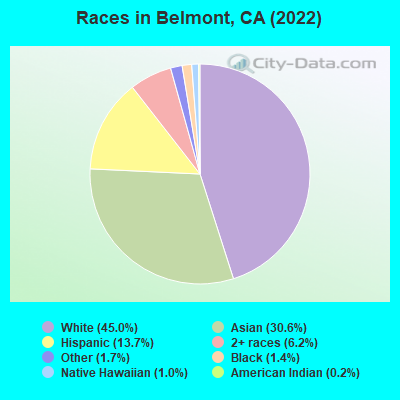
- 12,09245.0%White alone
- 8,23530.6%Asian alone
- 3,69713.7%Hispanic
- 1,6726.2%Two or more races
- 4531.7%Other race alone
- 3691.4%Black alone
- 2651.0%Native Hawaiian and Other
Pacific Islander alone - 660.2%American Indian alone
According to our research of California and other state lists, there were 11 registered sex offenders living in Belmont, California as of April 25, 2024.
The ratio of all residents to sex offenders in Belmont is 2,480 to 1.
The ratio of registered sex offenders to all residents in this city is much lower than the state average.
Type |
2009 |
2010 |
2011 |
2012 |
2013 |
2014 |
2015 |
2016 |
2017 |
2018 |
2019 |
2020 |
2021 |
2022 |
|---|---|---|---|---|---|---|---|---|---|---|---|---|---|---|
| Murders (per 100,000) | 1 (4.0) | 0 (0.0) | 0 (0.0) | 0 (0.0) | 1 (3.7) | 0 (0.0) | 1 (3.7) | 0 (0.0) | 1 (3.7) | 0 (0.0) | 1 (3.7) | 0 (0.0) | 0 (0.0) | 0 (0.0) |
| Rapes (per 100,000) | 2 (8.1) | 0 (0.0) | 2 (7.7) | 4 (15.2) | 5 (18.7) | 9 (33.4) | 3 (11.0) | 8 (29.1) | 4 (14.7) | 10 (36.6) | 8 (29.3) | 11 (40.6) | 5 (18.8) | 9 (34.3) |
| Robberies (per 100,000) | 5 (20.2) | 8 (31.0) | 6 (23.0) | 5 (18.9) | 4 (15.0) | 9 (33.4) | 5 (18.3) | 5 (18.2) | 7 (25.7) | 10 (36.6) | 1 (3.7) | 7 (25.9) | 6 (22.6) | 6 (22.8) |
| Assaults (per 100,000) | 12 (48.5) | 18 (69.7) | 8 (30.6) | 15 (56.8) | 17 (63.7) | 18 (66.8) | 17 (62.1) | 18 (65.5) | 27 (99.0) | 20 (73.2) | 35 (128.3) | 34 (125.6) | 10 (37.6) | 25 (95.1) |
| Burglaries (per 100,000) | 56 (226.3) | 69 (267.1) | 98 (374.9) | 92 (348.6) | 129 (483.2) | 75 (278.3) | 65 (237.4) | 86 (312.8) | 49 (179.6) | 58 (212.3) | 50 (183.3) | 53 (195.8) | 63 (236.9) | 73 (277.8) |
| Thefts (per 100,000) | 338 (1,366) | 268 (1,037) | 308 (1,178) | 270 (1,023) | 269 (1,008) | 266 (987.1) | 341 (1,246) | 266 (967.6) | 296 (1,085) | 336 (1,230) | 312 (1,144) | 335 (1,238) | 170 (639.2) | 265 (1,008) |
| Auto thefts (per 100,000) | 45 (181.9) | 30 (116.1) | 48 (183.6) | 46 (174.3) | 39 (146.1) | 31 (115.0) | 41 (149.8) | 25 (90.9) | 32 (117.3) | 30 (109.8) | 30 (110.0) | 34 (125.6) | 21 (79.0) | 33 (125.6) |
| Arson (per 100,000) | 5 (20.2) | 1 (3.9) | 2 (7.7) | 2 (7.6) | 1 (3.7) | 1 (3.7) | 2 (7.3) | 6 (21.8) | 8 (29.3) | 1 (3.7) | 2 (7.3) | 2 (7.4) | 1 (3.8) | 6 (22.8) |
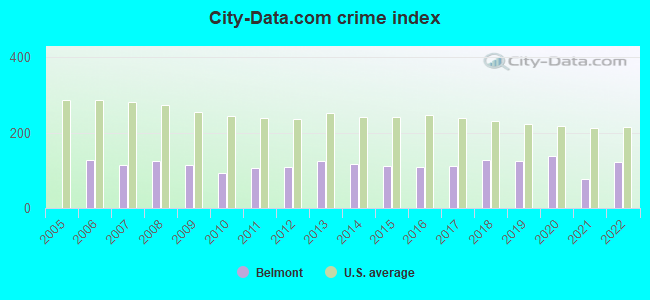
| City-Data.com crime index | 115.4 | 92.7 | 107.2 | 108.5 | 125.5 | 118.3 | 112.4 | 109.7 | 111.9 | 127.7 | 125.0 | 138.7 | 77.8 | 123.1 |
The City-Data.com crime index weighs serious crimes and violent crimes more heavily. Higher means more crime, U.S. average is 246.1. It adjusts for the number of visitors and daily workers commuting into cities.
Crime rate in Belmont detailed stats: murders, rapes, robberies, assaults, burglaries, thefts, arson
Full-time law enforcement employees in 2021, including police officers: 41 (30 officers - 28 male; 2 female).
| Officers per 1,000 residents here: | 1.13 |
| California average: | 2.30 |
 Recent articles from our blog. Our writers, many of them Ph.D. graduates or candidates, create easy-to-read articles on a wide variety of topics.


Latest news from Belmont, CA collected exclusively by city-data.com from local newspapers, TV, and radio stations
Ancestries: German (4.9%), American (4.4%), European (3.7%), English (3.1%), Irish (3.1%), Italian (2.7%).
Current Local Time: PST time zone
Elevation: 33 feet
Land area: 4.53 square miles.
Population density: 5,916 people per square mile (average).
8,261 residents are foreign born (18.6% Asia, 5.2% Europe, 4.2% Latin America).
| This city: | 30.7% |
| California: | 26.5% |
Median real estate property taxes paid for housing units with mortgages in 2022: $10,118 (0.5%)
Median real estate property taxes paid for housing units with no mortgage in 2022: $7,551 (0.3%)
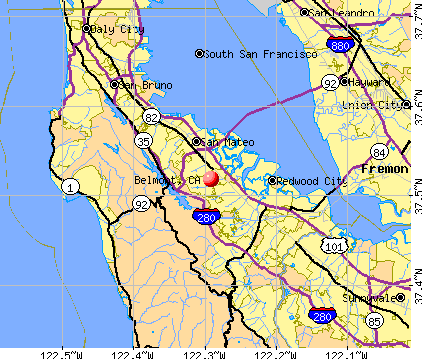
Nearest city with pop. 50,000+: San Mateo, CA  (2.8 miles , pop. 92,482).
Nearest city with pop. 200,000+: Fremont, CA (17.0 miles , pop. 203,413).
Nearest city with pop. 1,000,000+: Los Angeles, CA (323.4 miles , pop. 3,694,820).
Nearest cities:
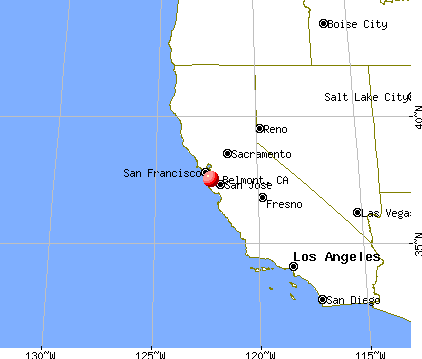
), ), )Latitude: 37.52 N, Longitude: 122.29 W
Daytime population change due to commuting: -4,290 (-16.0%)
Workers who live and work in this city: 5,494 (40.3%)
Area code commonly used in this area: 650
Property values in Belmont, CA
Belmont, California accommodation & food services, waste management - Economy and Business Data
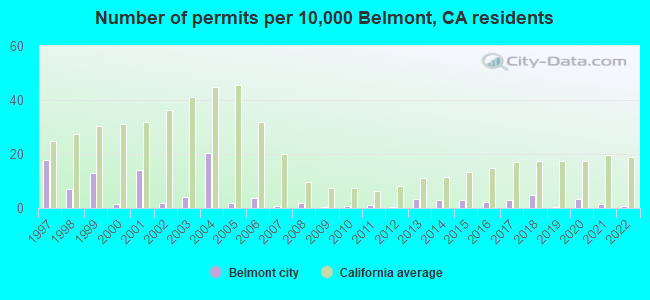
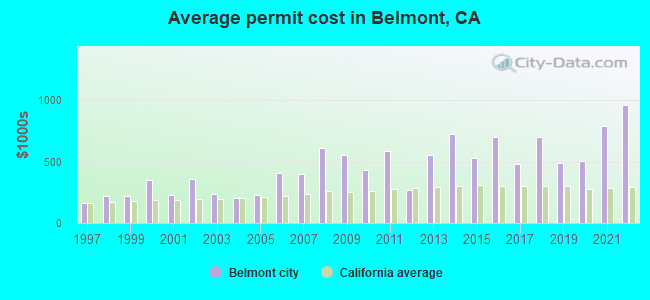
Single-family new house construction building permits:
- 2022: 2 buildings, average cost: $960,500
- 2021: 4 buildings, average cost: $786,000
- 2020: 8 buildings, average cost: $503,900
- 2019: 1 building, cost: $486,500
- 2018: 12 buildings, average cost: $697,700
- 2017: 7 buildings, average cost: $479,900
- 2016: 6 buildings, average cost: $699,600
- 2015: 7 buildings, average cost: $525,000
- 2014: 7 buildings, average cost: $722,100
- 2013: 8 buildings, average cost: $553,800
- 2012: 1 building, cost: $270,000
- 2011: 3 buildings, average cost: $585,000
- 2010: 2 buildings, average cost: $433,500
- 2009: 1 building, cost: $550,000
- 2008: 5 buildings, average cost: $613,100
- 2007: 2 buildings, average cost: $400,000
- 2006: 9 buildings, average cost: $409,700
- 2005: 5 buildings, average cost: $231,000
- 2004: 51 buildings, average cost: $202,300
- 2003: 10 buildings, average cost: $239,400
- 2002: 5 buildings, average cost: $359,200
- 2001: 35 buildings, average cost: $228,700
- 2000: 4 buildings, average cost: $346,000
- 1999: 33 buildings, average cost: $217,400
- 1998: 18 buildings, average cost: $221,900
- 1997: 45 buildings, average cost: $161,300
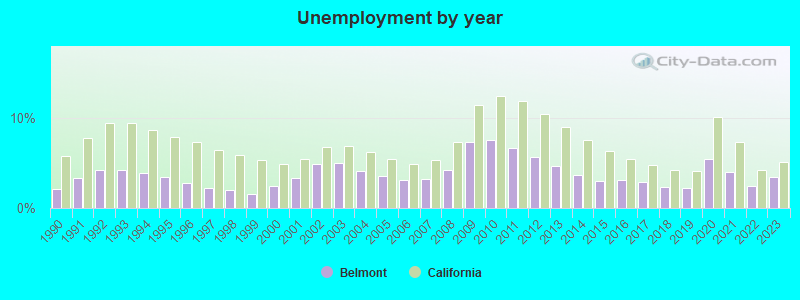
| Here: | 3.4% |
| California: | 5.1% |
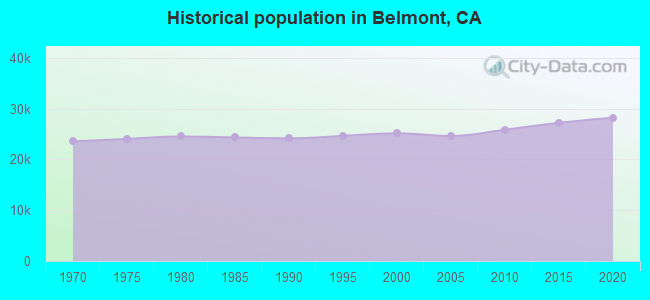
Population change in the 1990s: +1,093 (+4.5%).
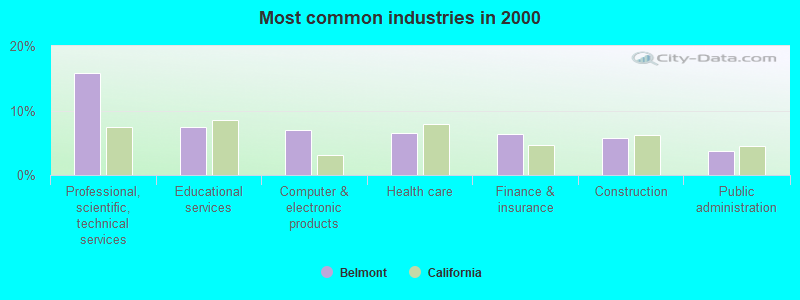
- Professional, scientific, technical services (15.8%)
- Educational services (7.5%)
- Computer & electronic products (7.0%)
- Health care (6.6%)
- Finance & insurance (6.3%)
- Construction (5.8%)
- Public administration (3.8%)
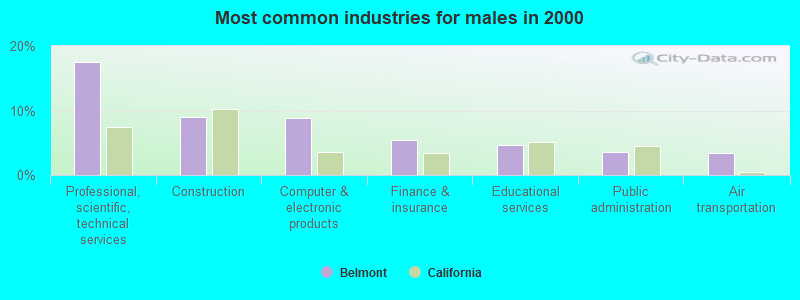
- Professional, scientific, technical services (17.5%)
- Construction (9.0%)
- Computer & electronic products (8.8%)
- Finance & insurance (5.4%)
- Educational services (4.7%)
- Public administration (3.6%)
- Air transportation (3.4%)
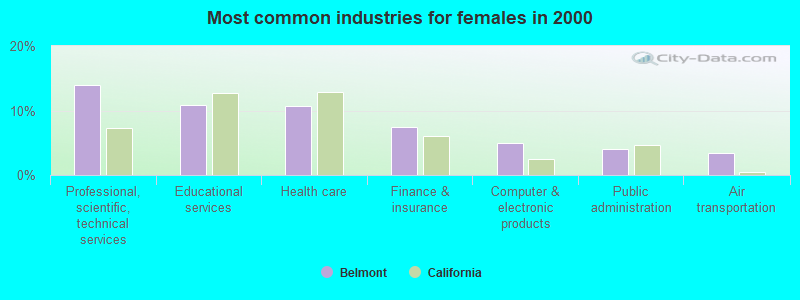
- Professional, scientific, technical services (13.9%)
- Educational services (10.8%)
- Health care (10.7%)
- Finance & insurance (7.4%)
- Computer & electronic products (4.9%)
- Public administration (4.0%)
- Air transportation (3.4%)
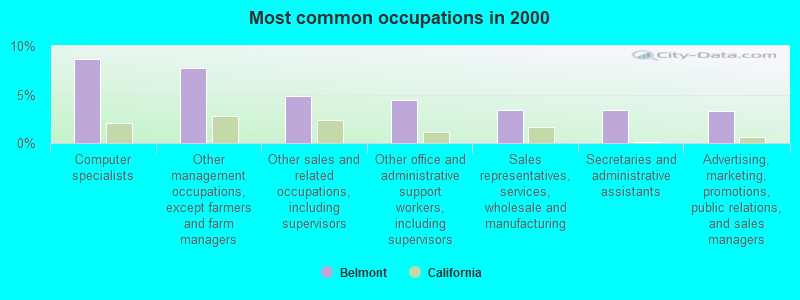
- Computer specialists (8.6%)
- Other management occupations, except farmers and farm managers (7.8%)
- Other sales and related occupations, including supervisors (4.8%)
- Other office and administrative support workers, including supervisors (4.4%)
- Sales representatives, services, wholesale and manufacturing (3.4%)
- Secretaries and administrative assistants (3.4%)
- Advertising, marketing, promotions, public relations, and sales managers (3.3%)

- Computer specialists (11.5%)
- Other management occupations, except farmers and farm managers (7.6%)
- Other sales and related occupations, including supervisors (6.0%)
- Engineers (4.7%)
- Top executives (4.6%)
- Sales representatives, services, wholesale and manufacturing (4.1%)
- Advertising, marketing, promotions, public relations, and sales managers (3.8%)
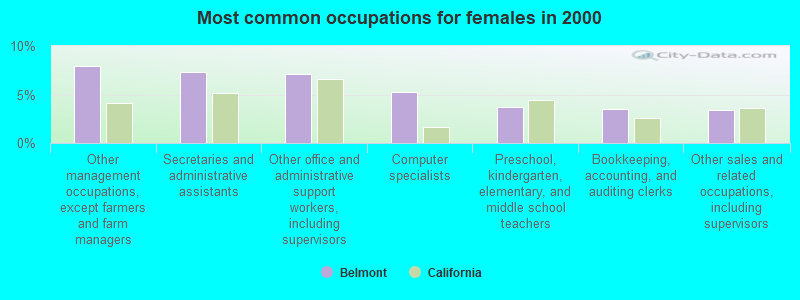
- Other management occupations, except farmers and farm managers (7.9%)
- Secretaries and administrative assistants (7.4%)
- Other office and administrative support workers, including supervisors (7.1%)
- Computer specialists (5.2%)
- Preschool, kindergarten, elementary, and middle school teachers (3.8%)
- Bookkeeping, accounting, and auditing clerks (3.5%)
- Other sales and related occupations, including supervisors (3.4%)
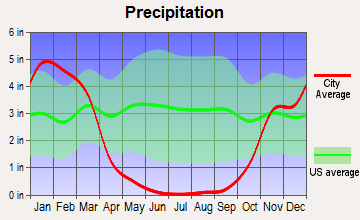
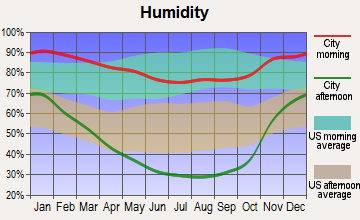
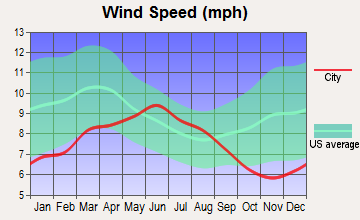
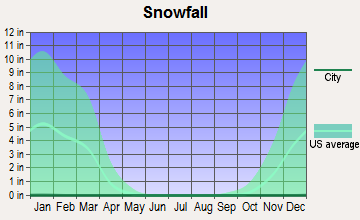
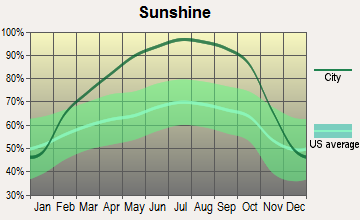
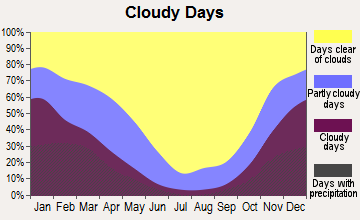
Average climate in Belmont, California
Based on data reported by over 4,000 weather stations

|
|

(lower is better)
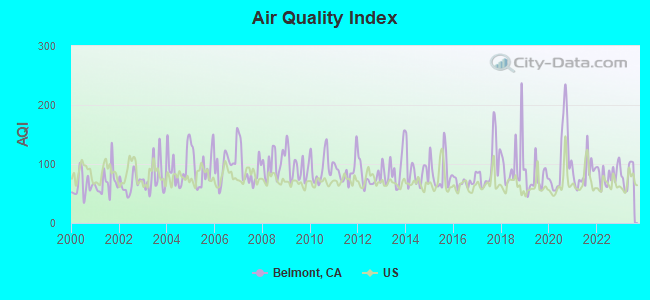
Air Quality Index (AQI) level in 2023 was 81.5. This is about average.
| City: | 81.5 |
| U.S.: | 72.6 |

Carbon Monoxide (CO) [ppm] level in 2023 was 0.297. This is about average. Closest monitor was 3.1 miles away from the city center.
| City: | 0.297 |
| U.S.: | 0.251 |
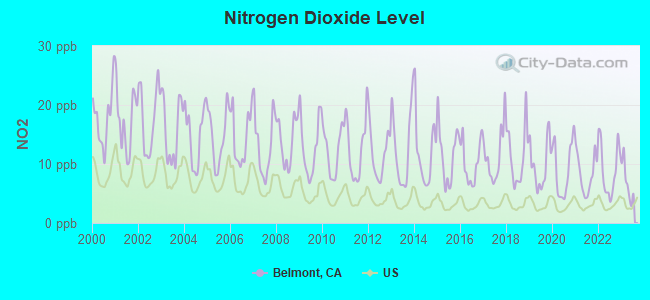
Nitrogen Dioxide (NO2) [ppb] level in 2023 was 6.96. This is worse than average. Closest monitor was 3.1 miles away from the city center.
| City: | 6.96 |
| U.S.: | 5.11 |
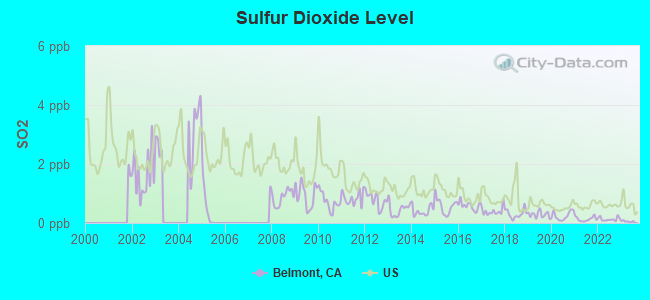
Sulfur Dioxide (SO2) [ppb] level in 2023 was 0.0549. This is significantly better than average. Closest monitor was 15.7 miles away from the city center.
| City: | 0.0549 |
| U.S.: | 1.5147 |
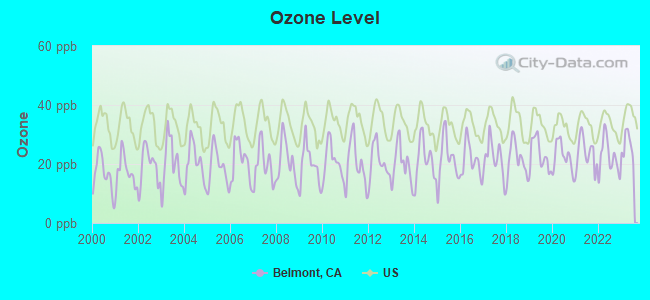
Ozone [ppb] level in 2023 was 26.3. This is better than average. Closest monitor was 3.1 miles away from the city center.
| City: | 26.3 |
| U.S.: | 33.3 |
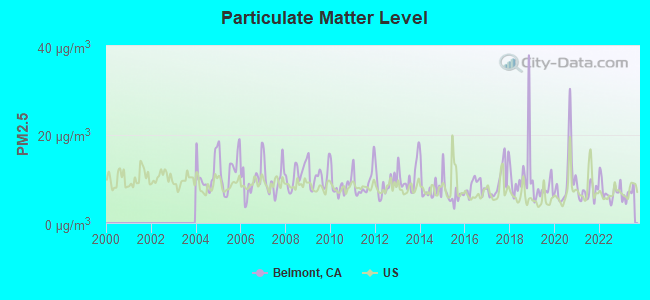
Particulate Matter (PM2.5) [µg/m3] level in 2023 was 6.44. This is better than average. Closest monitor was 5.4 miles away from the city center.
| City: | 6.44 |
| U.S.: | 8.11 |
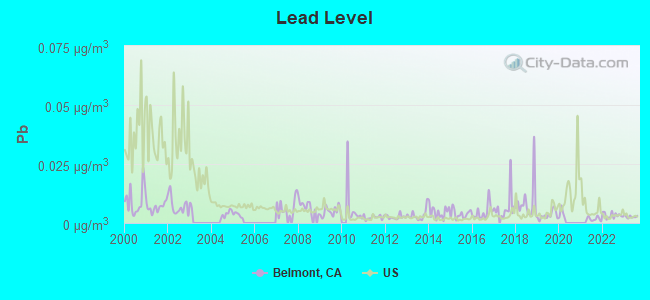
Lead (Pb) [µg/m3] level in 2023 was 0.00267. This is significantly better than average. Closest monitor was 5.4 miles away from the city center.
| City: | 0.00267 |
| U.S.: | 0.00931 |
Earthquake activity:
Belmont-area historical earthquake activity is significantly above California state average. It is 7408% greater than the overall U.S. average.On 4/18/1906 at 13:12:21, a magnitude 7.9 (7.9 UK, Class: Major, Intensity: VIII - XII) earthquake occurred 51.1 miles away from the city center, causing $524,000,000 total damage
On 10/18/1989 at 00:04:15, a magnitude 7.1 (6.5 MB, 7.1 MS, 6.9 MW, 7.0 ML) earthquake occurred 40.3 miles away from Belmont center, causing 62 deaths (62 shaking deaths) and 3757 injuries, causing $1,305,032,704 total damage
On 11/4/1927 at 13:51:53, a magnitude 7.5 (7.5 UK) earthquake occurred 193.3 miles away from the city center
On 7/21/1952 at 11:52:14, a magnitude 7.7 (7.7 UK) earthquake occurred 253.0 miles away from Belmont center, causing $50,000,000 total damage
On 1/31/1922 at 13:17:28, a magnitude 7.6 (7.6 UK) earthquake occurred 281.2 miles away from Belmont center
On 4/25/1992 at 18:06:04, a magnitude 7.2 (6.3 MB, 7.1 MS, 7.2 MW, 7.1 MW, Depth: 9.4 mi) earthquake occurred 217.9 miles away from Belmont center, causing $75,000,000 total damage
Magnitude types: body-wave magnitude (MB), local magnitude (ML), surface-wave magnitude (MS), moment magnitude (MW)
Natural disasters:
The number of natural disasters in San Mateo County (18) is near the US average (15).Major Disasters (Presidential) Declared: 11
Emergencies Declared: 2
Causes of natural disasters: Floods: 11, Storms: 6, Mudslides: 5, Winter Storms: 5, Landslides: 4, Fires: 2, Drought: 1, Earthquake: 1, Freeze: 1, Hurricane: 1, Tornado: 1, Other: 1 (Note: some incidents may be assigned to more than one category).

Hospitals and medical centers in Belmont:
Amtrak stations near Belmont:
- 8 miles: MILLBRAE (MILLBRAE AVE. & CALIFORNIA DR.) - Bus Station . Services: fully wheelchair accessible, public payphones, free short-term parking, call for taxi service, public transit connection.
- 9 miles: SAN FRANCISCO INT'L AIRPO (SAN BRUNO, SAN FRANCISCO INTERNATIONAL AIRPORT) - Bus Station . Services: fully wheelchair accessible, enclosed waiting area, public restrooms, public payphones, snack bar, paid short-term parking, paid long-term parking, car rental agency, taxi stand, public transit connection.
- 15 miles: HAYWARD (22555 MEEKLAND AVE.) . Services: fully wheelchair accessible, public payphones, free short-term parking.
College/University in Belmont:
Colleges/universities with over 2000 students nearest to Belmont:
- College of San Mateo (about 3 miles; San Mateo, CA; Full-time enrollment: 5,398)
- Canada College (about 6 miles; Redwood City, CA; FT enrollment: 3,446)
- Stanford University (about 9 miles; Stanford, CA; FT enrollment: 14,410)
- Skyline College (about 13 miles; San Bruno, CA; FT enrollment: 5,824)
- Chabot College (about 14 miles; Hayward, CA; FT enrollment: 7,610)
- Foothill College (about 15 miles; Los Altos Hills, CA; FT enrollment: 9,635)
- California State University-East Bay (about 17 miles; Hayward, CA; FT enrollment: 12,956)
Public high school in Belmont:
- CARLMONT HIGH (Students: 1,495, Location: 1400 ALAMEDA DE LAS PULGAS, Grades: 9-12)
Private high school in Belmont:
Public elementary/middle schools in Belmont:
- RALSTON INTERMEDIATE (Students: 787, Location: 2675 RALSTON AVE., Grades: 6-8)
- FOX ELEMENTARY (Students: 216, Location: 3100 SAINT JAMES RD., Grades: KG-5)
- CIPRIANI ELEMENTARY (Students: 182, Location: 2525 BUENA VISTA, Grades: KG-5)
- NESBIT ELEMENTARY (Students: 154, Location: 500 BIDDULPH WAY, Grades: KG-5)
- CENTRAL ELEMENTARY (Location: 525 MIDDLE RD., Grades: KG-5)
Private elementary/middle schools in Belmont:
- BELMONT OAKS ACADEMY (Students: 390, Location: 2200 CARLMONT DR, Grades: PK-5)
- IMMACULATE HEART OF MARY SCHOOL (Students: 320, Location: 1000 ALAMEDA DE LAS PULGAS, Grades: PK-8)
- CHARLES ARMSTRONG SCHOOL (Students: 245, Location: 1405 SOLANA DR, Grades: 1-8)
- NOTRE DAME ELEMENTARY SCHOOL (Students: 208, Location: 1200 NOTRE DAME AVE, Grades: 1-8)
- SERENDIPITY SCHOOL (Students: 117, Location: 2820 PONCE AVE, Grades: KG-5)
- GLORIA DEI LUTHERAN ELEMENTARY SCHOOL (Students: 17, Location: 2600 RALSTON AVE, Grades: PK-5)
User-submitted facts and corrections:
- "COLLEGE OF NOTRE DAME" Website: WWW.CND.EDU "Became Notre Dame de Namur University" at website www.ndnu.edu
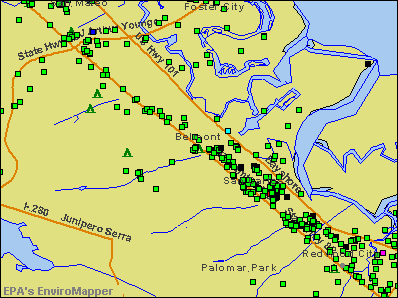
Points of interest:
Notable locations in Belmont: Ralston Hall (A), Belmont City Hall (B), Barrett Community Center (C), Belmont Branch San Mateo County Library (D), Belmont San Carlos Fire Department Station 15 (E), Belmont San Carlos Fire Department Station 14 (F). Display/hide their locations on the map
Shopping Center: Carlmont Village Shopping Center (1). Display/hide its location on the map
Church in Belmont: Gloria Dei Evangelical Lutheran Church (A). Display/hide its location on the map
Reservoir: Water Dog Lake (A). Display/hide its location on the map
Streams, rivers, and creeks: Phelps Slough (A), Belmont Creek (B). Display/hide their locations on the map
Parks in Belmont include: Belameda Park (1), Hallmark Park (2), John S Brooks Memorial Open Space (3), Water Dog Lake Park (4), Alexander Park (5), Belmont Sports Complex (6), O'Donnel Park (7), Twin Pines Park (8). Display/hide their locations on the map
Tourist attraction: Belmont Historical Society Museum (1225 Ralston Avenue).
Hotels: Belmont Palms Motel (700 El Camino Real), Bel-Mateo Motel (803 Belmont Avenue).
Birthplace of: Ryan Boschetti - 2005 NFL player (Washington Redskins, born: Oct 7, 1981), Amaechi Igwe - Footballer, Riley Costello (actor) - Actor, Sidney Edward Mezes - Philosopher.
| This city: | 2.4 people |
| California: | 2.9 people |
| This city: | 64.8% |
| Whole state: | 68.7% |
| This city: | 5.7% |
| Whole state: | 7.2% |
Likely homosexual households (counted as self-reported same-sex unmarried-partner households)
- Lesbian couples: 0.4% of all households
- Gay men: 0.5% of all households
People in group quarters in Belmont in 2010:
- 329 people in college/university student housing
- 120 people in nursing facilities/skilled-nursing facilities
- 30 people in group homes intended for adults
- 29 people in other noninstitutional facilities
- 6 people in emergency and transitional shelters (with sleeping facilities) for people experiencing homelessness
People in group quarters in Belmont in 2000:
- 299 people in college dormitories (includes college quarters off campus)
- 135 people in other group homes
- 103 people in nursing homes
- 41 people in other noninstitutional group quarters
- 24 people in homes for the mentally retarded
- 19 people in homes or halfway houses for drug/alcohol abuse
- 6 people in religious group quarters
Banks with branches in Belmont (2011 data):
- Wells Fargo Bank, National Association: Belmont Branch at 1045 Ralston Avenue, branch established on 1952/12/27. Info updated 2011/04/05: Bank assets: $1,161,490.0 mil, Deposits: $905,653.0 mil, headquarters in Sioux Falls, SD, positive income, 6395 total offices, Holding Company: Wells Fargo & Company
- U.S. Bank National Association: Belmont Branch at 910 Ralston Avenue, branch established on 1986/06/30. Info updated 2012/01/30: Bank assets: $330,470.8 mil, Deposits: $236,091.5 mil, headquarters in Cincinnati, OH, positive income, 3121 total offices, Holding Company: U.S. Bancorp
- Citibank, National Association: 1888 Ralston Ave Branch at 1888 Ralston Ave, branch established on 1934/10/01. Info updated 2012/01/10: Bank assets: $1,288,658.0 mil, Deposits: $882,541.0 mil, headquarters in Sioux Falls, SD, positive income, International Specialization, 1048 total offices, Holding Company: Citigroup Inc.
- Bank of America, National Association: Belmont Branch at 2031 Ralston Avenue, branch established on 1957/09/30. Info updated 2009/11/18: Bank assets: $1,451,969.3 mil, Deposits: $1,077,176.8 mil, headquarters in Charlotte, NC, positive income, 5782 total offices, Holding Company: Bank Of America Corporation
For population 15 years and over in Belmont:
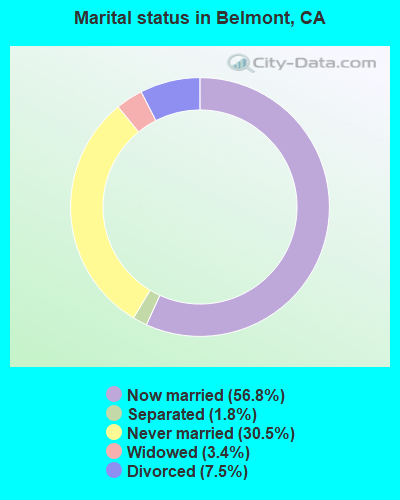
- Never married: 30.5%
- Now married: 56.8%
- Separated: 1.8%
- Widowed: 3.4%
- Divorced: 7.5%
For population 25 years and over in Belmont:
- High school or higher: 96.1%
- Bachelor's degree or higher: 68.5%
- Graduate or professional degree: 33.2%
- Unemployed: 3.0%
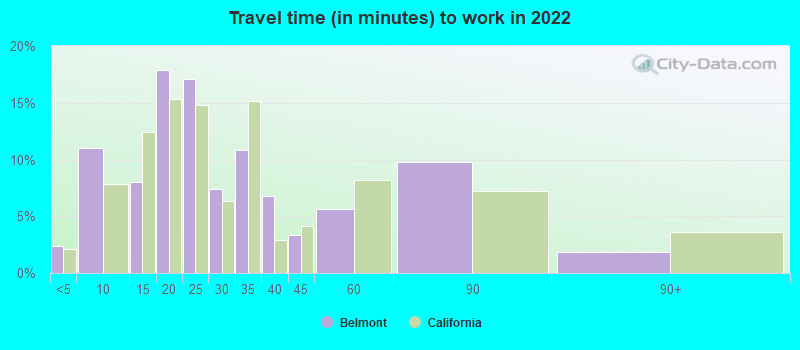
- Mean travel time to work (commute): 17.6 minutes

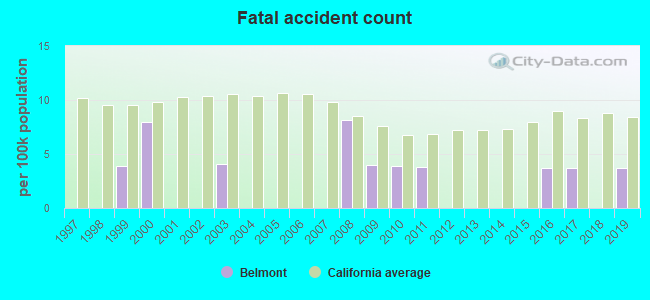
| Here: | 10.3 |
| California average: | 15.5 |
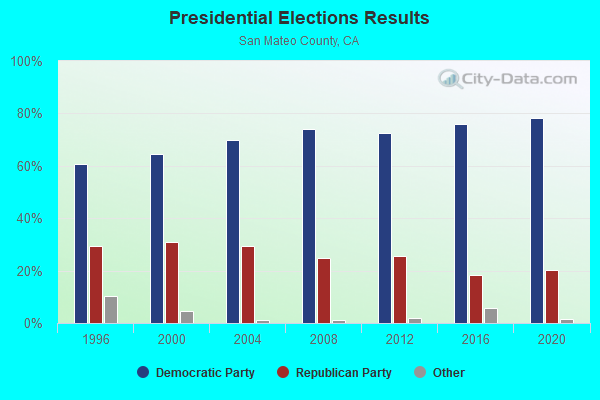
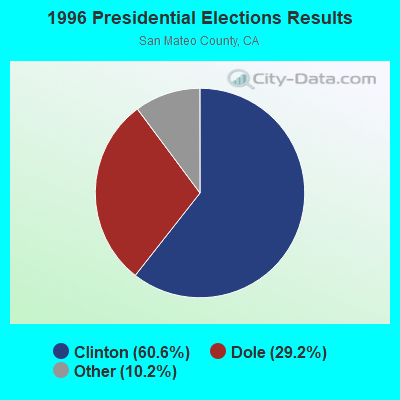
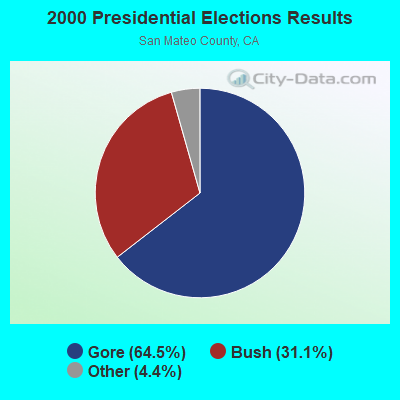
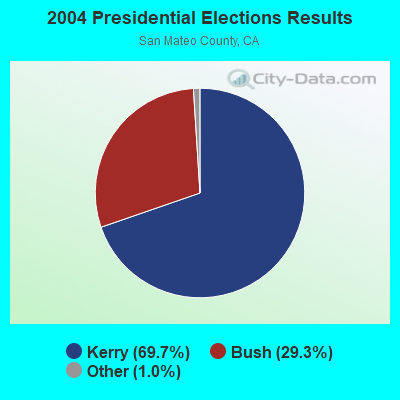

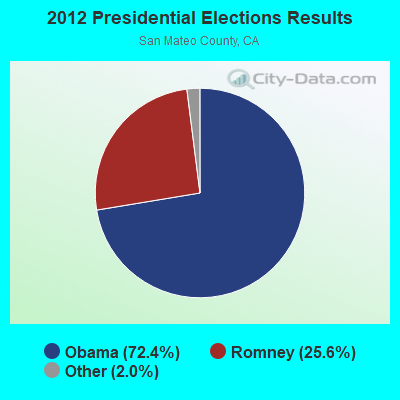
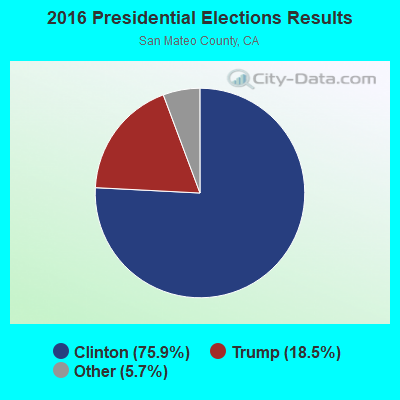
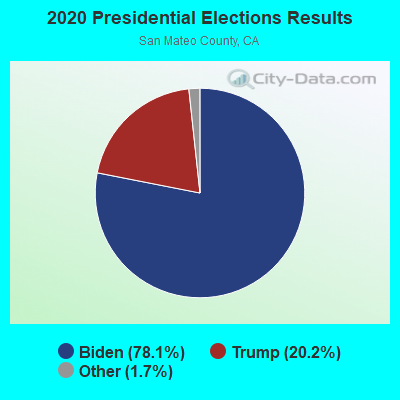
Graphs represent county-level data. Detailed 2008 Election Results
Neighborhoods in Belmont:
(Belmont, California Neighborhood Map)Religion statistics for Belmont, CA (based on San Mateo County data)
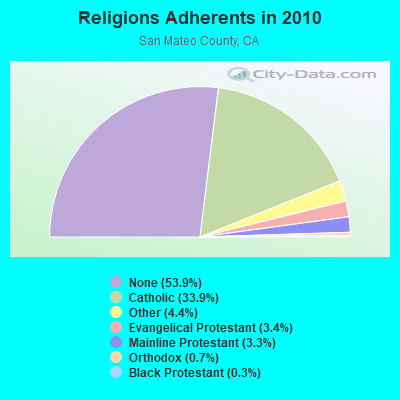
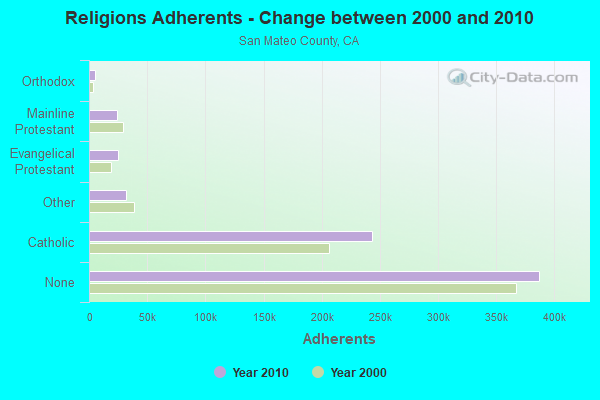
| Religion | Adherents | Congregations |
|---|---|---|
| Catholic | 243,634 | 22 |
| Other | 31,697 | 78 |
| Evangelical Protestant | 24,771 | 166 |
| Mainline Protestant | 23,840 | 74 |
| Orthodox | 5,350 | 5 |
| Black Protestant | 2,046 | 12 |
| None | 387,113 | - |
Food Environment Statistics:
| San Mateo County: | 2.44 / 10,000 pop. |
| California: | 2.14 / 10,000 pop. |
| This county: | 0.06 / 10,000 pop. |
| State: | 0.04 / 10,000 pop. |
| San Mateo County: | 0.56 / 10,000 pop. |
| California: | 0.62 / 10,000 pop. |
| This county: | 1.62 / 10,000 pop. |
| State: | 1.49 / 10,000 pop. |
| San Mateo County: | 10.02 / 10,000 pop. |
| State: | 7.42 / 10,000 pop. |
| Here: | 7.1% |
| California: | 7.3% |
| San Mateo County: | 16.9% |
| California: | 21.3% |
| San Mateo County: | 18.0% |
| State: | 17.9% |
Health and Nutrition:
| Belmont: | 54.7% |
| California: | 49.4% |
| Here: | 53.1% |
| California: | 48.0% |
| This city: | 27.5 |
| California: | 28.1 |
| Here: | 18.5% |
| California: | 20.2% |
| Belmont: | 10.6% |
| California: | 11.2% |
| Belmont: | 6.9 |
| California: | 6.8 |
| Belmont: | 31.3% |
| State: | 31.5% |
| Belmont: | 60.4% |
| California: | 56.4% |
| Belmont: | 81.2% |
| California: | 80.9% |
More about Health and Nutrition of Belmont, CA Residents
| Local government employment and payroll (March 2022) | |||||
| Function | Full-time employees | Monthly full-time payroll | Average yearly full-time wage | Part-time employees | Monthly part-time payroll |
|---|---|---|---|---|---|
| Parks and Recreation | 44 | $262,092 | $71,480 | 0 | $0 |
| Police Protection - Officers | 34 | $455,452 | $160,748 | 0 | $0 |
| Streets and Highways | 18 | $182,706 | $121,804 | 0 | $0 |
| Other Government Administration | 18 | $144,406 | $96,271 | 0 | $0 |
| Police - Other | 14 | $122,360 | $104,880 | 2 | $1,774 |
| Sewerage | 13 | $121,372 | $112,036 | 0 | $0 |
| Housing and Community Development (Local) | 10 | $104,208 | $125,050 | 0 | $0 |
| Financial Administration | 8 | $68,468 | $102,702 | 2 | $987 |
| Solid Waste Management | 1 | $10,112 | $121,344 | 0 | $0 |
| Judicial and Legal | 1 | $21,542 | $258,504 | 0 | $0 |
| Totals for Government | 161 | $1,492,718 | $111,258 | 4 | $2,761 |
Belmont government finances - Expenditure in 2021 (per resident):
- Construction - Sewerage: $10,282,000 ($384.04)
Parks and Recreation: $7,327,000 ($273.67)
Regular Highways: $5,302,000 ($198.04)
General Public Buildings: $210,000 ($7.84)
General - Other: $202,000 ($7.54)
Housing and Community Development: $11,000 ($0.41)
- Current Operations - Police Protection: $25,665,000 ($958.62)
Central Staff Services: $11,043,000 ($412.47)
Sewerage: $9,552,000 ($356.78)
Parks and Recreation: $5,036,000 ($188.10)
Financial Administration: $2,807,000 ($104.84)
Regular Highways: $2,362,000 ($88.22)
Housing and Community Development: $1,216,000 ($45.42)
Judicial and Legal Services: $832,000 ($31.08)
Solid Waste Management: $453,000 ($16.92)
Libraries: $378,000 ($14.12)
General - Other: $254,000 ($9.49)
Local Fire Protection: $154,000 ($5.75)
- General - Interest on Debt: $6,233,000 ($232.81)
- Other Capital Outlay - General - Other: $291,000 ($10.87)
Belmont government finances - Revenue in 2021 (per resident):
- Charges - Sewerage: $20,424,000 ($762.86)
Other: $14,267,000 ($532.89)
Parks and Recreation: $2,133,000 ($79.67)
Solid Waste Management: $490,000 ($18.30)
Housing and Community Development: $45,000 ($1.68)
- Federal Intergovernmental - Other: $80,000 ($2.99)
- Local Intergovernmental - Highways: $629,000 ($23.49)
Other: $70,000 ($2.61)
- Miscellaneous - Donations From Private Sources: $1,248,000 ($46.61)
General Revenue - Other: $1,126,000 ($42.06)
Rents: $811,000 ($30.29)
Interest Earnings: $421,000 ($15.72)
Fines and Forfeits: $170,000 ($6.35)
- State Intergovernmental - Other: $1,978,000 ($73.88)
Highways: $1,130,000 ($42.21)
General Local Government Support: $65,000 ($2.43)
- Tax - Property: $33,267,000 ($1242.56)
General Sales and Gross Receipts: $7,240,000 ($270.42)
Other License: $2,294,000 ($85.68)
Other: $1,499,000 ($55.99)
Public Utilities Sales: $1,373,000 ($51.28)
Other Selective Sales: $1,321,000 ($49.34)
Occupation and Business License - Other: $1,296,000 ($48.41)
Documentary and Stock Transfer: $355,000 ($13.26)
Belmont government finances - Debt in 2021 (per resident):
- Long Term Debt - Beginning Outstanding - Unspecified Public Purpose: $164,297,000 ($6136.67)
Outstanding Unspecified Public Purpose: $160,864,000 ($6008.44)
Retired Unspecified Public Purpose: $3,433,000 ($128.23)
Belmont government finances - Cash and Securities in 2021 (per resident):
- Bond Funds - Cash and Securities: $6,592,000 ($246.22)
- Other Funds - Cash and Securities: $59,665,000 ($2228.55)
- Sinking Funds - Cash and Securities: $1,049,000 ($39.18)
6.99% of this county's 2021 resident taxpayers lived in other counties in 2020 ($178,839 average adjusted gross income)
| Here: | 6.99% |
| California average: | 5.19% |
0.01% of residents moved from foreign countries ($58 average AGI)
San Mateo County: 0.01% California average: 0.03%
Top counties from which taxpayers relocated into this county between 2020 and 2021:
| from San Francisco County, CA | |
| from Santa Clara County, CA | |
| from Alameda County, CA |
9.90% of this county's 2020 resident taxpayers moved to other counties in 2021 ($222,747 average adjusted gross income)
| Here: | 9.90% |
| California average: | 6.14% |
0.01% of residents moved to foreign countries ($372 average AGI)
San Mateo County: 0.01% California average: 0.02%
Top counties to which taxpayers relocated from this county between 2020 and 2021:
| to Santa Clara County, CA | |
| to San Francisco County, CA | |
| to Alameda County, CA |
| Businesses in Belmont, CA | ||||
| Name | Count | Name | Count | |
|---|---|---|---|---|
| 7-Eleven | 1 | McDonald's | 1 | |
| AT&T | 1 | Motel 6 | 1 | |
| Ace Hardware | 1 | Quiznos | 1 | |
| Baskin-Robbins | 1 | RadioShack | 1 | |
| Blockbuster | 1 | Safeway | 2 | |
| Domino's Pizza | 1 | Starbucks | 3 | |
| Extended Stay America | 1 | Subway | 2 | |
| FedEx | 1 | T-Mobile | 1 | |
| GameStop | 1 | U-Haul | 1 | |
| Goodwill | 1 | UPS | 2 | |
| Holiday Inn | 1 | Vons | 2 | |
| Hyatt | 1 | Walgreens | 1 | |
| IHOP | 1 | Wendy's | 1 | |
| Jamba Juice | 1 | |||
Strongest AM radio stations in Belmont:
- KYCY (1550 AM; 50 kW; SAN FRANCISCO, CA; Owner: INFINITY BROADCASTING OPERATIONS, INC.)
- KNBR (680 AM; 50 kW; SAN FRANCISCO, CA; Owner: KNBR LICO, INC.)
- KGO (810 AM; 50 kW; SAN FRANCISCO, CA; Owner: KGO-AM RADIO, INC.)
- KTCT (1050 AM; 50 kW; SAN MATEO, CA; Owner: SUSQUEHANNA RADIO CORP.)
- KFAX (1100 AM; 50 kW; SAN FRANCISCO, CA; Owner: GOLDEN GATE BROADCASTING CO, INC.)
- KTRB (860 AM; 50 kW; MODESTO, CA; Owner: PAPPAS RADIO OF CALIFORNIA, A CALIFORNIA LIMITED PARTNERSHIP)
- KIQI (1010 AM; 35 kW; SAN FRANCISCO, CA; Owner: RADIO UNICA OF SAN FRANCISCO LICENSE CORP.)
- KSFB (1220 AM; 5 kW; PALO ALTO, CA; Owner: SCA-PALO ALTO, LLC)
- KLOK (1170 AM; 50 kW; SAN JOSE, CA; Owner: ENTRAVISION HOLDINGS, LLC)
- KCBS (740 AM; 50 kW; SAN FRANCISCO, CA; Owner: INFINITY BROADCASTING OPERATIONS, INC.)
- KNEW (910 AM; 20 kW; OAKLAND, CA; Owner: AMFM RADIO LICENSES, L.L.C.)
- KSFO (560 AM; 5 kW; SAN FRANCISCO, CA; Owner: KGO-AM RADIO, INC.)
- KOIT (1260 AM; 5 kW; SAN FRANCISCO, CA; Owner: BONNEVILLE HOLDING COMPANY)
Strongest FM radio stations in Belmont:
- KCSM (91.1 FM; SAN MATEO, CA; Owner: SAN MATEO COUNTY COMMUNITY COLLEGE)
- KFJC (89.7 FM; LOS ALTOS, CA; Owner: FOOTHILL-DE ANZA COMM. COLLEGE DIST.)
- KFRC-FM (99.7 FM; SAN FRANCISCO, CA; Owner: INFINITY KFRC-FM, INC.)
- KYLD (94.9 FM; SAN FRANCISCO, CA; Owner: AMFM RADIO LICENSES, L.L.C.)
- KBLX-FM (102.9 FM; BERKELEY, CA; Owner: ICBC BROADCAST HOLDINGS - CA, INC.)
- KZBR (95.7 FM; SAN FRANCISCO, CA; Owner: BONNEVILLE HOLDING COMPANY)
- KMEL (106.1 FM; SAN FRANCISCO, CA; Owner: AMFM RADIO LICENSES, L.L.C.)
- KSAN (107.7 FM; SAN MATEO, CA; Owner: SUSQUEHANNA RADIO CORP.)
- KQED-FM (88.5 FM; SAN FRANCISCO, CA; Owner: KQED, INC.)
- KITS (105.3 FM; SAN FRANCISCO, CA; Owner: INFINITY BROADCASTING OPERATIONS, INC.)
- KIOI (101.3 FM; SAN FRANCISCO, CA; Owner: AMFM RADIO LICENSES, L.L.C.)
- KOIT-FM (96.5 FM; SAN FRANCISCO, CA; Owner: BONNEVILLE HOLDING COMPANY)
- KKSF-FM1 (103.7 FM; PLEASANTON, ETC., CA; Owner: AMFM RADIO LICENSES, L.L.C.)
- KKSF (103.7 FM; SAN FRANCISCO, CA; Owner: AMFM RADIO LICENSES, L.L.C.)
- KFOG (104.5 FM; SAN FRANCISCO, CA; Owner: KFFG LICO, INC)
- KFRC-FM3 (99.7 FM; WALNUT CREEK, CA; Owner: INFINITY KFRC-FM, INC.)
- KZBR-FM1 (95.7 FM; WALNUT CREEK, CA; Owner: BONNEVILLE HOLDING COMPANY)
- KBLX-FM2 (102.9 FM; PLEASANTON, CA; Owner: ICBC BROADCAST HOLDINGS -CA, INC.)
- KSOL-FM3 (98.9 FM; PLEASANTON, CA; Owner: TMS LICENSE CALIFORNIA, INC)
- KISQ-FM3 (98.1 FM; CONCORD, CA; Owner: AMFM RADIO LICENSES, L.L.C.)
TV broadcast stations around Belmont:
- KQED (Channel 9; SAN FRANCISCO, CA; Owner: KQED, INC.)
- KGO-TV (Channel 7; SAN FRANCISCO, CA; Owner: KGO TELEVISION, INC.)
- KPIX-TV (Channel 5; SAN FRANCISCO, CA; Owner: CBS BROADCASTING INC.)
- KTVU (Channel 2; OAKLAND, CA; Owner: KTVU PARTNERSHIP)
- KCSM-TV (Channel 60; SAN MATEO, CA; Owner: SAN MATEO COUNTY COMMUNITY COLLEGE DISTRICT)
- KRON-TV (Channel 4; SAN FRANCISCO, CA; Owner: YOUNG BROADCASTING OF SAN FRANCISCO, INC.)
- KMTP-TV (Channel 32; SAN FRANCISCO, CA; Owner: MINORITY TELEVISION PROJECT)
- KBHK-TV (Channel 44; SAN FRANCISCO, CA; Owner: VIACOM TELEVISION STATIONS GROUP OF SAN FRANCISCO INC.)
- KBWB (Channel 20; SAN FRANCISCO, CA; Owner: KBWB LICENSE, INC.)
- KFSF (Channel 66; VALLEJO, CA; Owner: TELEFUTURA SAN FRANCISCO LLC)
- KCNS (Channel 38; SAN FRANCISCO, CA; Owner: WRAY, INC.)
- KBIT-CA (Channel 28; SAN FRANCISCO, ETC., CA; Owner: POLAR BROADCASTING, INC.)
- KICU-TV (Channel 36; SAN JOSE, CA; Owner: KTVU PARTNERSHIP)
- KTEH (Channel 54; SAN JOSE, CA; Owner: KTEH FOUNDATION)
- KTSF (Channel 26; SAN FRANCISCO, CA; Owner: LINCOLN BROADCASTING COMPANY, A CALIFORNIA LP)
- KDTV (Channel 14; SAN FRANCISCO, CA; Owner: KDTV LICENSE PARTNERSHIP, G.P.)
- KSTS (Channel 48; SAN JOSE, CA; Owner: TELEMUNDO OF NORTHERN CALIFORNIA LICENSE CORP.)
- National Bridge Inventory (NBI) Statistics
- 6Number of bridges
- 49ft / 15.2mTotal length
- 770,234Total average daily traffic
- 31,349Total average daily truck traffic
FCC Registered Commercial Land Mobile Towers: 2 (See the full list of FCC Registered Commercial Land Mobile Towers in Belmont, CA)
FCC Registered Private Land Mobile Towers: 4 (See the full list of FCC Registered Private Land Mobile Towers)
FCC Registered Broadcast Land Mobile Towers: 13 (See the full list of FCC Registered Broadcast Land Mobile Towers)
FCC Registered Microwave Towers: 12 (See the full list of FCC Registered Microwave Towers in this town)
FCC Registered Paging Towers: 2 (See the full list of FCC Registered Paging Towers)
FCC Registered Amateur Radio Licenses: 389 (See the full list of FCC Registered Amateur Radio Licenses in Belmont)
FAA Registered Aircraft: 45 (See the full list of FAA Registered Aircraft in Belmont)
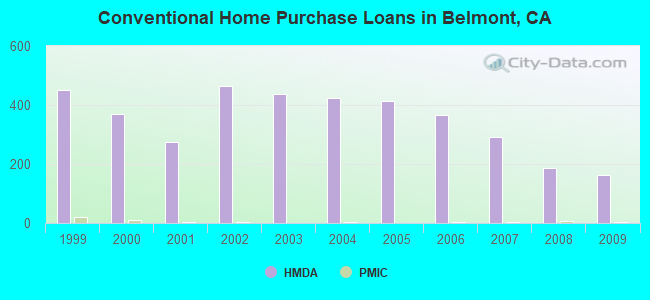
| Home Mortgage Disclosure Act Aggregated Statistics For Year 2009 (Based on 4 full and 1 partial tracts) | ||||||||||||
| A) FHA, FSA/RHS & VA Home Purchase Loans | B) Conventional Home Purchase Loans | C) Refinancings | D) Home Improvement Loans | E) Loans on Dwellings For 5+ Families | F) Non-occupant Loans on < 5 Family Dwellings (A B C & D) | |||||||
|---|---|---|---|---|---|---|---|---|---|---|---|---|
| Number | Average Value | Number | Average Value | Number | Average Value | Number | Average Value | Number | Average Value | Number | Average Value | |
| LOANS ORIGINATED | 22 | $639,121 | 162 | $584,778 | 1,228 | $427,462 | 44 | $297,567 | 3 | $494,413 | 31 | $323,799 |
| APPLICATIONS APPROVED, NOT ACCEPTED | 0 | $0 | 27 | $559,544 | 113 | $472,973 | 3 | $161,230 | 1 | $540,000 | 2 | $353,615 |
| APPLICATIONS DENIED | 1 | $425,200 | 14 | $645,279 | 197 | $509,741 | 8 | $260,685 | 0 | $0 | 6 | $329,128 |
| APPLICATIONS WITHDRAWN | 5 | $541,000 | 24 | $544,592 | 131 | $482,130 | 9 | $150,363 | 0 | $0 | 2 | $380,345 |
| FILES CLOSED FOR INCOMPLETENESS | 0 | $0 | 1 | $451,230 | 39 | $449,936 | 7 | $107,376 | 0 | $0 | 0 | $0 |
Detailed HMDA statistics for the following Tracts: 6086.00 , 6087.00, 6088.00, 6089.00, 6090.00
| Private Mortgage Insurance Companies Aggregated Statistics For Year 2009 (Based on 3 full tracts) | ||||
| A) Conventional Home Purchase Loans | B) Refinancings | |||
|---|---|---|---|---|
| Number | Average Value | Number | Average Value | |
| LOANS ORIGINATED | 3 | $606,550 | 2 | $614,820 |
| APPLICATIONS APPROVED, NOT ACCEPTED | 1 | $665,000 | 0 | $0 |
| APPLICATIONS DENIED | 0 | $0 | 2 | $625,500 |
| APPLICATIONS WITHDRAWN | 0 | $0 | 1 | $622,000 |
| FILES CLOSED FOR INCOMPLETENESS | 1 | $590,650 | 0 | $0 |
Detailed PMIC statistics for the following Tracts: 6086.00 , 6087.00, 6088.00, 6089.00, 6090.00

2005 - 2018 National Fire Incident Reporting System (NFIRS) incidents
- Fire incident types reported to NFIRS in Belmont, CA
- 36452.8%Structure Fires
- 13519.6%Outside Fires
- 11016.0%Other
- 8011.6%Mobile Property/Vehicle Fires
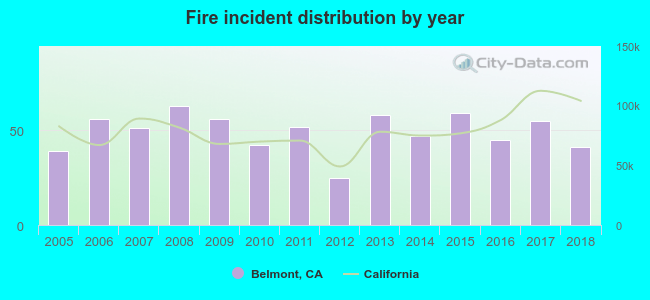 Based on the data from the years 2005 - 2018 the average number of fire incidents per year is 49. The highest number of reported fires - 63 took place in 2008, and the least - 25 in 2012. The data has a rising trend.
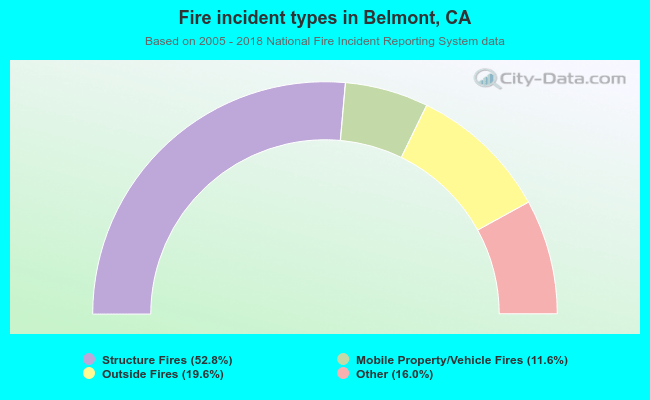 When looking into fire subcategories, the most reports belonged to: Structure Fires (52.8%), and Outside Fires (19.6%).
Fire-safe hotels and motels in Belmont, California:
- Motel 6, 1101 Shoreway Rd, Belmont, California 94002 , Phone: (650) 591-1471, Fax: (650) 593-6415
- Summerfield Suites By Wyndham-belmont, 400 Concourse Dr, Belmont, California 94002 , Phone: (800) 996-3426, Fax: (650) 592-8900
- Extended Stay America - San Francisco - Belmont, 120 Sem Ln, Belmont, California 94002 , Phone: (650) 654-0344, Fax: (650) 654-1339
- SpringHill Suites by Marriott Belmont/Redwood Shores, 1401 Shoreway Rd, Belmont, California 94002 , Phone: (800) 627-7468, Fax: (650) 622-9005
- Homewood Suites by Hilton Belmont, 1201 Shoreway Rd, Belmont, California 94002 , Phone: (650) 597-2000, Fax: (650) 597-3000
| Most common first names in Belmont, CA among deceased individuals | ||
| Name | Count | Lived (average) |
|---|---|---|
| John | 135 | 71.9 years |
| Mary | 133 | 80.9 years |
| William | 110 | 73.4 years |
| James | 87 | 73.1 years |
| Robert | 87 | 71.1 years |
| George | 77 | 76.0 years |
| Charles | 59 | 75.5 years |
| Helen | 59 | 81.8 years |
| Dorothy | 59 | 76.8 years |
| Joseph | 57 | 74.8 years |
| Most common last names in Belmont, CA among deceased individuals | ||
| Last name | Count | Lived (average) |
|---|---|---|
| Johnson | 32 | 77.1 years |
| Smith | 27 | 75.9 years |
| Miller | 22 | 85.4 years |
| Brown | 21 | 74.7 years |
| Davis | 17 | 68.3 years |
| Lee | 16 | 74.8 years |
| Jones | 16 | 70.5 years |
| Williams | 15 | 75.1 years |
| Allen | 15 | 82.3 years |
| Thompson | 14 | 78.9 years |
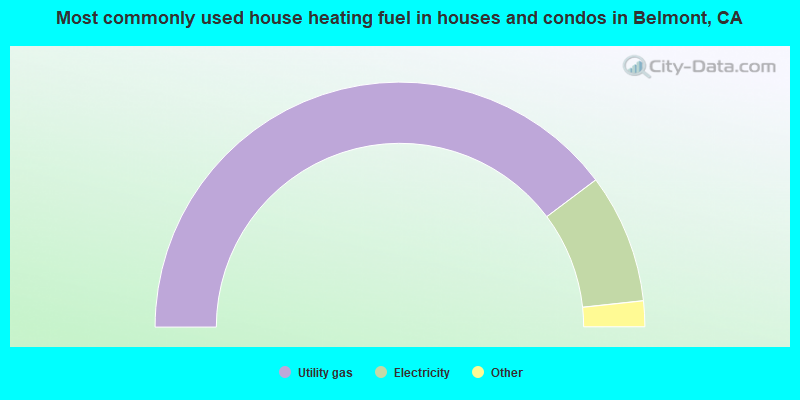
- 79.5%Utility gas
- 17.1%Electricity
- 1.9%Bottled, tank, or LP gas
- 0.7%Wood
- 0.6%Solar energy
- 0.2%No fuel used
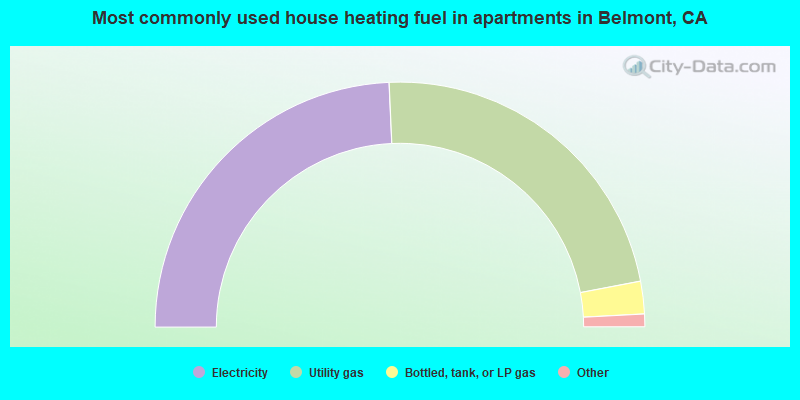
- 48.6%Electricity
- 45.4%Utility gas
- 4.3%Bottled, tank, or LP gas
- 1.4%No fuel used
- 0.3%Other fuel
Belmont compared to California state average:
- Median household income above state average.
- Median house value significantly above state average.
- Unemployed percentage significantly below state average.
- Black race population percentage significantly below state average.
- Hispanic race population percentage below state average.
- Median age significantly above state average.
- Length of stay since moving in significantly above state average.
- Percentage of population with a bachelor's degree or higher significantly above state average.
Belmont on our top lists:
- #44 on the list of "Top 101 cities with the most residents born in Hong Kong (population 500+)"
- #60 on the list of "Top 101 cities with the most residents born in Other Eastern Asia (population 500+)"
- #72 on the list of "Top 101 cities with largest percentage of females in industries: information (population 5,000+)"
- #73 on the list of "Top 100 cities with highest median house value (pop. 5,000+)"
- #82 on the list of "Top 101 cities with largest percentage of females in occupations: architecture and engineering occupations (population 5,000+)"
- #87 on the list of "Top 101 cities with the largest percentage of high school students in private schools (500+ students)"
- #6 on the list of "Top 101 counties with the highest percentage of residents that exercised in the past month"
- #8 on the list of "Top 101 counties with the highest percentage of residents that drank alcohol in the past 30 days"
- #9 on the list of "Top 101 counties with the lowest Ozone (1-hour) air pollution readings in 2012 (ppm)"
- #10 on the list of "Top 101 counties with the highest carbon monoxide air pollution readings in 2012 (ppm)"
- #11 on the list of "Top 101 counties with the lowest average weight of females"

|
|
Total of 4976 patent applications in 2008-2024.