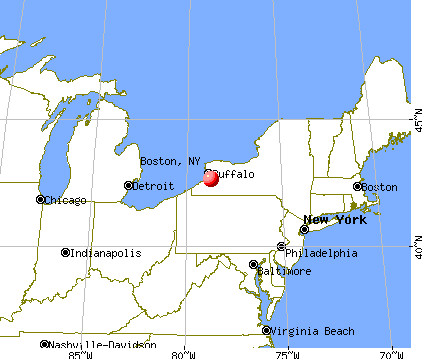
Boston, New York
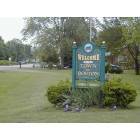
Boston: Entering Boston NY

Boston: Boston Deli

Boston: Boston Place Falls
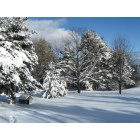
Boston: My front yard
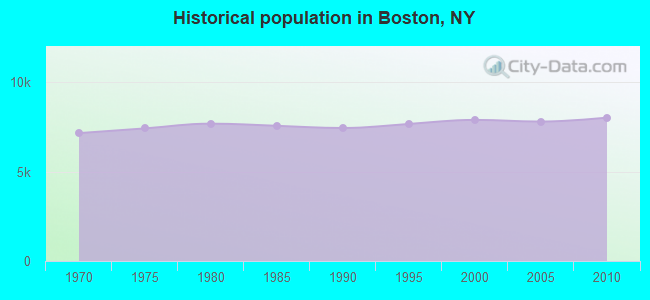
Boston
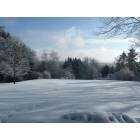
Boston: Just in case you miss the snow
Boston: Landmark "The Fridge"

Boston: tumhari maa ke choot
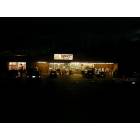
Boston: Boston Market (B-Kwik)
- add
your
Submit your own pictures of this town and show them to the world
- OSM Map
- General Map
- Google Map
- MSN Map
Population change since 2000: +1.6%
 |
| Males: 4,031 | |
| Females: 3,992 |
| Median resident age: | 44.3 years |
| New York median age: | 40.7 years |
Zip codes: 14025.
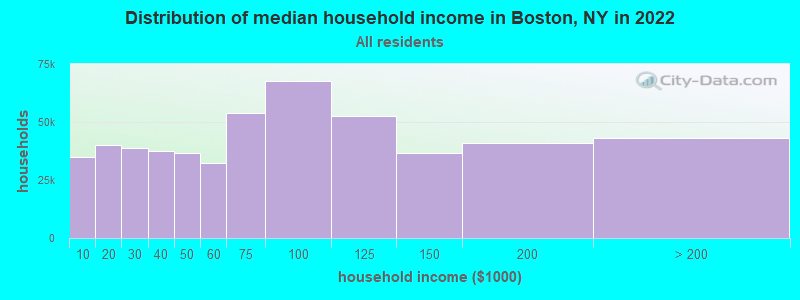
| Boston: | $87,748 |
| NY: | $79,557 |
Estimated per capita income in 2022: $42,766 (it was $21,303 in 2000)
Boston town income, earnings, and wages data
Estimated median house or condo value in 2022: $279,570 (it was $109,300 in 2000)
| Boston: | $279,570 |
| NY: | $400,400 |
Mean prices in 2022: all housing units: $244,055; detached houses: $258,042; townhouses or other attached units: $217,708; in 2-unit structures: $199,670; in 3-to-4-unit structures: $213,644; in 5-or-more-unit structures: $334,912; mobile homes: $67,367; occupied boats, rvs, vans, etc.: $89,496
Detailed information about poverty and poor residents in Boston, NY


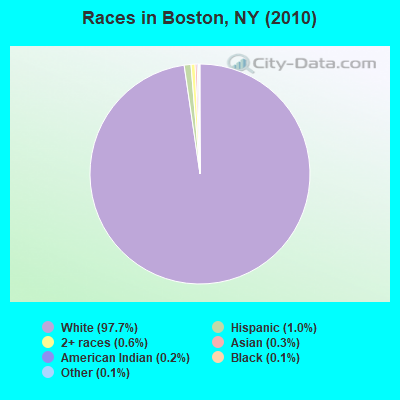
- 7,83597.7%White alone
- 781.0%Hispanic
- 460.6%Two or more races
- 250.3%Asian alone
- 180.2%American Indian alone
- 100.1%Black alone
- 90.1%Other race alone
- 20.02%Native Hawaiian and Other
Pacific Islander alone
Races in Boston detailed stats: ancestries, foreign born residents, place of birth
According to our research of New York and other state lists, there were 2 registered sex offenders living in Boston, New York as of April 25, 2024.
The ratio of all residents to sex offenders in Boston is 4,012 to 1.
The ratio of registered sex offenders to all residents in this city is much lower than the state average.
 Recent articles from our blog. Our writers, many of them Ph.D. graduates or candidates, create easy-to-read articles on a wide variety of topics.

 | A New 200 MPH Train Could Soon Connect NYC, Long Island & Boston (55 replies) |
| moving to Albany Area from Boston (10 replies) |
| Moving to Upstate NY from Boston (4 replies) |
| More than 60,000 Rent-Stabilized Apartments are Now Vacant (305 replies) |
| Commuting from LI to Boston and back (28 replies) |
| Do you ever visit Boston and NYC? (2 replies) |
Latest news from Boston, NY collected exclusively by city-data.com from local newspapers, TV, and radio stations
Ancestries: German (41.3%), Irish (23.3%), Polish (22.7%), English (13.0%), Italian (9.9%), French (4.0%).
Current Local Time: EST time zone
Incorporated in 1817
Land area: 35.8 square miles.
Population density: 224 people per square mile (very low).
249 residents are foreign born (1.7% Europe, 0.7% North America, 0.5% Asia).
| This town: | 3.2% |
| New York: | 20.4% |
| Boston town: | 2.7% ($2,928) |
| New York: | 1.9% ($2,847) |
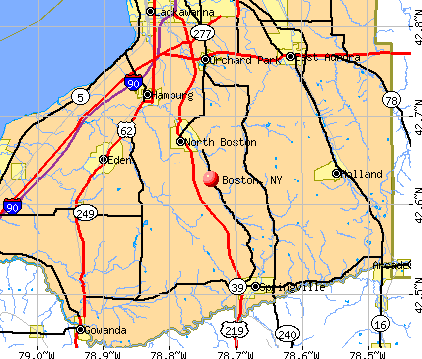
Nearest city with pop. 50,000+: Cheektowaga, NY  (17.6 miles , pop. 79,988).
Nearest city with pop. 200,000+: Buffalo, NY (17.6 miles , pop. 292,648).
Nearest city with pop. 1,000,000+: Philadelphia, PA (262.9 miles , pop. 1,517,550).
Nearest cities:
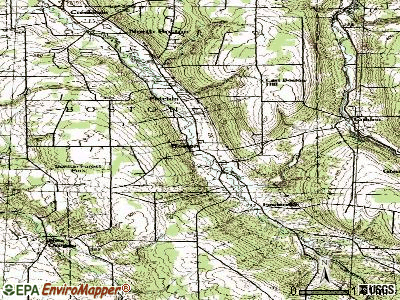
), ), ), ), Latitude: 42.66 N, Longitude: 78.76 W
Area code: 716

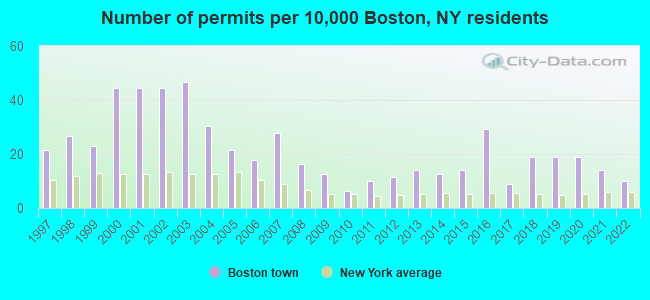
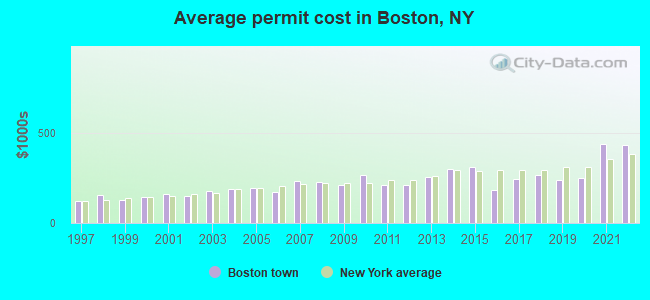
Single-family new house construction building permits:
- 2022: 8 buildings, average cost: $434,900
- 2021: 11 buildings, average cost: $438,300
- 2020: 15 buildings, average cost: $252,100
- 2019: 15 buildings, average cost: $240,000
- 2018: 15 buildings, average cost: $264,700
- 2017: 7 buildings, average cost: $246,300
- 2016: 23 buildings, average cost: $181,900
- 2015: 11 buildings, average cost: $311,500
- 2014: 10 buildings, average cost: $298,500
- 2013: 11 buildings, average cost: $253,500
- 2012: 9 buildings, average cost: $214,100
- 2011: 8 buildings, average cost: $214,100
- 2010: 5 buildings, average cost: $265,400
- 2009: 10 buildings, average cost: $210,500
- 2008: 13 buildings, average cost: $229,400
- 2007: 22 buildings, average cost: $234,300
- 2006: 14 buildings, average cost: $172,100
- 2005: 17 buildings, average cost: $193,800
- 2004: 24 buildings, average cost: $189,700
- 2003: 37 buildings, average cost: $179,200
- 2002: 35 buildings, average cost: $149,500
- 2001: 35 buildings, average cost: $160,500
- 2000: 35 buildings, average cost: $142,900
- 1999: 18 buildings, average cost: $129,900
- 1998: 21 buildings, average cost: $156,000
- 1997: 17 buildings, average cost: $119,600
| Here: | 4.4% |
| New York: | 4.4% |
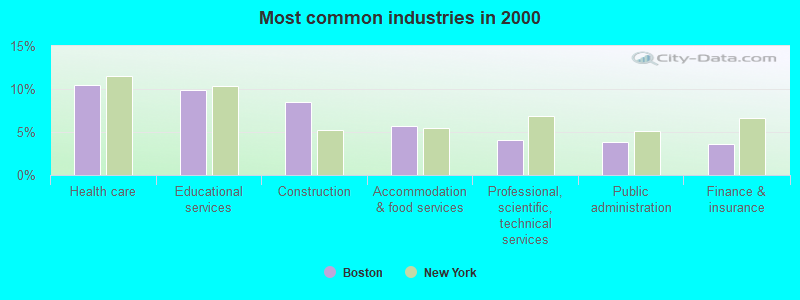
- Health care (10.4%)
- Educational services (9.9%)
- Construction (8.5%)
- Accommodation & food services (5.7%)
- Professional, scientific, technical services (4.1%)
- Public administration (3.8%)
- Finance & insurance (3.7%)
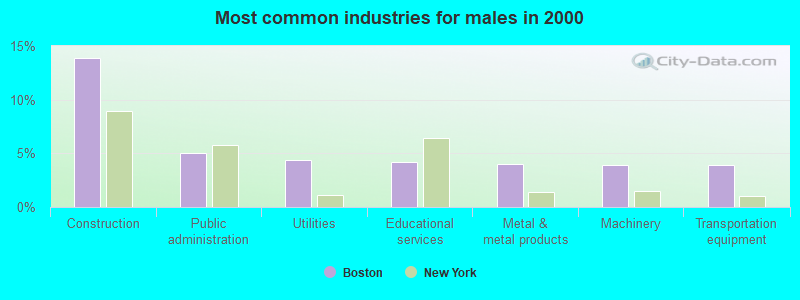
- Construction (13.9%)
- Public administration (5.0%)
- Utilities (4.4%)
- Educational services (4.2%)
- Metal & metal products (4.0%)
- Machinery (3.9%)
- Transportation equipment (3.9%)
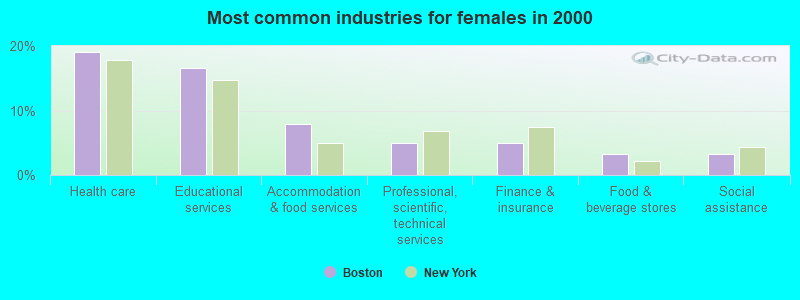
- Health care (19.1%)
- Educational services (16.6%)
- Accommodation & food services (7.8%)
- Professional, scientific, technical services (4.9%)
- Finance & insurance (4.9%)
- Food & beverage stores (3.3%)
- Social assistance (3.2%)
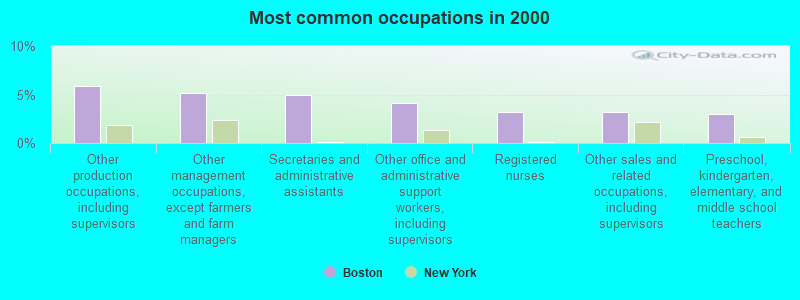
- Other production occupations, including supervisors (5.9%)
- Other management occupations, except farmers and farm managers (5.1%)
- Secretaries and administrative assistants (4.9%)
- Other office and administrative support workers, including supervisors (4.1%)
- Registered nurses (3.2%)
- Other sales and related occupations, including supervisors (3.2%)
- Preschool, kindergarten, elementary, and middle school teachers (3.0%)
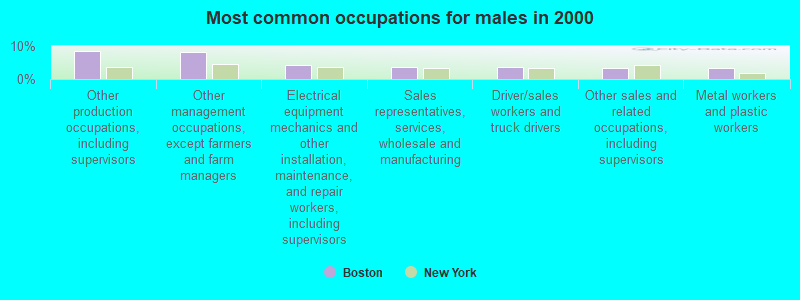
- Other production occupations, including supervisors (8.4%)
- Other management occupations, except farmers and farm managers (8.3%)
- Electrical equipment mechanics and other installation, maintenance, and repair workers, including supervisors (4.4%)
- Sales representatives, services, wholesale and manufacturing (3.8%)
- Driver/sales workers and truck drivers (3.6%)
- Other sales and related occupations, including supervisors (3.3%)
- Metal workers and plastic workers (3.2%)
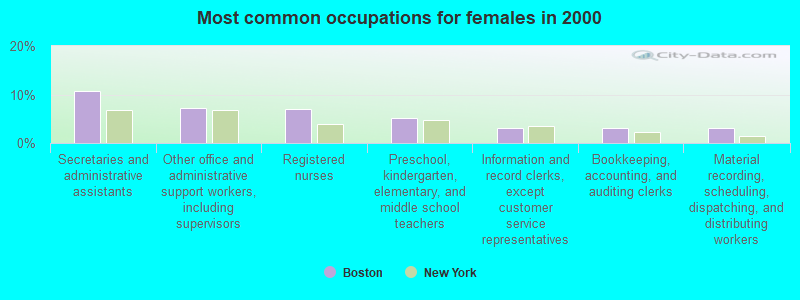
- Secretaries and administrative assistants (10.8%)
- Other office and administrative support workers, including supervisors (7.2%)
- Registered nurses (7.1%)
- Preschool, kindergarten, elementary, and middle school teachers (5.2%)
- Information and record clerks, except customer service representatives (3.2%)
- Bookkeeping, accounting, and auditing clerks (3.2%)
- Material recording, scheduling, dispatching, and distributing workers (3.1%)
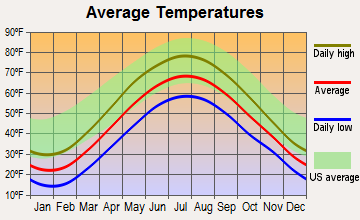
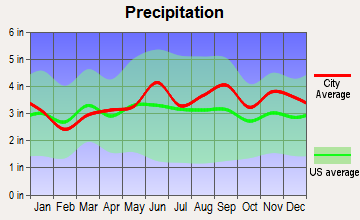
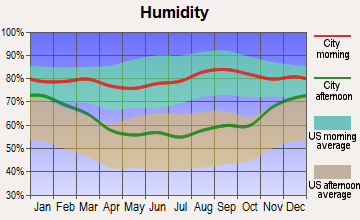
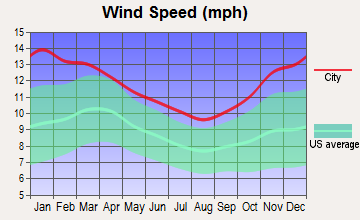
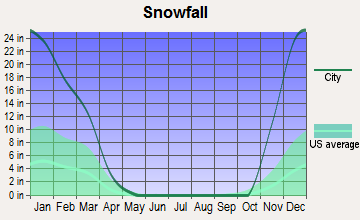
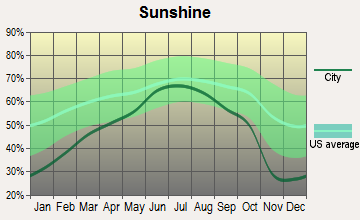
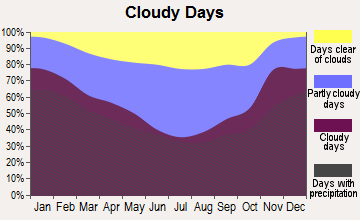
Average climate in Boston, New York
Based on data reported by over 4,000 weather stations
(lower is better)
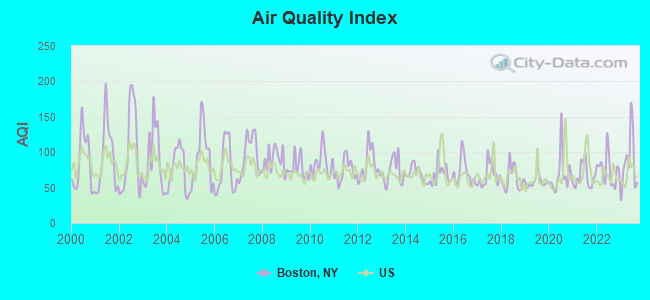
Air Quality Index (AQI) level in 2023 was 86.0. This is about average.
| City: | 86.0 |
| U.S.: | 72.6 |
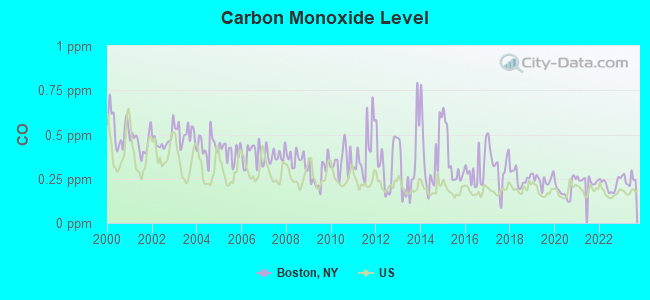
Carbon Monoxide (CO) [ppm] level in 2023 was 0.248. This is about average. Closest monitor was 15.3 miles away from the city center.
| City: | 0.248 |
| U.S.: | 0.251 |
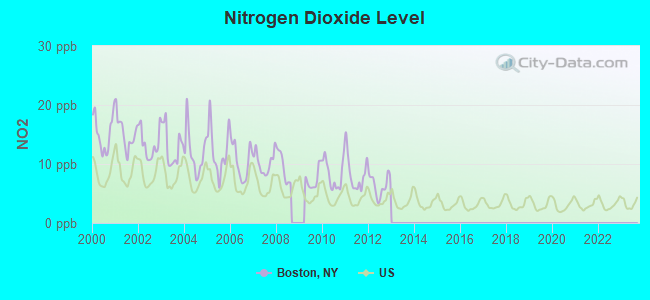
Nitrogen Dioxide (NO2) [ppb] level in 2012 was 6.43. This is worse than average. Closest monitor was 15.3 miles away from the city center.
| City: | 6.43 |
| U.S.: | 5.11 |
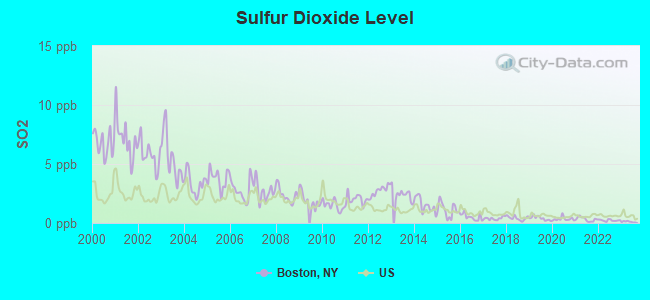
Sulfur Dioxide (SO2) [ppb] level in 2023 was 0.107. This is significantly better than average. Closest monitor was 11.6 miles away from the city center.
| City: | 0.107 |
| U.S.: | 1.515 |
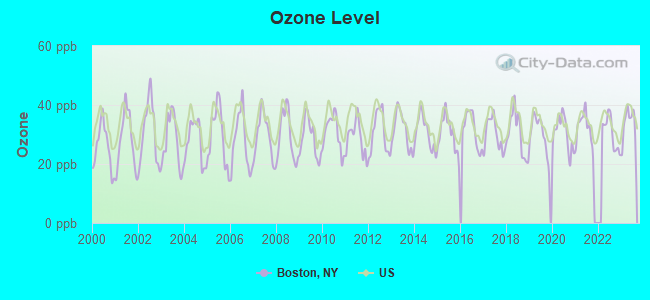
Ozone [ppb] level in 2023 was 33.8. This is about average. Closest monitor was 11.8 miles away from the city center.
| City: | 33.8 |
| U.S.: | 33.3 |
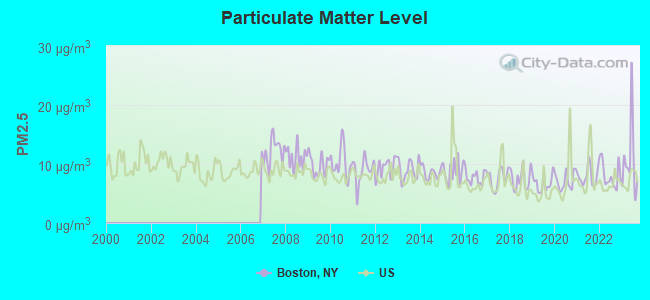
Particulate Matter (PM2.5) [µg/m3] level in 2023 was 10.6. This is worse than average. Closest monitor was 12.5 miles away from the city center.
| City: | 10.6 |
| U.S.: | 8.1 |
Tornado activity:
Boston-area historical tornado activity is near New York state average. It is 65% smaller than the overall U.S. average.
On 8/19/1970, a category F3 (max. wind speeds 158-206 mph) tornado 3.1 miles away from the Boston town center injured 3 people and caused between $50,000 and $500,000 in damages.
On 7/24/1967, a category F3 tornado 17.1 miles away from the town center caused between $5000 and $50,000 in damages.
Earthquake activity:
Boston-area historical earthquake activity is significantly above New York state average. It is 66% smaller than the overall U.S. average.On 9/25/1998 at 19:52:52, a magnitude 5.2 (4.8 MB, 4.3 MS, 5.2 LG, 4.5 MW, Depth: 3.1 mi, Class: Moderate, Intensity: VI - VII) earthquake occurred 116.4 miles away from Boston center
On 1/31/1986 at 16:46:43, a magnitude 5.0 (5.0 MB) earthquake occurred 143.1 miles away from the city center
On 8/23/2011 at 17:51:04, a magnitude 5.8 (5.8 MW, Depth: 3.7 mi) earthquake occurred 331.3 miles away from Boston center
On 10/7/1983 at 10:18:46, a magnitude 5.3 (5.1 MB, 5.3 LG, 5.1 ML) earthquake occurred 239.8 miles away from the city center
On 4/20/2002 at 10:50:47, a magnitude 5.3 (5.3 ML, Depth: 3.0 mi) earthquake occurred 284.2 miles away from the city center
On 4/20/2002 at 10:50:47, a magnitude 5.2 (5.2 MB, 4.2 MS, 5.2 MW, 5.0 MW) earthquake occurred 282.6 miles away from Boston center
Magnitude types: regional Lg-wave magnitude (LG), body-wave magnitude (MB), local magnitude (ML), surface-wave magnitude (MS), moment magnitude (MW)
Natural disasters:
The number of natural disasters in Erie County (22) is greater than the US average (15).Major Disasters (Presidential) Declared: 11
Emergencies Declared: 10
Causes of natural disasters: Storms: 8, Floods: 7, Snowstorms: 6, Hurricanes: 2, Snows: 2, Winter Storms: 2, Blizzard: 1, Ice Storm: 1, Power Outage: 1, Wind: 1, Other: 2 (Note: some incidents may be assigned to more than one category).
Hospitals and medical centers near Boston:
- FATHER BAKER MANOR (Nursing Home, about 6 miles away; ORCHARD PARK, NY)
- ELDERWOOD HEALTH CARE AT LAKEWOOD (Nursing Home, about 7 miles away; HAMBURG, NY)
- ABSOLUT CTR FOR NURSING AND REHAB ORCHARD PARK L L C (Nursing Home, about 7 miles away; ORCHARD PARK, NY)
- ABSOLUT CTR FOR NURSING AND REHAB EDEN L L C (Nursing Home, about 7 miles away; EDEN, NY)
- SOUTHTOWNS DIALYSIS CENTER (Dialysis Facility, about 9 miles away; HAMBURG, NY)
- ORCHARD PARK DIALYSIS CENTER (Dialysis Facility, about 9 miles away; ORCHARD PARK, NY)
- PEOPLE, INC (Hospital, about 9 miles away; ORCHARD PARK, NY)
Amtrak stations near Boston:
- 17 miles: BUFFALO-EXCHANGE STREET (BUFALO, EXCHANGE BTW ELLICOTT & WASHINGTON) . Services: ticket office, partially wheelchair accessible, enclosed waiting area, public restrooms, public payphones, vending machines, paid short-term parking, call for car rental service, call for taxi service, intercity bus service, public transit connection.
- 18 miles: BUFFALO-DEPEW (DEPEW, 55 DICK RD.) . Services: ticket office, partially wheelchair accessible, enclosed waiting area, public restrooms, public payphones, vending machines, free short-term parking, call for taxi service.
Colleges/universities with over 2000 students nearest to Boston:
- Bryant & Stratton College-Online (about 10 miles; Orchard Park, NY; Full-time enrollment: 2,212)
- Erie Community College (about 17 miles; Buffalo, NY; FT enrollment: 11,035)
- D'Youville College (about 19 miles; Buffalo, NY; FT enrollment: 2,398)
- Canisius College (about 20 miles; Buffalo, NY; FT enrollment: 4,376)
- Medaille College (about 20 miles; Buffalo, NY; FT enrollment: 2,361)
- Buffalo State SUNY (about 21 miles; Buffalo, NY; FT enrollment: 10,439)
- Daemen College (about 22 miles; Amherst, NY; FT enrollment: 2,365)
Points of interest:
Notable locations in Boston: Zittel's Dairy Farm (A), Dreams End Farm (B), Patchin Fire Company (C), Boston Fire Company (D), North Boston Fire Company (E), Patchin Volunteer Fire Company (F), Boston Free Library (G), Boston Town Hall (H). Display/hide their locations on the map
Churches in Boston include: Churchill Memorial United Methodist Church (A), Saint Martin's Lutheran Church (B), Good Shepherd Lutheran Church (C), Berean Free Presbyterian Church (D), Faith United Church of Christ (E), Saint John the Baptist Roman Catholic Church (F), Boston Church (G). Display/hide their locations on the map
Cemeteries: Saint Johns Cemetery (1), Saint Paul Cemetery (2), Cobble Hill Cemetery (3), Maple Wood Cemetery (4). Display/hide their locations on the map
Streams, rivers, and creeks: Landon Brook (A). Display/hide its location on the map
Tourist attraction: Boston Historical Society (Museums; 9410 Boston State Road) (1). Display/hide its approximate location on the map
| This town: | 2.5 people |
| New York: | 2.6 people |
| This town: | 71.7% |
| Whole state: | 63.5% |
| This town: | 5.7% |
| Whole state: | 6.8% |
Likely homosexual households (counted as self-reported same-sex unmarried-partner households)
- Lesbian couples: 0.3% of all households
- Gay men: 0.3% of all households
| This town: | 5.9% |
| Whole state: | 14.6% |
| This town: | 1.9% |
| Whole state: | 7.4% |
10 people in homes for the physically handicapped in 2000
Banks with branches in Boston (2011 data):
- Evans Bank, National Association: North Boston Branch at 7205 Boston State Road, branch established on 1975/03/17. Info updated 2009/07/27: Bank assets: $730.9 mil, Deposits: $618.8 mil, headquarters in Angola, NY, positive income, Commercial Lending Specialization, 14 total offices, Holding Company: Evans Bancorp, Inc.
For population 15 years and over in Boston:
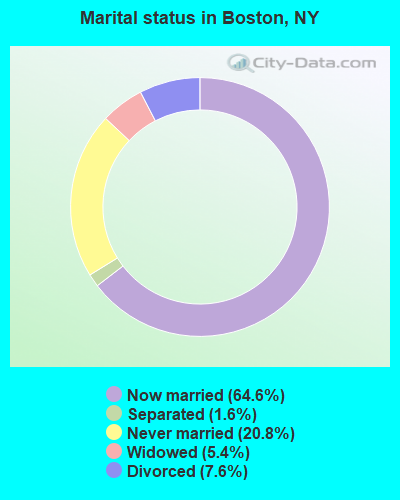
- Never married: 20.8%
- Now married: 64.6%
- Separated: 1.6%
- Widowed: 5.4%
- Divorced: 7.6%
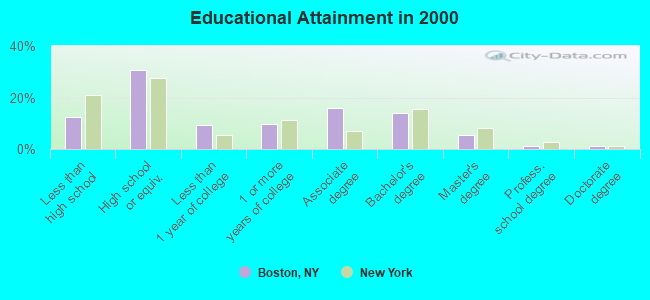
For population 25 years and over in Boston:
- High school or higher: 87.4%
- Bachelor's degree or higher: 21.9%
- Graduate or professional degree: 8.0%
- Unemployed: 4.7%
- Mean travel time to work (commute): 26.2 minutes
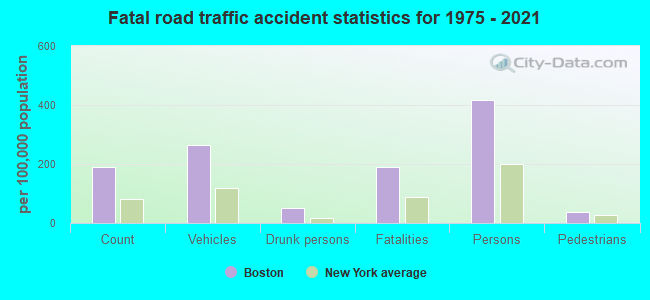
| Here: | 10.3 |
| New York average: | 14.2 |
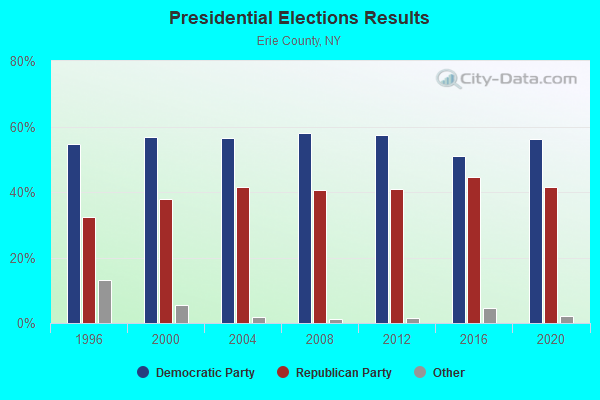
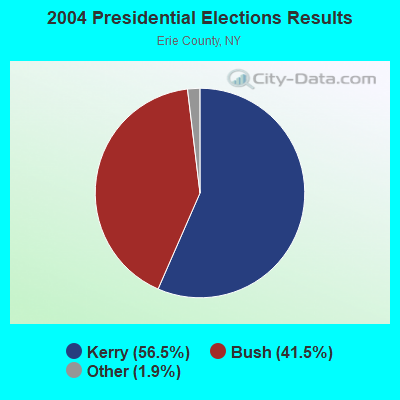
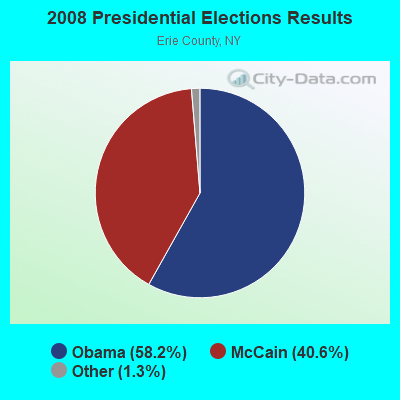
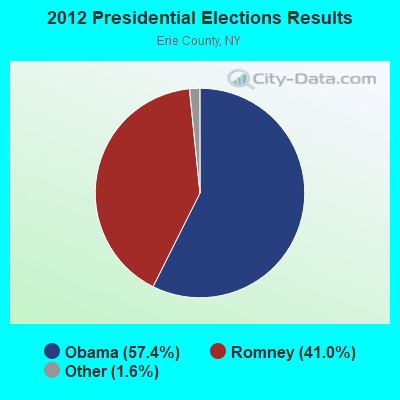
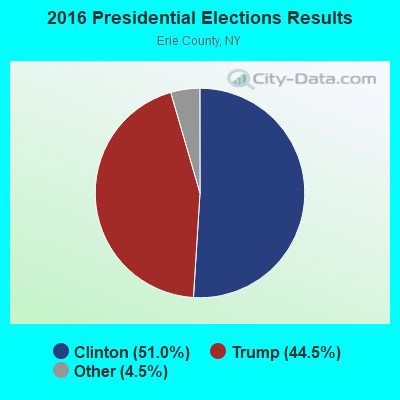

Graphs represent county-level data. Detailed 2008 Election Results
Religion statistics for Boston, NY (based on Erie County data)
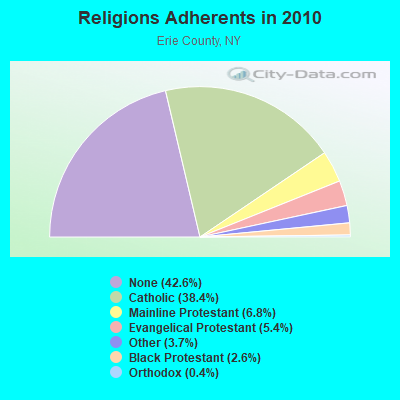
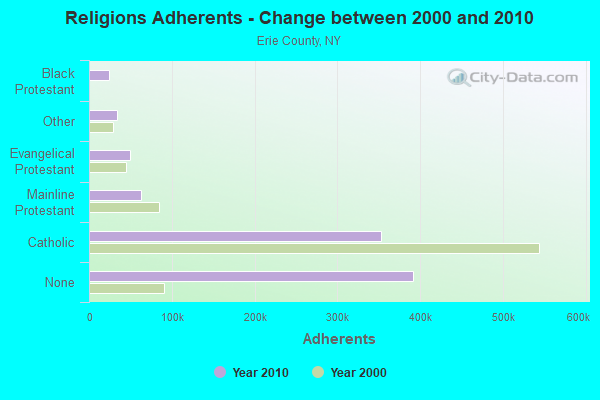
| Religion | Adherents | Congregations |
|---|---|---|
| Catholic | 352,894 | 111 |
| Mainline Protestant | 62,675 | 212 |
| Evangelical Protestant | 49,435 | 209 |
| Other | 34,076 | 79 |
| Black Protestant | 24,192 | 69 |
| Orthodox | 4,103 | 9 |
| None | 391,665 | - |
Food Environment Statistics:
| Erie County: | 2.59 / 10,000 pop. |
| State: | 4.13 / 10,000 pop. |
| Erie County: | 0.05 / 10,000 pop. |
| State: | 0.06 / 10,000 pop. |
| Erie County: | 1.37 / 10,000 pop. |
| New York: | 0.92 / 10,000 pop. |
| This county: | 2.50 / 10,000 pop. |
| State: | 1.68 / 10,000 pop. |
| This county: | 8.11 / 10,000 pop. |
| New York: | 8.82 / 10,000 pop. |
| Erie County: | 9.8% |
| New York: | 8.2% |
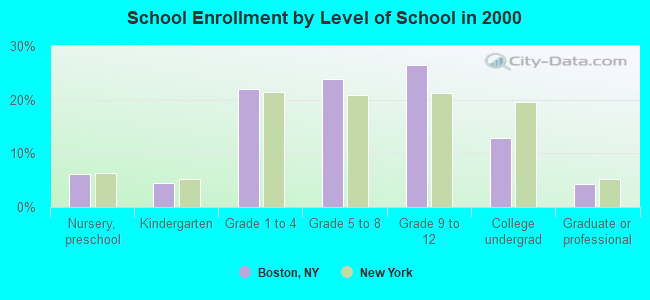
| Here: | 26.9% |
| New York: | 23.8% |
| Here: | 13.4% |
| New York: | 15.6% |
2.96% of this county's 2021 resident taxpayers lived in other counties in 2020 ($58,957 average adjusted gross income)
| Here: | 2.96% |
| New York average: | 5.29% |
0.01% of residents moved from foreign countries ($164 average AGI)
Erie County: 0.01% New York average: 0.01%
Top counties from which taxpayers relocated into this county between 2020 and 2021:
| from Niagara County, NY | |
| from Queens County, NY | |
| from Monroe County, NY |
3.42% of this county's 2020 resident taxpayers moved to other counties in 2021 ($64,893 average adjusted gross income)
| Here: | 3.42% |
| New York average: | 6.93% |
0.01% of residents moved to foreign countries ($150 average AGI)
Erie County: 0.01% New York average: 0.02%
Top counties to which taxpayers relocated from this county between 2020 and 2021:
| to Niagara County, NY | |
| to Monroe County, NY | |
| to Cattaraugus County, NY |
Businesses in Boston, NY
- Chevrolet: 1
- Nike: 1
Strongest AM radio stations in Boston:
- WWKB (1520 AM; 50 kW; BUFFALO, NY; Owner: ENTERCOM BUFFALO LICENSE, LLC)
- WGR (550 AM; 5 kW; BUFFALO, NY; Owner: ENTERCOM BUFFALO LICENSE, LLC)
- WNED (970 AM; 5 kW; BUFFALO, NY)
- WHLD (1270 AM; 5 kW; NIAGARA FALLS, NY; Owner: CITADEL BROADCASTING COMPANY)
- WXRL (1300 AM; 5 kW; LANCASTER, NY; Owner: DOME BROADCASTING, INC.)
- WHAM (1180 AM; 50 kW; ROCHESTER, NY; Owner: CITICASTERS LICENSES, L.P.)
- WBEN (930 AM; 5 kW; BUFFALO, NY; Owner: ENTERCOM BUFFALO LICENSE, LLC)
- WTOR (770 AM; daytime; 9 kW; YOUNGSTOWN, NY; Owner: BIRACH BROADCASTING CORPORATION)
- WMNY (1120 AM; daytime; 1 kW; BUFFALO, NY; Owner: CITADEL BROADCASTING COMPANY)
- WSPQ (1330 AM; 1 kW; SPRINGVILLE, NY; Owner: HAWK COMMUNICATIONS, LTD.)
- WJJL (1440 AM; 5 kW; NIAGARA FALLS, NY; Owner: M.J. PHILLIPS COMMUNICATIONS, INC.)
- WGGO (1590 AM; 5 kW; SALAMANCA, NY; Owner: CATT COMMUNICATIONS, INC.)
- WECK (1230 AM; 1 kW; CHEEKTOWAGA, NY; Owner: INFINITY RADIO OPERATIONS INC.)
Strongest FM radio stations in Boston:
- WNED-FM (94.5 FM; BUFFALO, NY; Owner: WESTERN NEW YORK PUBLIC B/C ASSOC.)
- WDCX (99.5 FM; BUFFALO, NY; Owner: KIMTRON, INC.)
- WBUF (92.9 FM; BUFFALO, NY; Owner: INFINITY RADIO OPERATIONS INC.)
- WFBF (89.9 FM; BUFFALO, NY; Owner: FAMILY STATIONS, INC.)
- WTSS (102.5 FM; BUFFALO, NY; Owner: ENTERCOM BUFFALO LICENSE, LLC)
- WGRF (96.9 FM; BUFFALO, NY; Owner: CITADEL BROADCASTING COMPANY)
- WHTT-FM (104.1 FM; BUFFALO, NY; Owner: CITADEL BROADCASTING COMPANY)
- WBLK (93.7 FM; DEPEW, NY; Owner: INFINITY RADIO OPERATIONS INC.)
- WJYE (96.1 FM; BUFFALO, NY; Owner: INFINITY RADIO OPERATIONS INC.)
- WNSA (107.7 FM; WETHERSFIELD TWNSHP, NY; Owner: ADELPHIA COMMUNICATIONS CORPORATION, DEBTOR-IN-POSSESSION)
- WYRK (106.5 FM; BUFFALO, NY; Owner: INFINITY RADIO OPERATIONS INC.)
- WEDG (103.3 FM; BUFFALO, NY; Owner: CITADEL BROADCASTING COMPANY)
- W284AP (104.7 FM; BUFFALO, NY; Owner: FAMILY LIFE MINISTRIES, INC.)
- WLOF (101.7 FM; ATTICA, NY; Owner: HOLY FAMILY COMMUNICATIONS, INC.)
- WCOU (88.3 FM; WARSAW, NY; Owner: FAMILY LIFE MINISTRIES, INC.)
- WKSE (98.5 FM; NIAGARA FALLS, NY; Owner: ENTERCOM BUFFALO LICENSE, LLC)
TV broadcast stations around Boston:
- WKBW-TV (Channel 7; BUFFALO, NY; Owner: WKBW-TV LICENSE, INC.)
- WIVB-TV (Channel 4; BUFFALO, NY; Owner: WIVB BROADCASTING, LLC)
- WGRZ-TV (Channel 2; BUFFALO, NY; Owner: MULTIMEDIA ENTERTAINMENT, INC.)
- WNYO-TV (Channel 49; BUFFALO, NY; Owner: NEW YORK TELEVISION, INC.)
- WNGS (Channel 67; SPRINGVILLE, NY; Owner: CAROLINE K. POWLEY D/B/A UNICORN/SPRINGVILLE)
- WDTB-LP (Channel 39; HAMBURG, NY; Owner: WORD OF GOD FELLOWSHIP, INC.)
- WNED-TV (Channel 17; BUFFALO, NY; Owner: WESTERN NY PUBLIC BROADCASTING ASSOC.)
- WUTV (Channel 29; BUFFALO, NY; Owner: WUTV LICENSEE, LLC)
- WFHW-LP (Channel 58; BUFFALO, NY; Owner: CITIZENS TELEVISION SYSTEM, INC.)
- WBXZ-LP (Channel 56; BUFFALO, NY; Owner: RENARD COMMUNICATIONS CORP.)
- WNLO (Channel 23; BUFFALO, NY; Owner: WIVB BROADCASTING, LLC)
- WNYB (Channel 26; JAMESTOWN, NY; Owner: FAITH BROADCASTING NETWORK, INC.)
- WBNF-CA (Channel 15; BUFFALO, NY; Owner: FAITH BROADCASTING NETWORK, INC.)
- WPXJ-TV (Channel 51; BATAVIA, NY; Owner: PAXSON BUFFALO LICENSE, INC.)
- National Bridge Inventory (NBI) Statistics
- 25Number of bridges
- 230ft / 70.1mTotal length
- $72,410,000Total costs
- 137,679Total average daily traffic
- 3,947Total average daily truck traffic
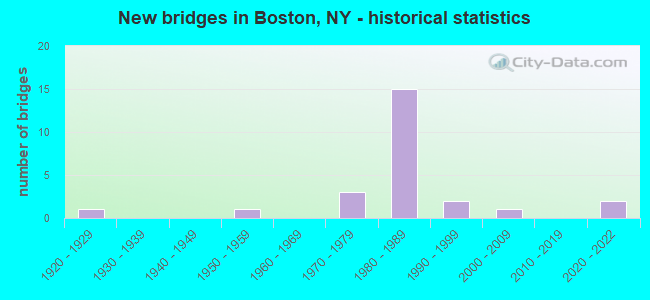
- New bridges - historical statistics
- 11920-1929
- 11950-1959
- 31970-1979
- 151980-1989
- 21990-1999
- 12000-2009
- 22020-2022
FCC Registered Antenna Towers:
27 (See the full list of FCC Registered Antenna Towers in Boston)FCC Registered Private Land Mobile Towers:
1- 10505 Manchester Rd (Lat: 42.592833 Lon: -78.667250), Type: Tower, Structure height: 67 m, Call Sign: WPIG690,
Assigned Frequencies: 929.487 MHz, Grant Date: 08/04/2020, Expiration Date: 09/05/2030, Certifier: J. Roy Pottle, Registrant: Wilkinson Barker Knauer, LLP, 1800 M Street, N.W., Suite 800n, Washington, DC 20036, Phone: (202) 783-4141, Fax: (202) 783-5851, Email:
FCC Registered Broadcast Land Mobile Towers:
5- South Feddick Road (Lat: 42.609778 Lon: -78.779472), Call Sign: KRA528, Licensee ID: L00003840,
Assigned Frequencies: 453.100 MHz, Grant Date: 03/13/2000, Expiration Date: 05/30/2005, Cancellation Date: 11/18/2003, Registrant: County Of Erie, 3359 Broadway, Cheektowaga, NY 14227, Phone: (716) 858-8369
- Nysp Sta 8550 Boston Sr (Lat: 42.648944 Lon: -78.753361), Call Sign: WNLQ248,
Assigned Frequencies: 155.370 MHz, 155.475 MHz, 39.4600 MHz, 42.1400 MHz, Grant Date: 03/31/2023, Expiration Date: 05/10/2033, Registrant: New York State Police, 1220 Washington Ave, Bldg 22, Albany, NY 12226-2252, Phone: (518) 457-9466, Fax: (518) 457-5676, Email:
- 105005 Manchester Rd (Lat: 42.593111 Lon: -78.667250), Type: Tower, Structure height: 68 m, Call Sign: WNPU605, Licensee ID: L00001988,
Assigned Frequencies: 47.9400 MHz, 48.1400 MHz, 48.1800 MHz, 48.7400 MHz, Grant Date: 05/10/2014, Expiration Date: 07/19/2024, Certifier: John A Rimlinger, Registrant: National Fuel Distribution Corporation, 365 Mineral Spring Rd, Buffalo, NY 14210, Phone: (716) 827-2100
- 6405 Ward Road (Lat: 42.688389 Lon: -78.753639), Type: Tower, Structure height: 78 m, Call Sign: WPSF758,
Assigned Frequencies: 153.380 MHz, Grant Date: 02/17/2016, Expiration Date: 04/09/2026, Certifier: Terry Pfeiffer, Registrant: Mobiletech Communications, 2365 Fire Hall Road, Canandaigua,, NY 14424, Phone: (585) 393-0180, Fax: (585) 396-2388, Email:
- Lat: 42.656944 Lon: -78.747333, Call Sign: WQJM525,
Assigned Frequencies: 153.920 MHz, Grant Date: 11/04/2008, Expiration Date: 11/04/2018, Cancellation Date: 02/16/2019, Certifier: James E Puta, Registrant: Skylines Unlimited Inc, 100 Stone Church Road, Carlisle, PA 17015, Phone: (717) 218-5003, Fax: (717) 218-5005, Email:
FCC Registered Microwave Towers:
4- 2.4 Mi Sw Of (Lat: 42.609778 Lon: -78.779472), Overall height: 61 m, Call Sign: WPNC783,
Assigned Frequencies: 6835.00 MHz, 6795.00 MHz, Grant Date: 03/02/2022, Expiration Date: 03/13/2032, Registrant: Niagara Frontier Transportation Authority, 181 Ellicott Street, Buffalo, NY 14203, Phone: (716) 855-7251, Fax: (716) 855-7447, Email:
- WARD ROAD, Near The Intersection Of Cole And Ward Roads, .2 Miles West Of Cole Road (Lat: 42.694222 Lon: -78.721417), Type: Tower, Structure height: 25.9 m, Call Sign: WPOL833,
Assigned Frequencies: 953.950 MHz, Grant Date: 10/25/2019, Expiration Date: 01/10/2030, Certifier: Matthew J Baudo, Registrant: Erie County Water Authority, 3030 Union Rd, Buffalo, NY 14227, Phone: (716) 361-6380, Fax: (716) 684-3937, Email:
- WDCX Transmitter, 9001 Zimmerman Road (Lat: 42.635972 Lon: -78.768417), Type: Gtower, Structure height: 122 m, Overall height: 123 m, Call Sign: WRFL545,
Assigned Frequencies: 6725.00 MHz, 6755.00 MHz, Grant Date: 03/24/2020, Expiration Date: 03/24/2030, Certifier: Donald B Crawford, Registrant: Crawford Broadcasting Company, 2821 S. Parker Road, Suite 1205, Aurora, CO 80014, Phone: (303) 481-1800, Fax: (303) 433-0905, Email:
- WDCX Transmitter, Zimmerman Rd .4 Mi N Of Rice Hill Rd (Lat: 42.635278 Lon: -78.767778), Type: Tower, Structure height: 122 m, Overall height: 123 m, Call Sign: WLO863, Licensee ID: L00013724,
Assigned Frequencies: 946.000 MHz, Grant Date: 03/27/1989, Expiration Date: 06/01/2030, Cancellation Date: 07/24/2023, Registrant: Kimtron, Inc.
FCC Registered Paging Towers:
1- 10505 Manchester Road (Lat: 42.592833 Lon: -78.667222), Overall height: 72.5 m, Call Sign: KGI787,
Assigned Frequencies: 931.237 MHz, Grant Date: 03/03/1999, Expiration Date: 07/01/2008, Cancellation Date: 03/18/2004, Certifier: Paul H Kuzia, Registrant: Wilkinson Barker Knauer, LLP, 2300 N Street, N.W., 7th Floor, Washington, DC 20037, Phone: (202) 783-4141, Fax: (202) 783-5851, Email:
FCC Registered Amateur Radio Licenses:
19 (See the full list of FCC Registered Amateur Radio Licenses in Boston)FAA Registered Aircraft Manufacturers and Dealers:
1 (See the full list of FAA Registered Manufacturers and Dealers in Boston)FAA Registered Aircraft:
11 (See the full list of FAA Registered Aircraft)2002 - 2018 National Fire Incident Reporting System (NFIRS) incidents
- Fire incident types reported to NFIRS in Boston, NY
- 28268.6%Structure Fires
- 5413.1%Outside Fires
- 5012.2%Mobile Property/Vehicle Fires
- 256.1%Other
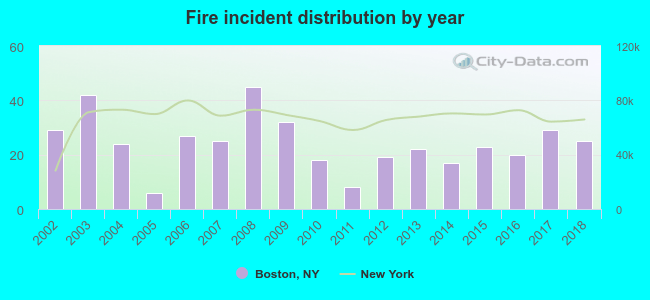 According to the data from the years 2002 - 2018 the average number of fire incidents per year is 24. The highest number of fires - 45 took place in 2008, and the least - 6 in 2005. The data has a declining trend.
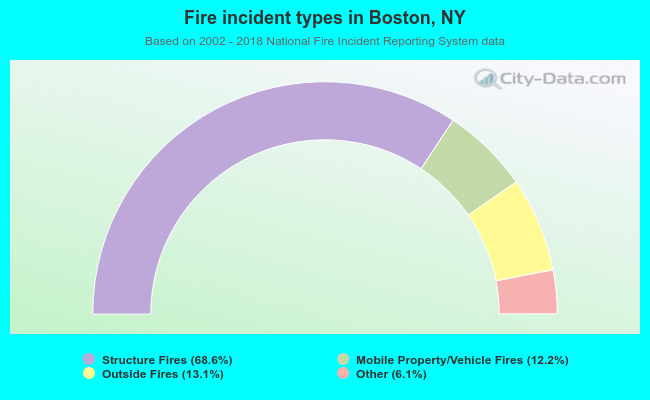 When looking into fire subcategories, the most reports belonged to: Structure Fires (68.6%), and Outside Fires (13.1%).
| Most common first names in Boston, NY among deceased individuals | ||
| Name | Count | Lived (average) |
|---|---|---|
| John | 19 | 79.8 years |
| Robert | 15 | 66.7 years |
| Mary | 14 | 82.6 years |
| Edward | 11 | 72.6 years |
| Elizabeth | 10 | 76.6 years |
| Helen | 10 | 78.9 years |
| Joseph | 9 | 82.8 years |
| George | 8 | 78.1 years |
| Dorothy | 8 | 74.0 years |
| Albert | 7 | 82.7 years |
| Most common last names in Boston, NY among deceased individuals | ||
| Last name | Count | Lived (average) |
|---|---|---|
| Rychlik | 7 | 76.4 years |
| Smith | 7 | 77.4 years |
| Dinse | 6 | 76.4 years |
| Spors | 6 | 75.7 years |
| Rockwood | 5 | 86.4 years |
| Golabek | 4 | 77.5 years |
| Feltz | 4 | 74.5 years |
| Emerling | 4 | 82.7 years |
| Jensen | 4 | 80.8 years |
| May | 4 | 86.8 years |
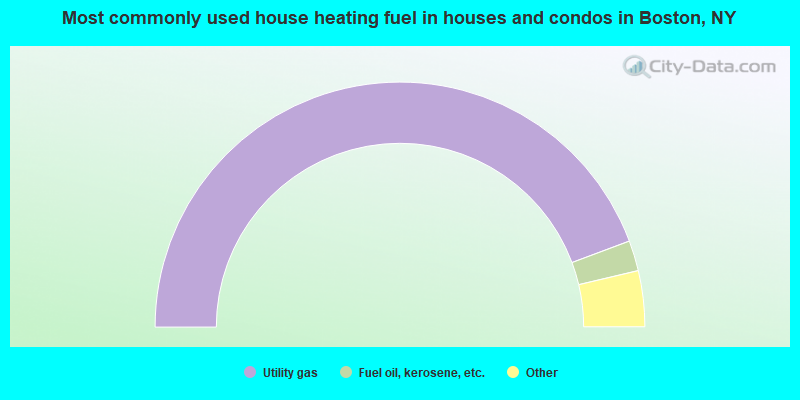
- 88.6%Utility gas
- 4.0%Fuel oil, kerosene, etc.
- 3.1%Bottled, tank, or LP gas
- 3.1%Wood
- 1.0%Electricity
- 0.2%Other fuel
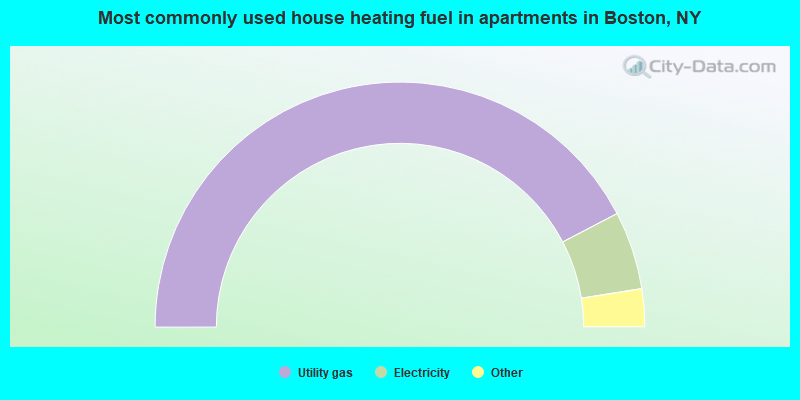
- 84.7%Utility gas
- 10.3%Electricity
- 2.8%Other fuel
- 2.2%Wood
Boston compared to New York state average:
- Unemployed percentage significantly below state average.
- Black race population percentage significantly below state average.
- Hispanic race population percentage significantly below state average.
- Foreign-born population percentage significantly below state average.
- Renting percentage significantly below state average.
- Length of stay since moving in significantly above state average.
- Number of rooms per house significantly below state average.
- House age significantly below state average.
Boston on our top lists:
- #2 on the list of "Top 101 cities with largest percentage of females in occupations: occupational and physical therapist assistants and aides (population 5,000+)"
- #14 on the list of "Top 101 cities with largest percentage of males in occupations: financial clerks except bookkeeping, accounting, and auditing clerks (population 5,000+)"
- #23 on the list of "Top 101 cities with largest percentage of males in occupations: supervisors of transportation and material moving workers (population 5,000+)"
- #27 on the list of "Top 101 cities with largest percentage of females in occupations: secretaries and administrative assistants (population 5,000+)"
- #37 on the list of "Top 101 cities with largest percentage of males in occupations: other healthcare support occupations (population 5,000+)"
- #44 on the list of "Top 101 cities with largest percentage of females in industries: health and personal care, except drug, stores (population 5,000+)"
- #44 on the list of "Top 101 cities with largest percentage of females in industries: petroleum and petroleum products merchant wholesalers (population 5,000+)"
- #48 on the list of "Top 101 cities with largest percentage of males in industries: groceries and related products merchant wholesalers (population 5,000+)"
- #50 on the list of "Top 101 cities with largest percentage of females in industries: professional and commercial equipment and supplies merchant wholesalers (population 5,000+)"
- #59 on the list of "Top 101 cities with largest percentage of males in occupations: other health diagnosing and treating practitioners and technical occupations (population 5,000+)"
- #70 on the list of "Top 100 least racially diverse cities (pop. 5,000+)"
- #83 on the list of "Top 101 cities with largest percentage of males in industries: nonmetallic mineral products (population 5,000+)"
- #85 on the list of "Top 101 cities with the most users submitting photos to our site per 10,000 residents (population 5,000+)"
- #87 on the list of "Top 101 cities with largest percentage of females in industries: machinery, equipment, and supplies merchant wholesalers (population 5,000+)"
- #92 on the list of "Top 101 cities with largest percentage of males in industries: machinery (population 5,000+)"
- #97 on the list of "Top 101 cities with largest percentage of females in industries: truck transportation (population 5,000+)"
- #2 on the list of "Top 101 counties with the lowest percentage of residents relocating from other counties between 2010 and 2011"
- #7 on the list of "Top 101 counties with the lowest percentage of residents relocating to other counties in 2011"
- #8 on the list of "Top 101 counties with the most Catholic congregations"
- #16 on the list of "Top 101 counties with the highest Sulfur Oxides Annual air pollution readings in 2012 (µg/m3)"
- #17 on the list of "Top 101 counties with the most Mainline Protestant congregations"

|
|
Total of 45 patent applications in 2008-2024.