Longwood, Florida Submit your own pictures of this city and show them to the world
OSM Map
General Map
Google Map
MSN Map
OSM Map
General Map
Google Map
MSN Map
OSM Map
General Map
Google Map
MSN Map
OSM Map
General Map
Google Map
MSN Map
Please wait while loading the map...
Population in 2022: 16,842 (100% urban, 0% rural). Population change since 2000: +22.5%Males: 7,882 Females: 8,960
March 2022 cost of living index in Longwood: 92.1 (less than average, U.S. average is 100) Percentage of residents living in poverty in 2022: 8.6%for White Non-Hispanic residents , 9.4% for Black residents , 7.5% for Hispanic or Latino residents , 2.6% for other race residents , 8.0% for two or more races residents )
Profiles of local businesses
Business Search - 14 Million verified businesses
Data:
Median household income ($)
Median household income (% change since 2000)
Household income diversity
Ratio of average income to average house value (%)
Ratio of average income to average rent
Median household income ($) - White
Median household income ($) - Black or African American
Median household income ($) - Asian
Median household income ($) - Hispanic or Latino
Median household income ($) - American Indian and Alaska Native
Median household income ($) - Multirace
Median household income ($) - Other Race
Median household income for houses/condos with a mortgage ($)
Median household income for apartments without a mortgage ($)
Races - White alone (%)
Races - White alone (% change since 2000)
Races - Black alone (%)
Races - Black alone (% change since 2000)
Races - American Indian alone (%)
Races - American Indian alone (% change since 2000)
Races - Asian alone (%)
Races - Asian alone (% change since 2000)
Races - Hispanic (%)
Races - Hispanic (% change since 2000)
Races - Native Hawaiian and Other Pacific Islander alone (%)
Races - Native Hawaiian and Other Pacific Islander alone (% change since 2000)
Races - Two or more races (%)
Races - Two or more races (% change since 2000)
Races - Other race alone (%)
Races - Other race alone (% change since 2000)
Racial diversity
Unemployment (%)
Unemployment (% change since 2000)
Unemployment (%) - White
Unemployment (%) - Black or African American
Unemployment (%) - Asian
Unemployment (%) - Hispanic or Latino
Unemployment (%) - American Indian and Alaska Native
Unemployment (%) - Multirace
Unemployment (%) - Other Race
Population density (people per square mile)
Population - Males (%)
Population - Females (%)
Population - Males (%) - White
Population - Males (%) - Black or African American
Population - Males (%) - Asian
Population - Males (%) - Hispanic or Latino
Population - Males (%) - American Indian and Alaska Native
Population - Males (%) - Multirace
Population - Males (%) - Other Race
Population - Females (%) - White
Population - Females (%) - Black or African American
Population - Females (%) - Asian
Population - Females (%) - Hispanic or Latino
Population - Females (%) - American Indian and Alaska Native
Population - Females (%) - Multirace
Population - Females (%) - Other Race
Coronavirus confirmed cases (Apr 25, 2024)
Deaths caused by coronavirus (Apr 25, 2024)
Coronavirus confirmed cases (per 100k population) (Apr 25, 2024)
Deaths caused by coronavirus (per 100k population) (Apr 25, 2024)
Daily increase in number of cases (Apr 25, 2024)
Weekly increase in number of cases (Apr 25, 2024)
Cases doubled (in days) (Apr 25, 2024)
Hospitalized patients (Apr 18, 2022)
Negative test results (Apr 18, 2022)
Total test results (Apr 18, 2022)
COVID Vaccine doses distributed (per 100k population) (Sep 19, 2023)
COVID Vaccine doses administered (per 100k population) (Sep 19, 2023)
COVID Vaccine doses distributed (Sep 19, 2023)
COVID Vaccine doses administered (Sep 19, 2023)
Likely homosexual households (%)
Likely homosexual households (% change since 2000)
Likely homosexual households - Lesbian couples (%)
Likely homosexual households - Lesbian couples (% change since 2000)
Likely homosexual households - Gay men (%)
Likely homosexual households - Gay men (% change since 2000)
Cost of living index
Median gross rent ($)
Median contract rent ($)
Median monthly housing costs ($)
Median house or condo value ($)
Median house or condo value ($ change since 2000)
Mean house or condo value by units in structure - 1, detached ($)
Mean house or condo value by units in structure - 1, attached ($)
Mean house or condo value by units in structure - 2 ($)
Mean house or condo value by units in structure by units in structure - 3 or 4 ($)
Mean house or condo value by units in structure - 5 or more ($)
Mean house or condo value by units in structure - Boat, RV, van, etc. ($)
Mean house or condo value by units in structure - Mobile home ($)
Median house or condo value ($) - White
Median house or condo value ($) - Black or African American
Median house or condo value ($) - Asian
Median house or condo value ($) - Hispanic or Latino
Median house or condo value ($) - American Indian and Alaska Native
Median house or condo value ($) - Multirace
Median house or condo value ($) - Other Race
Median resident age
Resident age diversity
Median resident age - Males
Median resident age - Females
Median resident age - White
Median resident age - Black or African American
Median resident age - Asian
Median resident age - Hispanic or Latino
Median resident age - American Indian and Alaska Native
Median resident age - Multirace
Median resident age - Other Race
Median resident age - Males - White
Median resident age - Males - Black or African American
Median resident age - Males - Asian
Median resident age - Males - Hispanic or Latino
Median resident age - Males - American Indian and Alaska Native
Median resident age - Males - Multirace
Median resident age - Males - Other Race
Median resident age - Females - White
Median resident age - Females - Black or African American
Median resident age - Females - Asian
Median resident age - Females - Hispanic or Latino
Median resident age - Females - American Indian and Alaska Native
Median resident age - Females - Multirace
Median resident age - Females - Other Race
Commute - mean travel time to work (minutes)
Travel time to work - Less than 5 minutes (%)
Travel time to work - Less than 5 minutes (% change since 2000)
Travel time to work - 5 to 9 minutes (%)
Travel time to work - 5 to 9 minutes (% change since 2000)
Travel time to work - 10 to 19 minutes (%)
Travel time to work - 10 to 19 minutes (% change since 2000)
Travel time to work - 20 to 29 minutes (%)
Travel time to work - 20 to 29 minutes (% change since 2000)
Travel time to work - 30 to 39 minutes (%)
Travel time to work - 30 to 39 minutes (% change since 2000)
Travel time to work - 40 to 59 minutes (%)
Travel time to work - 40 to 59 minutes (% change since 2000)
Travel time to work - 60 to 89 minutes (%)
Travel time to work - 60 to 89 minutes (% change since 2000)
Travel time to work - 90 or more minutes (%)
Travel time to work - 90 or more minutes (% change since 2000)
Marital status - Never married (%)
Marital status - Now married (%)
Marital status - Separated (%)
Marital status - Widowed (%)
Marital status - Divorced (%)
Median family income ($)
Median family income (% change since 2000)
Median non-family income ($)
Median non-family income (% change since 2000)
Median per capita income ($)
Median per capita income (% change since 2000)
Median family income ($) - White
Median family income ($) - Black or African American
Median family income ($) - Asian
Median family income ($) - Hispanic or Latino
Median family income ($) - American Indian and Alaska Native
Median family income ($) - Multirace
Median family income ($) - Other Race
Median year house/condo built
Median year apartment built
Year house built - Built 2005 or later (%)
Year house built - Built 2000 to 2004 (%)
Year house built - Built 1990 to 1999 (%)
Year house built - Built 1980 to 1989 (%)
Year house built - Built 1970 to 1979 (%)
Year house built - Built 1960 to 1969 (%)
Year house built - Built 1950 to 1959 (%)
Year house built - Built 1940 to 1949 (%)
Year house built - Built 1939 or earlier (%)
Average household size
Household density (households per square mile)
Average household size - White
Average household size - Black or African American
Average household size - Asian
Average household size - Hispanic or Latino
Average household size - American Indian and Alaska Native
Average household size - Multirace
Average household size - Other Race
Occupied housing units (%)
Vacant housing units (%)
Owner occupied housing units (%)
Renter occupied housing units (%)
Vacancy status - For rent (%)
Vacancy status - For sale only (%)
Vacancy status - Rented or sold, not occupied (%)
Vacancy status - For seasonal, recreational, or occasional use (%)
Vacancy status - For migrant workers (%)
Vacancy status - Other vacant (%)
Residents with income below the poverty level (%)
Residents with income below 50% of the poverty level (%)
Children below poverty level (%)
Poor families by family type - Married-couple family (%)
Poor families by family type - Male, no wife present (%)
Poor families by family type - Female, no husband present (%)
Poverty status for native-born residents (%)
Poverty status for foreign-born residents (%)
Poverty among high school graduates not in families (%)
Poverty among people who did not graduate high school not in families (%)
Residents with income below the poverty level (%) - White
Residents with income below the poverty level (%) - Black or African American
Residents with income below the poverty level (%) - Asian
Residents with income below the poverty level (%) - Hispanic or Latino
Residents with income below the poverty level (%) - American Indian and Alaska Native
Residents with income below the poverty level (%) - Multirace
Residents with income below the poverty level (%) - Other Race
Air pollution - Air Quality Index (AQI)
Air pollution - CO
Air pollution - NO2
Air pollution - SO2
Air pollution - Ozone
Air pollution - PM10
Air pollution - PM25
Air pollution - Pb
Crime - Murders per 100,000 population
Crime - Rapes per 100,000 population
Crime - Robberies per 100,000 population
Crime - Assaults per 100,000 population
Crime - Burglaries per 100,000 population
Crime - Thefts per 100,000 population
Crime - Auto thefts per 100,000 population
Crime - Arson per 100,000 population
Crime - City-data.com crime index
Crime - Violent crime index
Crime - Property crime index
Crime - Murders per 100,000 population (5 year average)
Crime - Rapes per 100,000 population (5 year average)
Crime - Robberies per 100,000 population (5 year average)
Crime - Assaults per 100,000 population (5 year average)
Crime - Burglaries per 100,000 population (5 year average)
Crime - Thefts per 100,000 population (5 year average)
Crime - Auto thefts per 100,000 population (5 year average)
Crime - Arson per 100,000 population (5 year average)
Crime - City-data.com crime index (5 year average)
Crime - Violent crime index (5 year average)
Crime - Property crime index (5 year average)
1996 Presidential Elections Results (%) - Democratic Party (Clinton)
1996 Presidential Elections Results (%) - Republican Party (Dole)
1996 Presidential Elections Results (%) - Other
2000 Presidential Elections Results (%) - Democratic Party (Gore)
2000 Presidential Elections Results (%) - Republican Party (Bush)
2000 Presidential Elections Results (%) - Other
2004 Presidential Elections Results (%) - Democratic Party (Kerry)
2004 Presidential Elections Results (%) - Republican Party (Bush)
2004 Presidential Elections Results (%) - Other
2008 Presidential Elections Results (%) - Democratic Party (Obama)
2008 Presidential Elections Results (%) - Republican Party (McCain)
2008 Presidential Elections Results (%) - Other
2012 Presidential Elections Results (%) - Democratic Party (Obama)
2012 Presidential Elections Results (%) - Republican Party (Romney)
2012 Presidential Elections Results (%) - Other
2016 Presidential Elections Results (%) - Democratic Party (Clinton)
2016 Presidential Elections Results (%) - Republican Party (Trump)
2016 Presidential Elections Results (%) - Other
2020 Presidential Elections Results (%) - Democratic Party (Biden)
2020 Presidential Elections Results (%) - Republican Party (Trump)
2020 Presidential Elections Results (%) - Other
Ancestries Reported - Arab (%)
Ancestries Reported - Czech (%)
Ancestries Reported - Danish (%)
Ancestries Reported - Dutch (%)
Ancestries Reported - English (%)
Ancestries Reported - French (%)
Ancestries Reported - French Canadian (%)
Ancestries Reported - German (%)
Ancestries Reported - Greek (%)
Ancestries Reported - Hungarian (%)
Ancestries Reported - Irish (%)
Ancestries Reported - Italian (%)
Ancestries Reported - Lithuanian (%)
Ancestries Reported - Norwegian (%)
Ancestries Reported - Polish (%)
Ancestries Reported - Portuguese (%)
Ancestries Reported - Russian (%)
Ancestries Reported - Scotch-Irish (%)
Ancestries Reported - Scottish (%)
Ancestries Reported - Slovak (%)
Ancestries Reported - Subsaharan African (%)
Ancestries Reported - Swedish (%)
Ancestries Reported - Swiss (%)
Ancestries Reported - Ukrainian (%)
Ancestries Reported - United States (%)
Ancestries Reported - Welsh (%)
Ancestries Reported - West Indian (%)
Ancestries Reported - Other (%)
Educational Attainment - No schooling completed (%)
Educational Attainment - Less than high school (%)
Educational Attainment - High school or equivalent (%)
Educational Attainment - Less than 1 year of college (%)
Educational Attainment - 1 or more years of college (%)
Educational Attainment - Associate degree (%)
Educational Attainment - Bachelor's degree (%)
Educational Attainment - Master's degree (%)
Educational Attainment - Professional school degree (%)
Educational Attainment - Doctorate degree (%)
School Enrollment - Nursery, preschool (%)
School Enrollment - Kindergarten (%)
School Enrollment - Grade 1 to 4 (%)
School Enrollment - Grade 5 to 8 (%)
School Enrollment - Grade 9 to 12 (%)
School Enrollment - College undergrad (%)
School Enrollment - Graduate or professional (%)
School Enrollment - Not enrolled in school (%)
School enrollment - Public schools (%)
School enrollment - Private schools (%)
School enrollment - Not enrolled (%)
Median number of rooms in houses and condos
Median number of rooms in apartments
Housing units lacking complete plumbing facilities (%)
Housing units lacking complete kitchen facilities (%)
Density of houses
Urban houses (%)
Rural houses (%)
Households with people 60 years and over (%)
Households with people 65 years and over (%)
Households with people 75 years and over (%)
Households with one or more nonrelatives (%)
Households with no nonrelatives (%)
Population in households (%)
Family households (%)
Nonfamily households (%)
Population in families (%)
Family households with own children (%)
Median number of bedrooms in owner occupied houses
Mean number of bedrooms in owner occupied houses
Median number of bedrooms in renter occupied houses
Mean number of bedrooms in renter occupied houses
Median number of vehichles in owner occupied houses
Mean number of vehichles in owner occupied houses
Median number of vehichles in renter occupied houses
Mean number of vehichles in renter occupied houses
Mortgage status - with mortgage (%)
Mortgage status - with second mortgage (%)
Mortgage status - with home equity loan (%)
Mortgage status - with both second mortgage and home equity loan (%)
Mortgage status - without a mortgage (%)
Average family size
Average family size - White
Average family size - Black or African American
Average family size - Asian
Average family size - Hispanic or Latino
Average family size - American Indian and Alaska Native
Average family size - Multirace
Average family size - Other Race
Geographical mobility - Same house 1 year ago (%)
Geographical mobility - Moved within same county (%)
Geographical mobility - Moved from different county within same state (%)
Geographical mobility - Moved from different state (%)
Geographical mobility - Moved from abroad (%)
Place of birth - Born in state of residence (%)
Place of birth - Born in other state (%)
Place of birth - Native, outside of US (%)
Place of birth - Foreign born (%)
Housing units in structures - 1, detached (%)
Housing units in structures - 1, attached (%)
Housing units in structures - 2 (%)
Housing units in structures - 3 or 4 (%)
Housing units in structures - 5 to 9 (%)
Housing units in structures - 10 to 19 (%)
Housing units in structures - 20 to 49 (%)
Housing units in structures - 50 or more (%)
Housing units in structures - Mobile home (%)
Housing units in structures - Boat, RV, van, etc. (%)
House/condo owner moved in on average (years ago)
Renter moved in on average (years ago)
Year householder moved into unit - Moved in 1999 to March 2000 (%)
Year householder moved into unit - Moved in 1995 to 1998 (%)
Year householder moved into unit - Moved in 1990 to 1994 (%)
Year householder moved into unit - Moved in 1980 to 1989 (%)
Year householder moved into unit - Moved in 1970 to 1979 (%)
Year householder moved into unit - Moved in 1969 or earlier (%)
Means of transportation to work - Drove car alone (%)
Means of transportation to work - Carpooled (%)
Means of transportation to work - Public transportation (%)
Means of transportation to work - Bus or trolley bus (%)
Means of transportation to work - Streetcar or trolley car (%)
Means of transportation to work - Subway or elevated (%)
Means of transportation to work - Railroad (%)
Means of transportation to work - Ferryboat (%)
Means of transportation to work - Taxicab (%)
Means of transportation to work - Motorcycle (%)
Means of transportation to work - Bicycle (%)
Means of transportation to work - Walked (%)
Means of transportation to work - Other means (%)
Working at home (%)
Industry diversity
Most Common Industries - Agriculture, forestry, fishing and hunting, and mining (%)
Most Common Industries - Agriculture, forestry, fishing and hunting (%)
Most Common Industries - Mining, quarrying, and oil and gas extraction (%)
Most Common Industries - Construction (%)
Most Common Industries - Manufacturing (%)
Most Common Industries - Wholesale trade (%)
Most Common Industries - Retail trade (%)
Most Common Industries - Transportation and warehousing, and utilities (%)
Most Common Industries - Transportation and warehousing (%)
Most Common Industries - Utilities (%)
Most Common Industries - Information (%)
Most Common Industries - Finance and insurance, and real estate and rental and leasing (%)
Most Common Industries - Finance and insurance (%)
Most Common Industries - Real estate and rental and leasing (%)
Most Common Industries - Professional, scientific, and management, and administrative and waste management services (%)
Most Common Industries - Professional, scientific, and technical services (%)
Most Common Industries - Management of companies and enterprises (%)
Most Common Industries - Administrative and support and waste management services (%)
Most Common Industries - Educational services, and health care and social assistance (%)
Most Common Industries - Educational services (%)
Most Common Industries - Health care and social assistance (%)
Most Common Industries - Arts, entertainment, and recreation, and accommodation and food services (%)
Most Common Industries - Arts, entertainment, and recreation (%)
Most Common Industries - Accommodation and food services (%)
Most Common Industries - Other services, except public administration (%)
Most Common Industries - Public administration (%)
Occupation diversity
Most Common Occupations - Management, business, science, and arts occupations (%)
Most Common Occupations - Management, business, and financial occupations (%)
Most Common Occupations - Management occupations (%)
Most Common Occupations - Business and financial operations occupations (%)
Most Common Occupations - Computer, engineering, and science occupations (%)
Most Common Occupations - Computer and mathematical occupations (%)
Most Common Occupations - Architecture and engineering occupations (%)
Most Common Occupations - Life, physical, and social science occupations (%)
Most Common Occupations - Education, legal, community service, arts, and media occupations (%)
Most Common Occupations - Community and social service occupations (%)
Most Common Occupations - Legal occupations (%)
Most Common Occupations - Education, training, and library occupations (%)
Most Common Occupations - Arts, design, entertainment, sports, and media occupations (%)
Most Common Occupations - Healthcare practitioners and technical occupations (%)
Most Common Occupations - Health diagnosing and treating practitioners and other technical occupations (%)
Most Common Occupations - Health technologists and technicians (%)
Most Common Occupations - Service occupations (%)
Most Common Occupations - Healthcare support occupations (%)
Most Common Occupations - Protective service occupations (%)
Most Common Occupations - Fire fighting and prevention, and other protective service workers including supervisors (%)
Most Common Occupations - Law enforcement workers including supervisors (%)
Most Common Occupations - Food preparation and serving related occupations (%)
Most Common Occupations - Building and grounds cleaning and maintenance occupations (%)
Most Common Occupations - Personal care and service occupations (%)
Most Common Occupations - Sales and office occupations (%)
Most Common Occupations - Sales and related occupations (%)
Most Common Occupations - Office and administrative support occupations (%)
Most Common Occupations - Natural resources, construction, and maintenance occupations (%)
Most Common Occupations - Farming, fishing, and forestry occupations (%)
Most Common Occupations - Construction and extraction occupations (%)
Most Common Occupations - Installation, maintenance, and repair occupations (%)
Most Common Occupations - Production, transportation, and material moving occupations (%)
Most Common Occupations - Production occupations (%)
Most Common Occupations - Transportation occupations (%)
Most Common Occupations - Material moving occupations (%)
People in Group quarters - Institutionalized population (%)
People in Group quarters - Correctional institutions (%)
People in Group quarters - Federal prisons and detention centers (%)
People in Group quarters - Halfway houses (%)
People in Group quarters - Local jails and other confinement facilities (including police lockups) (%)
People in Group quarters - Military disciplinary barracks (%)
People in Group quarters - State prisons (%)
People in Group quarters - Other types of correctional institutions (%)
People in Group quarters - Nursing homes (%)
People in Group quarters - Hospitals/wards, hospices, and schools for the handicapped (%)
People in Group quarters - Hospitals/wards and hospices for chronically ill (%)
People in Group quarters - Hospices or homes for chronically ill (%)
People in Group quarters - Military hospitals or wards for chronically ill (%)
People in Group quarters - Other hospitals or wards for chronically ill (%)
People in Group quarters - Hospitals or wards for drug/alcohol abuse (%)
People in Group quarters - Mental (Psychiatric) hospitals or wards (%)
People in Group quarters - Schools, hospitals, or wards for the mentally retarded (%)
People in Group quarters - Schools, hospitals, or wards for the physically handicapped (%)
People in Group quarters - Institutions for the deaf (%)
People in Group quarters - Institutions for the blind (%)
People in Group quarters - Orthopedic wards and institutions for the physically handicapped (%)
People in Group quarters - Wards in general hospitals for patients who have no usual home elsewhere (%)
People in Group quarters - Wards in military hospitals for patients who have no usual home elsewhere (%)
People in Group quarters - Juvenile institutions (%)
People in Group quarters - Long-term care (%)
People in Group quarters - Homes for abused, dependent, and neglected children (%)
People in Group quarters - Residential treatment centers for emotionally disturbed children (%)
People in Group quarters - Training schools for juvenile delinquents (%)
People in Group quarters - Short-term care, detention or diagnostic centers for delinquent children (%)
People in Group quarters - Type of juvenile institution unknown (%)
People in Group quarters - Noninstitutionalized population (%)
People in Group quarters - College dormitories (includes college quarters off campus) (%)
People in Group quarters - Military quarters (%)
People in Group quarters - On base (%)
People in Group quarters - Barracks, unaccompanied personnel housing (UPH), (Enlisted/Officer), ;and similar group living quarters for military personnel (%)
People in Group quarters - Transient quarters for temporary residents (%)
People in Group quarters - Military ships (%)
People in Group quarters - Group homes (%)
People in Group quarters - Homes or halfway houses for drug/alcohol abuse (%)
People in Group quarters - Homes for the mentally ill (%)
People in Group quarters - Homes for the mentally retarded (%)
People in Group quarters - Homes for the physically handicapped (%)
People in Group quarters - Other group homes (%)
People in Group quarters - Religious group quarters (%)
People in Group quarters - Dormitories (%)
People in Group quarters - Agriculture workers' dormitories on farms (%)
People in Group quarters - Job Corps and vocational training facilities (%)
People in Group quarters - Other workers' dormitories (%)
People in Group quarters - Crews of maritime vessels (%)
People in Group quarters - Other nonhousehold living situations (%)
People in Group quarters - Other noninstitutional group quarters (%)
Residents speaking English at home (%)
Residents speaking English at home - Born in the United States (%)
Residents speaking English at home - Native, born elsewhere (%)
Residents speaking English at home - Foreign born (%)
Residents speaking Spanish at home (%)
Residents speaking Spanish at home - Born in the United States (%)
Residents speaking Spanish at home - Native, born elsewhere (%)
Residents speaking Spanish at home - Foreign born (%)
Residents speaking other language at home (%)
Residents speaking other language at home - Born in the United States (%)
Residents speaking other language at home - Native, born elsewhere (%)
Residents speaking other language at home - Foreign born (%)
Class of Workers - Employee of private company (%)
Class of Workers - Self-employed in own incorporated business (%)
Class of Workers - Private not-for-profit wage and salary workers (%)
Class of Workers - Local government workers (%)
Class of Workers - State government workers (%)
Class of Workers - Federal government workers (%)
Class of Workers - Self-employed workers in own not incorporated business and Unpaid family workers (%)
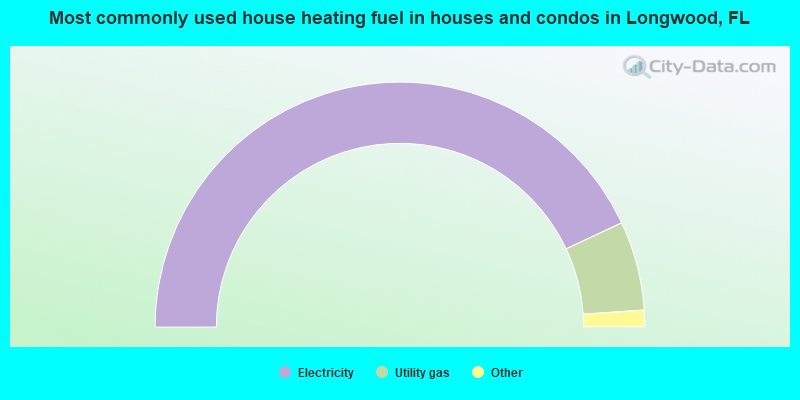
House heating fuel used in houses and condos - Utility gas (%)
House heating fuel used in houses and condos - Bottled, tank, or LP gas (%)
House heating fuel used in houses and condos - Electricity (%)
House heating fuel used in houses and condos - Fuel oil, kerosene, etc. (%)
House heating fuel used in houses and condos - Coal or coke (%)
House heating fuel used in houses and condos - Wood (%)
House heating fuel used in houses and condos - Solar energy (%)
House heating fuel used in houses and condos - Other fuel (%)
House heating fuel used in houses and condos - No fuel used (%)
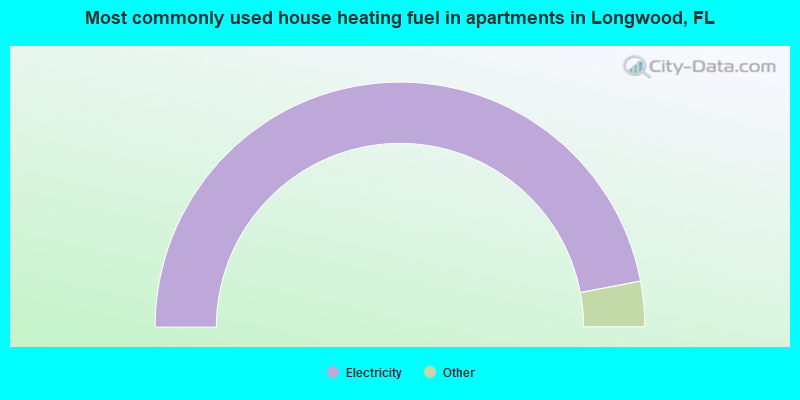
House heating fuel used in apartments - Utility gas (%)
House heating fuel used in apartments - Bottled, tank, or LP gas (%)
House heating fuel used in apartments - Electricity (%)
House heating fuel used in apartments - Fuel oil, kerosene, etc. (%)
House heating fuel used in apartments - Coal or coke (%)
House heating fuel used in apartments - Wood (%)
House heating fuel used in apartments - Solar energy (%)
House heating fuel used in apartments - Other fuel (%)
House heating fuel used in apartments - No fuel used (%)
Armed forces status - In Armed Forces (%)
Armed forces status - Civilian (%)
Armed forces status - Civilian - Veteran (%)
Armed forces status - Civilian - Nonveteran (%)
Fatal accidents locations in years 2005-2021
Fatal accidents locations in 2005
Fatal accidents locations in 2006
Fatal accidents locations in 2007
Fatal accidents locations in 2008
Fatal accidents locations in 2009
Fatal accidents locations in 2010
Fatal accidents locations in 2011
Fatal accidents locations in 2012
Fatal accidents locations in 2013
Fatal accidents locations in 2014
Fatal accidents locations in 2015
Fatal accidents locations in 2016
Fatal accidents locations in 2017
Fatal accidents locations in 2018
Fatal accidents locations in 2019
Fatal accidents locations in 2020
Fatal accidents locations in 2021
Alcohol use - People drinking some alcohol every month (%)
Alcohol use - People not drinking at all (%)
Alcohol use - Average days/month drinking alcohol
Alcohol use - Average drinks/week
Alcohol use - Average days/year people drink much
Audiometry - Average condition of hearing (%)
Audiometry - People that can hear a whisper from across a quiet room (%)
Audiometry - People that can hear normal voice from across a quiet room (%)
Audiometry - Ears ringing, roaring, buzzing (%)
Audiometry - Had a job exposure to loud noise (%)
Audiometry - Had off-work exposure to loud noise (%)
Blood Pressure & Cholesterol - Has high blood pressure (%)
Blood Pressure & Cholesterol - Checking blood pressure at home (%)
Blood Pressure & Cholesterol - Frequently checking blood cholesterol (%)
Blood Pressure & Cholesterol - Has high cholesterol level (%)
Consumer Behavior - Money monthly spent on food at supermarket/grocery store
Consumer Behavior - Money monthly spent on food at other stores
Consumer Behavior - Money monthly spent on eating out
Consumer Behavior - Money monthly spent on carryout/delivered foods
Consumer Behavior - Income spent on food at supermarket/grocery store (%)
Consumer Behavior - Income spent on food at other stores (%)
Consumer Behavior - Income spent on eating out (%)
Consumer Behavior - Income spent on carryout/delivered foods (%)
Current Health Status - General health condition (%)
Current Health Status - Blood donors (%)
Current Health Status - Has blood ever tested for HIV virus (%)
Current Health Status - Left-handed people (%)
Dermatology - People using sunscreen (%)
Diabetes - Diabetics (%)
Diabetes - Had a blood test for high blood sugar (%)
Diabetes - People taking insulin (%)
Diet Behavior & Nutrition - Diet health (%)
Diet Behavior & Nutrition - Milk product consumption (# of products/month)
Diet Behavior & Nutrition - Meals not home prepared (#/week)
Diet Behavior & Nutrition - Meals from fast food or pizza place (#/week)
Diet Behavior & Nutrition - Ready-to-eat foods (#/month)
Diet Behavior & Nutrition - Frozen meals/pizza (#/month)
Drug Use - People that ever used marijuana or hashish (%)
Drug Use - Ever used hard drugs (%)
Drug Use - Ever used any form of cocaine (%)
Drug Use - Ever used heroin (%)
Drug Use - Ever used methamphetamine (%)
Health Insurance - People covered by health insurance (%)
Kidney Conditions-Urology - Avg. # of times urinating at night
Medical Conditions - People with asthma (%)
Medical Conditions - People with anemia (%)
Medical Conditions - People with psoriasis (%)
Medical Conditions - People with overweight (%)
Medical Conditions - Elderly people having difficulties in thinking or remembering (%)
Medical Conditions - People who ever received blood transfusion (%)
Medical Conditions - People having trouble seeing even with glass/contacts (%)
Medical Conditions - People with arthritis (%)
Medical Conditions - People with gout (%)
Medical Conditions - People with congestive heart failure (%)
Medical Conditions - People with coronary heart disease (%)
Medical Conditions - People with angina pectoris (%)
Medical Conditions - People who ever had heart attack (%)
Medical Conditions - People who ever had stroke (%)
Medical Conditions - People with emphysema (%)
Medical Conditions - People with thyroid problem (%)
Medical Conditions - People with chronic bronchitis (%)
Medical Conditions - People with any liver condition (%)
Medical Conditions - People who ever had cancer or malignancy (%)
Mental Health - People who have little interest in doing things (%)
Mental Health - People feeling down, depressed, or hopeless (%)
Mental Health - People who have trouble sleeping or sleeping too much (%)
Mental Health - People feeling tired or having little energy (%)
Mental Health - People with poor appetite or overeating (%)
Mental Health - People feeling bad about themself (%)
Mental Health - People who have trouble concentrating on things (%)
Mental Health - People moving or speaking slowly or too fast (%)
Mental Health - People having thoughts they would be better off dead (%)
Oral Health - Average years since last visit a dentist
Oral Health - People embarrassed because of mouth (%)
Oral Health - People with gum disease (%)
Oral Health - General health of teeth and gums (%)
Oral Health - Average days a week using dental floss/device
Oral Health - Average days a week using mouthwash for dental problem
Oral Health - Average number of teeth
Pesticide Use - Households using pesticides to control insects (%)
Pesticide Use - Households using pesticides to kill weeds (%)
Physical Activity - People doing vigorous-intensity work activities (%)
Physical Activity - People doing moderate-intensity work activities (%)
Physical Activity - People walking or bicycling (%)
Physical Activity - People doing vigorous-intensity recreational activities (%)
Physical Activity - People doing moderate-intensity recreational activities (%)
Physical Activity - Average hours a day doing sedentary activities
Physical Activity - Average hours a day watching TV or videos
Physical Activity - Average hours a day using computer
Physical Functioning - People having limitations keeping them from working (%)
Physical Functioning - People limited in amount of work they can do (%)
Physical Functioning - People that need special equipment to walk (%)
Physical Functioning - People experiencing confusion/memory problems (%)
Physical Functioning - People requiring special healthcare equipment (%)
Prescription Medications - Average number of prescription medicines taking
Preventive Aspirin Use - Adults 40+ taking low-dose aspirin (%)
Reproductive Health - Vaginal deliveries (%)
Reproductive Health - Cesarean deliveries (%)
Reproductive Health - Deliveries resulted in a live birth (%)
Reproductive Health - Pregnancies resulted in a delivery (%)
Reproductive Health - Women breastfeeding newborns (%)
Reproductive Health - Women that had a hysterectomy (%)
Reproductive Health - Women that had both ovaries removed (%)
Reproductive Health - Women that have ever taken birth control pills (%)
Reproductive Health - Women taking birth control pills (%)
Reproductive Health - Women that have ever used Depo-Provera or injectables (%)
Reproductive Health - Women that have ever used female hormones (%)
Sexual Behavior - People 18+ that ever had sex (vaginal, anal, or oral) (%)
Sexual Behavior - Males 18+ that ever had vaginal sex with a woman (%)
Sexual Behavior - Males 18+ that ever performed oral sex on a woman (%)
Sexual Behavior - Males 18+ that ever had anal sex with a woman (%)
Sexual Behavior - Males 18+ that ever had any sex with a man (%)
Sexual Behavior - Females 18+ that ever had vaginal sex with a man (%)
Sexual Behavior - Females 18+ that ever performed oral sex on a man (%)
Sexual Behavior - Females 18+ that ever had anal sex with a man (%)
Sexual Behavior - Females 18+ that ever had any kind of sex with a woman (%)
Sexual Behavior - Average age people first had sex
Sexual Behavior - Average number of female sex partners in lifetime (males 18+)
Sexual Behavior - Average number of female vaginal sex partners in lifetime (males 18+)
Sexual Behavior - Average age people first performed oral sex on a woman (18+)
Sexual Behavior - Average number of woman performed oral sex on in lifetime (18+)
Sexual Behavior - Average number of male sex partners in lifetime (males 18+)
Sexual Behavior - Average number of male anal sex partners in lifetime (males 18+)
Sexual Behavior - Average age people first performed oral sex on a man (18+)
Sexual Behavior - Average number of male oral sex partners in lifetime (18+)
Sexual Behavior - People using protection when performing oral sex (%)
Sexual Behavior - Average number of times people have vaginal or anal sex a year
Sexual Behavior - People having sex without condom (%)
Sexual Behavior - Average number of male sex partners in lifetime (females 18+)
Sexual Behavior - Average number of male vaginal sex partners in lifetime (females 18+)
Sexual Behavior - Average number of female sex partners in lifetime (females 18+)
Sexual Behavior - Circumcised males 18+ (%)
Sleep Disorders - Average hours sleeping at night
Sleep Disorders - People that has trouble sleeping (%)
Smoking-Cigarette Use - People smoking cigarettes (%)
Taste & Smell - People 40+ having problems with smell (%)
Taste & Smell - People 40+ having problems with taste (%)
Taste & Smell - People 40+ that ever had wisdom teeth removed (%)
Taste & Smell - People 40+ that ever had tonsils teeth removed (%)
Taste & Smell - People 40+ that ever had a loss of consciousness because of a head injury (%)
Taste & Smell - People 40+ that ever had a broken nose or other serious injury to face or skull (%)
Taste & Smell - People 40+ that ever had two or more sinus infections (%)
Weight - Average height (inches)
Weight - Average weight (pounds)
Weight - Average BMI
Weight - People that are obese (%)
Weight - People that ever were obese (%)
Weight - People trying to lose weight (%)
Officers per 1,000 residents here:
2.38Florida average:
2.33
Latest news from Longwood, FL collected exclusively by city-data.com from local newspapers, TV, and radio stations
Ancestries: American (23.9%), English (6.2%), Italian (4.8%), Irish (3.9%), German (3.8%), European (2.9%).
Current Local Time:
Land area: 5.32 square miles.
Population density: 3,166 people per square mile (average).
2,309 residents are foreign born (8.4% Latin America , 2.7% Europe , 2.4% Asia ).
This city:
14.5%Florida:
21.1%
Median real estate property taxes paid for housing units with mortgages in 2022: $2,095 (0.6%)Median real estate property taxes paid for housing units with no mortgage in 2022: $1,819 (0.5%)
Nearest city with pop. 50,000+: Orlando, FL
Nearest city with pop. 200,000+: Tampa, FL
Nearest city with pop. 1,000,000+: Houston, TX
Nearest cities:
Latitude: 28.70 N, Longitude: 81.35 W
Daytime population change due to commuting: +7,682 (+48.4%)Workers who live and work in this city: 2,797 (33.9%)
Property values in Longwood, FL
Longwood tourist attractions:
Single-family new house construction building permits:
2022: 15 buildings , average cost: $183,6002021: 30 buildings , average cost: $259,9002020: 50 buildings , average cost: $291,7002019: 70 buildings , average cost: $319,0002018: 81 buildings , average cost: $304,8002017: 41 buildings , average cost: $318,6002016: 20 buildings , average cost: $282,8002015: 16 buildings , average cost: $144,6002014: 26 buildings , average cost: $159,7002013: 5 buildings , average cost: $189,8002012: 2 buildings , average cost: $112,5002009: 1 building , cost: $221,6002007: 15 buildings , average cost: $166,8002006: 69 buildings , average cost: $208,8002005: 25 buildings , average cost: $146,6002004: 10 buildings , average cost: $142,0002003: 12 buildings , average cost: $127,9002002: 22 buildings , average cost: $101,2002001: 15 buildings , average cost: $95,9002000: 15 buildings , average cost: $132,0001999: 35 buildings , average cost: $129,5001998: 72 buildings , average cost: $113,7001997: 68 buildings , average cost: $111,700Unemployment in December 2023:
Population change in the 1990s: +590 (+4.5%).
Most common occupations in Longwood, FL (%)
Both Males Females
Other office and administrative support workers, including supervisors (5.2%)
Other management occupations, except farmers and farm managers (4.9%)
Other sales and related occupations, including supervisors (4.6%)
Sales representatives, services, wholesale and manufacturing (4.0%)
Electrical equipment mechanics and other installation, maintenance, and repair workers, including supervisors (3.9%)
Computer specialists (3.5%)
Secretaries and administrative assistants (3.2%)
Electrical equipment mechanics and other installation, maintenance, and repair workers, including supervisors (6.9%)
Other management occupations, except farmers and farm managers (6.1%)
Driver/sales workers and truck drivers (5.3%)
Computer specialists (5.2%)
Sales representatives, services, wholesale and manufacturing (5.1%)
Other sales and related occupations, including supervisors (4.8%)
Building and grounds cleaning and maintenance occupations (4.2%)
Other office and administrative support workers, including supervisors (8.6%)
Secretaries and administrative assistants (6.8%)
Information and record clerks, except customer service representatives (5.5%)
Registered nurses (5.3%)
Other sales and related occupations, including supervisors (4.3%)
Preschool, kindergarten, elementary, and middle school teachers (3.9%)
Other management occupations, except farmers and farm managers (3.6%)
Tornado activity:
Longwood-area historical tornado activity is slightly above Florida state average. It is 44% greater than the overall U.S. average.
On 2/22/1998, a category F3 (max. wind speeds 158-206 mph) tornado 0.3 miles away from the Longwood city center killed 13 people and injured 36 people and caused $31 million in damages.
On 2/22/1998, a category F3 tornado 8.1 miles away from the city center killed 3 people and injured 70 people and caused $15 million in damages.
Earthquake activity:
Longwood-area historical earthquake activity is significantly above Florida state average. It is 88% smaller than the overall U.S. average. On 9/10/2006 at 14:56:08, a magnitude 5.9 (5.9 MB, 5.5 MS, 5.8 MW, Class: Moderate, Intensity: VI - VII) earthquake occurred 365.9 miles away from Longwood center On 11/22/1974 at 05:25:55, a magnitude 4.7 (4.7 MB, Class: Light, Intensity: IV - V) earthquake occurred 299.0 miles away from the city center On 6/23/2016 at 17:20:29, a magnitude 3.8 (3.8 ML, Class: Light, Intensity: II - III) earthquake occurred 145.1 miles away from Longwood center On 9/4/2016 at 18:29:29, a magnitude 3.8 (3.8 ML) earthquake occurred 145.2 miles away from the city center On 9/21/2016 at 16:30:52, a magnitude 3.8 (3.8 ML) earthquake occurred 146.0 miles away from the city center On 7/16/2016 at 20:00:10, a magnitude 3.7 (3.7 MB) earthquake occurred 136.8 miles away from Longwood center Magnitude types: body-wave magnitude (MB), local magnitude (ML), surface-wave magnitude (MS), moment magnitude (MW) Natural disasters: The number of natural disasters in Seminole County (20) is greater than the US average (15).Major Disasters (Presidential) Declared: 10Emergencies Declared: 5Hurricanes: 11, Fires: 4, Tropical Storms: 3, Tornadoes: 2, Storm: 1, Other: 1 (Note: some incidents may be assigned to more than one category). Main business address for: EMPIRE FINANCIAL HOLDING CO SECURITY BROKERS, DEALERS & FLOTATION COMPANIES ).
Hospitals and medical centers in Longwood: SOUTH SEMINOLE COMMUNITY HOSPITAL (555 WEST STATE ROAD 434) WEST LAKE HOSPITAL (589 WEST STATE ROAD 434) ISLAND LAKE CENTER (155 LANDOVER PLACE)
LONGWOOD HEALTH CARE CENTER (1520 S GRANT ST)
VILLAGE ON THE GREEN (500 VILLAGE PLACE)
CENTRAL FLORIDA KIDNEY CENTER - LONGWOOD (745 W SR 434 STE A)
CENTRAL FLORIDA HOME HEALTH LLC (1200 W STATE RD 434)
CONFI CARE HOME HEALTH SOLUTIONS LLC (1425 W SR 434 STE 101)
Amtrak stations near Longwood: 8 miles: WINTER PARK (150 W. MORSE BLVD.) Services: ticket office, partially wheelchair accessible, enclosed waiting area, public restrooms, public payphones, full-service food facilities, free short-term parking, free long-term parking, call for car rental service, taxi stand, public transit connection.
8 miles: SANFORD (800 PERSIMMON AVE.) Services: enclosed waiting area, public restrooms, public payphones, vending machines, free short-term parking, free long-term parking, call for taxi service.
9 miles: SANFORD (AUTO-TRAIN) (SANFORD, 600 PERSIMMON AVE.) Services: ticket office, fully wheelchair accessible, enclosed waiting area, public restrooms, public payphones, snack bar, free short-term parking.
Colleges/universities with over 2000 students nearest to Longwood:
Seminole State College of Florida (about 4 miles; Sanford, FL ; Full-time enrollment: 14,124)
Rollins College (about 8 miles; Winter Park, FL ; FT enrollment: 3,085)
Full Sail University (about 8 miles; Winter Park, FL ; FT enrollment: 31,435)
University of Central Florida (about 12 miles; Orlando, FL ; FT enrollment: 51,457)
Florida Technical College (about 13 miles; Orlando, FL ; FT enrollment: 4,907)
Valencia College (about 15 miles; Orlando, FL ; FT enrollment: 30,467)
Everest University-South Orlando (about 20 miles; Orlando, FL ; FT enrollment: 33,859)
Public high schools in Longwood: LYMAN HIGH SCHOOL Students: 1,193, Location: 865 S RONALD REAGAN BLVD, Grades: PK-12)SOUTH SEMINOLE HOSPITAL Location: 555 WEST STATE RD 434, Grades: KG-12)
Private high school in Longwood: PACE BRANTLEY SCHOOL Students: 132, Location: 3221 SAND LAKE RD, Grades: UG-12)
Public elementary/middle schools in Longwood: MILWEE MIDDLE SCHOOL Students: 597, Location: 1341 S RONALD REAGAN BLVD, Grades: 5-8)WEKIVA ELEMENTARY SCHOOL Students: 419, Location: 1450 E WEKIVA TRL, Grades: PK-5)WOODLANDS ELEMENTARY SCHOOL Students: 405, Location: 1420 EE WILLIAMSON RD, Grades: PK-5)SABAL POINT ELEMENTARY SCHOOL Students: 398, Location: 960 WEKIVA SPRINGS RD, Grades: PK-5)ROCK LAKE MIDDLE SCHOOL Students: 279, Location: 250 SLADE DR, Grades: 6-8)SEMINOLE ACADEMY OF DIGITAL LEARNING Location: 840 ORANGE AVE, Grades: KG-5)
Private elementary/middle schools in Longwood: SWEETWATER EPISCOPAL ACADEMY Students: 179, Location: 251 E LAKE BRANTLEY DR, Grades: PK-5)
MARKHAM WOODS CHRISTIAN ACADEMY Students: 89, Location: 1675 DIXON RD, Grades: PK-8)
OAK ARBOR CHRISTIAN SCHOOL Students: 46, Location: 1902 LONGWOOD LAKE MARY RD, Grades: PK-2)
See full list of schools located in Longwood
Notable locations in Longwood: (A) , Longwood Industrial Park (B) , Sanford-Orlando Kennel Club (C) , Florida Commerce Park (D) , Longwood Fire Marshal's Office (E) , Longwood Fire Department Station 15 (F) , Longwood Fire Department Station 17 (G) , Longwood Police Department (H) . Display/hide their locations on the map
Shopping Centers: (1) , Longwood Lakes Shopping Center (2) , Fairmont Plaza Shopping Center (3) . Display/hide their locations on the map
Churches in Longwood include: (A) , Episcopal Church of the Resurrection (B) , Wekiva Presbyterian Church (C) , Longwood Church of the Nazarene (D) , First United Pentecostal Church of Longwood (E) , Markham Woods Seventh Day Adventist Church (F) , Mount Olive Church (G) , First Baptist Church of Longwood (H) , Christ Episcopal Church (I) . Display/hide their locations on the map
Cemetery: (1) . Display/hide its location on the map
Lakes: (A) , Lake Jane (B) , East Lake (C) , Lake Evergreen (D) , Lake Fairy (E) , Lake Searcy (F) , Fern Lake (G) , Lake Wayman (H) . Display/hide their locations on the map
Tourist attractions:
Hotels:
Birthplace of: Graham Zusi - Soccer player, Adam Kluger - Music industry executive, Nick Sowers - Soccer player, Robert Kass - College football player (East Carolina Pirates).
Seminole County has a predicted average indoor radon screening level less than 2 pCi/L (pico curies per liter) - Low Potential Drinking water stations with addresses in Longwood and their reported violations in the past:
FLORIDA GOVERNMENTAL UTILITY AUTHORITY (Population served: 29,656, Groundwater):
Past health violations:
MCL, Average - Between APR-2007 and JUN-2007, Contaminant: TTHM. Follow-up actions: St Violation/Reminder Notice (JUL-16-2007), St Compliance achieved (AUG-28-2008)
MCL, Average - Between JAN-2007 and MAR-2007, Contaminant: TTHM. Follow-up actions: St Violation/Reminder Notice (APR-10-2007), St Compliance achieved (AUG-28-2008)
MCL, Average - Between OCT-2006 and DEC-2006, Contaminant: TTHM. Follow-up actions: St Violation/Reminder Notice (JAN-26-2007), St Compliance achieved (AUG-28-2008)
MCL, Average - Between JUL-2006 and SEP-2006, Contaminant: TTHM. Follow-up actions: St Violation/Reminder Notice (OCT-03-2006), St Compliance achieved (AUG-28-2008)
Past monitoring violations:
Monitoring and Reporting (DBP) - Between JAN-2008 and MAR-2008, Contaminant: Total Haloacetic Acids (HAA5). Follow-up actions: St Violation/Reminder Notice (MAY-01-2008), St Compliance achieved (2 times from MAY-21-2008 to AUG-28-2008)
Monitoring and Reporting (DBP) - Between APR-2007 and JUN-2007, Contaminant: TTHM. Follow-up actions: St Violation/Reminder Notice (2 times from OCT-03-2006 to JUL-16-2007), St Public Notif requested (JUL-16-2007), St Public Notif received (SEP-24-2007), St Compliance achieved (AUG-28-2008)
One routine major monitoring violation
Population served: 8,136, Purch surface water):
Past health violations:
MCL, Monthly (TCR) - In MAR-2005, Contaminant: Coliform. Follow-up actions: St Public Notif received (2 times from JUN-13-2005 to AUG-20-2005)
Past monitoring violations:
Failure to Conduct Assessment Monitoring - In MAY-2013, Contaminant: E. COLI
Failure Submit IDSE/Subpart V Plan Rpt - In JAN-02-2009, Contaminant: DBP STAGE 2. Follow-up actions: Fed Compliance achieved (NOV-20-2009)
Population served: 3,863, Groundwater):
Past health violations:
MCL, Monthly (TCR) - In JUL-2012, Contaminant: Coliform. Follow-up actions: St Public Notif requested (AUG-10-2012), St Compliance achieved (AUG-27-2012), St Public Notif received (AUG-27-2012)
MCL, Average - Between OCT-2009 and DEC-2009, Contaminant: TTHM. Follow-up actions: St BCA signed (AUG-10-2009), St Public Notif received (JAN-22-2010), St Compliance achieved (DEC-22-2010)
MCL, Average - Between OCT-2008 and DEC-2008, Contaminant: TTHM. Follow-up actions: St BCA signed (JAN-04-2007), St Public Notif received (JAN-22-2009), St BCA signed (AUG-10-2009), St Compliance achieved (DEC-22-2010)
MCL, Average - Between JUL-2008 and SEP-2008, Contaminant: TTHM. Follow-up actions: St BCA signed (JAN-04-2007), St Public Notif received (OCT-28-2008), St BCA signed (AUG-10-2009), St Compliance achieved (DEC-22-2010)
MCL, Monthly (TCR) - In APR-2008, Contaminant: Coliform. Follow-up actions: St Violation/Reminder Notice (MAY-09-2008), St Public Notif received (MAY-27-2008), St Compliance achieved (JUN-04-2008)
MCL, Average - Between APR-2008 and JUN-2008, Contaminant: TTHM. Follow-up actions: St BCA signed (JAN-04-2007), St Violation/Reminder Notice (JUL-18-2008), St Public Notif received (JUL-21-2008), St BCA signed (AUG-10-2009), St Compliance achieved (DEC-22-2010)
9 other older health violations
Past monitoring violations:
Failure Submit IDSE/Subpart V Plan Rpt - In JUL-02-2010, Contaminant: DBP STAGE 2. Follow-up actions: Fed FAO issued (OCT-27-2011), Fed Compliance achieved (DEC-01-2011)
Monitoring, Routine (IDSE) - In APR-02-2008, Contaminant: DBP STAGE 2. Follow-up actions: Fed FAO issued (FEB-02-2009), Fed Compliance achieved (MAR-16-2009)
Population served: 2,554, Groundwater):
Past health violations:
MCL, Monthly (TCR) - In AUG-2011, Contaminant: Coliform. Follow-up actions: St Violation/Reminder Notice (OCT-05-2011), St Public Notif received (JAN-20-2012)
Past monitoring violations:
Monitoring, Source Water (GWR) - In JUL-01-2013, Contaminant: E. COLI
Monitoring and Reporting (DBP) - Between JUL-2012 and SEP-2012, Contaminant: Total Haloacetic Acids (HAA5). Follow-up actions: St Violation/Reminder Notice (NOV-05-2012)
Monitoring and Reporting (DBP) - Between JUL-2012 and SEP-2012, Contaminant: TTHM. Follow-up actions: St Violation/Reminder Notice (NOV-05-2012)
One minor monitoring violation
Population served: 1,257, Purch surface water):
Past monitoring violations:
One minor monitoring violation
Population served: 880, Groundwater):
Past health violations:
MCL, Monthly (TCR) - In OCT-2011, Contaminant: Coliform. Follow-up actions: St Public Notif received (NOV-21-2011), St Violation/Reminder Notice (DEC-15-2011)
Population served: 843, Groundwater):
Past health violations:
MCL, Monthly (TCR) - In APR-2009, Contaminant: Coliform. Follow-up actions: St Tech Assistance Visit (MAY-06-2009), St Public Notif received (MAY-07-2009), St Compliance achieved (MAY-20-2009)
Past monitoring violations:
Failure Submit IDSE/Subpart V Plan Rpt - In JUL-02-2010, Contaminant: DBP STAGE 2. Follow-up actions: Fed FAO issued (OCT-27-2011), Fed Compliance achieved (DEC-01-2011)
Population served: 763, Groundwater):
Past health violations:
MCL, Monthly (TCR) - In JUL-2012, Contaminant: Coliform. Follow-up actions: St Public Notif requested (JUL-18-2012), St Public Notif received (AUG-27-2012), St Compliance achieved (AUG-31-2012)
Past monitoring violations:
Failure Submit IDSE/Subpart V Plan Rpt - In JUL-02-2010, Contaminant: DBP STAGE 2. Follow-up actions: Fed FAO issued (OCT-27-2011), Fed Compliance achieved (DEC-01-2011)
Monitoring, Routine (IDSE) - Between JAN-2010 and MAR-2010, Contaminant: Total Haloacetic Acids (HAA5). Follow-up actions: Fed FAO issued (OCT-27-2011), Fed Compliance achieved (DEC-01-2011)
Monitoring, Routine (IDSE) - Between JAN-2010 and MAR-2010, Contaminant: TTHM. Follow-up actions: Fed FAO issued (OCT-27-2011), Fed Compliance achieved (DEC-01-2011)
Monitoring, Routine (IDSE) - Between OCT-2009 and DEC-2009, Contaminant: Total Haloacetic Acids (HAA5). Follow-up actions: Fed FAO issued (OCT-27-2011), Fed Compliance achieved (DEC-01-2011)
Monitoring, Routine (IDSE) - Between OCT-2009 and DEC-2009, Contaminant: TTHM. Follow-up actions: Fed FAO issued (OCT-27-2011), Fed Compliance achieved (DEC-01-2011)
4 other older monitoring violations
Drinking water stations with addresses in Longwood that have no violations reported:
FLORIDA GOVERNMENTAL UTILITY AUTHORITY (Address: SUITE 2000 Population served: 15,381, Primary Water Source Type: Groundwater)
COLONIAL MANOR WATER SYSTEM (Population served: 1,780, Primary Water Source Type: Purch surface water)
ANGUS VALLEY (Population served: 1,500, Primary Water Source Type: Groundwater)
CARLTON VILLAGE (Population served: 577, Primary Water Source Type: Groundwater)
GIBSONIA ESTATES WATER SYSTEM (Population served: 414, Primary Water Source Type: Groundwater)
FAIRFAX HILLS SUBDIVISION (Address: SUITE 2000 Population served: 287, Primary Water Source Type: Groundwater)
FERN TERRACE SUBDIVISION (Population served: 286, Primary Water Source Type: Groundwater)
BREEZE HILL MOBILE HOME PARK (Population served: 279, Primary Water Source Type: Groundwater)
GRAND TERRACE SUBDIVISION (Population served: 256, Primary Water Source Type: Groundwater)
FORTY-EIGHT ESTATES (Population served: 87, Primary Water Source Type: Groundwater)
Average household size: This city:
2.5 peopleFlorida:
2.5 people
Percentage of family households: This city:
67.3%Whole state:
65.2%
Percentage of households with unmarried partners: This city:
8.4%Whole state:
7.3%
Likely homosexual households (counted as self-reported same-sex unmarried-partner households)
Lesbian couples: 0.6% of all households Gay men: 0.4% of all households
258 people in nursing facilities/skilled-nursing facilities in 2010people in group homes for juveniles (non-correctional) in 2010People in group quarters in Longwood in 2000:
141 people in nursing homes
97 people in other nonhousehold living situations
21 people in other noninstitutional group quarters
Banks with most branches in Longwood (2011 data):
Bank of America, National Association: Longwood Florida Central Pkwy Branch, Range Line Road Branch, Longwood West Branch. Info updated 2009/11/18: Bank assets: $1,451,969.3 mil, Deposits: $1,077,176.8 mil, headquarters in Charlotte, NC, positive income , 5782 total offices , Holding Company: Bank Of America Corporation
Branch Banking and Trust Company: Longwood West Branch at 2127 West State Road 434, branch established on 1933/10/01; Longwood East Branch at 801 East State Road 434, branch established on 1994/10/17. Info updated 2010/03/29: Bank assets: $168,867.6 mil, Deposits: $127,549.5 mil, headquarters in Winston Salem, NC, positive income , Commercial Lending Specialization, 1793 total offices , Holding Company: Bb&T Corporation
Regions Bank: East Longwood Branch at 795 W State Road 434, branch established on 2004/03/15; Spring Plaza Branch at 125 Wekivia Spring Road, branch established on 1999/11/01. Info updated 2011/02/24: Bank assets: $123,368.2 mil, Deposits: $98,301.3 mil, headquarters in Birmingham, AL, positive income , Commercial Lending Specialization, 1778 total offices , Holding Company: Regions Financial Corporation
TrustCo Bank: Longwood Branch at 1400 West State Rd 434, branch established on 2003/03/17; Sweetwater Branch at 671 North Hunt Club Rd, branch established on 2008/09/23. Info updated 2011/07/21: Bank assets: $4,250.1 mil, Deposits: $3,736.0 mil, headquarters in Glenville, NY, positive income , Mortgage Lending Specialization, 135 total offices
New Traditions National Bank: Longwood Messenger Service Branch at 505 Wekiva Springs Road, Suite 700, branch established on 2012/01/23; Longwood Branch at 505 Wekiva Springs Road, Suite 700, branch established on 2012/01/23. Info updated 2009/05/18: Bank assets: $441.2 mil, Deposits: $356.1 mil, headquarters in Orlando, FL, positive income , Commercial Lending Specialization, 5 total offices
SunTrust Bank: Longwood Branch at 860 W State Road 434, branch established on 1979/07/16; Sweetwater Branch at 701 Miami Springs Drive, branch established on 1983/12/19. Info updated 2010/05/27: Bank assets: $171,291.7 mil, Deposits: $129,833.2 mil, headquarters in Atlanta, GA, positive income , Commercial Lending Specialization, 1716 total offices , Holding Company: Suntrust Banks, Inc.
Fifth Third Bank: Highlands Branch at 107 N. Highway 17-92, branch established on 2007/03/12; Longwood Branch at 1199 Spring Centre South, branch established on 1999/08/02. Info updated 2009/10/05: Bank assets: $114,540.4 mil, Deposits: $89,689.1 mil, headquarters in Cincinnati, OH, positive income , Commercial Lending Specialization, 1378 total offices , Holding Company: Fifth Third Bancorp
JPMorgan Chase Bank, National Association: 929 W Hwy 434 Springs Plaza Branch at 929 West Highway 434, branch established on 1933/01/01. Info updated 2011/11/10: Bank assets: $1,811,678.0 mil, Deposits: $1,190,738.0 mil, headquarters in Columbus, OH, positive income , International Specialization, 5577 total offices , Holding Company: Jpmorgan Chase & Co.
TD Bank, National Association: Longwood Office at 2675 W. State Road 434, branch established on 1997/03/18. Info updated 2010/10/04: Bank assets: $188,912.6 mil, Deposits: $153,149.8 mil, headquarters in Wilmington, DE, positive income , 1314 total offices , Holding Company: Toronto-Dominion Bank, The
11 other banks with 11 local branches
For population 15 years and over in Longwood:
Never married: 28.1%Now married: 46.7%Separated: 0.7%Widowed: 9.0%Divorced: 15.4% For population 25 years and over in Longwood:
High school or higher: 91.4%Bachelor's degree or higher: 31.1%Graduate or professional degree: 8.9%Unemployed: 3.0%Mean travel time to work (commute): 21.4 minutes
Education Gini index (Inequality in education) Here:
11.5Florida average:
12.2
Religion statistics for Longwood, FL (based on Seminole County data)
Religion Adherents Congregations Evangelical Protestant 73,592 186 Catholic 67,501 8 Mainline Protestant 17,514 38 Other 9,121 28 Black Protestant 3,240 21 Orthodox 1,104 2 None 250,646 -
Source: Clifford Grammich, Kirk Hadaway, Richard Houseal, Dale E.Jones, Alexei Krindatch, Richie Stanley and Richard H.Taylor. 2012. 2010 U.S.Religion Census: Religious Congregations & Membership Study. Association of Statisticians of American Religious Bodies. Jones, Dale E., et al. 2002. Congregations and Membership in the United States 2000. Nashville, TN: Glenmary Research Center. Graphs represent county-level data
Food Environment Statistics: Number of grocery stores : 63Here :
1.54 / 10,000 pop.State :
2.04 / 10,000 pop.
Number of supercenters and club stores : 5This county :
0.12 / 10,000 pop.Florida :
0.11 / 10,000 pop.
Number of convenience stores (no gas) : 44Seminole County :
1.08 / 10,000 pop.Florida :
1.28 / 10,000 pop.
Number of convenience stores (with gas) : 121Seminole County :
2.96 / 10,000 pop.Florida :
3.04 / 10,000 pop.
Number of full-service restaurants : 328Seminole County :
8.03 / 10,000 pop.Florida :
7.45 / 10,000 pop.
Adult diabetes rate : Seminole County :
8.4%Florida :
9.2%
Adult obesity rate : This county :
24.2%Florida :
23.7%
Low-income preschool obesity rate : Seminole County :
12.7%State :
14.0%
Health and Nutrition: Healthy diet rate : Longwood:
51.0%State:
51.4%
Average overall health of teeth and gums : Longwood:
49.0%State:
49.4%
People feeling badly about themselves : This city:
21.1%State:
19.5%
People not drinking alcohol at all : Average hours sleeping at night : Overweight people : Longwood:
34.8%Florida:
34.7%
General health condition : This city:
57.5%Florida:
57.0%
Average condition of hearing : This city:
79.7%Florida:
79.2%
More about Health and Nutrition of Longwood, FL Residents
Local government employment and payroll (March 2022)
Function
Full-time employees
Monthly full-time payroll
Average yearly full-time wage
Part-time employees
Monthly part-time payroll
Police Protection - Officers
41 $213,207 $62,402 0 $0 Firefighters
38 $229,420 $72,448 0 $0 Water Supply
15 $59,954 $47,963 0 $0 Streets and Highways
15 $64,531 $51,625 0 $0 Other Government Administration
14 $65,054 $55,761 0 $0 Financial Administration
10 $57,764 $69,317 0 $0 Parks and Recreation
8 $35,801 $53,702 5 $5,939 Housing and Community Development (Local)
7 $38,061 $65,247 0 $0 Police - Other
6 $31,994 $63,988 0 $0 Other and Unallocable
6 $30,847 $61,694 1 $1,829 Fire - Other
3 $22,767 $91,068 0 $0
Totals for Government
163 $849,400 $62,533 6 $7,768
Longwood government finances - Expenditure in 2018 (per resident):
Current Operations - Police Protection: $4,385,000 ($260.36)
Local Fire Protection: $3,713,000 ($220.46)Water Utilities: $2,533,000 ($150.40)Financial Administration: $2,290,000 ($135.97)Regular Highways: $1,773,000 ($105.27)Central Staff Services: $1,260,000 ($74.81)Solid Waste Management: $1,031,000 ($61.22)Parks and Recreation: $993,000 ($58.96)Protective Inspection and Regulation - Other: $290,000 ($17.22)General - Interest on Debt: $253,000 ($15.02)
Other Capital Outlay - Water Utilities: $5,221,000 ($310.00)
Regular Highways: $5,200,000 ($308.75)Parks and Recreation: $1,516,000 ($90.01)Local Fire Protection: $442,000 ($26.24)Police Protection: $364,000 ($21.61)Financial Administration: $1,000 ($0.06)
Longwood government finances - Revenue in 2018 (per resident):
Charges - Solid Waste Management: $1,118,000 ($66.38)
Other: $746,000 ($44.29)Parks and Recreation: $186,000 ($11.04)Federal Intergovernmental - Other: $246,000 ($14.61)
Local Intergovernmental - Other: $35,000 ($2.08)
General Local Government Support: $12,000 ($0.71)Miscellaneous - Special Assessments: $544,000 ($32.30)
General Revenue - Other: $202,000 ($11.99)Fines and Forfeits: $158,000 ($9.38)Sale of Property: $112,000 ($6.65)Interest Earnings: $86,000 ($5.11)Rents: $77,000 ($4.57)Donations From Private Sources: $5,000 ($0.30)Revenue - Water Utilities: $4,802,000 ($285.12)
State Intergovernmental - Sewerage: $2,129,000 ($126.41)
General Local Government Support: $1,450,000 ($86.09)Highways: $238,000 ($14.13)Other: $12,000 ($0.71)Tax - Property: $5,002,000 ($297.00)
Public Utilities Sales: $2,294,000 ($136.21)Occupation and Business License - Other: $1,752,000 ($104.03)Other License: $1,529,000 ($90.78)Other Selective Sales: $862,000 ($51.18)Motor Fuels Sales: $405,000 ($24.05)
Longwood government finances - Debt in 2018 (per resident):
Long Term Debt - Outstanding Unspecified Public Purpose: $11,640,000 ($691.13)
Issue, Unspecified Public Purpose: $9,900,000 ($587.82)Beginning Outstanding - Unspecified Public Purpose: $2,096,000 ($124.45)Retired Unspecified Public Purpose: $376,000 ($22.33)
Longwood government finances - Cash and Securities in 2018 (per resident):
Other Funds - Cash and Securities: $14,981,000 ($889.50)
10.72% of this county's 2021 resident taxpayers lived in other counties in 2020 ($59,508 average adjusted gross income )
Here:
10.72%Florida average:
8.80%
0.04% of residents moved from foreign countries ($172 average AGI )Seminole County:
0.04%Florida average:
0.05%
Top counties from which taxpayers relocated into this county between 2020 and 2021:
10.58% of this county's 2020 resident taxpayers moved to other counties in 2021 ($59,568 average adjusted gross income )
Here:
10.58%Florida average:
7.45%
0.04% of residents moved to foreign countries ($197 average AGI )Seminole County:
0.04%Florida average:
0.04%
Top counties to which taxpayers relocated from this county between 2020 and 2021:
Businesses in Longwood, FL
Name Count Name Count
7-Eleven 7 Long John Silver's 1 AMF Bowling 1 MasterBrand Cabinets 14 Ace Hardware 1 Mazda 1 Advance Auto Parts 1 McDonald's 2 Albertsons 1 New Balance 1 AutoZone 1 Nike 1 Bentleymotors.Com 1 Nissan 1 Burger King 2 Papa John's Pizza 1 CVS 2 Penske 2 Circle K 4 Pizza Hut 2 Decora Cabinetry 2 Publix Super Markets 2 Domino's Pizza 1 RadioShack 1 Dunkin Donuts 1 SONIC Drive-In 1 FedEx 11 Sprint Nextel 1 Firestone Complete Auto Care 1 Starbucks 1 H&R Block 1 Subway 3 Jimmy John's 1 T-Mobile 1 JoS. A. Bank 1 Tire Kingdom 1 Jones New York 2 U-Haul 2 KFC 1 UPS 15 Kincaid 1 Walgreens 1 Lane Furniture 1
Strongest AM radio stations in Longwood:
WORL (660 AM; 5 kW; ALTAMONTE SPRINGS, FL; Owner: JAMES CRYSTAL ORLANDO, INC.)
WDYZ (990 AM; 50 kW; ORLANDO, FL; Owner: ABC, INC.)
WONQ (1030 AM; 45 kW; OVIEDO, FL; Owner: FLORIDA BROADCASTERS)
WDBO (580 AM; 5 kW; ORLANDO, FL; Owner: COX RADIO, INC.)
WQTM (740 AM; 50 kW; ORLANDO, FL; Owner: CLEAR CHANNEL BROADCASTING LICENSES, INC.)
WTLN (950 AM; 12 kW; ORLANDO, FL; Owner: TM2, INC.)
WIXC (1060 AM; 50 kW; TITUSVILLE, FL; Owner: GENESIS COMMUNICATIONS I, INC.)
WFLF (540 AM; 50 kW; PINE HILLS, FL; Owner: CLEAR CHANNEL BROADCASTING LICENSES, INC.)
WPRD (1440 AM; 5 kW; WINTER PARK, FL; Owner: J & V COMMUNICATIONS, INC.)
WHOO (1080 AM; daytime; 35 kW; KISSIMMEE, FL; Owner: GENESIS COMMUNICATIONS I, INC.)
WRMQ (1140 AM; 5 kW; ORLANDO, FL; Owner: FLORIDA BROADCASTERS)
WHIM (1520 AM; 5 kW; APOPKA, FL; Owner: ALTON RAINBOW CORPORATION)
WRLZ (1270 AM; 5 kW; EATONVILLE, FL; Owner: RADIO LUZ, INC.)
Strongest FM radio stations in Longwood:
WMGF (107.7 FM; MOUNT DORA, FL; Owner: CLEAR CHANNEL BROADCASTING LICENSES, INC.)
WOMX-FM (105.1 FM; ORLANDO, FL; Owner: INFINITY RADIO OPERATIONS INC.)
WXXL (106.7 FM; TAVARES, FL; Owner: AMFM RADIO LICENSES, L.L.C.)
WJRR (101.1 FM; COCOA BEACH, FL; Owner: CLEAR CHANNEL BROADCASTING LICENSES, INC.)
WSHE (100.3 FM; ORLANDO, FL; Owner: CLEAR CHANNEL BROADCASTING LICENSES, INC.)
WTKS-FM (104.1 FM; COCOA BEACH, FL; Owner: CLEAR CHANNEL BROADCASTING LICENSES, INC.)
WOCL (105.9 FM; DELAND, FL; Owner: INFINITY RADIO OPERATIONS INC.)
WPOZ (88.3 FM; UNION PARK, FL; Owner: CENTRAL FLORIDA EDUCATIONAL FOUNDATION, INC.)
WHTQ (96.5 FM; ORLANDO, FL; Owner: COX RADIO, INC.)
WWKA (92.3 FM; ORLANDO, FL; Owner: COX RADIO, INC.)
WCFB (94.5 FM; DAYTONA BEACH, FL; Owner: COX RADIO, INC.)
WPYO (95.3 FM; APOPKA, FL; Owner: CXR HOLDINGS, INC.)
WUCF-FM (89.9 FM; ORLANDO, FL; Owner: UNIVERSITY OF CENTRAL FLORIDA)
WMMO (98.9 FM; ORLANDO, FL; Owner: COX RADIO, INC.)
WJHM (101.9 FM; DAYTONA BEACH, FL; Owner: INFINITY RADIO OPERATIONS INC.)
WMFE-FM (90.7 FM; ORLANDO, FL; Owner: COMMUNITY COMMUNICATIONS, INC.)
WLOQ (103.1 FM; WINTER PARK, FL; Owner: GROSS COMMUNICATIONS CORPORATION)
WPCV (97.5 FM; WINTER HAVEN, FL; Owner: HALL COMMUNICATIONS, INC.)
WWKQ (88.7 FM; CLERMONT, FL; Owner: HISPANIC BROADCAST SYSTEM, INC.)
WPRK (91.5 FM; WINTER PARK, FL; Owner: ROLLINS COLLEGE)
TV broadcast stations around Longwood:
WZXZ-CA (Channel 11; ORLANDO, ETC., FL; Owner: THE BOX WORLDWIDE LLC)
WESH (Channel 2; DAYTONA BEACH, FL; Owner: ORLANDO HEARST-ARGYLE TELEVISION, INC.)
WXXU-LP (Channel 12; ALTAMONTE SPRINGS, FL; Owner: RAMA COMMUNICATIONS)
WKMG-TV (Channel 6; ORLANDO, FL; Owner: POST-NEWSWEEK STATIONS ORLANDO, INC.)
WFTV (Channel 9; ORLANDO, FL; Owner: WFTV-TV HOLDINGS, INC.)
WVEN-TV (Channel 26; DAYTONA BEACH, FL; Owner: ENTRAVISION HOLDINGS, LLC)
WRBW (Channel 65; ORLANDO, FL; Owner: FOX TELEVISION STATIONS, INC.)
WACX (Channel 55; LEESBURG, FL; Owner: ASSOCIATED CHRISTIAN TELEVISION SYSTEM, INC.)
WKCF (Channel 18; CLERMONT, FL; Owner: EMMIS TELEVISION LICENSE CORPORATION)
WLCB-TV (Channel 45; LEESBURG, FL; Owner: GOOD LIFE BROADCASTING, INC.)
WOFL (Channel 35; ORLANDO, FL; Owner: FOX TELEVISION STATIONS, INC.)
WMFE-TV (Channel 24; ORLANDO, FL; Owner: COMMUNITY COMMUNICATIONS, INC.)
W21AU (Channel 21; ORLANDO, FL; Owner: CENTRAL BROADCAST COMPANY)
WOKB-LP (Channel 7; ORLANDO, FL; Owner: RAMA COMMUNICATIONS)
WPXG-LP (Channel 31; ORLANDO, FL; Owner: TIGER EYE BROADCASTING CORPORATION)
WVCI-LP (Channel 16; ORLANDO, FL; Owner: ENTRAVISION HOLDINGS, LLC)
W47AL (Channel 47; ORLANDO, FL; Owner: CONCILIO MISSION CRISTIANA FUENTE)
WRCF-LP (Channel 29; ORLANDO, FL; Owner: CHARLES S. NAMEY)
WRDQ (Channel 27; ORLANDO, FL; Owner: WFTV-TV HOLDINGS, INC.)
WFOL-LP (Channel 4; ORLANDO, FL; Owner: NATIVE COUNTRY B/CING. CORPORATION)
WCEU (Channel 15; NEW SMYRNA BEACH, FL; Owner: DAYTONA BEACH COMMUNITY COLLEGE)
WTGL-TV (Channel 52; COCOA, FL; Owner: GOOD LIFE BROADCASTING, INC.)
WSWF-LP (Channel 13; UNION PARK, FL; Owner: SPECIALTY BROADCASTING CORPORATION)
WBCC (Channel 68; COCOA, FL; Owner: BREVARD COMMUNITY COLLEGE)
WOPX (Channel 56; MELBOURNE, FL; Owner: PAXSON ORLANDO LICENSE, INC.)
National Bridge Inventory (NBI) Statistics 1 Number of bridges34,000 Total average daily traffic1,020 Total average daily truck traffic
Home Mortgage Disclosure Act Aggregated Statistics For Year 2009(Based on 1 full and 9 partial tracts) A) FHA, FSA/RHS & VA B) Conventional C) Refinancings D) Home Improvement Loans F) Non-occupant Loans on Number Average Value Number Average Value Number Average Value Number Average Value Number Average Value
LOANS ORIGINATED 53 $167,278 34 $150,908 119 $157,091 5 $115,920 6 $110,445 APPLICATIONS APPROVED, NOT ACCEPTED 5 $141,746 4 $483,505 15 $159,513 0 $0 1 $53,560 APPLICATIONS DENIED 9 $144,168 8 $140,118 87 $167,989 3 $103,020 8 $150,324 APPLICATIONS WITHDRAWN 5 $181,264 2 $180,215 37 $165,963 1 $154,710 3 $106,400 FILES CLOSED FOR INCOMPLETENESS 2 $144,205 2 $61,865 11 $192,343 1 $54,290 2 $81,865
Aggregated Statistics For Year 2008(Based on 1 full and 9 partial tracts) A) FHA, FSA/RHS & VA B) Conventional C) Refinancings D) Home Improvement Loans F) Non-occupant Loans on G) Loans On Manufactured Number Average Value Number Average Value Number Average Value Number Average Value Number Average Value Number Average Value
LOANS ORIGINATED 38 $183,508 51 $175,382 143 $177,101 16 $100,487 28 $138,232 0 $0 APPLICATIONS APPROVED, NOT ACCEPTED 4 $185,728 9 $171,208 22 $177,970 7 $101,407 3 $168,910 0 $0 APPLICATIONS DENIED 11 $197,077 10 $179,972 112 $208,116 20 $104,277 12 $177,320 1 $34,920 APPLICATIONS WITHDRAWN 2 $242,430 6 $224,192 28 $167,089 5 $103,264 3 $131,453 0 $0 FILES CLOSED FOR INCOMPLETENESS 2 $189,700 2 $189,965 16 $182,803 0 $0 2 $151,190 0 $0
Aggregated Statistics For Year 2007(Based on 1 full and 9 partial tracts) A) FHA, FSA/RHS & VA B) Conventional C) Refinancings D) Home Improvement Loans F) Non-occupant Loans on G) Loans On Manufactured Number Average Value Number Average Value Number Average Value Number Average Value Number Average Value Number Average Value
LOANS ORIGINATED 11 $214,722 143 $202,597 294 $178,983 42 $103,715 55 $169,773 0 $0 APPLICATIONS APPROVED, NOT ACCEPTED 1 $159,040 22 $197,796 52 $191,275 10 $105,151 10 $178,206 1 $160,910 APPLICATIONS DENIED 3 $222,363 48 $207,503 157 $200,590 34 $117,565 16 $215,127 2 $329,335 APPLICATIONS WITHDRAWN 1 $188,260 18 $203,182 95 $177,991 11 $110,626 13 $169,178 0 $0 FILES CLOSED FOR INCOMPLETENESS 0 $0 8 $206,916 30 $206,449 1 $137,160 7 $184,260 0 $0
Aggregated Statistics For Year 2006(Based on 1 full and 9 partial tracts) A) FHA, FSA/RHS & VA B) Conventional C) Refinancings D) Home Improvement Loans E) Loans on Dwellings For 5+ Families F) Non-occupant Loans on G) Loans On Manufactured Number Average Value Number Average Value Number Average Value Number Average Value Number Average Value Number Average Value Number Average Value
LOANS ORIGINATED 4 $152,288 296 $180,321 413 $169,173 48 $109,318 0 $0 82 $161,330 2 $55,855 APPLICATIONS APPROVED, NOT ACCEPTED 0 $0 40 $166,455 58 $165,109 7 $65,780 0 $0 10 $156,403 1 $33,760 APPLICATIONS DENIED 1 $105,340 85 $170,978 166 $183,271 42 $79,912 0 $0 35 $139,513 3 $61,313 APPLICATIONS WITHDRAWN 0 $0 49 $218,737 142 $161,915 13 $139,998 1 $1,993,350 12 $168,196 0 $0 FILES CLOSED FOR INCOMPLETENESS 0 $0 17 $168,454 51 $173,928 1 $161,610 0 $0 3 $108,123 0 $0
Aggregated Statistics For Year 2005(Based on 1 full and 9 partial tracts) A) FHA, FSA/RHS & VA B) Conventional C) Refinancings D) Home Improvement Loans E) Loans on Dwellings For 5+ Families F) Non-occupant Loans on G) Loans On Manufactured Number Average Value Number Average Value Number Average Value Number Average Value Number Average Value Number Average Value Number Average Value
LOANS ORIGINATED 8 $141,009 357 $153,139 443 $149,646 54 $84,109 2 $680,605 107 $135,764 1 $92,420 APPLICATIONS APPROVED, NOT ACCEPTED 0 $0 29 $143,554 64 $134,672 10 $48,473 0 $0 7 $99,660 0 $0 APPLICATIONS DENIED 0 $0 87 $136,526 179 $144,150 44 $72,301 0 $0 27 $144,865 2 $85,560 APPLICATIONS WITHDRAWN 1 $241,190 55 $140,974 155 $143,648 21 $134,962 0 $0 16 $120,942 1 $50,630 FILES CLOSED FOR INCOMPLETENESS 0 $0 13 $168,025 76 $148,782 3 $58,527 0 $0 6 $172,272 0 $0
Aggregated Statistics For Year 2004(Based on 1 full and 9 partial tracts) A) FHA, FSA/RHS & VA B) Conventional C) Refinancings D) Home Improvement Loans F) Non-occupant Loans on G) Loans On Manufactured Number Average Value Number Average Value Number Average Value Number Average Value Number Average Value Number Average Value
LOANS ORIGINATED 24 $119,956 289 $133,891 353 $120,454 34 $64,076 82 $102,521 0 $0 APPLICATIONS APPROVED, NOT ACCEPTED 1 $179,990 37 $138,943 75 $117,959 9 $48,568 15 $96,432 0 $0 APPLICATIONS DENIED 4 $118,905 46 $143,544 178 $116,699 34 $55,208 21 $106,098 2 $30,340 APPLICATIONS WITHDRAWN 2 $161,790 32 $140,745 166 $125,491 13 $74,212 17 $134,495 0 $0 FILES CLOSED FOR INCOMPLETENESS 3 $103,337 12 $184,697 41 $137,640 4 $65,388 4 $81,082 0 $0
Aggregated Statistics For Year 2003(Based on 1 full and 9 partial tracts) A) FHA, FSA/RHS & VA B) Conventional C) Refinancings D) Home Improvement Loans E) Loans on Dwellings For 5+ Families F) Non-occupant Loans on Number Average Value Number Average Value Number Average Value Number Average Value Number Average Value Number Average Value
LOANS ORIGINATED 25 $111,042 264 $124,387 692 $114,694 38 $26,347 1 $494,700 85 $99,694 APPLICATIONS APPROVED, NOT ACCEPTED 3 $101,747 38 $122,603 101 $108,193 9 $30,444 0 $0 10 $137,072 APPLICATIONS DENIED 2 $125,225 49 $100,372 242 $101,791 22 $29,169 0 $0 26 $92,318 APPLICATIONS WITHDRAWN 4 $109,842 36 $114,620 206 $114,539 9 $35,071 0 $0 13 $93,362 FILES CLOSED FOR INCOMPLETENESS 1 $149,570 15 $155,113 29 $147,719 3 $22,407 0 $0 2 $105,945
Aggregated Statistics For Year 2002(Based on 1 full and 4 partial tracts) A) FHA, FSA/RHS & VA B) Conventional C) Refinancings D) Home Improvement Loans F) Non-occupant Loans on Number Average Value Number Average Value Number Average Value Number Average Value Number Average Value
LOANS ORIGINATED 27 $101,348 100 $117,178 222 $104,151 12 $26,379 39 $80,919 APPLICATIONS APPROVED, NOT ACCEPTED 0 $0 5 $86,214 48 $115,868 5 $19,090 5 $76,956 APPLICATIONS DENIED 5 $126,106 23 $113,457 81 $79,584 18 $23,276 6 $65,780 APPLICATIONS WITHDRAWN 1 $51,800 9 $123,501 73 $101,271 3 $40,940 3 $81,640 FILES CLOSED FOR INCOMPLETENESS 1 $62,620 5 $77,672 16 $102,988 0 $0 3 $63,050
Aggregated Statistics For Year 2001(Based on 1 full and 4 partial tracts) A) FHA, FSA/RHS & VA B) Conventional C) Refinancings D) Home Improvement Loans F) Non-occupant Loans on Number Average Value Number Average Value Number Average Value Number Average Value Number Average Value
LOANS ORIGINATED 31 $92,047 71 $116,361 151 $95,591 17 $27,748 27 $76,364 APPLICATIONS APPROVED, NOT ACCEPTED 2 $94,870 9 $91,024 31 $74,018 4 $87,165 3 $104,107 APPLICATIONS DENIED 3 $93,730 20 $85,044 110 $73,305 17 $27,754 6 $95,718 APPLICATIONS WITHDRAWN 1 $68,090 7 $113,837 43 $74,115 6 $30,203 2 $98,545 FILES CLOSED FOR INCOMPLETENESS 1 $111,880 10 $87,821 12 $86,960 1 $11,440 2 $78,570
Aggregated Statistics For Year 2000(Based on 1 full and 4 partial tracts) A) FHA, FSA/RHS & VA B) Conventional C) Refinancings D) Home Improvement Loans F) Non-occupant Loans on Number Average Value Number Average Value Number Average Value Number Average Value Number Average Value
LOANS ORIGINATED 42 $89,313 64 $102,735 42 $71,716 17 $25,440 18 $79,060 APPLICATIONS APPROVED, NOT ACCEPTED 1 $97,190 8 $80,199 9 $70,969 10 $21,148 2 $79,395 APPLICATIONS DENIED 2 $57,325 24 $82,384 52 $64,483 26 $15,569 6 $70,805 APPLICATIONS WITHDRAWN 4 $78,815 11 $90,965 36 $57,658 1 $57,560 2 $52,960 FILES CLOSED FOR INCOMPLETENESS 2 $122,565 3 $47,097 13 $67,134 0 $0 0 $0
Aggregated Statistics For Year 1999(Based on 1 full and 6 partial tracts) A) FHA, FSA/RHS & VA B) Conventional C) Refinancings D) Home Improvement Loans F) Non-occupant Loans on Number Average Value Number Average Value Number Average Value Number Average Value Number Average Value
LOANS ORIGINATED 72 $89,222 178 $125,049 213 $75,826 26 $21,298 42 $64,392 APPLICATIONS APPROVED, NOT ACCEPTED 1 $125,770 25 $93,532 58 $73,809 9 $34,416 8 $71,561 APPLICATIONS DENIED 7 $81,823 40 $96,940 133 $89,203 28 $22,736 9 $66,507 APPLICATIONS WITHDRAWN 2 $66,925 25 $90,900 108 $75,960 15 $42,695 7 $56,329 FILES CLOSED FOR INCOMPLETENESS 3 $84,770 9 $81,956 21 $72,225 1 $9,960 3 $43,117
Detailed HMDA statistics for the following Tracts:
0208.08
, 0208.10 , 0215.02 , 0215.03 , 0215.04 , 0215.05 , 0215.06 , 0220.01
Private Mortgage Insurance Companies Aggregated Statistics For Year 2009(Based on 1 full and 9 partial tracts) A) Conventional B) Refinancings Number Average Value Number Average Value
LOANS ORIGINATED 3 $188,520 3 $149,540 APPLICATIONS APPROVED, NOT ACCEPTED 1 $270,460 0 $0 APPLICATIONS DENIED 1 $155,550 0 $0 APPLICATIONS WITHDRAWN 0 $0 0 $0 FILES CLOSED FOR INCOMPLETENESS 0 $0 0 $0
Aggregated Statistics For Year 2008(Based on 1 full and 9 partial tracts) A) Conventional B) Refinancings C) Non-occupant Loans on Number Average Value Number Average Value Number Average Value
LOANS ORIGINATED 17 $225,049 9 $214,004 1 $188,820 APPLICATIONS APPROVED, NOT ACCEPTED 7 $259,966 8 $233,650 0 $0 APPLICATIONS DENIED 1 $174,970 2 $307,850 1 $400,890 APPLICATIONS WITHDRAWN 0 $0 2 $151,290 1 $87,300 FILES CLOSED FOR INCOMPLETENESS 0 $0 1 $165,840 1 $165,840
Aggregated Statistics For Year 2007(Based on 1 full and 9 partial tracts) A) Conventional B) Refinancings C) Non-occupant Loans on Number Average Value Number Average Value Number Average Value
LOANS ORIGINATED 41 $216,063 23 $230,963 6 $191,163 APPLICATIONS APPROVED, NOT ACCEPTED 7 $280,333 2 $281,930 1 $381,590 APPLICATIONS DENIED 1 $362,630 0 $0 0 $0 APPLICATIONS WITHDRAWN 3 $205,557 3 $236,197 0 $0 FILES CLOSED FOR INCOMPLETENESS 0 $0 0 $0 0 $0
Aggregated Statistics For Year 2006(Based on 1 full and 9 partial tracts) A) Conventional B) Refinancings C) Non-occupant Loans on Number Average Value Number Average Value Number Average Value
LOANS ORIGINATED 33 $244,275 17 $227,644 5 $199,308 APPLICATIONS APPROVED, NOT ACCEPTED 6 $201,222 1 $260,370 2 $151,920 APPLICATIONS DENIED 2 $216,645 1 $350,370 1 $350,370 APPLICATIONS WITHDRAWN 1 $160,770 2 $282,840 1 $278,130 FILES CLOSED FOR INCOMPLETENESS 0 $0 0 $0 0 $0
Aggregated Statistics For Year 2005(Based on 1 full and 9 partial tracts) A) Conventional B) Refinancings C) Non-occupant Loans on Number Average Value Number Average Value Number Average Value
LOANS ORIGINATED 57 $186,064 19 $167,947 17 $180,506 APPLICATIONS APPROVED, NOT ACCEPTED 7 $164,059 3 $207,537 2 $83,285 APPLICATIONS DENIED 2 $134,185 0 $0 1 $194,560 APPLICATIONS WITHDRAWN 3 $156,483 2 $335,635 1 $290,310 FILES CLOSED FOR INCOMPLETENESS 0 $0 1 $60,530 0 $0
Aggregated Statistics For Year 2004(Based on 1 full and 9 partial tracts) A) Conventional B) Refinancings C) Non-occupant Loans on Number Average Value Number Average Value Number Average Value
LOANS ORIGINATED 65 $149,085 31 $149,696 9 $125,380 APPLICATIONS APPROVED, NOT ACCEPTED 12 $156,971 12 $160,345 1 $135,290 APPLICATIONS DENIED 0 $0 0 $0 0 $0 APPLICATIONS WITHDRAWN 4 $145,192 1 $192,760 2 $135,575 FILES CLOSED FOR INCOMPLETENESS 0 $0 1 $131,450 0 $0
Aggregated Statistics For Year 2003(Based on 1 full and 9 partial tracts) A) Conventional B) Refinancings C) Non-occupant Loans on Number Average Value Number Average Value Number Average Value
LOANS ORIGINATED 78 $132,592 51 $132,258 13 $106,497 APPLICATIONS APPROVED, NOT ACCEPTED 11 $169,468 15 $124,606 3 $96,660 APPLICATIONS DENIED 3 $105,333 2 $149,585 1 $155,980 APPLICATIONS WITHDRAWN 8 $132,350 3 $112,517 2 $107,340 FILES CLOSED FOR INCOMPLETENESS 0 $0 0 $0 0 $0
Aggregated Statistics For Year 2002(Based on 1 full and 4 partial tracts) A) Conventional B) Refinancings C) Non-occupant Loans on Number Average Value Number Average Value Number Average Value
LOANS ORIGINATED 33 $126,944 21 $123,497 8 $93,809 APPLICATIONS APPROVED, NOT ACCEPTED 4 $159,312 5 $104,586 2 $86,485 APPLICATIONS DENIED 3 $104,893 0 $0 0 $0 APPLICATIONS WITHDRAWN 2 $99,205 3 $82,617 1 $78,240 FILES CLOSED FOR INCOMPLETENESS 0 $0 0 $0 0 $0
Aggregated Statistics For Year 2001(Based on 1 full and 4 partial tracts) A) Conventional B) Refinancings C) Non-occupant Loans on Number Average Value Number Average Value Number Average Value
LOANS ORIGINATED 27 $129,445 16 $118,662 5 $81,174 APPLICATIONS APPROVED, NOT ACCEPTED 4 $134,525 2 $79,835 1 $74,190 APPLICATIONS DENIED 1 $93,120 0 $0 0 $0 APPLICATIONS WITHDRAWN 0 $0 1 $82,440 0 $0 FILES CLOSED FOR INCOMPLETENESS 0 $0 0 $0 0 $0
Aggregated Statistics For Year 2000(Based on 1 full and 4 partial tracts) A) Conventional B) Refinancings C) Non-occupant Loans on Number Average Value Number Average Value Number Average Value
LOANS ORIGINATED 25 $99,458 2 $133,970 4 $80,400 APPLICATIONS APPROVED, NOT ACCEPTED 1 $146,390 0 $0 0 $0 APPLICATIONS DENIED 0 $0 0 $0 0 $0 APPLICATIONS WITHDRAWN 0 $0 1 $68,060 1 $68,060 FILES CLOSED FOR INCOMPLETENESS 0 $0 0 $0 0 $0
Aggregated Statistics For Year 1999(Based on 1 full and 6 partial tracts) A) Conventional B) Refinancings C) Non-occupant Loans on Number Average Value Number Average Value Number Average Value
LOANS ORIGINATED 81 $110,447 21 $95,178 12 $64,822 APPLICATIONS APPROVED, NOT ACCEPTED 5 $108,930 1 $129,480 0 $0 APPLICATIONS DENIED 2 $112,400 5 $101,804 0 $0 APPLICATIONS WITHDRAWN 3 $110,530 0 $0 0 $0 FILES CLOSED FOR INCOMPLETENESS 0 $0 2 $94,430 0 $0
Detailed PMIC statistics for the following Tracts:
0208.08
, 0208.10 , 0215.02 , 0215.03 , 0215.04 , 0215.05 , 0215.06 , 0220.01 Fire-safe hotels and motels in Longwood, Florida:
Lake Fairy Motel, 1190 S Us Hwy 17 92, Longwood, Florida 32750 Phone: (407) 834-5569, Fax: (407) 647-1366
Comfort Inn Conference Center, 2025 W SR 434, Longwood, Florida 32779 Phone: (407) 862-4000, Fax: (407) 862-3035
All 2 fire-safe hotels and motels in Longwood, Florida
Most common first names in Longwood, FL among deceased individuals Name Count Lived (average)
John 212 75.2 years Mary 195 81.1 years William 193 74.8 years Robert 182 73.4 years James 159 72.6 years Charles 110 76.8 years Helen 105 82.1 years George 105 79.1 years Dorothy 100 79.9 years Joseph 91 76.0 years
Most common last names in Longwood, FL among deceased individuals Last name Count Lived (average)
Smith 73 79.4 years Johnson 51 78.9 years Miller 47 79.6 years Davis 42 73.6 years Williams 38 77.1 years Brown 35 78.0 years Wilson 25 72.8 years Anderson 23 77.6 years Jones 23 77.5 years Moore 22 79.0 years
Longwood compared to Florida state average:
Unemployed percentage significantly below state average. Black race population percentage below state average. Length of stay since moving in significantly above state average.
#87 on the list of "Top 101 cities with the most residents born in Bangladesh (population 500+)"
#97 on the list of "Top 101 cities with the most people taking a bicycle to work (population 5,000+)"
#15 on the list of "Top 101 counties with the largest increase in the number of infant deaths per 1000 residents 2000-2006 to 2007-2013 (pop. 50,000+)"
#33 on the list of "Top 101 counties with the highest ground withdrawal of fresh water for public supply"
#49 on the list of "Top 101 counties with the highest percentage of residents relocating to other counties in 2011 (pop. 50,000+)"
#69 on the list of "Top 101 counties with the highest percentage of residents relocating to foreign countries in 2011 (pop. 50,000+)"
#72 on the list of "Top 101 counties with the highest percentage of residents relocating from other counties between 2010 and 2011 (pop. 50,000+)"
Top Patent Applicants
Kenneth Steffey (30)
Eduardo T. Kahan (28)
Peter Atwal (16)
Kevin Dole (13)
Thomas F. Haller (12)
Frederick John York (11)
Frederick York (10)
Andrew J. Burns (10)
Dwayne Steven Tobin (10)
William R. Benner, Jr. (10)
Total of 466 patent applications in 2008-2024.
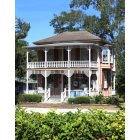
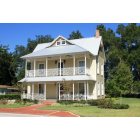
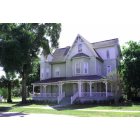
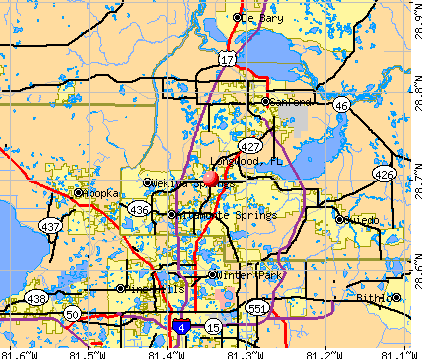


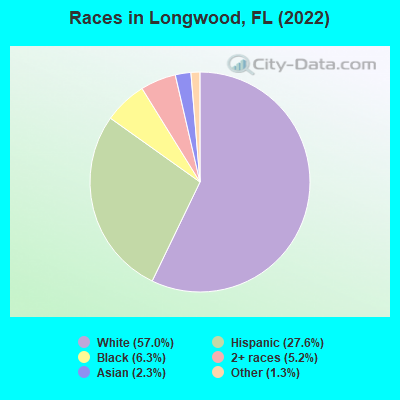
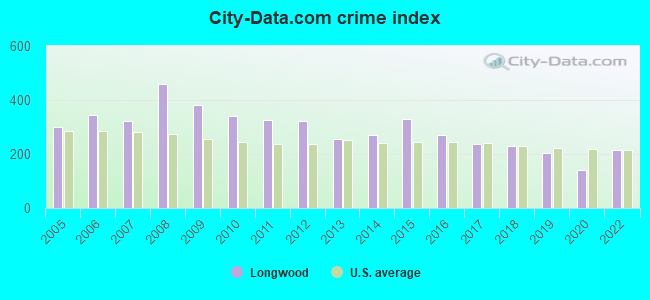
 Recent articles from our blog. Our writers, many of them Ph.D. graduates or candidates, create easy-to-read articles on a wide variety of topics.

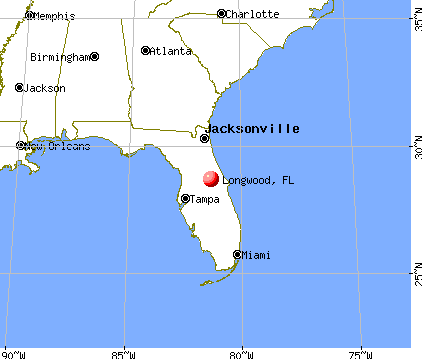
 (11.8 miles
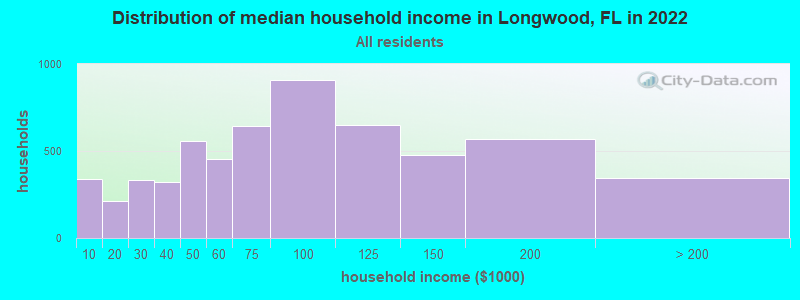
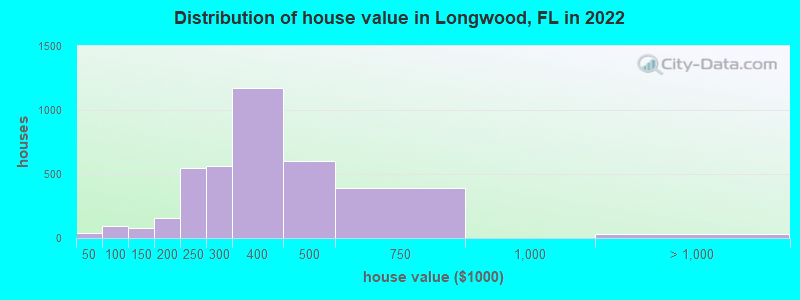
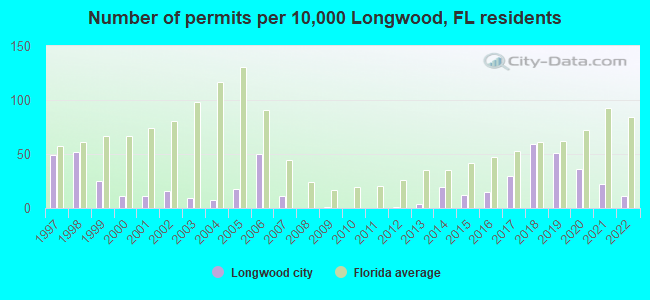
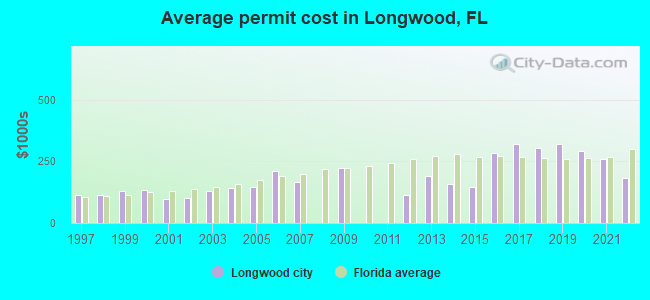
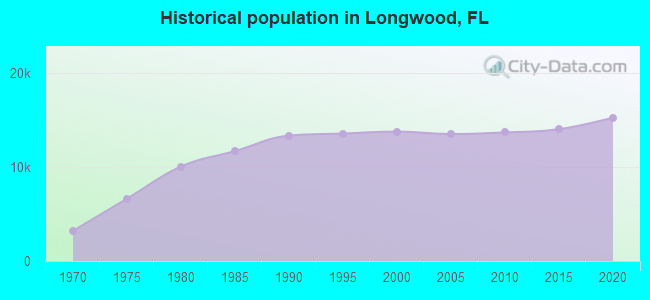
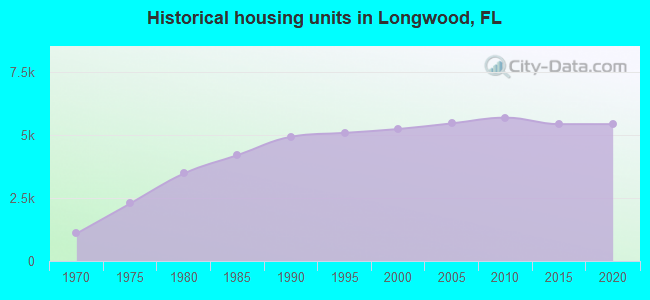
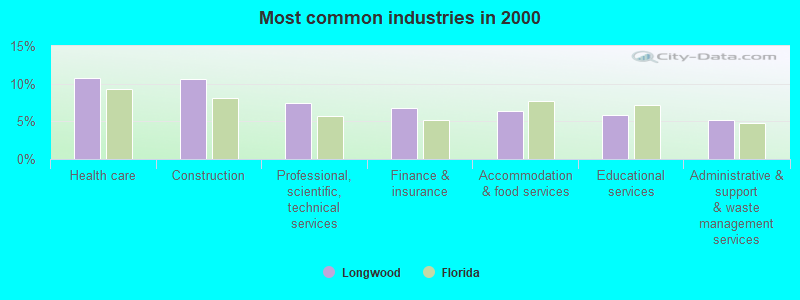
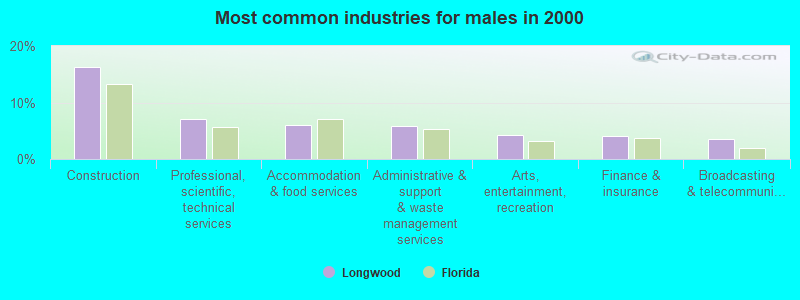
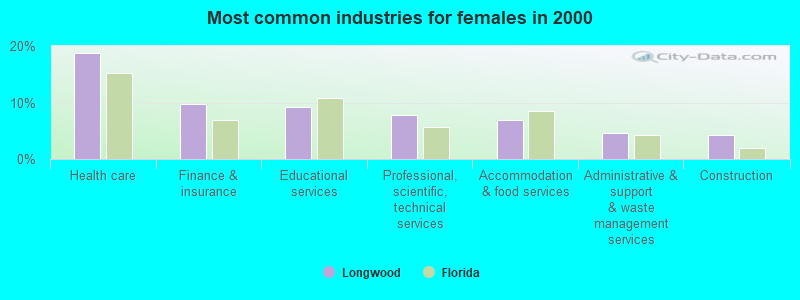
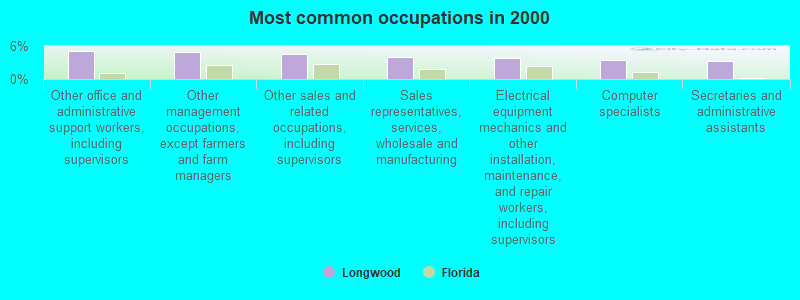
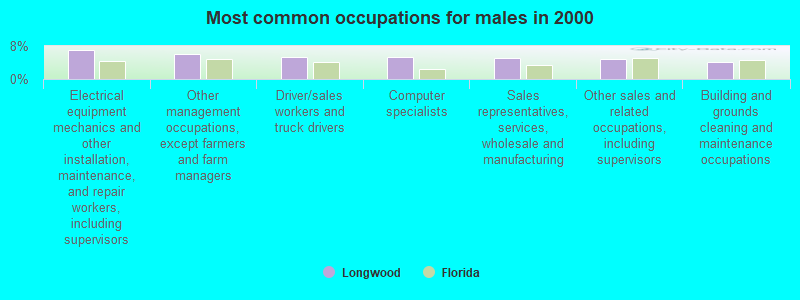
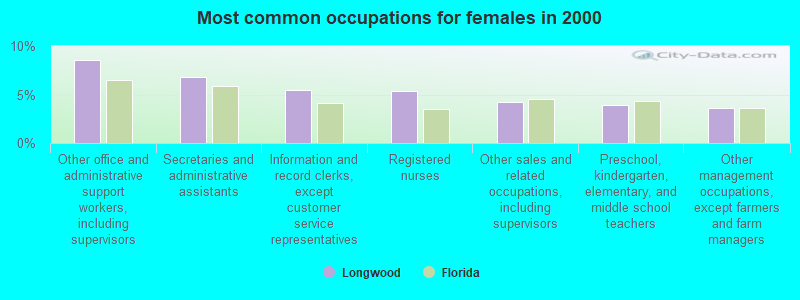
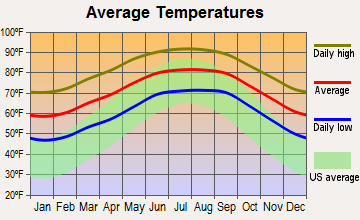
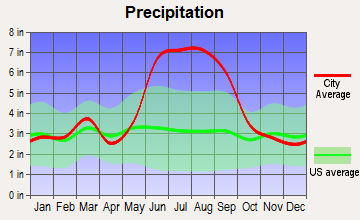
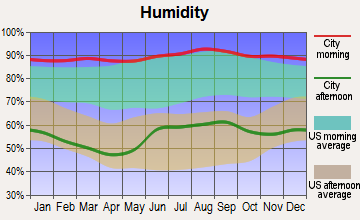
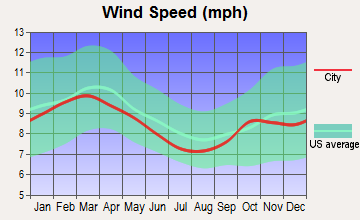
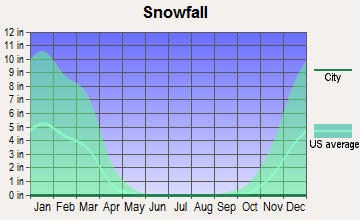
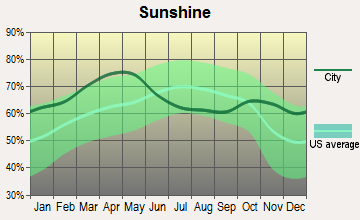
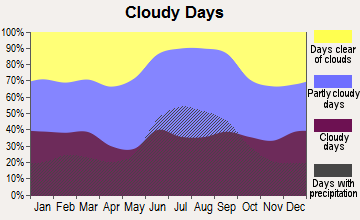


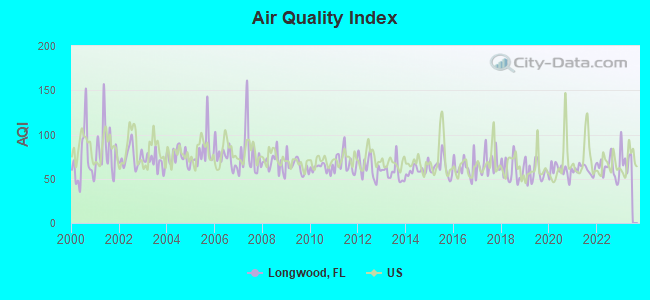
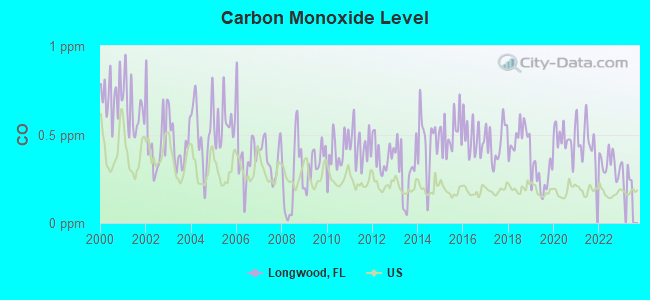
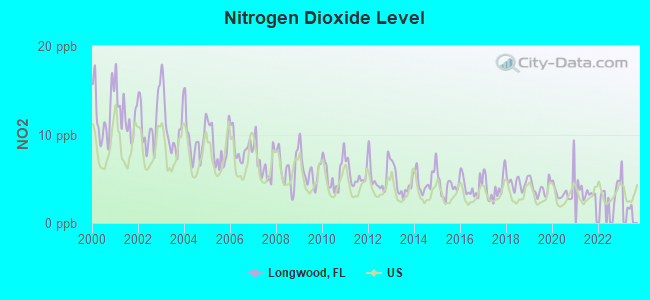
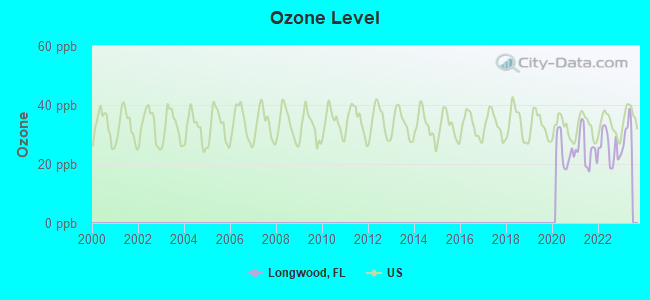
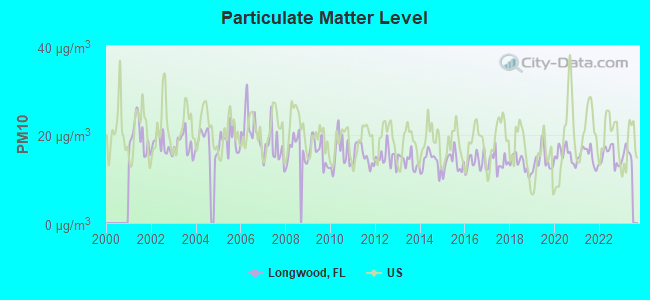
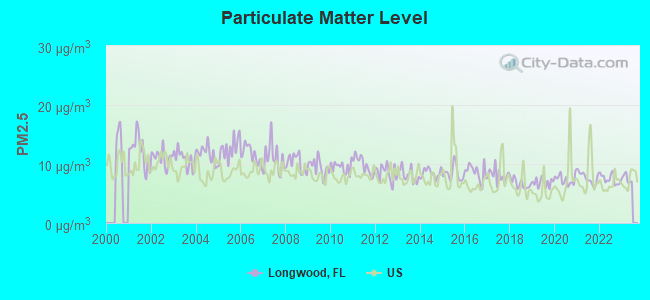
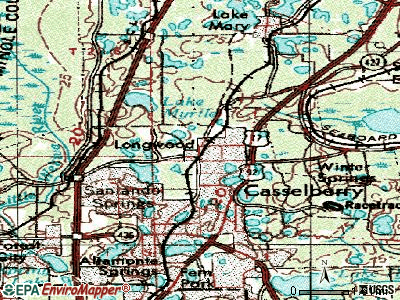
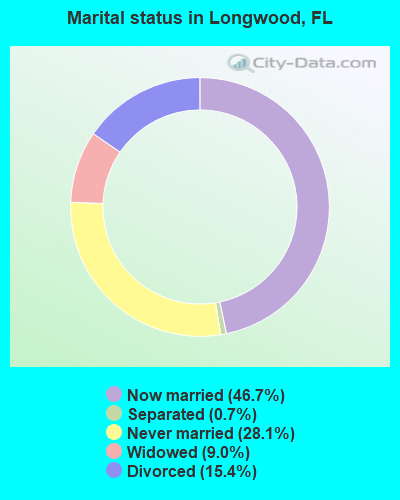
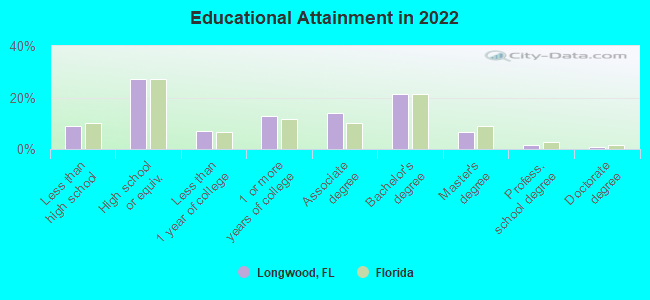
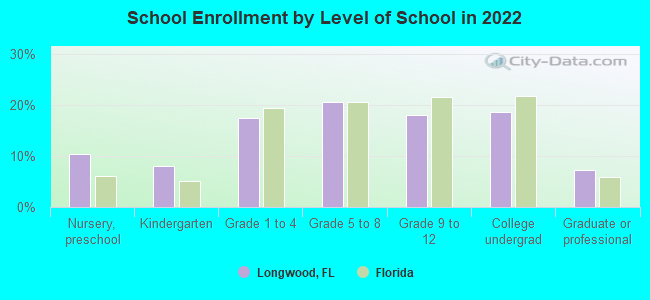
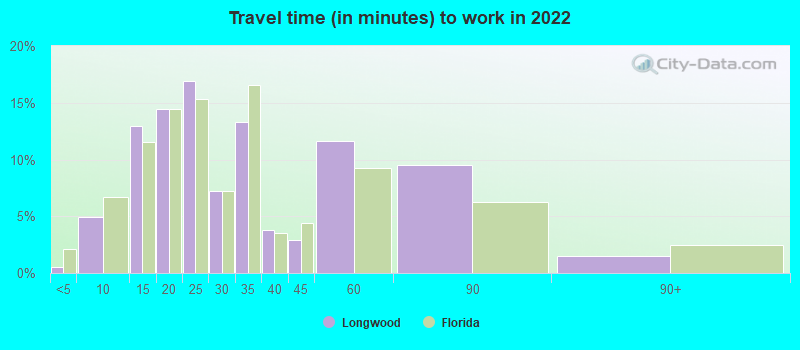
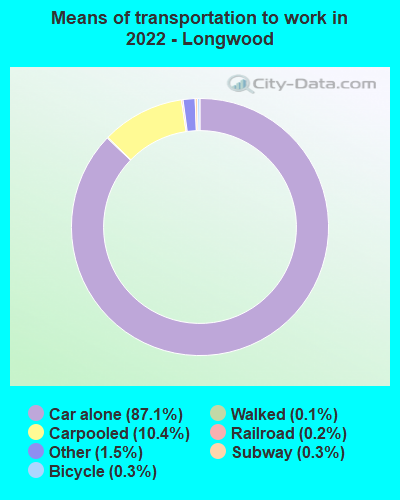
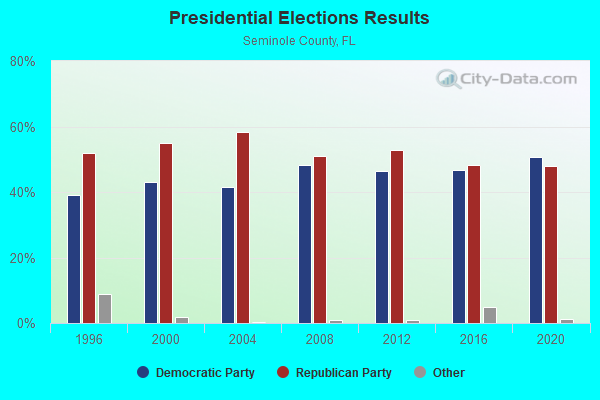
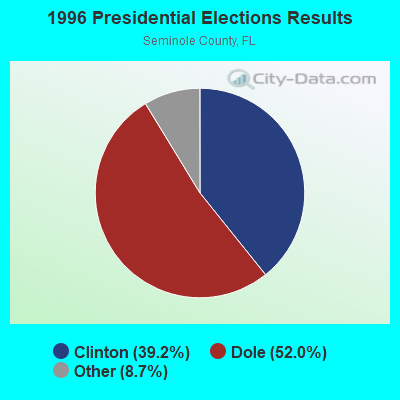
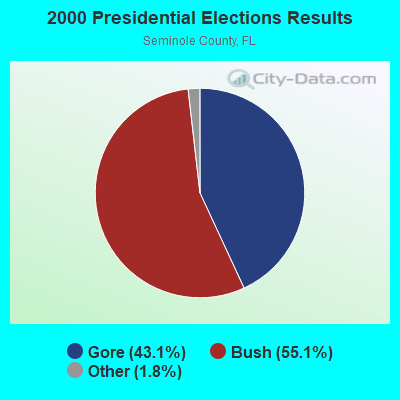
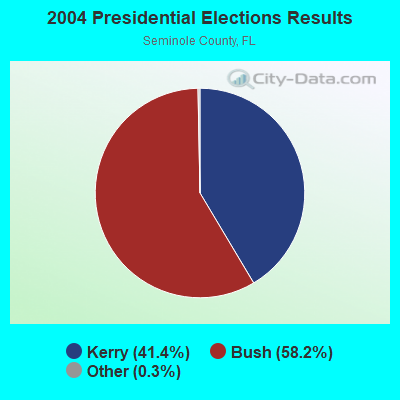
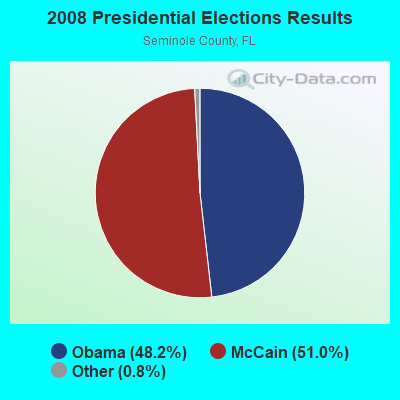
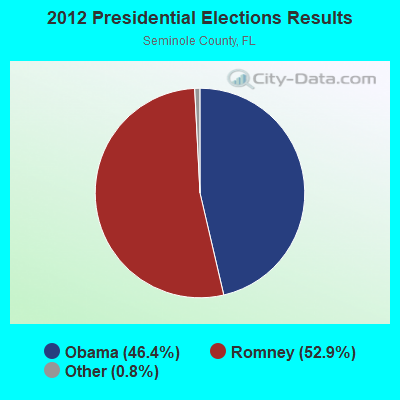
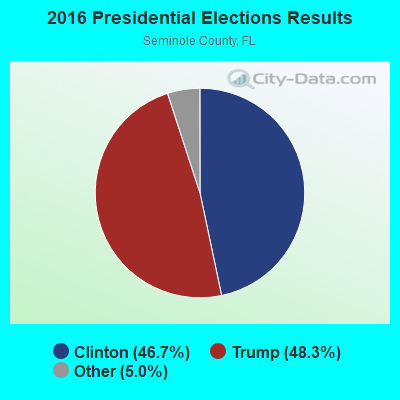
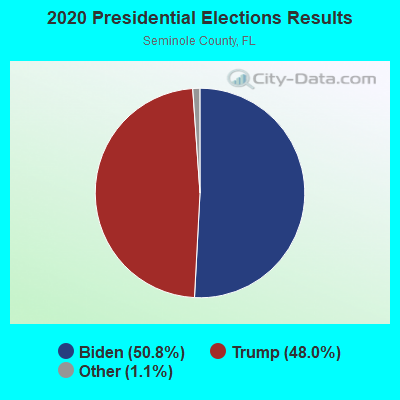
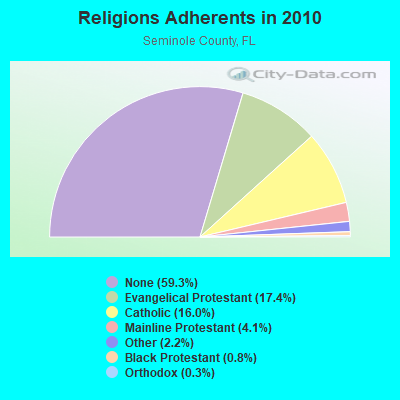

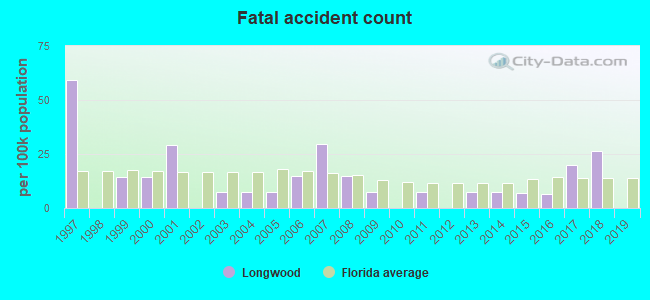
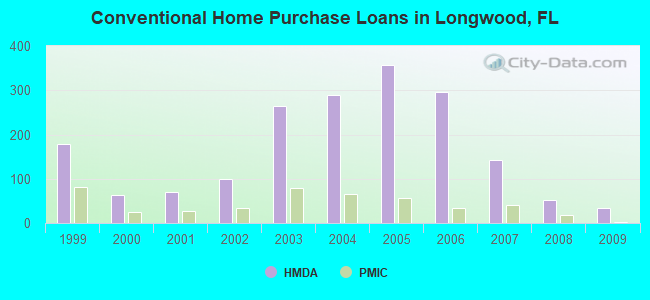
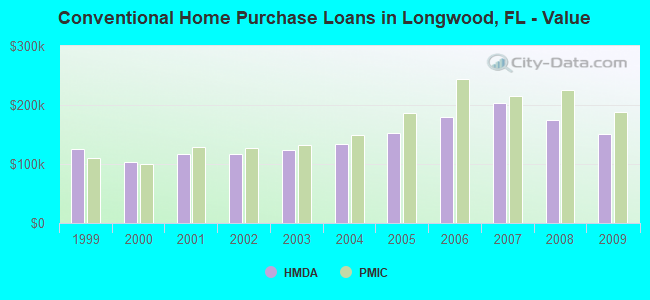
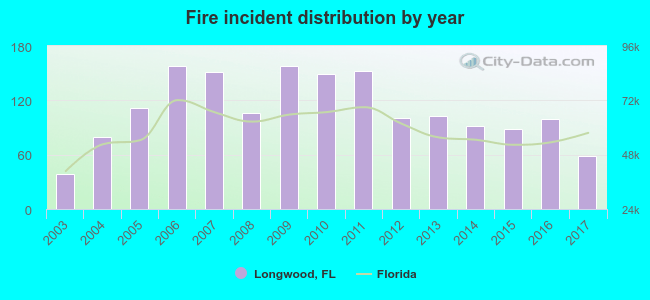 Based on the data from the years 2003 - 2017 the average number of fires per year is 110. The highest number of reported fires - 158 took place in 2006, and the least - 39 in 2003. The data has a rising trend.
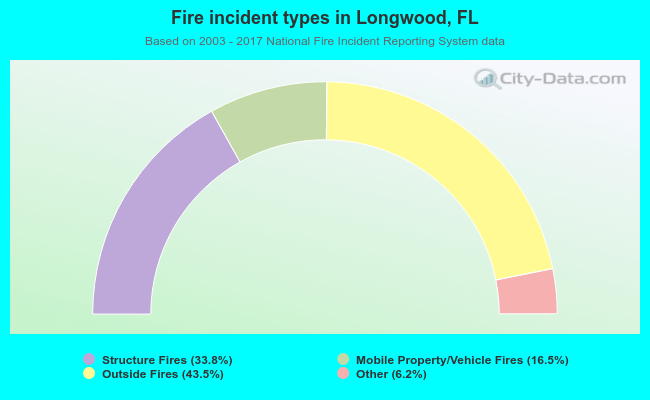 When looking into fire subcategories, the most reports belonged to: Outside Fires (43.5%), and Structure Fires (33.8%).