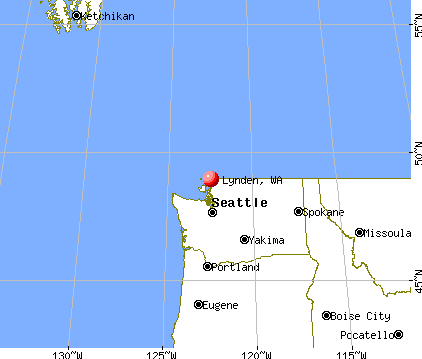
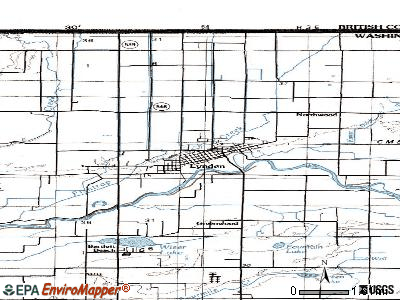
Lynden, Washington
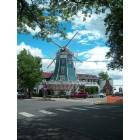
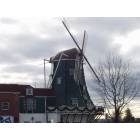
Lynden: Windmill in downtown Lynden
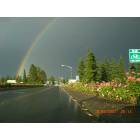
Lynden: rainbow over Front Street in Lynden
Lynden: Downtown Lynden Pic 3
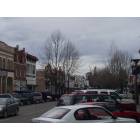
Lynden: Downtown Lynden Pic 2
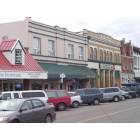
Lynden: Downtown Lynden
- add
your
Submit your own pictures of this city and show them to the world
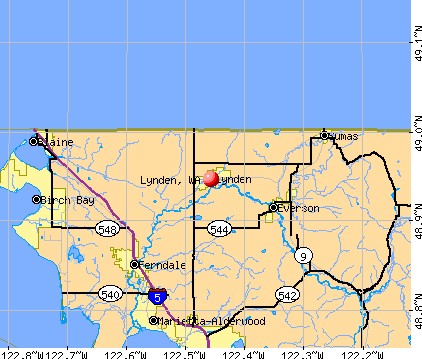
- OSM Map
- General Map
- Google Map
- MSN Map
Population change since 2000: +79.3%
| Males: 8,049 | |
| Females: 8,126 |
| Median resident age: | 36.1 years |
| Washington median age: | 38.4 years |
Zip codes: 98264.
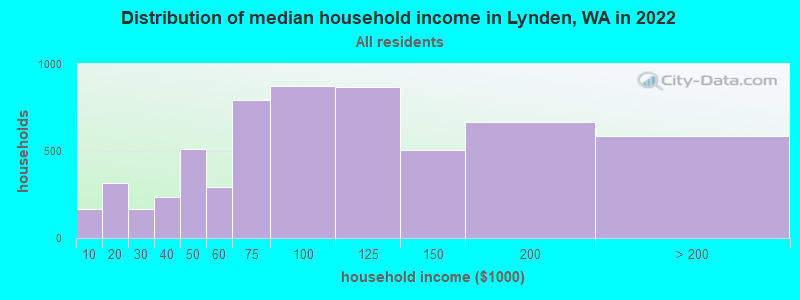
| Lynden: | $87,996 |
| WA: | $91,306 |
Estimated per capita income in 2022: $43,246 (it was $20,639 in 2000)
Lynden city income, earnings, and wages data
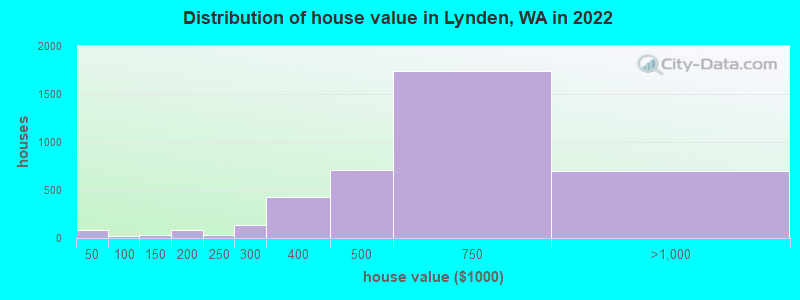
Estimated median house or condo value in 2022: $605,630 (it was $155,600 in 2000)
| Lynden: | $605,630 |
| WA: | $569,500 |
Mean prices in 2022: all housing units: $538,615; detached houses: $578,007; townhouses or other attached units: $316,589; in 3-to-4-unit structures: $469,541; in 5-or-more-unit structures: $376,907; mobile homes: $49,221
Median gross rent in 2022: $1,462.
(7.0% for White Non-Hispanic residents, 11.6% for Hispanic or Latino residents, 13.3% for American Indian residents, 1.1% for other race residents, 7.5% for two or more races residents)
Detailed information about poverty and poor residents in Lynden, WA

Compare current foreclosures near Lynden, WA:
| Photo | Address | Area | Beds / Baths | Price | Details |
|---|---|---|---|---|---|

|
#1
W Pole Rd
Lynden, WA 98264
|
1,248 sq. feet
|
1 baths 2 beds |
show details | |

|
#2
Glenning St
Lynden, WA 98264
|
1,332 sq. feet
|
1 baths 2 beds |
show details | |

|
#3
Buttercup Dr
Lynden, WA 98264
|
1,182 sq. feet
|
2 baths 3 beds |
show details | |

|
#4
Drayton St
Lynden, WA 98264
|
1,726 sq. feet
|
2 baths 4 beds |
show details | |

|
#5
Burlwood Way
Lynden, WA 98264
|
- sq. feet
|
- baths - beds |
show details | |

|
#6
Agronomy Way # 202
Lynden, WA 98264
|
- sq. feet
|
- baths - beds |
show details | |

|
#7
Judson St Apt 101
Lynden, WA 98264
|
- sq. feet
|
- baths - beds |
show details | |

|
#8
British Columbia Ln # B
Lynden, WA 98264
|
- sq. feet
|
- baths - beds |
show details | |

|
#9
E Grover St # 4
Lynden, WA 98264
|
- sq. feet
|
- baths - beds |
show details | |

|
#10
Red Ridge Dr, # A
Lynden, WA 98264
|
- sq. feet
|
- baths - beds |
show details |
| Photo | Address | Area | Beds / Baths | Price | Details |
|---|---|---|---|---|---|

|
#11
Guide Meridian Rd
Lynden, WA 98264
|
- sq. feet
|
- baths - beds |
show details | |

|
#12
19th St
Lynden, WA 98264
|
- sq. feet
|
- baths - beds |
show details | |

|
#13
W Maberry Dr # A
Lynden, WA 98264
|
- sq. feet
|
- baths - beds |
show details | |

|
#14
Pony Express Way
Maple Falls, WA 98266
|
1,157 sq. feet
|
2 baths 3 beds |
show details | |

|
#15
Golden Valley Dr
Maple Falls, WA 98266
|
1,013 sq. feet
|
1 baths 2 beds |
show details | |

|
#16
Salish Rd
Blaine, WA 98230
|
1,188 sq. feet
|
2 baths 3 beds |
show details | |

|
#17
15th St
Bellingham, WA 98225
|
2,970 sq. feet
|
2 baths 3 beds |
show details | |

|
#18
Chehalis Rd
Blaine, WA 98230
|
1,488 sq. feet
|
2 baths 3 beds |
show details | |

|
#19
Green Valley Dr
Maple Falls, WA 98266
|
1,580 sq. feet
|
3 baths 4 beds |
show details | |

|
#20
Crestline Dr
Bellingham, WA 98229
|
1,358 sq. feet
|
2 baths 4 beds |
show details |
| Photo | Address | Area | Beds / Baths | Price | Details |
|---|---|---|---|---|---|

|
#21
Glenmore St
Ferndale, WA 98248
|
2,177 sq. feet
|
3 baths 4 beds |
show details | |

|
#22
Glenmore St
Ferndale, WA 98248
|
- sq. feet
|
2 baths 3 beds |
show details | |

|
#23
Hampton Pl
Bellingham, WA 98225
|
881 sq. feet
|
1 baths 2 beds |
show details | |

|
#24
Valencia St
Bellingham, WA 98226
|
888 sq. feet
|
1 baths 3 beds |
show details | |

|
#25
Undine St
Bellingham, WA 98226
|
1,664 sq. feet
|
1 baths 2 beds |
show details | |

|
#26
Yew Street Rd
Bellingham, WA 98229
|
1,120 sq. feet
|
1 baths 2 beds |
show details | |

|
#27
N Grace Ln
Bellingham, WA 98226
|
2,220 sq. feet
|
2 baths 3 beds |
show details | |

|
#28
Cottonwood Ave
Bellingham, WA 98225
|
1,235 sq. feet
|
1 baths 3 beds |
show details | |

|
#29
Kickerville Rd
Ferndale, WA 98248
|
1,496 sq. feet
|
1 baths 1 beds |
show details | |

|
#30
Westhills Pl
Bellingham, WA 98226
|
3,114 sq. feet
|
2 baths 3 beds |
show details |
| Photo | Address | Area | Beds / Baths | Price | Details |
|---|---|---|---|---|---|

|
#31
Sterling Dr
Bellingham, WA 98226
|
1,222 sq. feet
|
1 baths 2 beds |
show details | |

|
#32
Peabody St
Bellingham, WA 98225
|
1,536 sq. feet
|
1 baths 4 beds |
show details | |

|
#33
Leeside Dr
Blaine, WA 98230
|
1,344 sq. feet
|
2 baths 3 beds |
show details | |

|
#34
Michigan St # A
Bellingham, WA 98229
|
2,472 sq. feet
|
2 baths 2 beds |
show details | |

|
#35
Irving St
Bellingham, WA 98225
|
1,140 sq. feet
|
1 baths 3 beds |
show details | |

|
#36
Halibut Dr
Blaine, WA 98230
|
1,497 sq. feet
|
2 baths 3 beds |
show details | |

|
#37
Harrison Ave
Blaine, WA 98230
|
1,606 sq. feet
|
2 baths 3 beds |
show details | |

|
#38
Flynn St Spc 51
Bellingham, WA 98229
|
784 sq. feet
|
1 baths 2 beds |
show details | |

|
#39
Blackbird Valley Ln
Maple Falls, WA 98266
|
1,672 sq. feet
|
3 baths 4 beds |
show details | |

|
#40
Ellis St
Bellingham, WA 98225
|
952 sq. feet
|
2 baths 2 beds |
show details |
| Photo | Address | Area | Beds / Baths | Price | Details |
|---|---|---|---|---|---|

|
#41
Dover St
Bellingham, WA 98226
|
1,606 sq. feet
|
2 baths 3 beds |
show details | |

|
#42
Otis St
Bellingham, WA 98225
|
726 sq. feet
|
1 baths 2 beds |
show details | |

|
#43
S State St Apt 416
Bellingham, WA 98225
|
815 sq. feet
|
1 baths 1 beds |
show details | |

|
#44
Salish Rd
Blaine, WA 98230
|
1,731 sq. feet
|
2 baths 3 beds |
show details | |

|
#45
12th St
Bellingham, WA 98225
|
1,914 sq. feet
|
2 baths 3 beds |
show details | |

|
#46
Lincoln St Unit 123
Bellingham, WA 98229
|
784 sq. feet
|
1 baths 2 beds |
show details | |

|
#47
Horseshoe Cir
Bellingham, WA 98229
|
1,229 sq. feet
|
2 baths 2 beds |
show details | |

|
#48
Ryan Dr
Ferndale, WA 98248
|
856 sq. feet
|
1 baths 3 beds |
show details | |

|
#49
Grandview Rd
Ferndale, WA 98248
|
1,232 sq. feet
|
1 baths 3 beds |
show details | |

|
Check over 1 million property listings on Foreclosure.com!
|
browse all offers | |||


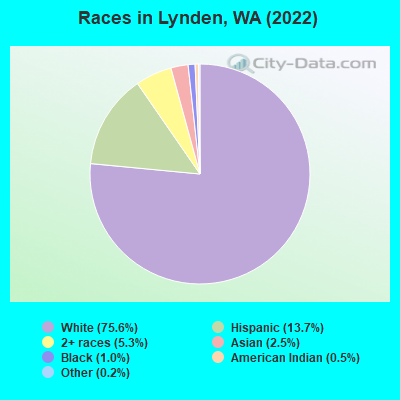
- 12,10375.6%White alone
- 2,19213.7%Hispanic
- 8475.3%Two or more races
- 3942.5%Asian alone
- 1611.0%Black alone
- 750.5%American Indian alone
- 300.2%Other race alone
- 150.09%Native Hawaiian and Other
Pacific Islander alone
Races in Lynden detailed stats: ancestries, foreign born residents, place of birth
According to our research of Washington and other state lists, there were 8 registered sex offenders living in Lynden, Washington as of April 25, 2024.
The ratio of all residents to sex offenders in Lynden is 1,706 to 1.
The ratio of registered sex offenders to all residents in this city is lower than the state average.
Type |
2009 |
2010 |
2011 |
2012 |
2013 |
2014 |
2015 |
2016 |
2017 |
2018 |
2019 |
2020 |
2021 |
2022 |
|---|---|---|---|---|---|---|---|---|---|---|---|---|---|---|
| Murders (per 100,000) | 0 (0.0) | 0 (0.0) | 1 (8.2) | 1 (8.2) | 0 (0.0) | 0 (0.0) | 0 (0.0) | 0 (0.0) | 0 (0.0) | 0 (0.0) | 0 (0.0) | 0 (0.0) | 0 (0.0) | 0 (0.0) |
| Rapes (per 100,000) | 1 (8.3) | 2 (16.7) | 3 (24.7) | 2 (16.4) | 1 (7.8) | 3 (22.9) | 2 (14.9) | 2 (14.5) | 3 (21.0) | 7 (47.9) | 5 (33.1) | 11 (70.4) | 7 (44.3) | 7 (43.0) |
| Robberies (per 100,000) | 2 (16.6) | 0 (0.0) | 1 (8.2) | 1 (8.2) | 1 (7.8) | 1 (7.6) | 3 (22.3) | 0 (0.0) | 1 (7.0) | 3 (20.5) | 2 (13.2) | 1 (6.4) | 1 (6.3) | 2 (12.3) |
| Assaults (per 100,000) | 9 (74.9) | 8 (66.9) | 18 (148.3) | 5 (40.9) | 7 (54.7) | 4 (30.5) | 7 (52.0) | 7 (50.6) | 5 (35.0) | 8 (54.7) | 8 (52.9) | 9 (57.6) | 14 (88.7) | 9 (55.3) |
| Burglaries (per 100,000) | 36 (299.5) | 33 (276.1) | 36 (296.6) | 31 (253.6) | 27 (210.8) | 18 (137.1) | 25 (185.7) | 18 (130.1) | 28 (195.8) | 32 (219.0) | 30 (198.5) | 36 (230.4) | 28 (177.3) | 30 (184.3) |
| Thefts (per 100,000) | 139 (1,156) | 185 (1,548) | 149 (1,228) | 145 (1,186) | 98 (765.1) | 120 (914.1) | 112 (831.8) | 110 (795.1) | 156 (1,091) | 163 (1,116) | 231 (1,528) | 195 (1,248) | 200 (1,267) | 299 (1,837) |
| Auto thefts (per 100,000) | 0 (0.0) | 1 (8.4) | 5 (41.2) | 2 (16.4) | 2 (15.6) | 3 (22.9) | 1 (7.4) | 6 (43.4) | 4 (28.0) | 10 (68.4) | 4 (26.5) | 11 (70.4) | 9 (57.0) | 11 (67.6) |
| Arson (per 100,000) | 0 (0.0) | 0 (0.0) | 1 (8.2) | 1 (8.2) | 1 (7.8) | 0 (0.0) | 0 (0.0) | 2 (14.5) | 1 (7.0) | 4 (27.4) | 1 (6.6) | 0 (0.0) | 1 (6.3) | 2 (12.3) |
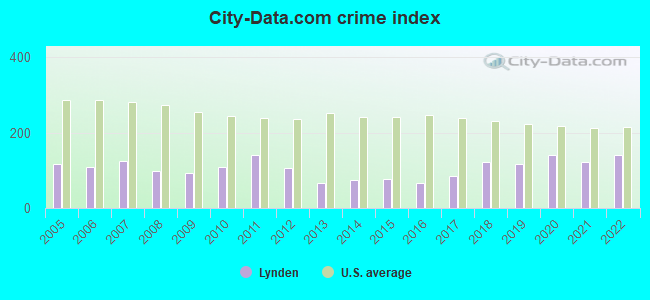
| City-Data.com crime index | 93.8 | 108.7 | 141.5 | 106.6 | 66.1 | 74.7 | 75.8 | 66.1 | 85.4 | 120.9 | 118.2 | 141.4 | 122.7 | 141.0 |
The City-Data.com crime index weighs serious crimes and violent crimes more heavily. Higher means more crime, U.S. average is 246.1. It adjusts for the number of visitors and daily workers commuting into cities.
Crime rate in Lynden detailed stats: murders, rapes, robberies, assaults, burglaries, thefts, arson
Full-time law enforcement employees in 2021, including police officers: 21 (17 officers - 16 male; 1 female).
| Officers per 1,000 residents here: | 1.08 |
| Washington average: | 1.35 |
 Recent articles from our blog. Our writers, many of them Ph.D. graduates or candidates, create easy-to-read articles on a wide variety of topics.


Latest news from Lynden, WA collected exclusively by city-data.com from local newspapers, TV, and radio stations
Ancestries: Dutch (25.4%), German (12.0%), American (6.8%), English (4.8%), Irish (4.4%), Norwegian (3.0%).
Current Local Time: PST time zone
Incorporated in 1891
Elevation: 103 feet
Land area: 4.08 square miles.
Population density: 3,961 people per square mile (average).
1,685 residents are foreign born (4.0% Latin America, 3.1% North America, 1.4% Asia).
| This city: | 10.5% |
| Washington: | 14.9% |
Median real estate property taxes paid for housing units with mortgages in 2022: $3,545 (0.6%)
Median real estate property taxes paid for housing units with no mortgage in 2022: $3,741 (0.6%)
Nearest city with pop. 50,000+: Bellingham, WA  (13.6 miles , pop. 67,171).
Nearest city with pop. 200,000+: Seattle, WA (91.5 miles , pop. 563,374).
Nearest city with pop. 1,000,000+: Los Angeles, CA (1049.0 miles , pop. 3,694,820).
Nearest cities:
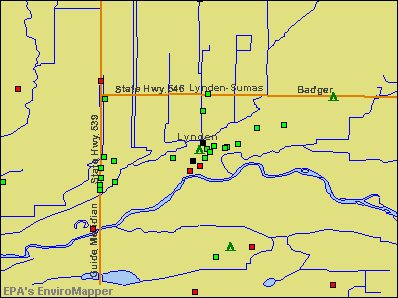
), ), Latitude: 48.95 N, Longitude: 122.46 W
Daytime population change due to commuting: -545 (-3.4%)
Workers who live and work in this city: 3,098 (39.8%)
Lynden, Washington accommodation & food services, waste management - Economy and Business Data
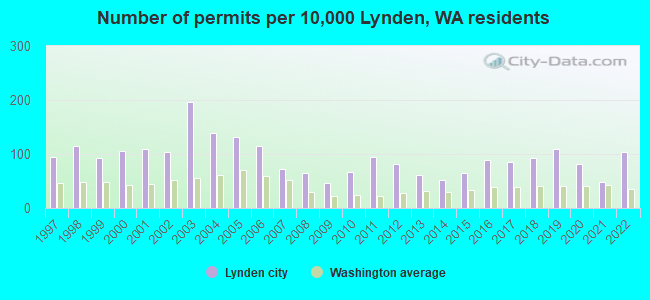
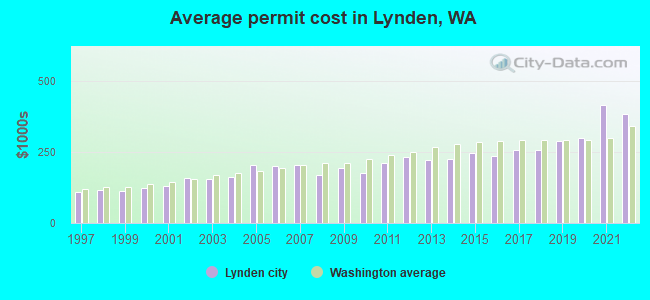
Single-family new house construction building permits:
- 2022: 94 buildings, average cost: $385,400
- 2021: 44 buildings, average cost: $416,700
- 2020: 73 buildings, average cost: $300,500
- 2019: 99 buildings, average cost: $288,000
- 2018: 84 buildings, average cost: $258,700
- 2017: 78 buildings, average cost: $257,000
- 2016: 80 buildings, average cost: $237,000
- 2015: 59 buildings, average cost: $245,500
- 2014: 47 buildings, average cost: $226,600
- 2013: 55 buildings, average cost: $221,400
- 2012: 73 buildings, average cost: $232,000
- 2011: 85 buildings, average cost: $212,200
- 2010: 60 buildings, average cost: $176,800
- 2009: 42 buildings, average cost: $193,400
- 2008: 59 buildings, average cost: $168,900
- 2007: 65 buildings, average cost: $202,800
- 2006: 103 buildings, average cost: $200,600
- 2005: 118 buildings, average cost: $206,000
- 2004: 125 buildings, average cost: $162,800
- 2003: 177 buildings, average cost: $154,800
- 2002: 93 buildings, average cost: $158,800
- 2001: 99 buildings, average cost: $130,600
- 2000: 96 buildings, average cost: $124,600
- 1999: 83 buildings, average cost: $113,900
- 1998: 103 buildings, average cost: $114,600
- 1997: 85 buildings, average cost: $108,400
| Here: | 5.1% |
| Washington: | 4.6% |
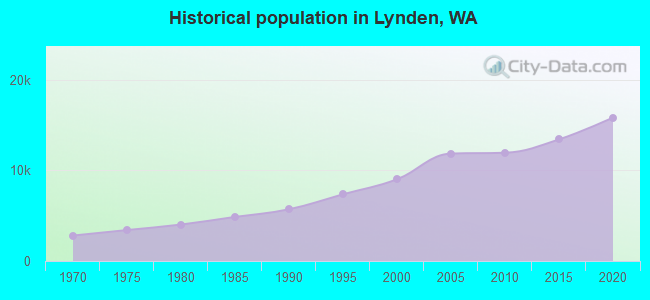
Population change in the 1990s: +3,041 (+50.9%).
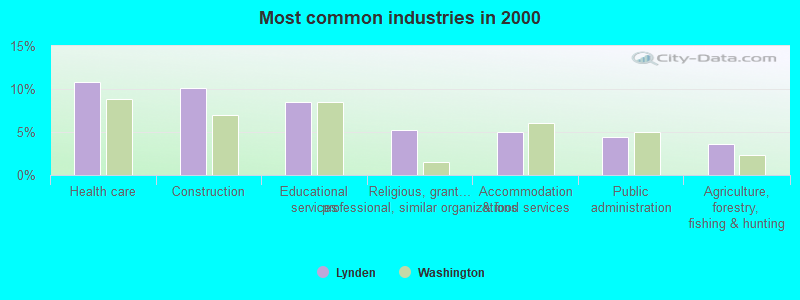
- Health care (10.8%)
- Construction (10.1%)
- Educational services (8.5%)
- Religious, grantmaking, civic, professional, similar organizations (5.2%)
- Accommodation & food services (5.0%)
- Public administration (4.4%)
- Agriculture, forestry, fishing & hunting (3.6%)
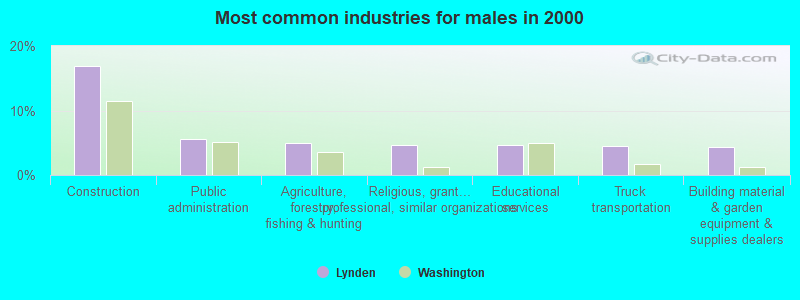
- Construction (16.9%)
- Public administration (5.6%)
- Agriculture, forestry, fishing & hunting (5.0%)
- Religious, grantmaking, civic, professional, similar organizations (4.7%)
- Educational services (4.7%)
- Truck transportation (4.5%)
- Building material & garden equipment & supplies dealers (4.3%)
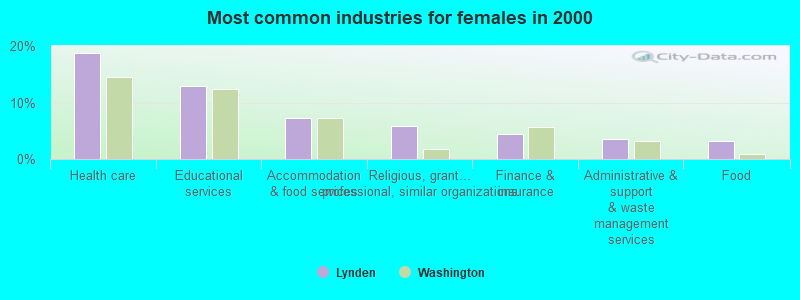
- Health care (18.8%)
- Educational services (13.0%)
- Accommodation & food services (7.3%)
- Religious, grantmaking, civic, professional, similar organizations (5.9%)
- Finance & insurance (4.4%)
- Administrative & support & waste management services (3.6%)
- Food (3.1%)
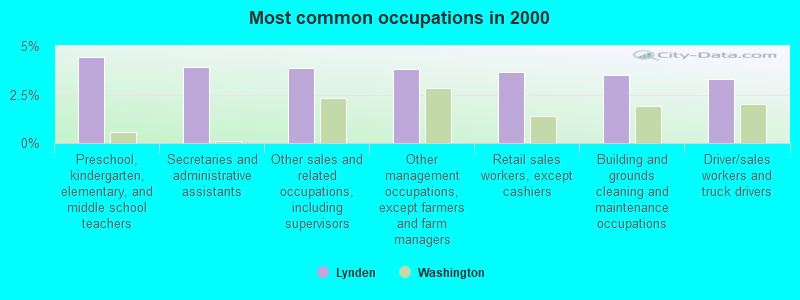
- Preschool, kindergarten, elementary, and middle school teachers (4.5%)
- Secretaries and administrative assistants (3.9%)
- Other sales and related occupations, including supervisors (3.9%)
- Other management occupations, except farmers and farm managers (3.8%)
- Retail sales workers, except cashiers (3.7%)
- Building and grounds cleaning and maintenance occupations (3.5%)
- Driver/sales workers and truck drivers (3.3%)
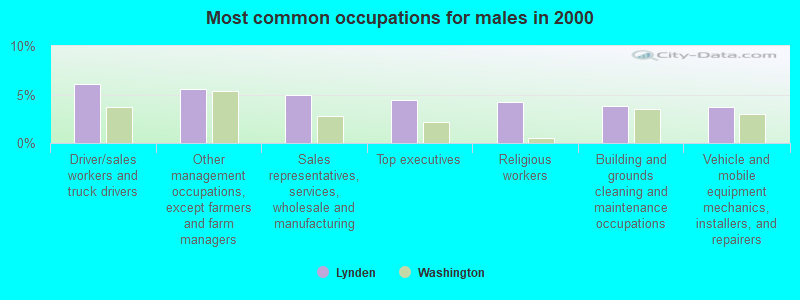
- Driver/sales workers and truck drivers (6.0%)
- Other management occupations, except farmers and farm managers (5.6%)
- Sales representatives, services, wholesale and manufacturing (4.9%)
- Top executives (4.4%)
- Religious workers (4.2%)
- Building and grounds cleaning and maintenance occupations (3.8%)
- Vehicle and mobile equipment mechanics, installers, and repairers (3.7%)
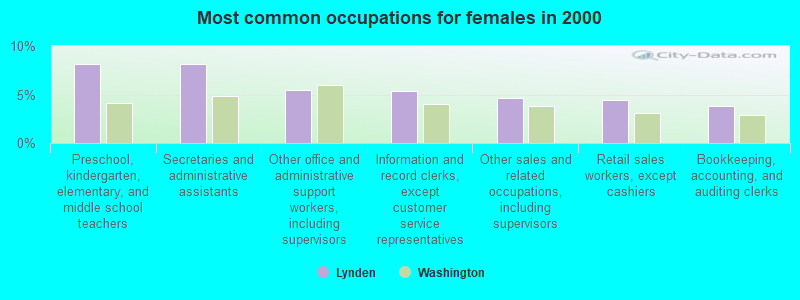
- Preschool, kindergarten, elementary, and middle school teachers (8.2%)
- Secretaries and administrative assistants (8.1%)
- Other office and administrative support workers, including supervisors (5.5%)
- Information and record clerks, except customer service representatives (5.3%)
- Other sales and related occupations, including supervisors (4.6%)
- Retail sales workers, except cashiers (4.4%)
- Bookkeeping, accounting, and auditing clerks (3.8%)
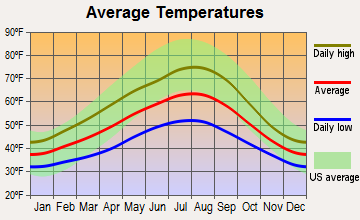
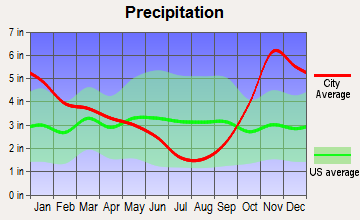
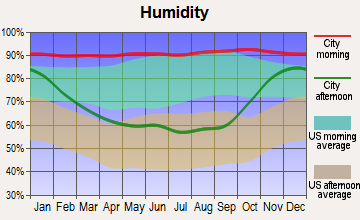
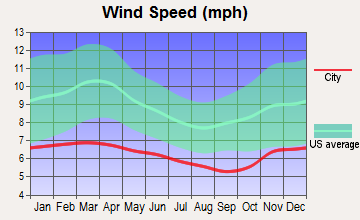
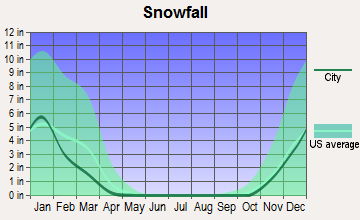
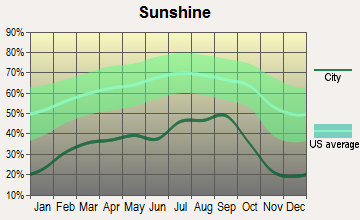
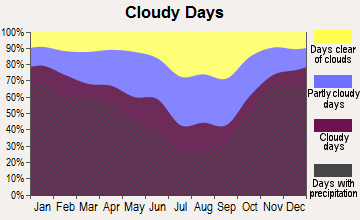
Average climate in Lynden, Washington
Based on data reported by over 4,000 weather stations
|
|

(lower is better)
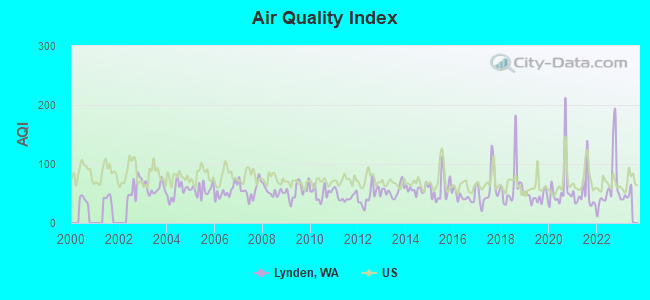
Air Quality Index (AQI) level in 2022 was 64.7. This is about average.
| City: | 64.7 |
| U.S.: | 72.6 |
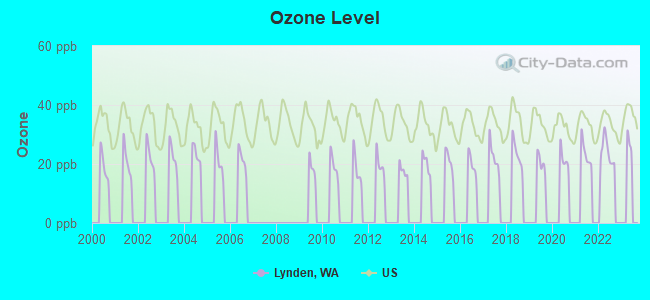
Ozone [ppb] level in 2022 was 24.1. This is better than average. Closest monitor was 4.4 miles away from the city center.
| City: | 24.1 |
| U.S.: | 33.3 |

Particulate Matter (PM2.5) [µg/m3] level in 2022 was 6.01. This is better than average. Closest monitor was 12.7 miles away from the city center.
| City: | 6.01 |
| U.S.: | 8.11 |
Earthquake activity:
Lynden-area historical earthquake activity is significantly above Washington state average. It is 932% greater than the overall U.S. average.On 4/13/1949 at 19:55:42, a magnitude 7.0 (7.0 UK, Class: Major, Intensity: VIII - XII) earthquake occurred 117.4 miles away from the city center, causing $80,000,000 total damage
On 2/28/2001 at 18:54:32, a magnitude 6.8 (6.8 MD, Depth: 32.2 mi, Class: Strong, Intensity: VII - IX) earthquake occurred 125.0 miles away from the city center
On 2/28/2001 at 18:54:32, a magnitude 6.8 (6.5 MB, 6.6 MS, 6.8 MW) earthquake occurred 128.5 miles away from Lynden center, causing $2,000,000,000 total damage and $305,000,000 insured losses
On 4/29/1965 at 15:28:43, a magnitude 6.6 (6.6 UK) earthquake occurred 112.9 miles away from the city center, causing $28,000,000 total damage
On 7/3/1999 at 01:43:54, a magnitude 5.8 (5.4 MB, 5.5 MS, 5.8 MW, 5.3 ME, Depth: 25.2 mi, Class: Moderate, Intensity: VI - VII) earthquake occurred 135.4 miles away from the city center
On 5/3/1996 at 04:04:22, a magnitude 5.5 (5.2 MB, 5.3 MD, 5.5 ML, Depth: 2.5 mi) earthquake occurred 83.6 miles away from the city center
Magnitude types: body-wave magnitude (MB), duration magnitude (MD), energy magnitude (ME), local magnitude (ML), surface-wave magnitude (MS), moment magnitude (MW)
Natural disasters:
The number of natural disasters in Whatcom County (21) is greater than the US average (15).Major Disasters (Presidential) Declared: 17
Emergencies Declared: 1
Causes of natural disasters: Floods: 13, Storms: 10, Mudslides: 7, Winter Storms: 5, Landslides: 4, Winds: 3, Snows: 2, Earthquake: 1, Fire: 1, Heavy Rain: 1, Hurricane: 1, Tornado: 1, Volcanic Eruption: 1, Other: 1 (Note: some incidents may be assigned to more than one category).
Hospitals and medical centers in Lynden:
Other hospitals and medical centers near Lynden:
- PIONEER RIDGE HEALTH CARE (Nursing Home, about 10 miles away; FERNDALE, WA)
- SUTTON GARDENS HEALTH CARE (Nursing Home, about 10 miles away; FERNDALE, WA)
- NORTH CASCADES HEALTH AND REHABILITATION CENTER (Nursing Home, about 10 miles away; BELLINGHAM, WA)
- WALGREENS INFUSION AND RESPIRATORY SERVICES (Home Health Center, about 11 miles away; BELLINGHAM, WA)
- NOR BELL NURSING HOME (Nursing Home, about 12 miles away; BELLINGHAM, WA)
- ALDERWOOD PARK CONV CTR LLC (Nursing Home, about 12 miles away; BELLINGHAM, WA)
- MT BAKER KIDNEY CENTER (Dialysis Facility, about 12 miles away; BELLINGHAM, WA)
Airports located in Lynden:
- Lynden Municipal Airport Jansen Field (38W) (Runways: 1, Air Taxi Ops: 50, Itinerant Ops: 3,000, Local Ops: 4,000)
Colleges/universities with over 2000 students nearest to Lynden:
- Whatcom Community College (about 11 miles; Bellingham, WA; Full-time enrollment: 3,265)
- Western Washington University (about 15 miles; Bellingham, WA; FT enrollment: 13,875)
- Skagit Valley College (about 36 miles; Mount Vernon, WA; FT enrollment: 3,803)
- Everett Community College (about 67 miles; Everett, WA; FT enrollment: 5,818)
- Peninsula College (about 74 miles; Port Angeles, WA; FT enrollment: 2,012)
- Edmonds Community College (about 79 miles; Lynnwood, WA; FT enrollment: 7,271)
- University of Washington-Bothell Campus (about 83 miles; Bothell, WA; FT enrollment: 3,902)
Public high schools in Lynden:
- LYNDEN HIGH SCHOOL (Location: 1201 BRADLEY RD, Grades: 9-12)
- LYNDEN ACADEMY (Location: 200 SOUTH BC AVE SUITE 102, Grades: KG-12)
Private high schools in Lynden:
Public elementary/middle schools in Lynden:
- FISHER ELEMENTARY SCHOOL (Location: 501 N 14TH ST, Grades: KG-5)
- LYNDEN MIDDLE SCHOOL (Location: 516 MAIN ST, Grades: 6-8)
- ISOM ELEMENTARY SCHOOL (Location: 8461 BENSON RD, Grades: KG-5)
- VOSSBECK ELEMENTARY SCHOOL (Location: 1301 BRIDGEVIEW DR, Grades: KG-5)
- MERIDIAN MIDDLE SCHOOL (Location: 861 TEN MILE ROAD, Grades: 6-8)
Private elementary/middle schools in Lynden:
User-submitted facts and corrections:
- Cornerstone Christian School (private)instituted 2001 8872 Northwood Rd. Lynden, Wa. 98264
Points of interest:
Notable locations in Lynden: Fairway Center (A), Lynden Station Park and Ride (B), Homestead Farms Golf Resort (C), Lynden Sewage Treatment Plant (D), North Whatcom Fire and Rescue Station 71 Lynden (E), Lynden Manor Assisted Living Residence (F), Christian Health Care Center (G), Meadow Greens Retirement Community (H), Lynden Fire Department (I), Lynden Pioneer Museum (J), Lynden Library (K). Display/hide their locations on the map
Shopping Center: Dutch Village Mall (1). Display/hide its location on the map
Churches in Lynden include: Hope Lutheran Church (A), Protestant Reformed Church (B), North County Christ the King Church (C), Sonlight Community Christian Reformed Church (D), First Reformed Church (E), Church of the Nazarene (F), Netherlands Reformed Church (G), Bethel Christian Reformed Church (H), Faith Reformed Church (I). Display/hide their locations on the map
Cemeteries: Lynden Cemetery (1), Monumenta Cemetery (2). Display/hide their locations on the map
Creek: Pepin Creek (A). Display/hide its location on the map
Tourist attraction: Lynden Skateway (Amusement & Theme Parks; 421 Judson Street).
Hotel: Homestead Farms Golf Resorts (115 East Homestead Boulevard).
Birthplace of: Harlan Kredit - Educator, Paul Hafford - College basketball player (Portland State Vikings), Yelkanum Seclamatan - Native leader.
Drinking water stations with addresses in Lynden and their reported violations in the past:
DELTA WATER ASSOCIATION (Population served: 420, Groundwater):Past health violations:MABERRY PACKING LLC (Population served: 256, Groundwater):Past monitoring violations:
- MCL, Single Sample - Between JAN-2014 and MAR-2014, Contaminant: Nitrate
- MCL, Single Sample - Between OCT-2013 and DEC-2013, Contaminant: Nitrate
- MCL, Single Sample - Between APR-2013 and JUN-2013, Contaminant: Nitrate. Follow-up actions: St Compliance achieved (JUL-01-2013)
- MCL, Single Sample - Between JAN-2013 and MAR-2013, Contaminant: Nitrate. Follow-up actions: St Compliance achieved (JUL-01-2013)
- MCL, Single Sample - Between JUL-2012 and SEP-2012, Contaminant: Nitrate. Follow-up actions: St Compliance achieved (OCT-01-2012)
- MCL, Single Sample - Between JAN-2012 and MAR-2012, Contaminant: Nitrate. Follow-up actions: St Compliance achieved (APR-01-2012)
- 16 other older health violations
- 82 regular monitoring violations
Past monitoring violations:BERTHUSEN ROAD WATER ASSOCIATION (Population served: 250, Purch surface water):
- One routine major monitoring violation
Past monitoring violations:CENTURY WATER ASSOCIATION (Population served: 110, Groundwater):
- One routine major monitoring violation
Past monitoring violations:CALMAN JAMES L. (Population served: 40, Groundwater):
- 53 regular monitoring violations
Past monitoring violations:BAKER VIEW WATER ASSOC (Population served: 40, Groundwater):
- Follow-up Or Routine LCR Tap M/R - In JAN-01-2006, Contaminant: Lead and Copper Rule. Follow-up actions: St Compliance achieved (DEC-31-2006)
- 5 routine major monitoring violations
- 2 regular monitoring violations
Past monitoring violations:EHLERS LABOR CAMP (Population served: 40, Groundwater):
- One routine major monitoring violation
Past health violations:Past monitoring violations:
- MCL, Single Sample - Between JAN-2013 and MAR-2013, Contaminant: Nitrate
- MCL, Single Sample - Between JAN-2012 and DEC-2012, Contaminant: Nitrate
- MCL, Single Sample - Between JAN-2011 and DEC-2011, Contaminant: Nitrate
- MCL, Single Sample - Between JAN-2010 and DEC-2010, Contaminant: Nitrate
- MCL, Single Sample - Between JAN-2009 and DEC-2009, Contaminant: Nitrate
- MCL, Single Sample - Between JAN-2008 and DEC-2008, Contaminant: Nitrate
- 3 other older health violations
- 10 routine major monitoring violations
| This city: | 2.6 people |
| Washington: | 2.5 people |
| This city: | 70.7% |
| Whole state: | 64.4% |
| This city: | 2.5% |
| Whole state: | 7.7% |
Likely homosexual households (counted as self-reported same-sex unmarried-partner households)
- Lesbian couples: 0.2% of all households
- Gay men: 0.1% of all households
People in group quarters in Lynden in 2010:
- 116 people in nursing facilities/skilled-nursing facilities
- 20 people in group homes intended for adults
- 19 people in emergency and transitional shelters (with sleeping facilities) for people experiencing homelessness
- 7 people in workers' group living quarters and job corps centers
12 people in other noninstitutional group quarters in 2000
Banks with most branches in Lynden (2011 data):
- Peoples Bank: Fairway Office, West Lynden Office, at 418 Grover Street. Info updated 2006/11/03: Bank assets: $1,224.9 mil, Deposits: $1,084.6 mil, local headquarters, positive income, Commercial Lending Specialization, 26 total offices, Holding Company: Peoples Bancorp
- Wells Fargo Bank, National Association: Lynden Branch at 1780 Front Street, branch established on 1987/06/30. Info updated 2011/04/05: Bank assets: $1,161,490.0 mil, Deposits: $905,653.0 mil, headquarters in Sioux Falls, SD, positive income, 6395 total offices, Holding Company: Wells Fargo & Company
- Union Bank, National Association: Lynden Branch at 8108 Guide Meridian Rd, branch established on 2005/05/02. Info updated 2011/09/01: Bank assets: $88,967.5 mil, Deposits: $65,286.4 mil, headquarters in San Francisco, CA, positive income, Commercial Lending Specialization, 403 total offices, Holding Company: Mitsubishi Ufj Financial Group, Inc.
- Skagit State Bank: Birch Bay at 138 Birch Bay, branch established on 2003/08/04. Info updated 2006/10/18: Bank assets: $723.3 mil, Deposits: $620.5 mil, headquarters in Burlington, WA, positive income, Commercial Lending Specialization, 12 total offices, Holding Company: Skagit State Bancorp, Inc.
- U.S. Bank National Association: Lynden Branch at 218 Front Street, branch established on 1979/12/10. Info updated 2012/01/30: Bank assets: $330,470.8 mil, Deposits: $236,091.5 mil, headquarters in Cincinnati, OH, positive income, 3121 total offices, Holding Company: U.S. Bancorp
- Banner Bank: Lynden Branch at 1980 Kok Road, branch established on 1996/08/26. Info updated 2011/05/03: Bank assets: $4,048.2 mil, Deposits: $3,348.4 mil, headquarters in Walla Walla, WA, positive income, Commercial Lending Specialization, 87 total offices, Holding Company: Banner Corporation
- Bank of the Pacific: Lynden at 1800 Front Street, branch established on 2002/12/16. Info updated 2006/11/03: Bank assets: $640.3 mil, Deposits: $548.4 mil, headquarters in Aberdeen, WA, positive income, Commercial Lending Specialization, 17 total offices, Holding Company: Pacific Financial Corporation
- Sterling Savings Bank: Lynden Branch at 1794 Front Street, branch established on 1998/06/15. Info updated 2012/03/21: Bank assets: $9,207.8 mil, Deposits: $6,454.1 mil, headquarters in Spokane, WA, positive income, Commercial Lending Specialization, 192 total offices, Holding Company: Sterling Financial Corporation
- Washington Federal: Lynden Branch at 300 Grover Street, branch established on 1979/11/09. Info updated 2011/12/19: Bank assets: $13,653.0 mil, Deposits: $8,905.8 mil, headquarters in Seattle, WA, positive income, Mortgage Lending Specialization, 174 total offices
For population 15 years and over in Lynden:
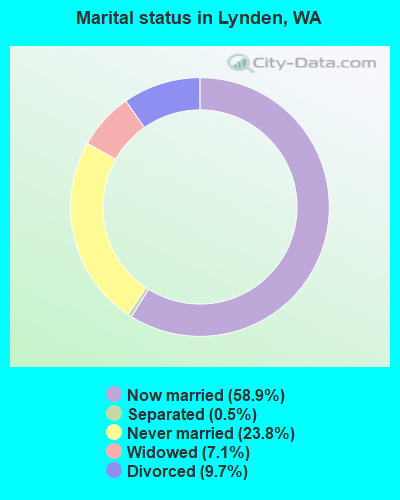
- Never married: 23.8%
- Now married: 58.9%
- Separated: 0.5%
- Widowed: 7.1%
- Divorced: 9.7%
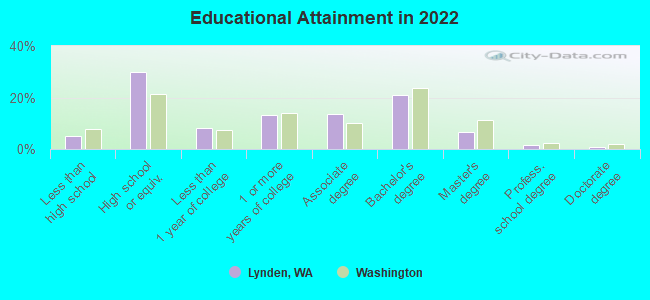
For population 25 years and over in Lynden:
- High school or higher: 93.9%
- Bachelor's degree or higher: 27.3%
- Graduate or professional degree: 8.7%
- Unemployed: 3.1%
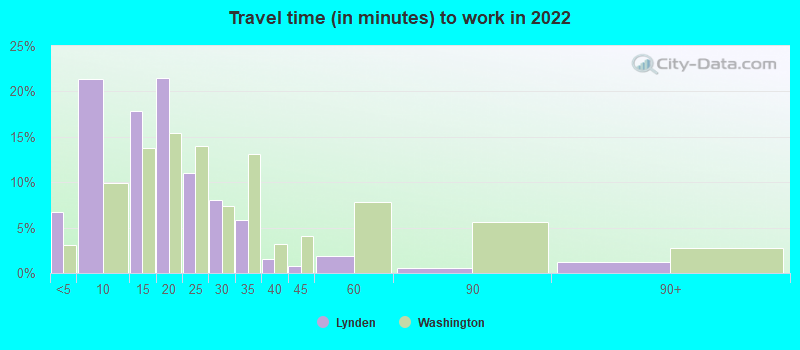
- Mean travel time to work (commute): 19.0 minutes
| Here: | 9.8 |
| Washington average: | 11.6 |
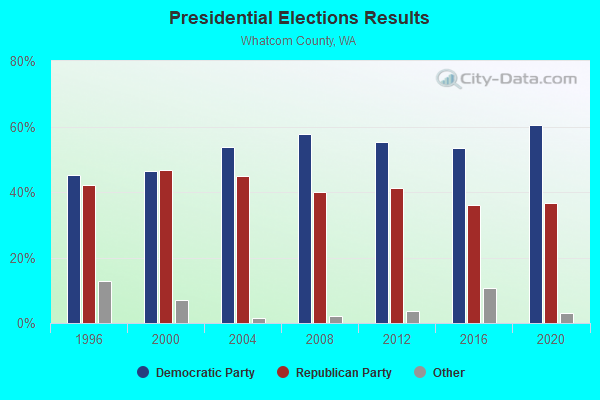

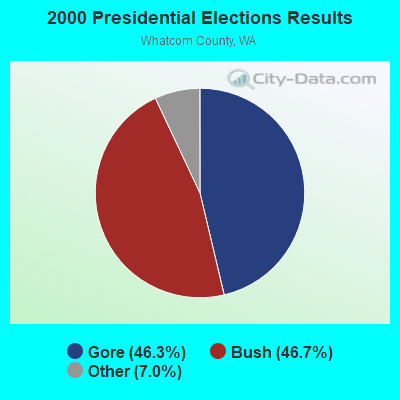

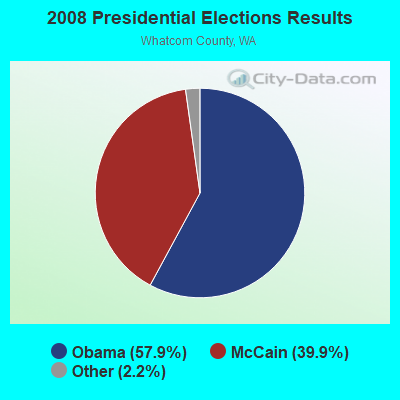
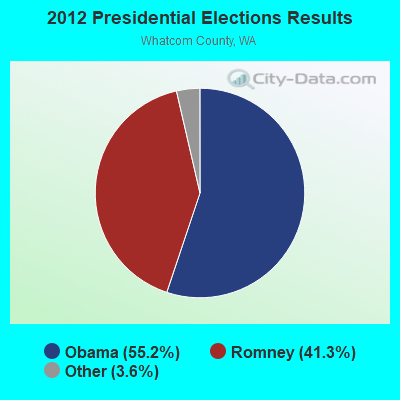
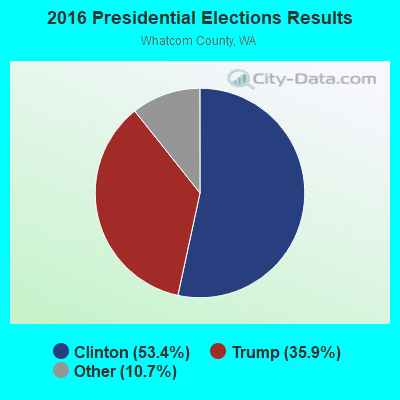
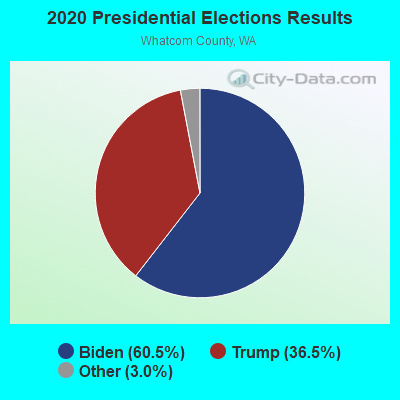
Graphs represent county-level data. Detailed 2008 Election Results
Religion statistics for Lynden, WA (based on Whatcom County data)
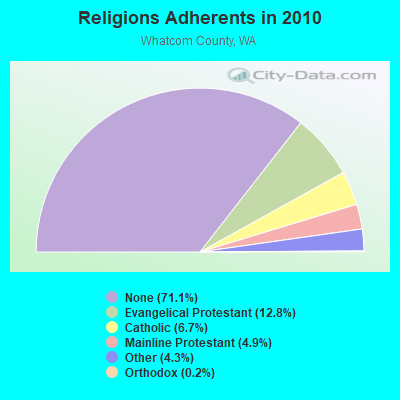
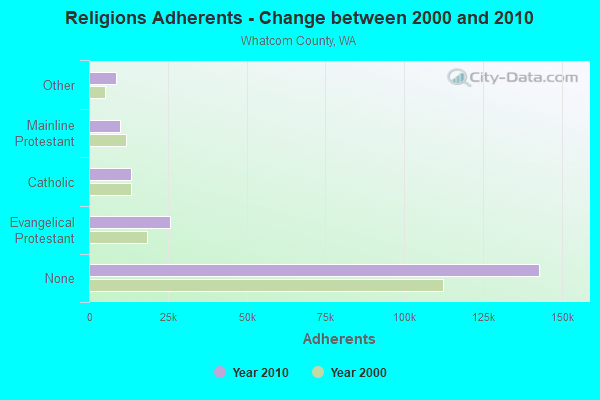
| Religion | Adherents | Congregations |
|---|---|---|
| Evangelical Protestant | 25,842 | 105 |
| Catholic | 13,397 | 6 |
| Mainline Protestant | 9,859 | 39 |
| Other | 8,714 | 33 |
| Orthodox | 370 | 2 |
| None | 142,958 | - |
Food Environment Statistics:
| This county: | 1.77 / 10,000 pop. |
| Washington: | 2.06 / 10,000 pop. |
| Here: | 0.16 / 10,000 pop. |
| Washington: | 0.19 / 10,000 pop. |
| Whatcom County: | 0.83 / 10,000 pop. |
| Washington: | 1.18 / 10,000 pop. |
| Whatcom County: | 3.80 / 10,000 pop. |
| State: | 2.67 / 10,000 pop. |
| Whatcom County: | 9.57 / 10,000 pop. |
| Washington: | 8.26 / 10,000 pop. |
| Whatcom County: | 6.1% |
| Washington: | 7.7% |
| This county: | 23.1% |
| Washington: | 25.7% |
| This county: | 14.4% |
| Washington: | 13.9% |
Health and Nutrition:
| Lynden: | 49.1% |
| State: | 49.9% |
| Lynden: | 45.0% |
| State: | 47.2% |
| This city: | 28.4 |
| Washington: | 28.4 |
| Here: | 20.6% |
| Washington: | 20.9% |
| This city: | 10.6% |
| Washington: | 10.5% |
| Lynden: | 6.9 |
| Washington: | 6.8 |
| Lynden: | 34.0% |
| State: | 32.8% |
| This city: | 54.4% |
| Washington: | 56.8% |
| Here: | 76.7% |
| Washington: | 79.4% |
More about Health and Nutrition of Lynden, WA Residents
| Local government employment and payroll (March 2022) | |||||
| Function | Full-time employees | Monthly full-time payroll | Average yearly full-time wage | Part-time employees | Monthly part-time payroll |
|---|---|---|---|---|---|
| Police Protection - Officers | 15 | $154,086 | $123,269 | 0 | $0 |
| Firefighters | 13 | $134,292 | $123,962 | 13 | $8,800 |
| Sewerage | 12 | $78,508 | $78,508 | 0 | $0 |
| Water Supply | 6 | $43,639 | $87,278 | 0 | $0 |
| Streets and Highways | 6 | $49,265 | $98,530 | 0 | $0 |
| Parks and Recreation | 6 | $41,982 | $83,964 | 0 | $0 |
| Other Government Administration | 5 | $62,420 | $149,808 | 10 | $33,872 |
| Financial Administration | 5 | $37,718 | $90,523 | 1 | $3,472 |
| Police - Other | 4 | $25,261 | $75,783 | 0 | $0 |
| Housing and Community Development (Local) | 2 | $17,425 | $104,550 | 0 | $0 |
| Judicial and Legal | 2 | $12,193 | $73,158 | 1 | $4,888 |
| Other and Unallocable | 1 | $8,676 | $104,112 | 0 | $0 |
| Fire - Other | 1 | $6,596 | $79,152 | 0 | $0 |
| Totals for Government | 78 | $672,061 | $103,394 | 25 | $51,033 |
Lynden government finances - Expenditure in 2018 (per resident):
- Construction - Regular Highways: $2,387,000 ($147.57)
Central Staff Services: $182,000 ($11.25)
Parks and Recreation: $90,000 ($5.56)
- Current Operations - Sewerage: $2,945,000 ($182.07)
Police Protection: $2,420,000 ($149.61)
Local Fire Protection: $2,184,000 ($135.02)
Water Utilities: $2,049,000 ($126.68)
Regular Highways: $1,182,000 ($73.08)
Parks and Recreation: $965,000 ($59.66)
Central Staff Services: $962,000 ($59.47)
Financial Administration: $683,000 ($42.23)
Judicial and Legal Services: $311,000 ($19.23)
General - Other: $234,000 ($14.47)
Housing and Community Development: $183,000 ($11.31)
General Public Buildings: $177,000 ($10.94)
Health - Other: $70,000 ($4.33)
Air Transportation: $55,000 ($3.40)
Libraries: $42,000 ($2.60)
Solid Waste Management: $41,000 ($2.53)
Public Welfare - Other: $20,000 ($1.24)
Parking Facilities: $6,000 ($0.37)
- General - Interest on Debt: $530,000 ($32.77)
- Intergovernmental to Local - Other - Local Fire Protection: $170,000 ($10.51)
Other - Correctional Institutions: $112,000 ($6.92)
Other - General - Other: $86,000 ($5.32)
Other - Financial Administration: $39,000 ($2.41)
Other - Health - Other: $7,000 ($0.43)
Other - Regular Highways: $6,000 ($0.37)
Other - Housing and Community Development: $6,000 ($0.37)
Other - Police Protection: $1,000 ($0.06)
Other - Sewerage: $1,000 ($0.06)
Other - Water Utilities: $1,000 ($0.06)
- Other Capital Outlay - Natural Resources - Other: $370,000 ($22.87)
Water Utilities: $355,000 ($21.95)
Sewerage: $273,000 ($16.88)
Police Protection: $105,000 ($6.49)
General - Other: $85,000 ($5.26)
Regular Highways: $82,000 ($5.07)
Local Fire Protection: $43,000 ($2.66)
Financial Administration: $11,000 ($0.68)
Parks and Recreation: $5,000 ($0.31)
- Total Salaries and Wages: $6,177,000 ($381.89)
- Water Utilities - Interest on Debt: $731,000 ($45.19)
Lynden government finances - Revenue in 2018 (per resident):
- Charges - Sewerage: $4,694,000 ($290.20)
Other: $1,002,000 ($61.95)
Regular Highways: $110,000 ($6.80)
- Local Intergovernmental - Other: $108,000 ($6.68)
- Miscellaneous - Donations From Private Sources: $1,710,000 ($105.72)
Fines and Forfeits: $165,000 ($10.20)
Sale of Property: $118,000 ($7.30)
Special Assessments: $103,000 ($6.37)
Rents: $101,000 ($6.24)
General Revenue - Other: $73,000 ($4.51)
Interest Earnings: $0 ($0.00)
- Revenue - Water Utilities: $4,465,000 ($276.04)
- State Intergovernmental - Other: $760,000 ($46.99)
Highways: $676,000 ($41.79)
General Local Government Support: $185,000 ($11.44)
Health and Hospitals: $1,000 ($0.06)
- Tax - General Sales and Gross Receipts: $3,609,000 ($223.12)
Property: $3,274,000 ($202.41)
Public Utilities Sales: $2,141,000 ($132.36)
Documentary and Stock Transfer: $854,000 ($52.80)
Other License: $545,000 ($33.69)
Other Selective Sales: $81,000 ($5.01)
Occupation and Business License - Other: $5,000 ($0.31)
Lynden government finances - Debt in 2018 (per resident):
- Long Term Debt - Beginning Outstanding - Unspecified Public Purpose: $62,565,000 ($3868.01)
Outstanding Unspecified Public Purpose: $56,390,000 ($3486.24)
Retired Unspecified Public Purpose: $15,396,000 ($951.84)
Issue, Unspecified Public Purpose: $9,222,000 ($570.14)
| Businesses in Lynden, WA | ||||
| Name | Count | Name | Count | |
|---|---|---|---|---|
| Ace Hardware | 1 | McDonald's | 1 | |
| Blockbuster | 1 | Nike | 2 | |
| Burger King | 1 | RadioShack | 1 | |
| Chevrolet | 1 | Rite Aid | 1 | |
| Curves | 1 | Safeway | 1 | |
| Dairy Queen | 1 | Sprint Nextel | 1 | |
| FedEx | 2 | Starbucks | 2 | |
| GNC | 1 | Subway | 1 | |
| H&R Block | 1 | True Value | 1 | |
| Jack In The Box | 1 | U-Haul | 2 | |
| Little Caesars Pizza | 1 | UPS | 4 | |
| MasterBrand Cabinets | 2 | Vons | 1 | |
Strongest AM radio stations in Lynden:
- KRPI (1550 AM; 50 kW; FERNDALE, WA; Owner: BBC BROADCASTING, INC.)
- KARI (550 AM; 25 kW; BLAINE, WA; Owner: WAY BROADCASTING, INC.)
- KPUG (1170 AM; 10 kW; BELLINGHAM, WA; Owner: SAGA BROADCASTING, LLC)
- KGMI (790 AM; 5 kW; BELLINGHAM, WA)
- KAPS (660 AM; 10 kW; MOUNT VERNON, WA; Owner: VALLEY BROADCASTERS, INC.)
- KBAI (930 AM; 1 kW; BELLINGHAM, WA; Owner: SAGA BROADCASTING, LLC)
- KRKO (1380 AM; 50 kW; EVERETT, WA; Owner: S-R BROADCASTING, CO.)
- KIXI (880 AM; 50 kW; MERCER ISLAND/SEATTL, WA; Owner: BELLEVUE RADIO, INC.)
- KIRO (710 AM; 50 kW; SEATTLE, WA; Owner: ENTERCOM SEATTLE LICENSE, LLC)
- KTTH (770 AM; 50 kW; SEATTLE, WA; Owner: ENTERCOM SEATTLE LICENSE, LLC)
- KGNW (820 AM; 50 kW; BURIEN-SEATTLE, WA; Owner: INSPIRATION MEDIA, INC.)
- KKOL (1300 AM; 50 kW; SEATTLE, WA; Owner: INSPIRATION MEDIA, INC.)
- KOMO (1000 AM; 50 kW; SEATTLE, WA; Owner: FISHER BROADCASTING - SEATTLE RADIO, L.L.C.)
Strongest FM radio stations in Lynden:
- K201FH (88.1 FM; BELLINGHAM, WA; Owner: CALVARY CHAPEL OF TWIN FALLS, INC.)
- K210CN (89.9 FM; BELLINGHAM, WA; Owner: CALVARY CHAPEL OF TWIN FALLS, INC.)
- KISM (92.9 FM; BELLINGHAM, WA; Owner: SAGA BROADCASTING, LLC)
- KWPZ (106.5 FM; LYNDEN, WA; Owner: CRISTA MINISTRIES, INC.)
- KAFE (104.3 FM; BELLINGHAM, WA; Owner: SAGA BROADCASTING, LLC)
- KZAZ (91.7 FM; BELLINGHAM, WA; Owner: WASHINGTON STATE UNIVERSITY)
- KUGS (89.3 FM; BELLINGHAM, WA; Owner: WESTERN WASHINGTON UNIVERSITY)
- KSVR (91.7 FM; MOUNT VERNON, WA; Owner: BOARD OF TRUSTEES OF SKAGIT VALLEY COLLEGE)
- K206CU (89.1 FM; MOUNT VERNON, WA; Owner: CALVARY CHAPEL OF TWIN FALLS, INC.)
TV broadcast stations around Lynden:
- KBCB (Channel 24; BELLINGHAM, WA; Owner: WORLD TELEVISION OF WASHINGTON, LLC.)
- K36BO (Channel 36; DEMING, WA; Owner: TV DISTRICT #1)
- KVOS-TV (Channel 12; BELLINGHAM, WA; Owner: ACKERLEY MEDIA GROUP, INC.)
- National Bridge Inventory (NBI) Statistics
- 37Number of bridges
- 479ft / 146mTotal length
- $115,593,000Total costs
- 211,210Total average daily traffic
- 13,267Total average daily truck traffic
- 291,063Total future (year 2038) average daily traffic
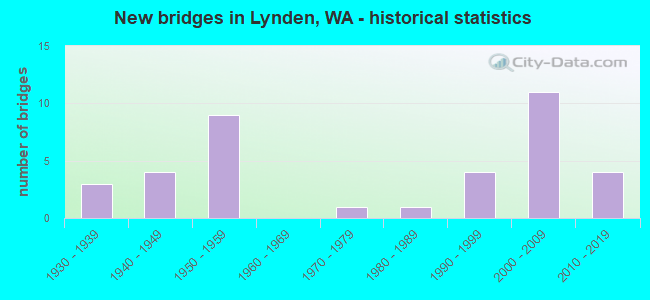
- New bridges - historical statistics
- 31930-1939
- 41940-1949
- 91950-1959
- 11970-1979
- 11980-1989
- 41990-1999
- 112000-2009
- 42010-2019
FCC Registered Antenna Towers: 84 (See the full list of FCC Registered Antenna Towers)
FCC Registered Broadcast Land Mobile Towers: 23 (See the full list of FCC Registered Broadcast Land Mobile Towers in Lynden, WA)
FCC Registered Microwave Towers: 17 (See the full list of FCC Registered Microwave Towers in this town)
FCC Registered Amateur Radio Licenses: 181 (See the full list of FCC Registered Amateur Radio Licenses in Lynden)
FAA Registered Aircraft: 47 (See the full list of FAA Registered Aircraft in Lynden)
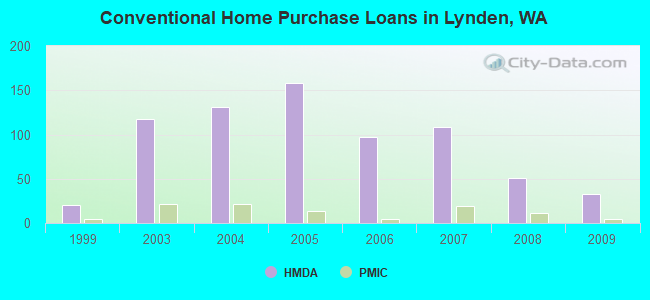
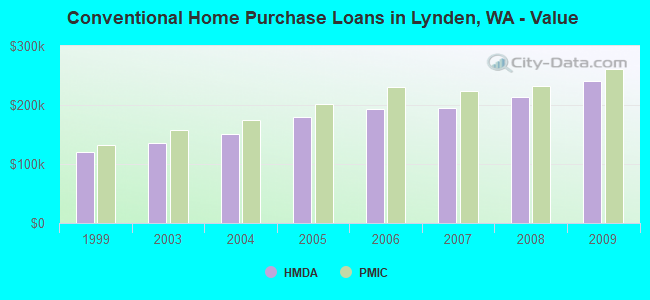
| Home Mortgage Disclosure Act Aggregated Statistics For Year 2009 (Based on 2 partial tracts) | ||||||||||||
| A) FHA, FSA/RHS & VA Home Purchase Loans | B) Conventional Home Purchase Loans | C) Refinancings | D) Home Improvement Loans | E) Loans on Dwellings For 5+ Families | F) Non-occupant Loans on < 5 Family Dwellings (A B C & D) | |||||||
|---|---|---|---|---|---|---|---|---|---|---|---|---|
| Number | Average Value | Number | Average Value | Number | Average Value | Number | Average Value | Number | Average Value | Number | Average Value | |
| LOANS ORIGINATED | 24 | $243,508 | 33 | $240,596 | 209 | $222,065 | 9 | $179,507 | 1 | $554,360 | 7 | $213,413 |
| APPLICATIONS APPROVED, NOT ACCEPTED | 3 | $201,680 | 3 | $286,157 | 13 | $222,635 | 1 | $232,760 | 0 | $0 | 0 | $0 |
| APPLICATIONS DENIED | 3 | $269,960 | 3 | $257,397 | 41 | $247,221 | 2 | $152,015 | 0 | $0 | 5 | $184,358 |
| APPLICATIONS WITHDRAWN | 3 | $297,473 | 8 | $242,802 | 34 | $228,913 | 1 | $216,110 | 0 | $0 | 2 | $208,795 |
| FILES CLOSED FOR INCOMPLETENESS | 0 | $0 | 2 | $233,205 | 1 | $273,520 | 1 | $126,490 | 0 | $0 | 1 | $123,980 |
Detailed HMDA statistics for the following Tracts: 0103.02 , 0103.03
| Private Mortgage Insurance Companies Aggregated Statistics For Year 2009 (Based on 2 partial tracts) | ||||
| A) Conventional Home Purchase Loans | B) Refinancings | |||
|---|---|---|---|---|
| Number | Average Value | Number | Average Value | |
| LOANS ORIGINATED | 5 | $260,286 | 8 | $268,975 |
| APPLICATIONS APPROVED, NOT ACCEPTED | 3 | $331,853 | 3 | $259,710 |
| APPLICATIONS DENIED | 0 | $0 | 4 | $204,775 |
| APPLICATIONS WITHDRAWN | 0 | $0 | 1 | $231,870 |
| FILES CLOSED FOR INCOMPLETENESS | 0 | $0 | 0 | $0 |
Detailed PMIC statistics for the following Tracts: 0103.02 , 0103.03
2002 - 2018 National Fire Incident Reporting System (NFIRS) incidents
- Fire incident types reported to NFIRS in Lynden, WA
- 55745.1%Outside Fires
- 42634.5%Structure Fires
- 13110.6%Mobile Property/Vehicle Fires
- 1209.7%Other
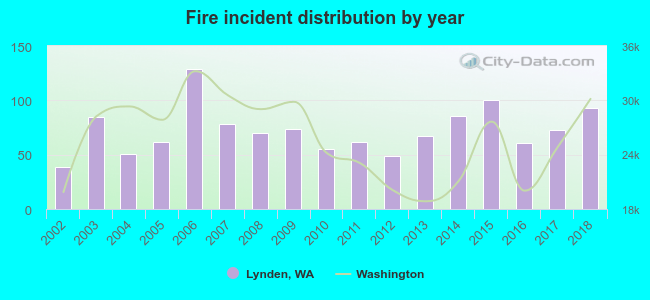 According to the data from the years 2002 - 2018 the average number of fires per year is 73. The highest number of fire incidents - 129 took place in 2006, and the least - 39 in 2002. The data has a growing trend.
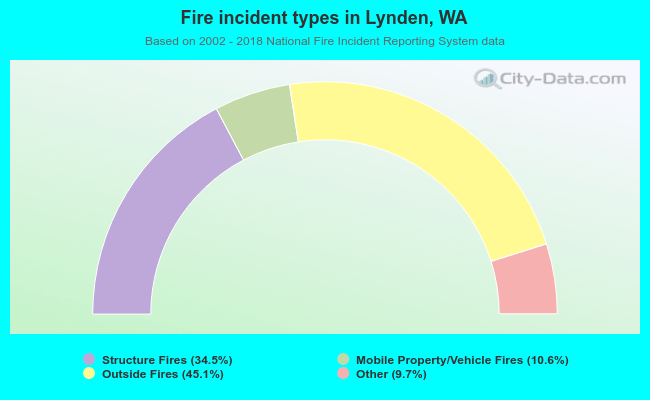 When looking into fire subcategories, the most reports belonged to: Outside Fires (45.1%), and Structure Fires (34.5%).
Fire-safe hotels and motels in Lynden, Washington:
- Century House Bed & Breakfast, 401 S British Columbia Ave, Lynden, Washington 98264 , Phone: (360) 354-2439
- Homestead Farms Golf Resort & Convention Center, 115 E Homestead Blvd, Lynden, Washington 98264 , Phone: (360) 354-1196, Fax: (360) 354-5614
| Most common first names in Lynden, WA among deceased individuals | ||
| Name | Count | Lived (average) |
|---|---|---|
| John | 122 | 79.2 years |
| William | 73 | 79.6 years |
| Henry | 47 | 80.8 years |
| Robert | 41 | 75.4 years |
| Mary | 40 | 83.3 years |
| Alice | 39 | 82.2 years |
| Charles | 34 | 81.8 years |
| George | 33 | 79.7 years |
| Peter | 32 | 79.2 years |
| Gerrit | 31 | 81.5 years |
| Most common last names in Lynden, WA among deceased individuals | ||
| Last name | Count | Lived (average) |
|---|---|---|
| Smith | 22 | 77.0 years |
| Johnson | 22 | 83.7 years |
| Anderson | 21 | 81.3 years |
| Dejong | 19 | 80.5 years |
| Bajema | 18 | 82.3 years |
| Vandergriend | 17 | 81.4 years |
| Honcoop | 17 | 75.6 years |
| Stremler | 16 | 77.1 years |
| Bosman | 15 | 78.5 years |
| Devries | 13 | 83.8 years |
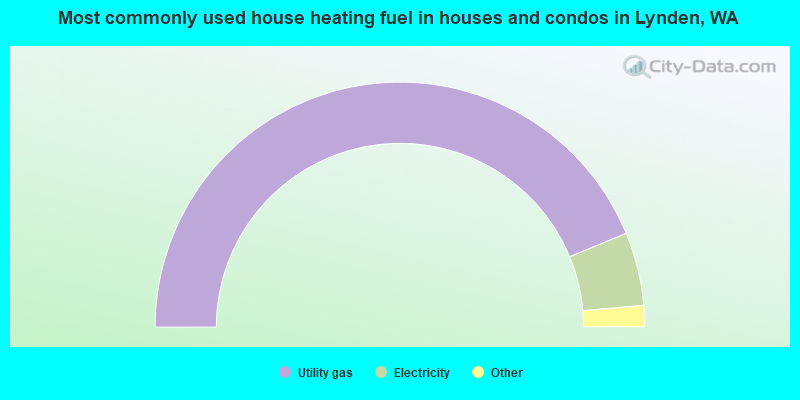
- 87.6%Utility gas
- 9.7%Electricity
- 1.6%Bottled, tank, or LP gas
- 1.1%Wood
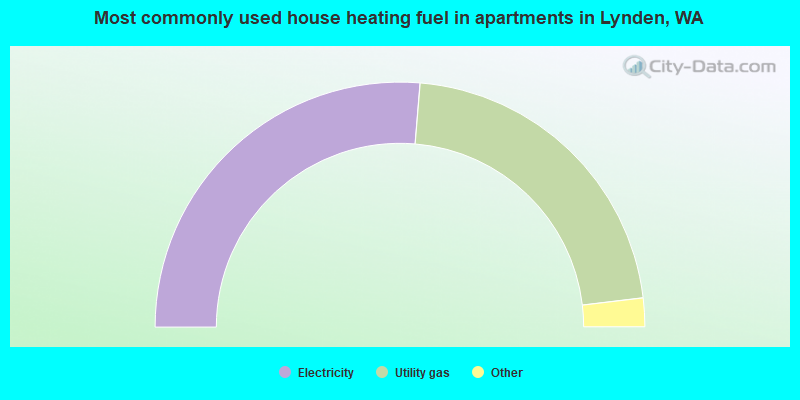
- 52.7%Electricity
- 43.6%Utility gas
- 2.8%Wood
- 0.5%No fuel used
- 0.4%Other fuel
Lynden compared to Washington state average:
- Unemployed percentage significantly below state average.
- Black race population percentage below state average.
- Hispanic race population percentage above state average.
- Median age above state average.
- House age below state average.
Lynden on our top lists:
- #25 on the list of "Top 101 cities with the most residents born in Netherlands (population 500+)"
- #67 on the list of "Top 101 cities with the smallest percentage of likely homosexual households (counted as self-reported same-sex unmarried-partner households) (population 5,000+)"
- #88 on the list of "Top 101 cities with the largest percentage of people in other group homes (population 1,000+)"
- #84 (98264) on the list of "Top 101 zip codes with the largest percentage of Dutch first ancestries"
- #7 on the list of "Top 101 counties with the lowest Ozone (1-hour) air pollution readings in 2012 (ppm)"
- #8 on the list of "Top 101 counties with the lowest Particulate Matter (PM2.5) Annual air pollution readings in 2012 (µg/m3)"
- #42 on the list of "Top 101 counties with highest percentage of residents voting for 3rd party candidates in the 2012 Presidential Election (pop. 50,000+)"

|
|
Total of 75 patent applications in 2008-2024.