Port Allen, Louisiana Submit your own pictures of this city and show them to the world
OSM Map
General Map
Google Map
MSN Map
OSM Map
General Map
Google Map
MSN Map
OSM Map
General Map
Google Map
MSN Map
OSM Map
General Map
Google Map
MSN Map
Please wait while loading the map...
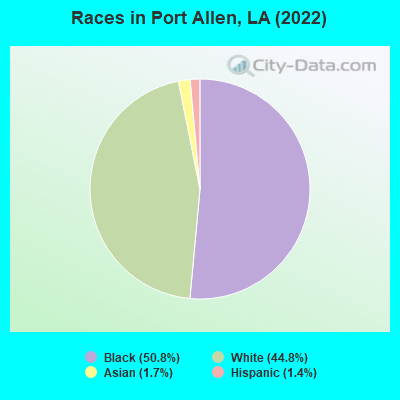
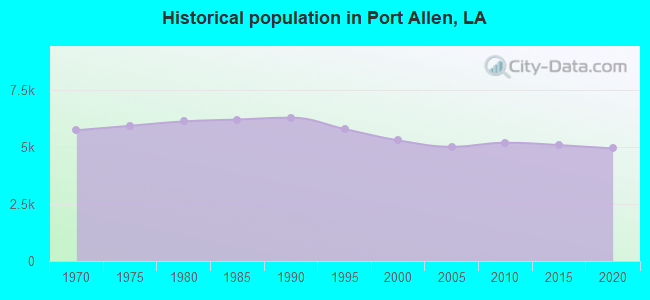
Population in 2022: 4,909 (100% urban, 0% rural). Population change since 2000: -7.0%Males: 2,037 Females: 2,872
March 2022 cost of living index in Port Allen: 89.6 (less than average, U.S. average is 100) Percentage of residents living in poverty in 2022: 14.9%for White Non-Hispanic residents , 23.1% for Black residents )
Profiles of local businesses
Business Search - 14 Million verified businesses
Data:
Median household income ($)
Median household income (% change since 2000)
Household income diversity
Ratio of average income to average house value (%)
Ratio of average income to average rent
Median household income ($) - White
Median household income ($) - Black or African American
Median household income ($) - Asian
Median household income ($) - Hispanic or Latino
Median household income ($) - American Indian and Alaska Native
Median household income ($) - Multirace
Median household income ($) - Other Race
Median household income for houses/condos with a mortgage ($)
Median household income for apartments without a mortgage ($)
Races - White alone (%)
Races - White alone (% change since 2000)
Races - Black alone (%)
Races - Black alone (% change since 2000)
Races - American Indian alone (%)
Races - American Indian alone (% change since 2000)
Races - Asian alone (%)
Races - Asian alone (% change since 2000)
Races - Hispanic (%)
Races - Hispanic (% change since 2000)
Races - Native Hawaiian and Other Pacific Islander alone (%)
Races - Native Hawaiian and Other Pacific Islander alone (% change since 2000)
Races - Two or more races (%)
Races - Two or more races (% change since 2000)
Races - Other race alone (%)
Races - Other race alone (% change since 2000)
Racial diversity
Unemployment (%)
Unemployment (% change since 2000)
Unemployment (%) - White
Unemployment (%) - Black or African American
Unemployment (%) - Asian
Unemployment (%) - Hispanic or Latino
Unemployment (%) - American Indian and Alaska Native
Unemployment (%) - Multirace
Unemployment (%) - Other Race
Population density (people per square mile)
Population - Males (%)
Population - Females (%)
Population - Males (%) - White
Population - Males (%) - Black or African American
Population - Males (%) - Asian
Population - Males (%) - Hispanic or Latino
Population - Males (%) - American Indian and Alaska Native
Population - Males (%) - Multirace
Population - Males (%) - Other Race
Population - Females (%) - White
Population - Females (%) - Black or African American
Population - Females (%) - Asian
Population - Females (%) - Hispanic or Latino
Population - Females (%) - American Indian and Alaska Native
Population - Females (%) - Multirace
Population - Females (%) - Other Race
Coronavirus confirmed cases (Apr 24, 2024)
Deaths caused by coronavirus (Apr 24, 2024)
Coronavirus confirmed cases (per 100k population) (Apr 24, 2024)
Deaths caused by coronavirus (per 100k population) (Apr 24, 2024)
Daily increase in number of cases (Apr 24, 2024)
Weekly increase in number of cases (Apr 24, 2024)
Cases doubled (in days) (Apr 24, 2024)
Hospitalized patients (Apr 18, 2022)
Negative test results (Apr 18, 2022)
Total test results (Apr 18, 2022)
COVID Vaccine doses distributed (per 100k population) (Sep 19, 2023)
COVID Vaccine doses administered (per 100k population) (Sep 19, 2023)
COVID Vaccine doses distributed (Sep 19, 2023)
COVID Vaccine doses administered (Sep 19, 2023)
Likely homosexual households (%)
Likely homosexual households (% change since 2000)
Likely homosexual households - Lesbian couples (%)
Likely homosexual households - Lesbian couples (% change since 2000)
Likely homosexual households - Gay men (%)
Likely homosexual households - Gay men (% change since 2000)
Cost of living index
Median gross rent ($)
Median contract rent ($)
Median monthly housing costs ($)
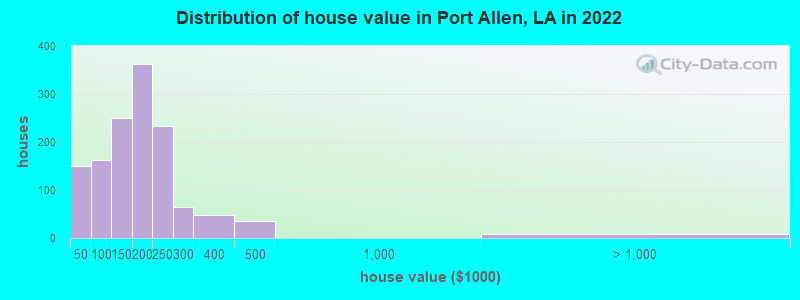
Median house or condo value ($)
Median house or condo value ($ change since 2000)
Mean house or condo value by units in structure - 1, detached ($)
Mean house or condo value by units in structure - 1, attached ($)
Mean house or condo value by units in structure - 2 ($)
Mean house or condo value by units in structure by units in structure - 3 or 4 ($)
Mean house or condo value by units in structure - 5 or more ($)
Mean house or condo value by units in structure - Boat, RV, van, etc. ($)
Mean house or condo value by units in structure - Mobile home ($)
Median house or condo value ($) - White
Median house or condo value ($) - Black or African American
Median house or condo value ($) - Asian
Median house or condo value ($) - Hispanic or Latino
Median house or condo value ($) - American Indian and Alaska Native
Median house or condo value ($) - Multirace
Median house or condo value ($) - Other Race
Median resident age
Resident age diversity
Median resident age - Males
Median resident age - Females
Median resident age - White
Median resident age - Black or African American
Median resident age - Asian
Median resident age - Hispanic or Latino
Median resident age - American Indian and Alaska Native
Median resident age - Multirace
Median resident age - Other Race
Median resident age - Males - White
Median resident age - Males - Black or African American
Median resident age - Males - Asian
Median resident age - Males - Hispanic or Latino
Median resident age - Males - American Indian and Alaska Native
Median resident age - Males - Multirace
Median resident age - Males - Other Race
Median resident age - Females - White
Median resident age - Females - Black or African American
Median resident age - Females - Asian
Median resident age - Females - Hispanic or Latino
Median resident age - Females - American Indian and Alaska Native
Median resident age - Females - Multirace
Median resident age - Females - Other Race
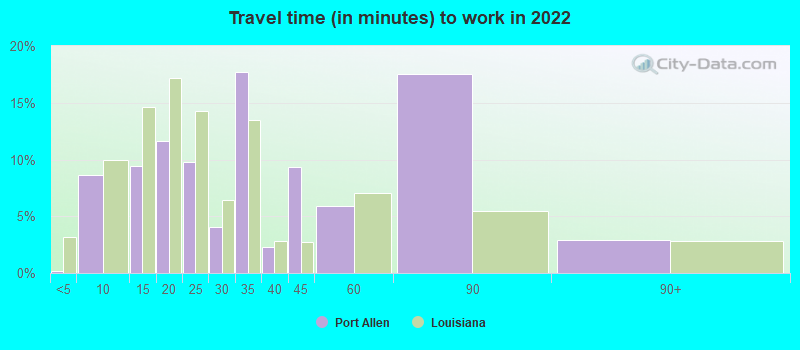
Commute - mean travel time to work (minutes)
Travel time to work - Less than 5 minutes (%)
Travel time to work - Less than 5 minutes (% change since 2000)
Travel time to work - 5 to 9 minutes (%)
Travel time to work - 5 to 9 minutes (% change since 2000)
Travel time to work - 10 to 19 minutes (%)
Travel time to work - 10 to 19 minutes (% change since 2000)
Travel time to work - 20 to 29 minutes (%)
Travel time to work - 20 to 29 minutes (% change since 2000)
Travel time to work - 30 to 39 minutes (%)
Travel time to work - 30 to 39 minutes (% change since 2000)
Travel time to work - 40 to 59 minutes (%)
Travel time to work - 40 to 59 minutes (% change since 2000)
Travel time to work - 60 to 89 minutes (%)
Travel time to work - 60 to 89 minutes (% change since 2000)
Travel time to work - 90 or more minutes (%)
Travel time to work - 90 or more minutes (% change since 2000)
Marital status - Never married (%)
Marital status - Now married (%)
Marital status - Separated (%)
Marital status - Widowed (%)
Marital status - Divorced (%)
Median family income ($)
Median family income (% change since 2000)
Median non-family income ($)
Median non-family income (% change since 2000)
Median per capita income ($)
Median per capita income (% change since 2000)
Median family income ($) - White
Median family income ($) - Black or African American
Median family income ($) - Asian
Median family income ($) - Hispanic or Latino
Median family income ($) - American Indian and Alaska Native
Median family income ($) - Multirace
Median family income ($) - Other Race
Median year house/condo built
Median year apartment built
Year house built - Built 2005 or later (%)
Year house built - Built 2000 to 2004 (%)
Year house built - Built 1990 to 1999 (%)
Year house built - Built 1980 to 1989 (%)
Year house built - Built 1970 to 1979 (%)
Year house built - Built 1960 to 1969 (%)
Year house built - Built 1950 to 1959 (%)
Year house built - Built 1940 to 1949 (%)
Year house built - Built 1939 or earlier (%)
Average household size
Household density (households per square mile)
Average household size - White
Average household size - Black or African American
Average household size - Asian
Average household size - Hispanic or Latino
Average household size - American Indian and Alaska Native
Average household size - Multirace
Average household size - Other Race
Occupied housing units (%)
Vacant housing units (%)
Owner occupied housing units (%)
Renter occupied housing units (%)
Vacancy status - For rent (%)
Vacancy status - For sale only (%)
Vacancy status - Rented or sold, not occupied (%)
Vacancy status - For seasonal, recreational, or occasional use (%)
Vacancy status - For migrant workers (%)
Vacancy status - Other vacant (%)
Residents with income below the poverty level (%)
Residents with income below 50% of the poverty level (%)
Children below poverty level (%)
Poor families by family type - Married-couple family (%)
Poor families by family type - Male, no wife present (%)
Poor families by family type - Female, no husband present (%)
Poverty status for native-born residents (%)
Poverty status for foreign-born residents (%)
Poverty among high school graduates not in families (%)
Poverty among people who did not graduate high school not in families (%)
Residents with income below the poverty level (%) - White
Residents with income below the poverty level (%) - Black or African American
Residents with income below the poverty level (%) - Asian
Residents with income below the poverty level (%) - Hispanic or Latino
Residents with income below the poverty level (%) - American Indian and Alaska Native
Residents with income below the poverty level (%) - Multirace
Residents with income below the poverty level (%) - Other Race
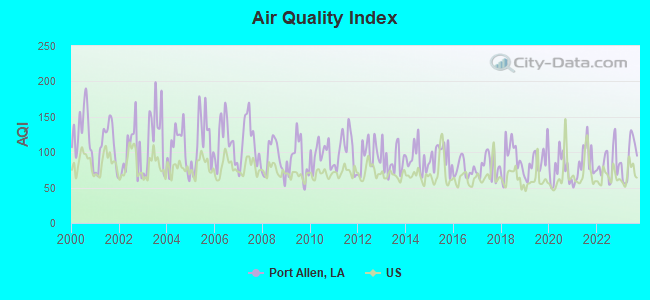
Air pollution - Air Quality Index (AQI)
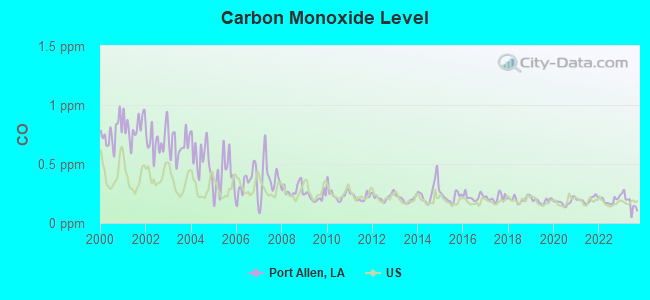
Air pollution - CO
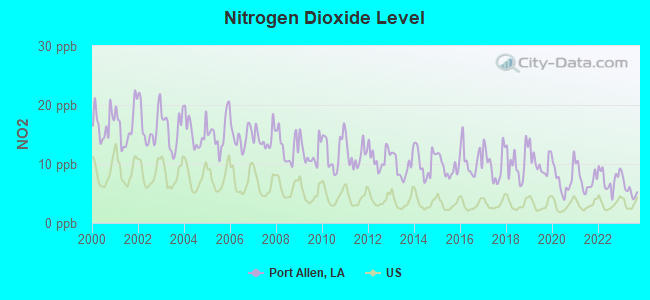
Air pollution - NO2
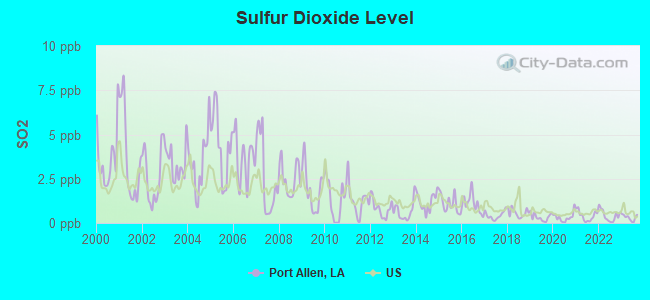
Air pollution - SO2
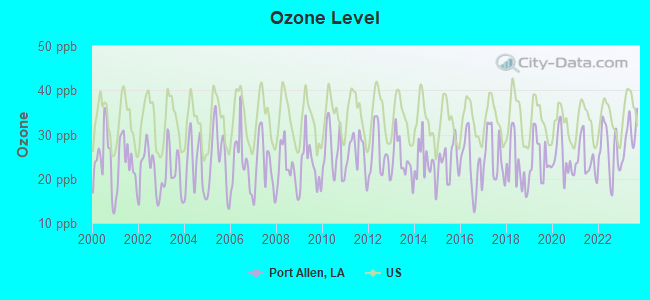
Air pollution - Ozone
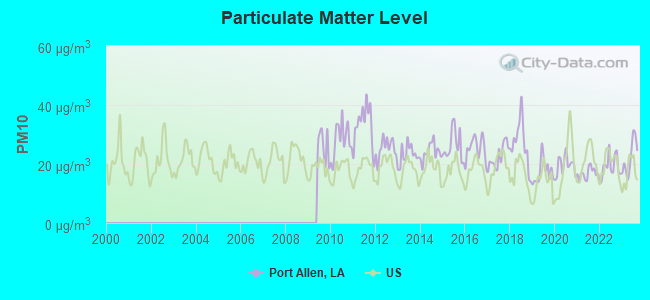
Air pollution - PM10
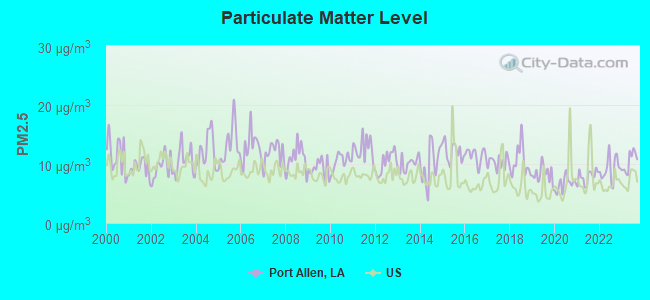
Air pollution - PM25
Air pollution - Pb
Crime - Murders per 100,000 population
Crime - Rapes per 100,000 population
Crime - Robberies per 100,000 population
Crime - Assaults per 100,000 population
Crime - Burglaries per 100,000 population
Crime - Thefts per 100,000 population
Crime - Auto thefts per 100,000 population
Crime - Arson per 100,000 population
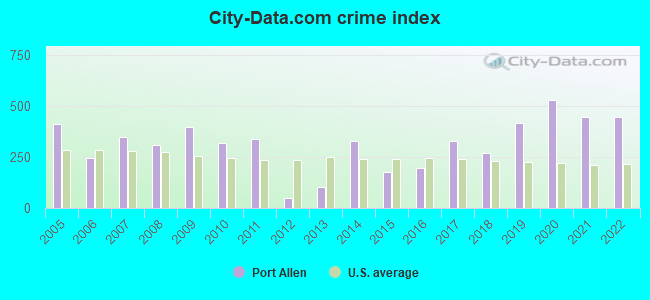
Crime - City-data.com crime index
Crime - Violent crime index
Crime - Property crime index
Crime - Murders per 100,000 population (5 year average)
Crime - Rapes per 100,000 population (5 year average)
Crime - Robberies per 100,000 population (5 year average)
Crime - Assaults per 100,000 population (5 year average)
Crime - Burglaries per 100,000 population (5 year average)
Crime - Thefts per 100,000 population (5 year average)
Crime - Auto thefts per 100,000 population (5 year average)
Crime - Arson per 100,000 population (5 year average)
Crime - City-data.com crime index (5 year average)
Crime - Violent crime index (5 year average)
Crime - Property crime index (5 year average)
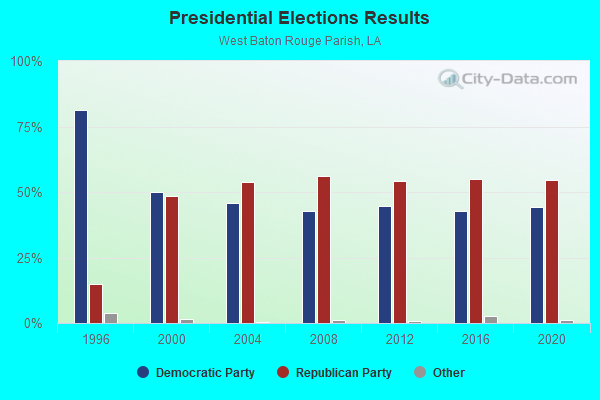
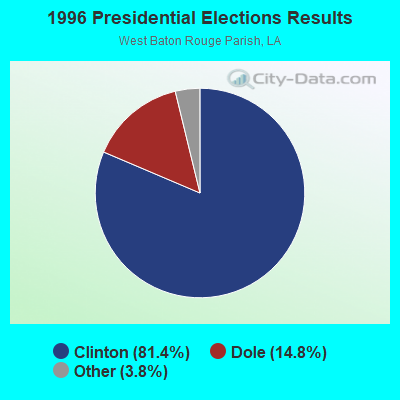
1996 Presidential Elections Results (%) - Democratic Party (Clinton)
1996 Presidential Elections Results (%) - Republican Party (Dole)
1996 Presidential Elections Results (%) - Other
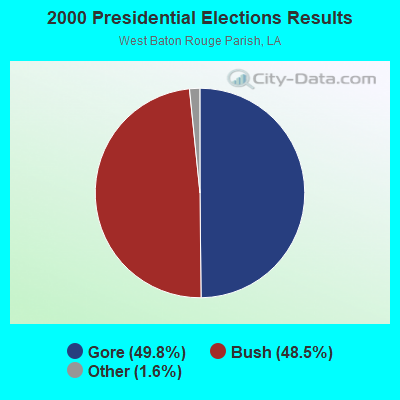
2000 Presidential Elections Results (%) - Democratic Party (Gore)
2000 Presidential Elections Results (%) - Republican Party (Bush)
2000 Presidential Elections Results (%) - Other
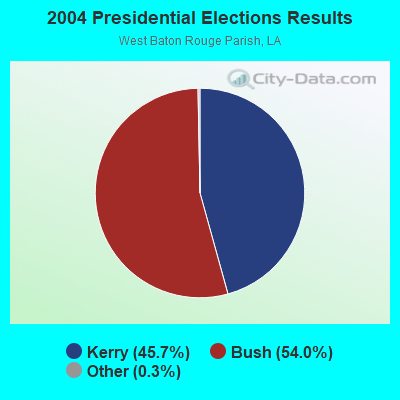
2004 Presidential Elections Results (%) - Democratic Party (Kerry)
2004 Presidential Elections Results (%) - Republican Party (Bush)
2004 Presidential Elections Results (%) - Other
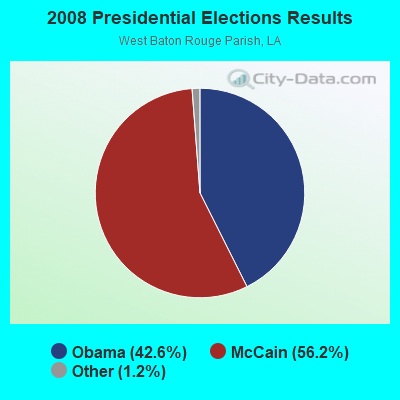
2008 Presidential Elections Results (%) - Democratic Party (Obama)
2008 Presidential Elections Results (%) - Republican Party (McCain)
2008 Presidential Elections Results (%) - Other
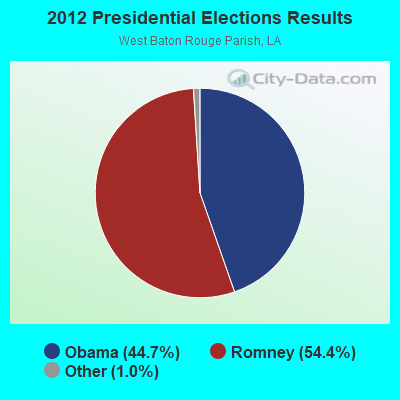
2012 Presidential Elections Results (%) - Democratic Party (Obama)
2012 Presidential Elections Results (%) - Republican Party (Romney)
2012 Presidential Elections Results (%) - Other
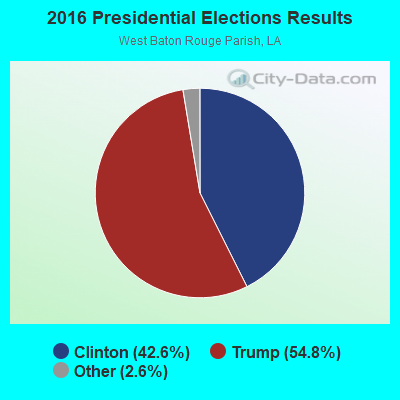
2016 Presidential Elections Results (%) - Democratic Party (Clinton)
2016 Presidential Elections Results (%) - Republican Party (Trump)
2016 Presidential Elections Results (%) - Other
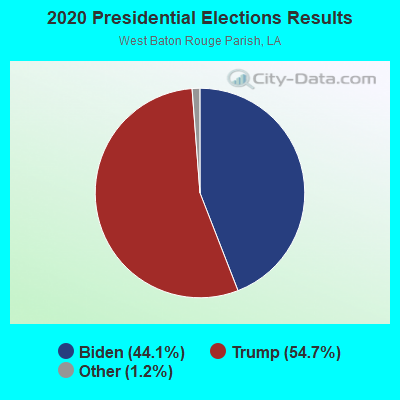
2020 Presidential Elections Results (%) - Democratic Party (Biden)
2020 Presidential Elections Results (%) - Republican Party (Trump)
2020 Presidential Elections Results (%) - Other
Ancestries Reported - Arab (%)
Ancestries Reported - Czech (%)
Ancestries Reported - Danish (%)
Ancestries Reported - Dutch (%)
Ancestries Reported - English (%)
Ancestries Reported - French (%)
Ancestries Reported - French Canadian (%)
Ancestries Reported - German (%)
Ancestries Reported - Greek (%)
Ancestries Reported - Hungarian (%)
Ancestries Reported - Irish (%)
Ancestries Reported - Italian (%)
Ancestries Reported - Lithuanian (%)
Ancestries Reported - Norwegian (%)
Ancestries Reported - Polish (%)
Ancestries Reported - Portuguese (%)
Ancestries Reported - Russian (%)
Ancestries Reported - Scotch-Irish (%)
Ancestries Reported - Scottish (%)
Ancestries Reported - Slovak (%)
Ancestries Reported - Subsaharan African (%)
Ancestries Reported - Swedish (%)
Ancestries Reported - Swiss (%)
Ancestries Reported - Ukrainian (%)
Ancestries Reported - United States (%)
Ancestries Reported - Welsh (%)
Ancestries Reported - West Indian (%)
Ancestries Reported - Other (%)
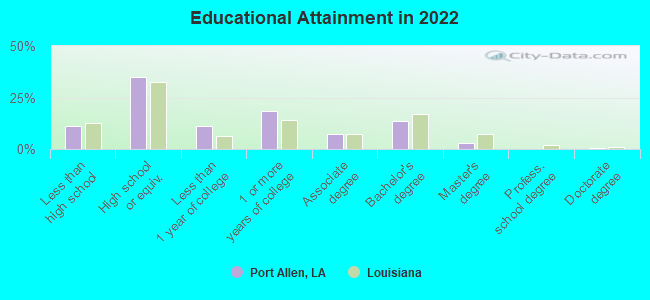
Educational Attainment - No schooling completed (%)
Educational Attainment - Less than high school (%)
Educational Attainment - High school or equivalent (%)
Educational Attainment - Less than 1 year of college (%)
Educational Attainment - 1 or more years of college (%)
Educational Attainment - Associate degree (%)
Educational Attainment - Bachelor's degree (%)
Educational Attainment - Master's degree (%)
Educational Attainment - Professional school degree (%)
Educational Attainment - Doctorate degree (%)
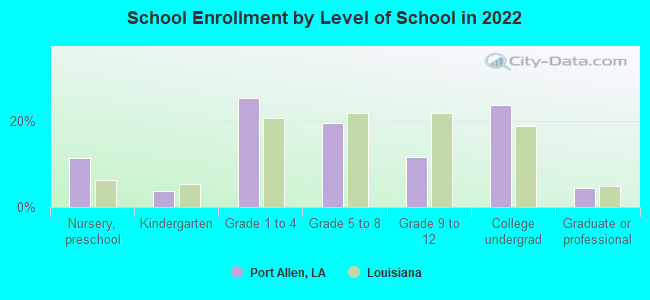
School Enrollment - Nursery, preschool (%)
School Enrollment - Kindergarten (%)
School Enrollment - Grade 1 to 4 (%)
School Enrollment - Grade 5 to 8 (%)
School Enrollment - Grade 9 to 12 (%)
School Enrollment - College undergrad (%)
School Enrollment - Graduate or professional (%)
School Enrollment - Not enrolled in school (%)
School enrollment - Public schools (%)
School enrollment - Private schools (%)
School enrollment - Not enrolled (%)
Median number of rooms in houses and condos
Median number of rooms in apartments
Housing units lacking complete plumbing facilities (%)
Housing units lacking complete kitchen facilities (%)
Density of houses
Urban houses (%)
Rural houses (%)
Households with people 60 years and over (%)
Households with people 65 years and over (%)
Households with people 75 years and over (%)
Households with one or more nonrelatives (%)
Households with no nonrelatives (%)
Population in households (%)
Family households (%)
Nonfamily households (%)
Population in families (%)
Family households with own children (%)
Median number of bedrooms in owner occupied houses
Mean number of bedrooms in owner occupied houses
Median number of bedrooms in renter occupied houses
Mean number of bedrooms in renter occupied houses
Median number of vehichles in owner occupied houses
Mean number of vehichles in owner occupied houses
Median number of vehichles in renter occupied houses
Mean number of vehichles in renter occupied houses
Mortgage status - with mortgage (%)
Mortgage status - with second mortgage (%)
Mortgage status - with home equity loan (%)
Mortgage status - with both second mortgage and home equity loan (%)
Mortgage status - without a mortgage (%)
Average family size
Average family size - White
Average family size - Black or African American
Average family size - Asian
Average family size - Hispanic or Latino
Average family size - American Indian and Alaska Native
Average family size - Multirace
Average family size - Other Race
Geographical mobility - Same house 1 year ago (%)
Geographical mobility - Moved within same county (%)
Geographical mobility - Moved from different county within same state (%)
Geographical mobility - Moved from different state (%)
Geographical mobility - Moved from abroad (%)
Place of birth - Born in state of residence (%)
Place of birth - Born in other state (%)
Place of birth - Native, outside of US (%)
Place of birth - Foreign born (%)
Housing units in structures - 1, detached (%)
Housing units in structures - 1, attached (%)
Housing units in structures - 2 (%)
Housing units in structures - 3 or 4 (%)
Housing units in structures - 5 to 9 (%)
Housing units in structures - 10 to 19 (%)
Housing units in structures - 20 to 49 (%)
Housing units in structures - 50 or more (%)
Housing units in structures - Mobile home (%)
Housing units in structures - Boat, RV, van, etc. (%)
House/condo owner moved in on average (years ago)
Renter moved in on average (years ago)
Year householder moved into unit - Moved in 1999 to March 2000 (%)
Year householder moved into unit - Moved in 1995 to 1998 (%)
Year householder moved into unit - Moved in 1990 to 1994 (%)
Year householder moved into unit - Moved in 1980 to 1989 (%)
Year householder moved into unit - Moved in 1970 to 1979 (%)
Year householder moved into unit - Moved in 1969 or earlier (%)
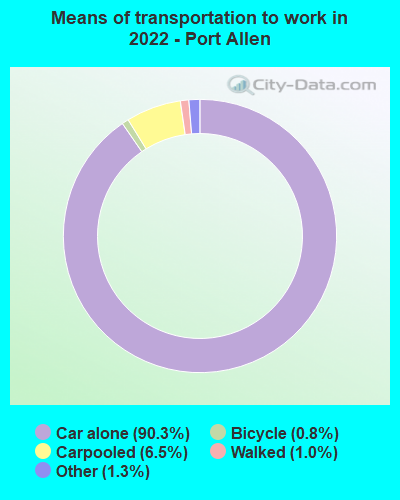
Means of transportation to work - Drove car alone (%)
Means of transportation to work - Carpooled (%)
Means of transportation to work - Public transportation (%)
Means of transportation to work - Bus or trolley bus (%)
Means of transportation to work - Streetcar or trolley car (%)
Means of transportation to work - Subway or elevated (%)
Means of transportation to work - Railroad (%)
Means of transportation to work - Ferryboat (%)
Means of transportation to work - Taxicab (%)
Means of transportation to work - Motorcycle (%)
Means of transportation to work - Bicycle (%)
Means of transportation to work - Walked (%)
Means of transportation to work - Other means (%)
Working at home (%)
Industry diversity
Most Common Industries - Agriculture, forestry, fishing and hunting, and mining (%)
Most Common Industries - Agriculture, forestry, fishing and hunting (%)
Most Common Industries - Mining, quarrying, and oil and gas extraction (%)
Most Common Industries - Construction (%)
Most Common Industries - Manufacturing (%)
Most Common Industries - Wholesale trade (%)
Most Common Industries - Retail trade (%)
Most Common Industries - Transportation and warehousing, and utilities (%)
Most Common Industries - Transportation and warehousing (%)
Most Common Industries - Utilities (%)
Most Common Industries - Information (%)
Most Common Industries - Finance and insurance, and real estate and rental and leasing (%)
Most Common Industries - Finance and insurance (%)
Most Common Industries - Real estate and rental and leasing (%)
Most Common Industries - Professional, scientific, and management, and administrative and waste management services (%)
Most Common Industries - Professional, scientific, and technical services (%)
Most Common Industries - Management of companies and enterprises (%)
Most Common Industries - Administrative and support and waste management services (%)
Most Common Industries - Educational services, and health care and social assistance (%)
Most Common Industries - Educational services (%)
Most Common Industries - Health care and social assistance (%)
Most Common Industries - Arts, entertainment, and recreation, and accommodation and food services (%)
Most Common Industries - Arts, entertainment, and recreation (%)
Most Common Industries - Accommodation and food services (%)
Most Common Industries - Other services, except public administration (%)
Most Common Industries - Public administration (%)
Occupation diversity
Most Common Occupations - Management, business, science, and arts occupations (%)
Most Common Occupations - Management, business, and financial occupations (%)
Most Common Occupations - Management occupations (%)
Most Common Occupations - Business and financial operations occupations (%)
Most Common Occupations - Computer, engineering, and science occupations (%)
Most Common Occupations - Computer and mathematical occupations (%)
Most Common Occupations - Architecture and engineering occupations (%)
Most Common Occupations - Life, physical, and social science occupations (%)
Most Common Occupations - Education, legal, community service, arts, and media occupations (%)
Most Common Occupations - Community and social service occupations (%)
Most Common Occupations - Legal occupations (%)
Most Common Occupations - Education, training, and library occupations (%)
Most Common Occupations - Arts, design, entertainment, sports, and media occupations (%)
Most Common Occupations - Healthcare practitioners and technical occupations (%)
Most Common Occupations - Health diagnosing and treating practitioners and other technical occupations (%)
Most Common Occupations - Health technologists and technicians (%)
Most Common Occupations - Service occupations (%)
Most Common Occupations - Healthcare support occupations (%)
Most Common Occupations - Protective service occupations (%)
Most Common Occupations - Fire fighting and prevention, and other protective service workers including supervisors (%)
Most Common Occupations - Law enforcement workers including supervisors (%)
Most Common Occupations - Food preparation and serving related occupations (%)
Most Common Occupations - Building and grounds cleaning and maintenance occupations (%)
Most Common Occupations - Personal care and service occupations (%)
Most Common Occupations - Sales and office occupations (%)
Most Common Occupations - Sales and related occupations (%)
Most Common Occupations - Office and administrative support occupations (%)
Most Common Occupations - Natural resources, construction, and maintenance occupations (%)
Most Common Occupations - Farming, fishing, and forestry occupations (%)
Most Common Occupations - Construction and extraction occupations (%)
Most Common Occupations - Installation, maintenance, and repair occupations (%)
Most Common Occupations - Production, transportation, and material moving occupations (%)
Most Common Occupations - Production occupations (%)
Most Common Occupations - Transportation occupations (%)
Most Common Occupations - Material moving occupations (%)
People in Group quarters - Institutionalized population (%)
People in Group quarters - Correctional institutions (%)
People in Group quarters - Federal prisons and detention centers (%)
People in Group quarters - Halfway houses (%)
People in Group quarters - Local jails and other confinement facilities (including police lockups) (%)
People in Group quarters - Military disciplinary barracks (%)
People in Group quarters - State prisons (%)
People in Group quarters - Other types of correctional institutions (%)
People in Group quarters - Nursing homes (%)
People in Group quarters - Hospitals/wards, hospices, and schools for the handicapped (%)
People in Group quarters - Hospitals/wards and hospices for chronically ill (%)
People in Group quarters - Hospices or homes for chronically ill (%)
People in Group quarters - Military hospitals or wards for chronically ill (%)
People in Group quarters - Other hospitals or wards for chronically ill (%)
People in Group quarters - Hospitals or wards for drug/alcohol abuse (%)
People in Group quarters - Mental (Psychiatric) hospitals or wards (%)
People in Group quarters - Schools, hospitals, or wards for the mentally retarded (%)
People in Group quarters - Schools, hospitals, or wards for the physically handicapped (%)
People in Group quarters - Institutions for the deaf (%)
People in Group quarters - Institutions for the blind (%)
People in Group quarters - Orthopedic wards and institutions for the physically handicapped (%)
People in Group quarters - Wards in general hospitals for patients who have no usual home elsewhere (%)
People in Group quarters - Wards in military hospitals for patients who have no usual home elsewhere (%)
People in Group quarters - Juvenile institutions (%)
People in Group quarters - Long-term care (%)
People in Group quarters - Homes for abused, dependent, and neglected children (%)
People in Group quarters - Residential treatment centers for emotionally disturbed children (%)
People in Group quarters - Training schools for juvenile delinquents (%)
People in Group quarters - Short-term care, detention or diagnostic centers for delinquent children (%)
People in Group quarters - Type of juvenile institution unknown (%)
People in Group quarters - Noninstitutionalized population (%)
People in Group quarters - College dormitories (includes college quarters off campus) (%)
People in Group quarters - Military quarters (%)
People in Group quarters - On base (%)
People in Group quarters - Barracks, unaccompanied personnel housing (UPH), (Enlisted/Officer), ;and similar group living quarters for military personnel (%)
People in Group quarters - Transient quarters for temporary residents (%)
People in Group quarters - Military ships (%)
People in Group quarters - Group homes (%)
People in Group quarters - Homes or halfway houses for drug/alcohol abuse (%)
People in Group quarters - Homes for the mentally ill (%)
People in Group quarters - Homes for the mentally retarded (%)
People in Group quarters - Homes for the physically handicapped (%)
People in Group quarters - Other group homes (%)
People in Group quarters - Religious group quarters (%)
People in Group quarters - Dormitories (%)
People in Group quarters - Agriculture workers' dormitories on farms (%)
People in Group quarters - Job Corps and vocational training facilities (%)
People in Group quarters - Other workers' dormitories (%)
People in Group quarters - Crews of maritime vessels (%)
People in Group quarters - Other nonhousehold living situations (%)
People in Group quarters - Other noninstitutional group quarters (%)
Residents speaking English at home (%)
Residents speaking English at home - Born in the United States (%)
Residents speaking English at home - Native, born elsewhere (%)
Residents speaking English at home - Foreign born (%)
Residents speaking Spanish at home (%)
Residents speaking Spanish at home - Born in the United States (%)
Residents speaking Spanish at home - Native, born elsewhere (%)
Residents speaking Spanish at home - Foreign born (%)
Residents speaking other language at home (%)
Residents speaking other language at home - Born in the United States (%)
Residents speaking other language at home - Native, born elsewhere (%)
Residents speaking other language at home - Foreign born (%)
Class of Workers - Employee of private company (%)
Class of Workers - Self-employed in own incorporated business (%)
Class of Workers - Private not-for-profit wage and salary workers (%)
Class of Workers - Local government workers (%)
Class of Workers - State government workers (%)
Class of Workers - Federal government workers (%)
Class of Workers - Self-employed workers in own not incorporated business and Unpaid family workers (%)
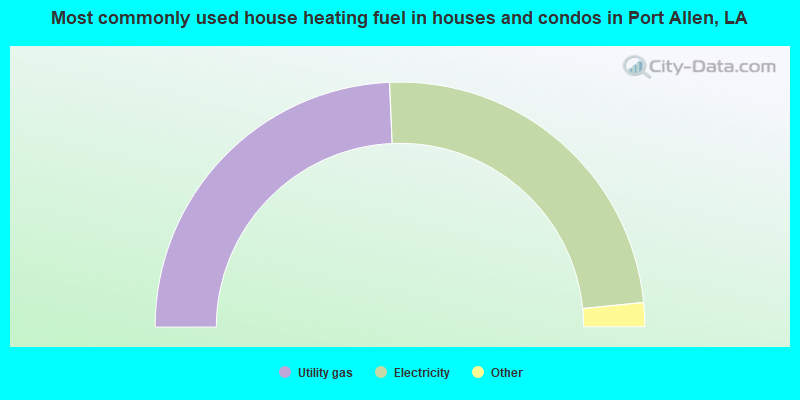
House heating fuel used in houses and condos - Utility gas (%)
House heating fuel used in houses and condos - Bottled, tank, or LP gas (%)
House heating fuel used in houses and condos - Electricity (%)
House heating fuel used in houses and condos - Fuel oil, kerosene, etc. (%)
House heating fuel used in houses and condos - Coal or coke (%)
House heating fuel used in houses and condos - Wood (%)
House heating fuel used in houses and condos - Solar energy (%)
House heating fuel used in houses and condos - Other fuel (%)
House heating fuel used in houses and condos - No fuel used (%)
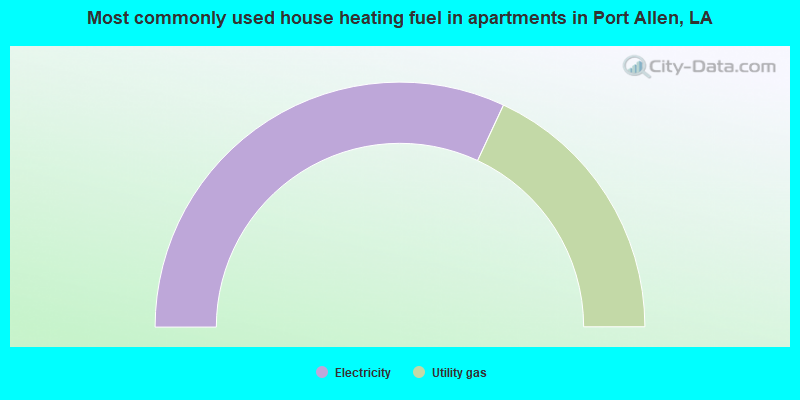
House heating fuel used in apartments - Utility gas (%)
House heating fuel used in apartments - Bottled, tank, or LP gas (%)
House heating fuel used in apartments - Electricity (%)
House heating fuel used in apartments - Fuel oil, kerosene, etc. (%)
House heating fuel used in apartments - Coal or coke (%)
House heating fuel used in apartments - Wood (%)
House heating fuel used in apartments - Solar energy (%)
House heating fuel used in apartments - Other fuel (%)
House heating fuel used in apartments - No fuel used (%)
Armed forces status - In Armed Forces (%)
Armed forces status - Civilian (%)
Armed forces status - Civilian - Veteran (%)
Armed forces status - Civilian - Nonveteran (%)
Fatal accidents locations in years 2005-2021
Fatal accidents locations in 2005
Fatal accidents locations in 2006
Fatal accidents locations in 2007
Fatal accidents locations in 2008
Fatal accidents locations in 2009
Fatal accidents locations in 2010
Fatal accidents locations in 2011
Fatal accidents locations in 2012
Fatal accidents locations in 2013
Fatal accidents locations in 2014
Fatal accidents locations in 2015
Fatal accidents locations in 2016
Fatal accidents locations in 2017
Fatal accidents locations in 2018
Fatal accidents locations in 2019
Fatal accidents locations in 2020
Fatal accidents locations in 2021
Alcohol use - People drinking some alcohol every month (%)
Alcohol use - People not drinking at all (%)
Alcohol use - Average days/month drinking alcohol
Alcohol use - Average drinks/week
Alcohol use - Average days/year people drink much
Audiometry - Average condition of hearing (%)
Audiometry - People that can hear a whisper from across a quiet room (%)
Audiometry - People that can hear normal voice from across a quiet room (%)
Audiometry - Ears ringing, roaring, buzzing (%)
Audiometry - Had a job exposure to loud noise (%)
Audiometry - Had off-work exposure to loud noise (%)
Blood Pressure & Cholesterol - Has high blood pressure (%)
Blood Pressure & Cholesterol - Checking blood pressure at home (%)
Blood Pressure & Cholesterol - Frequently checking blood cholesterol (%)
Blood Pressure & Cholesterol - Has high cholesterol level (%)
Consumer Behavior - Money monthly spent on food at supermarket/grocery store
Consumer Behavior - Money monthly spent on food at other stores
Consumer Behavior - Money monthly spent on eating out
Consumer Behavior - Money monthly spent on carryout/delivered foods
Consumer Behavior - Income spent on food at supermarket/grocery store (%)
Consumer Behavior - Income spent on food at other stores (%)
Consumer Behavior - Income spent on eating out (%)
Consumer Behavior - Income spent on carryout/delivered foods (%)
Current Health Status - General health condition (%)
Current Health Status - Blood donors (%)
Current Health Status - Has blood ever tested for HIV virus (%)
Current Health Status - Left-handed people (%)
Dermatology - People using sunscreen (%)
Diabetes - Diabetics (%)
Diabetes - Had a blood test for high blood sugar (%)
Diabetes - People taking insulin (%)
Diet Behavior & Nutrition - Diet health (%)
Diet Behavior & Nutrition - Milk product consumption (# of products/month)
Diet Behavior & Nutrition - Meals not home prepared (#/week)
Diet Behavior & Nutrition - Meals from fast food or pizza place (#/week)
Diet Behavior & Nutrition - Ready-to-eat foods (#/month)
Diet Behavior & Nutrition - Frozen meals/pizza (#/month)
Drug Use - People that ever used marijuana or hashish (%)
Drug Use - Ever used hard drugs (%)
Drug Use - Ever used any form of cocaine (%)
Drug Use - Ever used heroin (%)
Drug Use - Ever used methamphetamine (%)
Health Insurance - People covered by health insurance (%)
Kidney Conditions-Urology - Avg. # of times urinating at night
Medical Conditions - People with asthma (%)
Medical Conditions - People with anemia (%)
Medical Conditions - People with psoriasis (%)
Medical Conditions - People with overweight (%)
Medical Conditions - Elderly people having difficulties in thinking or remembering (%)
Medical Conditions - People who ever received blood transfusion (%)
Medical Conditions - People having trouble seeing even with glass/contacts (%)
Medical Conditions - People with arthritis (%)
Medical Conditions - People with gout (%)
Medical Conditions - People with congestive heart failure (%)
Medical Conditions - People with coronary heart disease (%)
Medical Conditions - People with angina pectoris (%)
Medical Conditions - People who ever had heart attack (%)
Medical Conditions - People who ever had stroke (%)
Medical Conditions - People with emphysema (%)
Medical Conditions - People with thyroid problem (%)
Medical Conditions - People with chronic bronchitis (%)
Medical Conditions - People with any liver condition (%)
Medical Conditions - People who ever had cancer or malignancy (%)
Mental Health - People who have little interest in doing things (%)
Mental Health - People feeling down, depressed, or hopeless (%)
Mental Health - People who have trouble sleeping or sleeping too much (%)
Mental Health - People feeling tired or having little energy (%)
Mental Health - People with poor appetite or overeating (%)
Mental Health - People feeling bad about themself (%)
Mental Health - People who have trouble concentrating on things (%)
Mental Health - People moving or speaking slowly or too fast (%)
Mental Health - People having thoughts they would be better off dead (%)
Oral Health - Average years since last visit a dentist
Oral Health - People embarrassed because of mouth (%)
Oral Health - People with gum disease (%)
Oral Health - General health of teeth and gums (%)
Oral Health - Average days a week using dental floss/device
Oral Health - Average days a week using mouthwash for dental problem
Oral Health - Average number of teeth
Pesticide Use - Households using pesticides to control insects (%)
Pesticide Use - Households using pesticides to kill weeds (%)
Physical Activity - People doing vigorous-intensity work activities (%)
Physical Activity - People doing moderate-intensity work activities (%)
Physical Activity - People walking or bicycling (%)
Physical Activity - People doing vigorous-intensity recreational activities (%)
Physical Activity - People doing moderate-intensity recreational activities (%)
Physical Activity - Average hours a day doing sedentary activities
Physical Activity - Average hours a day watching TV or videos
Physical Activity - Average hours a day using computer
Physical Functioning - People having limitations keeping them from working (%)
Physical Functioning - People limited in amount of work they can do (%)
Physical Functioning - People that need special equipment to walk (%)
Physical Functioning - People experiencing confusion/memory problems (%)
Physical Functioning - People requiring special healthcare equipment (%)
Prescription Medications - Average number of prescription medicines taking
Preventive Aspirin Use - Adults 40+ taking low-dose aspirin (%)
Reproductive Health - Vaginal deliveries (%)
Reproductive Health - Cesarean deliveries (%)
Reproductive Health - Deliveries resulted in a live birth (%)
Reproductive Health - Pregnancies resulted in a delivery (%)
Reproductive Health - Women breastfeeding newborns (%)
Reproductive Health - Women that had a hysterectomy (%)
Reproductive Health - Women that had both ovaries removed (%)
Reproductive Health - Women that have ever taken birth control pills (%)
Reproductive Health - Women taking birth control pills (%)
Reproductive Health - Women that have ever used Depo-Provera or injectables (%)
Reproductive Health - Women that have ever used female hormones (%)
Sexual Behavior - People 18+ that ever had sex (vaginal, anal, or oral) (%)
Sexual Behavior - Males 18+ that ever had vaginal sex with a woman (%)
Sexual Behavior - Males 18+ that ever performed oral sex on a woman (%)
Sexual Behavior - Males 18+ that ever had anal sex with a woman (%)
Sexual Behavior - Males 18+ that ever had any sex with a man (%)
Sexual Behavior - Females 18+ that ever had vaginal sex with a man (%)
Sexual Behavior - Females 18+ that ever performed oral sex on a man (%)
Sexual Behavior - Females 18+ that ever had anal sex with a man (%)
Sexual Behavior - Females 18+ that ever had any kind of sex with a woman (%)
Sexual Behavior - Average age people first had sex
Sexual Behavior - Average number of female sex partners in lifetime (males 18+)
Sexual Behavior - Average number of female vaginal sex partners in lifetime (males 18+)
Sexual Behavior - Average age people first performed oral sex on a woman (18+)
Sexual Behavior - Average number of woman performed oral sex on in lifetime (18+)
Sexual Behavior - Average number of male sex partners in lifetime (males 18+)
Sexual Behavior - Average number of male anal sex partners in lifetime (males 18+)
Sexual Behavior - Average age people first performed oral sex on a man (18+)
Sexual Behavior - Average number of male oral sex partners in lifetime (18+)
Sexual Behavior - People using protection when performing oral sex (%)
Sexual Behavior - Average number of times people have vaginal or anal sex a year
Sexual Behavior - People having sex without condom (%)
Sexual Behavior - Average number of male sex partners in lifetime (females 18+)
Sexual Behavior - Average number of male vaginal sex partners in lifetime (females 18+)
Sexual Behavior - Average number of female sex partners in lifetime (females 18+)
Sexual Behavior - Circumcised males 18+ (%)
Sleep Disorders - Average hours sleeping at night
Sleep Disorders - People that has trouble sleeping (%)
Smoking-Cigarette Use - People smoking cigarettes (%)
Taste & Smell - People 40+ having problems with smell (%)
Taste & Smell - People 40+ having problems with taste (%)
Taste & Smell - People 40+ that ever had wisdom teeth removed (%)
Taste & Smell - People 40+ that ever had tonsils teeth removed (%)
Taste & Smell - People 40+ that ever had a loss of consciousness because of a head injury (%)
Taste & Smell - People 40+ that ever had a broken nose or other serious injury to face or skull (%)
Taste & Smell - People 40+ that ever had two or more sinus infections (%)
Weight - Average height (inches)
Weight - Average weight (pounds)
Weight - Average BMI
Weight - People that are obese (%)
Weight - People that ever were obese (%)
Weight - People trying to lose weight (%)
Officers per 1,000 residents here:
4.26Louisiana average:
3.56
Latest news from Port Allen, LA collected exclusively by city-data.com from local newspapers, TV, and radio stations
Ancestries: French (10.7%), American (7.5%), African (1.7%), Irish (1.5%), Italian (1.1%), German (1.0%).
Current Local Time:
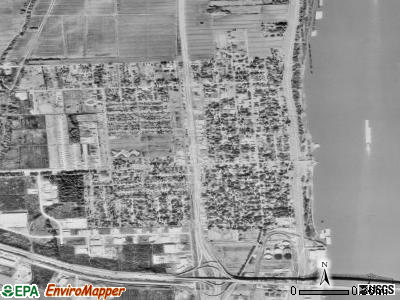
Land area: 2.12 square miles.
Population density: 2,312 people per square mile (low).
83 residents are foreign born
This city:
1.7%Louisiana:
4.2%
Median real estate property taxes paid for housing units with mortgages in 2022: $715 (0.4%)Median real estate property taxes paid for housing units with no mortgage in 2022: $207 (0.1%)
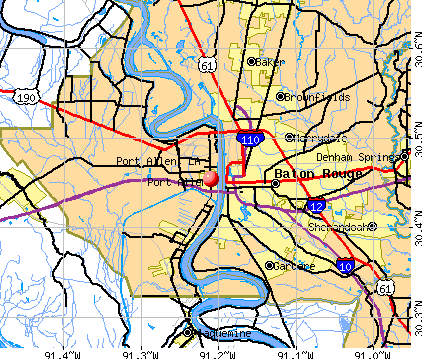
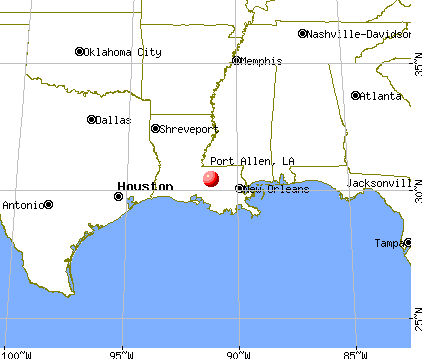
Nearest city with pop. 50,000+: Baton Rouge, LA
Nearest city with pop. 1,000,000+: Houston, TX
Nearest cities:
Latitude: 30.45 N, Longitude: 91.21 W
Daytime population change due to commuting: +4,057 (+82.8%)Workers who live and work in this city: 679 (29.8%)
Area code commonly used in this area: 225
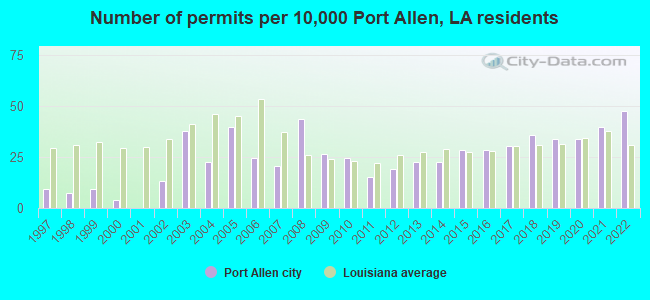
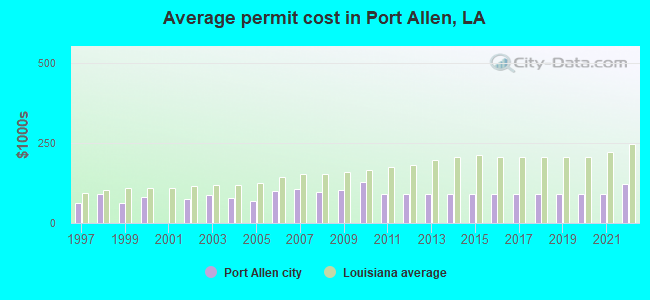
Single-family new house construction building permits:
2022: 25 buildings , average cost: $121,4002021: 21 buildings , average cost: $91,1002020: 18 buildings , average cost: $91,1002019: 18 buildings , average cost: $91,1002018: 19 buildings , average cost: $91,1002017: 16 buildings , average cost: $91,1002016: 15 buildings , average cost: $91,1002015: 15 buildings , average cost: $91,1002014: 12 buildings , average cost: $91,1002013: 12 buildings , average cost: $91,1002012: 10 buildings , average cost: $91,1002011: 8 buildings , average cost: $91,1002010: 13 buildings , average cost: $128,4002009: 14 buildings , average cost: $102,8002008: 23 buildings , average cost: $96,2002007: 11 buildings , average cost: $104,6002006: 13 buildings , average cost: $98,6002005: 21 buildings , average cost: $70,4002004: 12 buildings , average cost: $77,2002003: 20 buildings , average cost: $86,7002002: 7 buildings , average cost: $75,7002000: 2 buildings , average cost: $82,0001999: 5 buildings , average cost: $61,0001998: 4 buildings , average cost: $90,1001997: 5 buildings , average cost: $61,800Unemployment in December 2023:
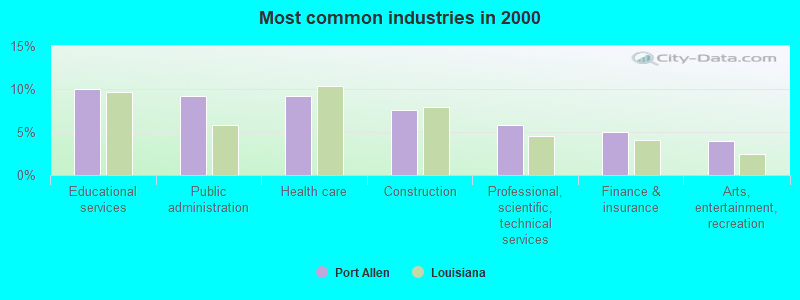
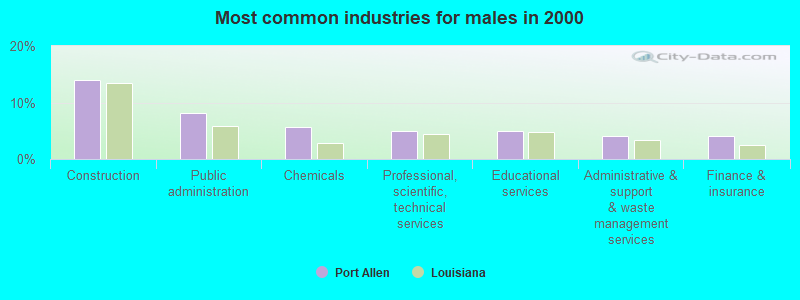
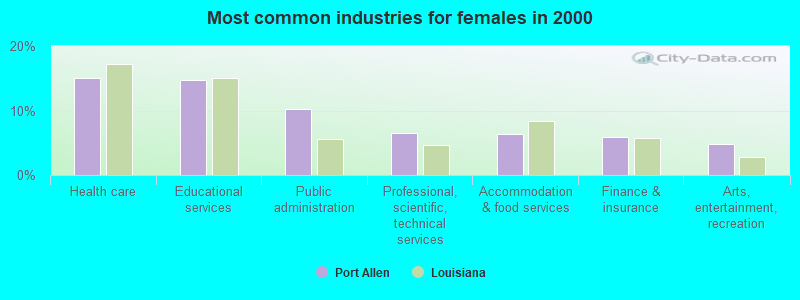
Most common industries in Port Allen, LA (%)
Both Males Females
Educational services (10.0%)
Public administration (9.2%)
Health care (9.2%)
Construction (7.6%)
Professional, scientific, technical services (5.8%)
Finance & insurance (5.0%)
Arts, entertainment, recreation (3.9%)
Construction (14.0%)
Public administration (8.1%)
Chemicals (5.6%)
Professional, scientific, technical services (5.0%)
Educational services (4.9%)
Administrative & support & waste management services (4.2%)
Finance & insurance (4.1%)
Health care (15.0%)
Educational services (14.7%)
Public administration (10.2%)
Professional, scientific, technical services (6.5%)
Accommodation & food services (6.4%)
Finance & insurance (5.8%)
Arts, entertainment, recreation (4.9%)
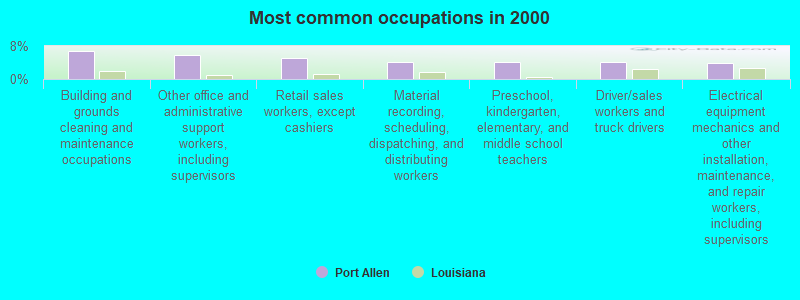
Most common occupations in Port Allen, LA (%)
Both Males Females
Building and grounds cleaning and maintenance occupations (6.8%)
Other office and administrative support workers, including supervisors (5.8%)
Retail sales workers, except cashiers (5.1%)
Material recording, scheduling, dispatching, and distributing workers (4.2%)
Preschool, kindergarten, elementary, and middle school teachers (4.1%)
Driver/sales workers and truck drivers (4.0%)
Electrical equipment mechanics and other installation, maintenance, and repair workers, including supervisors (3.8%)
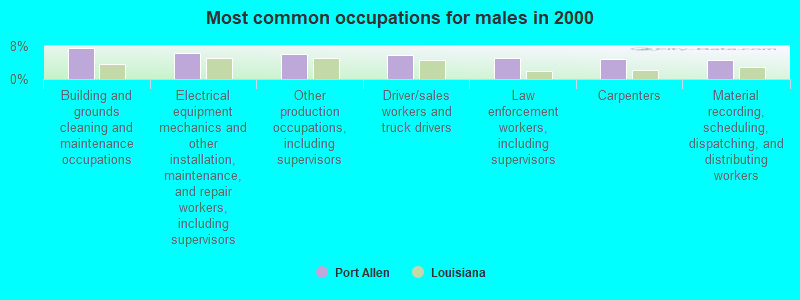
Building and grounds cleaning and maintenance occupations (7.6%)
Electrical equipment mechanics and other installation, maintenance, and repair workers, including supervisors (6.2%)
Other production occupations, including supervisors (6.0%)
Driver/sales workers and truck drivers (5.9%)
Law enforcement workers, including supervisors (5.1%)
Carpenters (4.9%)
Material recording, scheduling, dispatching, and distributing workers (4.7%)
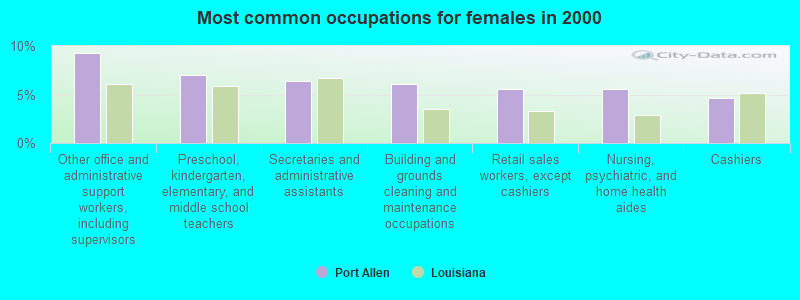
Other office and administrative support workers, including supervisors (9.3%)
Preschool, kindergarten, elementary, and middle school teachers (7.0%)
Secretaries and administrative assistants (6.4%)
Building and grounds cleaning and maintenance occupations (6.1%)
Retail sales workers, except cashiers (5.5%)
Nursing, psychiatric, and home health aides (5.5%)
Cashiers (4.7%)
Tornado activity:
Port Allen-area historical tornado activity is near Louisiana state average. It is 67% greater than the overall U.S. average.
On 4/26/1973, a category F3 (max. wind speeds 158-206 mph) tornado 8.4 miles away from the Port Allen city center caused between $5000 and $50,000 in damages.
On 9/16/1971, a category F3 tornado 10.7 miles away from the city center injured 3 people and caused between $500,000 and $5,000,000 in damages.
Earthquake activity:
Port Allen-area historical earthquake activity is significantly above Louisiana state average. It is 45% smaller than the overall U.S. average. On 9/10/2006 at 14:56:08, a magnitude 5.9 (5.9 MB, 5.5 MS, 5.8 MW, Class: Moderate, Intensity: VI - VII) earthquake occurred 402.7 miles away from the city center On 5/17/2012 at 08:12:00, a magnitude 4.8 (4.8 MW, Depth: 3.1 mi, Class: Light, Intensity: IV - V) earthquake occurred 212.8 miles away from Port Allen center On 10/24/1997 at 08:35:17, a magnitude 4.9 (4.8 MB, 4.2 MS, 4.9 LG, Depth: 6.2 mi) earthquake occurred 238.5 miles away from Port Allen center On 5/6/2018 at 16:47:09, a magnitude 4.6 (4.6 MB, Depth: 6.2 mi) earthquake occurred 235.1 miles away from Port Allen center On 6/30/1994 at 01:08:24, a magnitude 4.2 (4.2 MB, Depth: 6.2 mi) earthquake occurred 186.6 miles away from the city center On 9/2/2013 at 23:51:15, a magnitude 4.3 (4.3 MW, Depth: 2.9 mi) earthquake occurred 215.4 miles away from the city center Magnitude types: regional Lg-wave magnitude (LG), body-wave magnitude (MB), surface-wave magnitude (MS), moment magnitude (MW) Natural disasters: The number of natural disasters in West Baton Rouge Parish (21) is greater than the US average (15).Major Disasters (Presidential) Declared: 15Emergencies Declared: 4Hurricanes: 12, Floods: 5, Storms: 4, Tornado: 1, Tropical Storm: 1, Other: 2 (Note: some incidents may be assigned to more than one category). Hospitals and medical centers in Port Allen: MICHIGAN GROUP HOME (448 MICHIGAN AVE) PORT ALLEN CARE CENTER, L.L.C. (403 15TH STREET)
FMCNA - WESTPORT (2500 COMMERCIAL DR)
CURTIS AND JACOBS HOME HEALTH (610 N JEFFERSON)
Airports located in Port Allen: Amtrak station near Port Allen: 3 miles: BATON ROUGE (1253 FLORIDA ST.) - Bus Station Services: enclosed waiting area, public restrooms, public payphones, call for taxi service, intercity bus service, public transit connection.
Colleges/universities with over 2000 students nearest to Port Allen:
Baton Rouge Community College (about 5 miles; Baton Rouge, LA ; Full-time enrollment: 5,744)
Southern University and A & M College (about 6 miles; Baton Rouge, LA ; FT enrollment: 5,837)
Louisiana State University and Agricultural & Mechanical College (about 7 miles; Baton Rouge, LA ; FT enrollment: 27,321)
Southeastern Louisiana University (about 45 miles; Hammond, LA ; FT enrollment: 12,713)
University of Louisiana at Lafayette (about 52 miles; Lafayette, LA ; FT enrollment: 14,493)
Nicholls State University (about 52 miles; Thibodaux, LA ; FT enrollment: 5,997)
Acadiana Technical College-Lafayette Campus (about 53 miles; Lafayette, LA ; FT enrollment: 2,378)
Public high school in Port Allen:
Private high school in Port Allen: FAITH ACADEMY OF CHRISTIAN EDUCATION Students: 28, Location: 13028 HIGHWAY 190 W, Grades: KG-12)
Public elementary/middle schools in Port Allen: PORT ALLEN MIDDLE SCHOOL Students: 321, Location: 610 ROSEDALE STREET, Grades: 6-8)PORT ALLEN ELEMENTARY SCHOOL Students: 320, Location: 609 ROSEDALE STREET, Grades: PK-2)DEVALL MIDDLE SCHOOL Students: 244, Location: 11851 NORTH RIVER ROAD, Grades: 4-8)CHAMBERLIN ELEMENTARY SCHOOL Students: 235, Location: 6024 SECTION ROAD, Grades: PK-4)COHN ELEMENTARY SCHOOL Students: 226, Location: 806 NORTH 14TH STREET, Grades: 3-5)Private elementary/middle schools in Port Allen: HOLY FAMILY SCHOOL Students: 389, Location: 335 N JEFFERSON AVE, Grades: PK-8)
SHARON BAPTIST ACADEMY Students: 40, Location: 9433 SECTION RD, Grades: PK-7)
See full list of schools located in Port Allen Library in Port Allen: WEST BATON ROUGE PARISH Operating income: $1,235,124; Location: 830 NORTH ALEXANDER AVENUE; 95,832 books ; 1,740 audio materials ; 3,203 video materials ; 60 state licensed databases ; 166 print serial subscriptions )
User-submitted facts and corrections:
Many of the crepe myrtle trees actually were planted when the original Cohn Plantation was subdivided into the Cohn subdivision,where many of the older homes(circa 1900-1930) are today.these trees are actually close to a century old,and most people dont know the origin of their beautiful trees.The popularity alone has kept them in existence.
Notable locations in Port Allen: (A) , West Baton Rouge Parish Office (B) , West Baton Rouge Museum (C) , Port Allen Railroad Depot Museum (D) , West Baton Rouge Parish Health Unit (E) , West Baton Rouge Parish Parks and Recreation Community Center (F) , Port Allen Police Department (G) , West Baton Rouge Sheriff's Office (H) , Port Allen Fire Department Station 1 (I) , Port Allen Care Center (J) , West Baton Rouge Parish Courthouse (K) , West Baton Rouge Parish Library (L) . Display/hide their locations on the map
Churches in Port Allen include: (A) , Holy Family Catholic Church (B) , Church of Christ (C) , First Baptist Church of Port Allen (D) , Holy Spirit Catholic Church (E) , New Mount Olive Missionary Baptist Church (F) , Scotts United Methodist Church (G) , Shiloh Baptist Church (H) , West Baton Rouge Presbyterian Church (I) . Display/hide their locations on the map
Parks in Port Allen include: (1) , Rivault Memorial Park (2) . Display/hide their locations on the map
Tourist attraction:
Hotels:
Court:
Birthplace of: Ernie Alexander - Businessman and state legislator, Hall Davis - College football player (La Lafayette Ragin' Cajuns).
West Baton Rouge Parish has a predicted average indoor radon screening level less than 2 pCi/L (pico curies per liter) - Low Potential Drinking water stations with addresses in Port Allen and their reported violations in the past:
CITY OF PORT ALLEN WATER SYSTEM (Population served: 6,759, Groundwater):
Past monitoring violations:
One minor monitoring violation
One regular monitoring violation
Average household size: This city:
2.5 peopleLouisiana:
2.5 people
Percentage of family households: This city:
64.6%Whole state:
67.1%
Percentage of households with unmarried partners: This city:
6.7%Whole state:
6.8%
Likely homosexual households (counted as self-reported same-sex unmarried-partner households)
Lesbian couples: 0.5% of all households Gay men: 0.1% of all households
91 people in nursing facilities/skilled-nursing facilities in 2010people in group homes intended for adults in 2010People in group quarters in Port Allen in 2000:
116 people in nursing homes
7 people in homes for the mentally retarded
3 people in religious group quarters
Banks with branches in Port Allen (2011 data):
American Gateway Bank: Port Allen Branch at 320 North Alexander Avenue, branch established on 2004/11/18; at 320 N. Alexander Avenue, branch established on 1905/01/01. Info updated 2011/07/12: Bank assets: $448.9 mil, Deposits: $314.1 mil, local headquarters , negative income in the last year , Commercial Lending Specialization, 11 total offices , Holding Company: American Gateway Financial Corporation
Guaranty Bank and Trust Company: Port Allen Branch at 1086 Lobdell Highway, branch established on 2008/05/12. Info updated 2006/11/03: Bank assets: $130.1 mil, Deposits: $113.4 mil, headquarters in New Roads, LA, positive income , Commercial Lending Specialization, 4 total offices , Holding Company: Great Guaranty Bancshares, Inc.
Investar Bank: Port Allen Branch at 3761 La Highway 1 South, branch established on 2009/05/11. Info updated 2011/10/14: Bank assets: $279.0 mil, Deposits: $228.2 mil, headquarters in Baton Rouge, LA, positive income , Commercial Lending Specialization, 5 total offices
Iberville Bank: Port Allen Branch at 780 Court Street, branch established on 1969/01/02. Info updated 2006/11/03: Bank assets: $220.9 mil, Deposits: $192.6 mil, headquarters in Plaquemine, LA, positive income , Commercial Lending Specialization, 11 total offices , Holding Company: A. Wilbert's Sons Lumber And Shingle Company
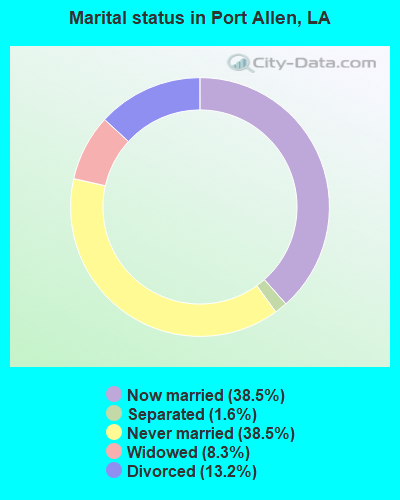
For population 15 years and over in Port Allen:
Never married: 38.5%Now married: 38.5%Separated: 1.6%Widowed: 8.3%Divorced: 13.2% For population 25 years and over in Port Allen:
High school or higher: 88.3%Bachelor's degree or higher: 16.3%Graduate or professional degree: 3.1%Unemployed: 8.3%Mean travel time to work (commute): 18.5 minutes
Education Gini index (Inequality in education) Here:
9.6Louisiana average:
11.9
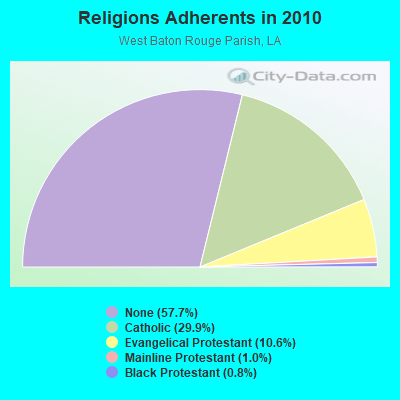
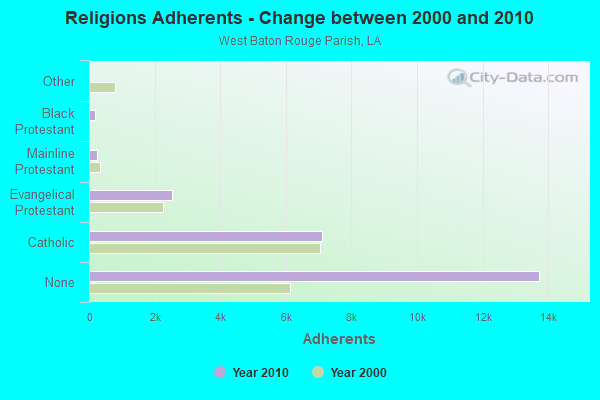
Religion statistics for Port Allen, LA (based on West Baton Rouge Parish data)
Religion Adherents Congregations Catholic 7,101 2 Evangelical Protestant 2,524 9 Mainline Protestant 237 2 Black Protestant 186 1 Other 4 1 None 13,736 -
Source: Clifford Grammich, Kirk Hadaway, Richard Houseal, Dale E.Jones, Alexei Krindatch, Richie Stanley and Richard H.Taylor. 2012. 2010 U.S.Religion Census: Religious Congregations & Membership Study. Association of Statisticians of American Religious Bodies. Jones, Dale E., et al. 2002. Congregations and Membership in the United States 2000. Nashville, TN: Glenmary Research Center. Graphs represent county-level data
Food Environment Statistics: Number of grocery stores : 6West Baton Rouge Parish :
2.65 / 10,000 pop.State :
2.56 / 10,000 pop.
Number of convenience stores (no gas) : 5West Baton Rouge Parish :
2.21 / 10,000 pop.State :
1.29 / 10,000 pop.
Number of convenience stores (with gas) : 17West Baton Rouge Parish :
7.52 / 10,000 pop.Louisiana :
4.49 / 10,000 pop.
Number of full-service restaurants : 12Here :
5.31 / 10,000 pop.State :
5.92 / 10,000 pop.
Adult diabetes rate : West Baton Rouge Parish :
11.0%State :
10.9%
Adult obesity rate : This county :
31.3%Louisiana :
29.2%
Low-income preschool obesity rate : West Baton Rouge Parish :
13.3%Louisiana :
13.7%
Health and Nutrition: Healthy diet rate : Port Allen:
50.2%State:
49.4%
Average overall health of teeth and gums : Port Allen:
47.2%Louisiana:
46.5%
Average BMI : Port Allen:
29.5Louisiana:
29.1
People feeling badly about themselves : This city:
17.8%Louisiana:
20.3%
People not drinking alcohol at all : Here:
12.5%Louisiana:
11.4%
Average hours sleeping at night : Port Allen:
6.7Louisiana:
6.8
General health condition : This city:
55.1%Louisiana:
55.8%
Average condition of hearing : This city:
80.9%Louisiana:
80.2%
More about Health and Nutrition of Port Allen, LA Residents
Local government employment and payroll (March 2022)
Function
Full-time employees
Monthly full-time payroll
Average yearly full-time wage
Part-time employees
Monthly part-time payroll
Police Protection - Officers
18 $64,304 $42,869 0 $0 Other Government Administration
13 $45,609 $42,101 0 $0 Firefighters
9 $43,745 $58,327 0 $0 Solid Waste Management
9 $35,424 $47,232 0 $0 Water Supply
6 $10,826 $21,652 0 $0 Gas Supply
6 $10,826 $21,652 0 $0 Sewerage
4 $17,942 $53,826 0 $0 Judicial and Legal
3 $5,754 $23,016 0 $0 Financial Administration
1 $5,926 $71,112 0 $0
Totals for Government
69 $240,356 $41,801 0 $0
Port Allen government finances - Expenditure in 2018 (per resident):
Construction - Regular Highways: $459,000 ($93.50)
Sewerage: $15,000 ($3.06)Current Operations - Police Protection: $1,781,000 ($362.80)
Regular Highways: $1,129,000 ($229.99)Gas Utilities: $1,066,000 ($217.15)Judicial and Legal Services: $870,000 ($177.23)Housing and Community Development: $826,000 ($168.26)Central Staff Services: $524,000 ($106.74)Sewerage: $520,000 ($105.93)Solid Waste Management: $498,000 ($101.45)Water Utilities: $466,000 ($94.93)Financial Administration: $288,000 ($58.67)General - Other: $139,000 ($28.32)Protective Inspection and Regulation - Other: $36,000 ($7.33)Health - Other: $36,000 ($7.33)General - Interest on Debt: $55,000 ($11.20)
Other Capital Outlay - Police Protection: $171,000 ($34.83)
Gas Utilities: $45,000 ($9.17)Regular Highways: $27,000 ($5.50)Water Utilities: $20,000 ($4.07)Sewerage: $15,000 ($3.06)Central Staff Services: $5,000 ($1.02)Financial Administration: $3,000 ($0.61)Total Salaries and Wages: $1,888,000 ($384.60)
Port Allen government finances - Revenue in 2018 (per resident):
Charges - Sewerage: $911,000 ($185.58)
Solid Waste Management: $482,000 ($98.19)Other: $31,000 ($6.31)Federal Intergovernmental - Housing and Community Development: $558,000 ($113.67)
Local Intergovernmental - General Local Government Support: $3,507,000 ($714.40)
Other: $12,000 ($2.44)Miscellaneous - Fines and Forfeits: $561,000 ($114.28)
Interest Earnings: $145,000 ($29.54)General Revenue - Other: $52,000 ($10.59)Sale of Property: $26,000 ($5.30)Revenue - Gas Utilities: $1,350,000 ($275.01)
Water Utilities: $483,000 ($98.39)State Intergovernmental - Other: $461,000 ($93.91)
General Local Government Support: $39,000 ($7.94)Highways: $28,000 ($5.70)Tax - Property: $607,000 ($123.65)
Occupation and Business License - Other: $403,000 ($82.09)Public Utilities Sales: $366,000 ($74.56)Alcoholic Beverage Sales: $16,000 ($3.26)
Port Allen government finances - Cash and Securities in 2018 (per resident):
Other Funds - Cash and Securities: $10,986,000 ($2237.93)
Sinking Funds - Cash and Securities: $562,000 ($114.48)
Businesses in Port Allen, LA
Name Count Name Count
AT&T 1 McDonald's 2 Arby's 1 Motel 6 1 AutoZone 1 Popeyes 1 Best Western 1 Quality 1 Burger King 2 Quiznos 1 Church's Chicken 1 Subway 2 Comfort Suites 1 Super 8 1 Domino's Pizza 1 T-Mobile 1 Econo Lodge 1 Taco Bell 1 FedEx 4 U-Haul 1 H&R Block 1 UPS 2 Holiday Inn 1 Waffle House 2 KFC 1 Walmart 1 Lane Furniture 1
Strongest AM radio stations in Port Allen:
WYNK (1380 AM; daytime; 5 kW; BATON ROUGE, LA; Owner: CAPSTAR TX LIMITED PARTNERSHIP)
WXOK (1460 AM; 5 kW; BATON ROUGE, LA; Owner: CITADEL BROADCASTING COMPANY)
WIBR (1300 AM; 5 kW; BATON ROUGE, LA; Owner: CITADEL BROADCASTING COMPANY)
KBRH (1260 AM; 5 kW; BATON ROUGE, LA; Owner: EAST BATON ROUGE PARISH SCHOOL BOARD)
WJBO (1150 AM; 5 kW; BATON ROUGE, LA; Owner: CAPSTAR TX LIMITED PARTNERSHIP)
WPFC (1550 AM; 5 kW; BATON ROUGE, LA; Owner: VICTORY & POWER MINISTRIES,INC.)
WSKR (1210 AM; 10 kW; DENHAM SPRINGS, LA; Owner: CAPSTAR TX LIMITED PARTNERSHIP)
WNDC (910 AM; 1 kW; BATON ROUGE, LA; Owner: CHURCH POINT MINISTRIES, INC.)
WWL (870 AM; 50 kW; NEW ORLEANS, LA; Owner: ENTERCOM NEW ORLEANS LICENSE, LLC)
WLNO (1060 AM; 50 kW; NEW ORLEANS, LA; Owner: COMMUNICOM CO. OF LOUISIANA, L.P.)
WOMN (1110 AM; daytime; 30 kW; FRANKLINTON, LA; Owner: PITTMAN BROADCASTING SERVICES, LLC.)
WGLH (960 AM; 1 kW; LA FOLLETTE, TN; Owner: LAFOLLETTE BROADCASTERS, INC.)
KTIB (640 AM; 5 kW; THIBODAUX, LA; Owner: LA TERR BROADCASTING CORPORATION)
Strongest FM radio stations in Port Allen:
WDGL (98.1 FM; BATON ROUGE, LA; Owner: GUARANTY BROADCASTING COMPANY OF BATON ROUGE, LLC)
WRKF (89.3 FM; BATON ROUGE, LA; Owner: PUBLIC RADIO INC.)
WBRH (90.3 FM; BATON ROUGE, LA; Owner: EAST BATON ROUGE PARISH SCHOOL BOARD)
WYPY (100.7 FM; BATON ROUGE, LA; Owner: GUARANTY BROADCASTING COMPANY OF BATON ROUGE, LLC)
WYNK-FM (101.5 FM; BATON ROUGE, LA; Owner: CAPSTAR TX LIMITED PARTNERSHIP)
WFMF (102.5 FM; BATON ROUGE, LA; Owner: CAPSTAR TX LIMITED PARTNERSHIP)
KLSU (91.1 FM; BATON ROUGE, LA; Owner: LOUISIANA STATE UNIVERSITY)
KOOJ (93.7 FM; NEW IBERIA, LA; Owner: CITADEL BROADCASTING COMPANY)
KQXL-FM (106.5 FM; NEW ROADS, LA; Owner: CITADEL BROADCASTING COMPANY)
WBBE (103.3 FM; HAMMOND, LA; Owner: CITADEL BROADCASTING COMPANY)
WJFM (88.5 FM; BATON ROUGE, LA; Owner: FAMILY WORSHIP CENTER CHURCH, INC.)
KRVE (96.1 FM; BRUSLY, LA; Owner: CAPSTAR TX LIMITED PARTNERSHIP)
WJNH (107.3 FM; BAKER, LA; Owner: GUARANTY BROADCASTING CO. OF BATON ROUGE, LLC)
KSTE-FM (104.1 FM; HOUMA, LA; Owner: CLEAR CHANNEL BROADCASTING LICENSES, INC.)
WCKW-FM (92.3 FM; LAPLACE, LA; Owner: 222 CORPORATION)
WNXX (104.5 FM; JACKSON, LA; Owner: GUARANTY BROADCASTING COMPANY OF BATON ROUGE, LLC)
KTDY (99.9 FM; LAFAYETTE, LA; Owner: REGENT BROADCASTING OF LAFAYETTE, INC.)
KXKC (99.1 FM; NEW IBERIA, LA; Owner: BONIN BROADCASTING CORPORATION)
WQCK (92.7 FM; CLINTON, LA; Owner: BETHANY WORLD PRAYER CENTER, INC.)
KNXX (104.9 FM; DONALDSONVILLE, LA; Owner: GUARANTY BROADCASTING COMPANY OF BATON ROUGE, LLC)
TV broadcast stations around Port Allen:
WAFB (Channel 9; BATON ROUGE, LA; Owner: WAFB, L.L.C)
KZUP-CA (Channel 19; BATON ROUGE, LA; Owner: KNIGHT BROADCASTING OF BATON ROUGE LICENSE CORPORATION)
WBRL-CA (Channel 21; BATON ROUGE, LA; Owner: COMCORP OF BATON ROUGE LICENSE CORP.)
KPBN-LP (Channel 11; BATON ROUGE, LA; Owner: PELICAN BROADCASTING NETWORK, L.L.C.)
WLPB-TV (Channel 27; BATON ROUGE, LA; Owner: LOUISIANA EDUCATIONAL TELEVISION AUTHORITY)
WBRZ-TV (Channel 2; BATON ROUGE, LA; Owner: LOUISIANA TELEVISION BROADCASTING, LLC)
WVLA (Channel 33; BATON ROUGE, LA; Owner: KNIGHT BROADCASTING OF BATON ROUGE LIC. CORP.)
KBTR-CA (Channel 65; BATON ROUGE, LA; Owner: GREAT OAKS BROADCASTING CORPORATION)
K07WE (Channel 7; BATON ROUGE, LA; Owner: LOUISIANA CHRISTIAN BROADCASTING, INC.)
K58GB (Channel 58; BATON ROUGE, LA; Owner: TRINITY BROADCASTING NETWORK)
WGMB (Channel 44; BATON ROUGE, LA; Owner: COMCORP OF BATON ROUGE LICENSE CORP.)
K13VE (Channel 13; BATON ROUGE, LA; Owner: DAVID M. LOFLIN)
WLFT-CA (Channel 52; BATON ROUGE, LA; Owner: BETHANY WORLD PRAYER CENTER, INC.)
WBXH-CA (Channel 46; BATON ROUGE, LA; Owner: THE BOX WORLDWIDE LLC)
KATC (Channel 3; LAFAYETTE, LA; Owner: KATC COMMUNICATIONS, INC.)
WTNO-LP (Channel 36; NEW ORLEANS, LA; Owner: TIGER EYE BROADCASTING CORPORATION)
National Bridge Inventory (NBI) Statistics 68 Number of bridges653ft / 199m Total length $10,779,000 Total costs1,073,320 Total average daily traffic46,121 Total average daily truck traffic
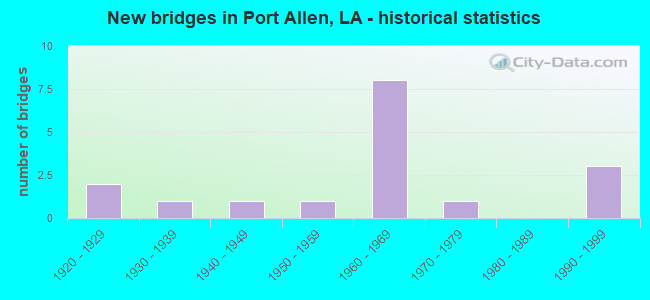
New bridges - historical statistics
2 1920-1929 1 1930-1939 1 1940-1949 1 1950-1959 8 1960-1969 1 1970-1979 3 1990-1999
See full National Bridge Inventory statistics for Port Allen, LA
Fire-safe hotels and motels in Port Allen, Louisiana:
Shoney's Inn Of Baton Rouge, 234 Lobdell Hwy, Port Allen, Louisiana 70769 Phone: (225) 344-3638
Comfort Suites, 2880 N W Port Dr, Port Allen, Louisiana 70767 Phone: (225) 343-4300, Fax: (225) 343-4375
Comfort Suites, 2880 N Westport Dr, Port Allen, Louisiana 70767 Phone: (225) 343-4300, Fax: (225) 343-4375
Holiday Inn Express & Suites, 2860 N Westport Dr, Port Allen, Louisiana 70767 Phone: (225) 343-9967, Fax: (225) 343-9987
Hampton Inn & Suites, 2755 Commercial Dr, Port Allen, Louisiana 70767 Phone: (225) 389-6655, Fax: (225) 389-6675
Econo Lodge Port Allen, 3051 Ln Hwy 1 S, Port Allen, Louisiana 70767 Phone: (225) 300-8300, Fax: (225) 300-8301
Red Roof Inn 873, 3051 Us Hwy 1 S, Port Allen, Louisiana 70767 Phone: (225) 300-8300, Fax: (225) 300-8301
Econolodge Inn & Suites Port Allen, 3051 Hwy 1 S, Port Allen, Louisiana 70767 Phone: (225) 300-8300, Fax: (225) 300-8301
La Quinta Inn & suites, 2720 N Westport Dr, Port allen, Louisiana 70767 Phone: (225) 960-7787, Fax: (225) 960-7785
All 9 fire-safe hotels and motels in Port Allen, Louisiana
Most common first names in Port Allen, LA among deceased individuals Name Count Lived (average)
Joseph 91 72.1 years James 72 68.5 years Mary 69 76.6 years John 61 70.9 years William 53 71.8 years Willie 43 71.2 years Henry 43 71.4 years Robert 38 71.1 years Charles 37 66.9 years George 36 74.3 years
Most common last names in Port Allen, LA among deceased individuals Last name Count Lived (average)
Williams 79 66.8 years Johnson 70 70.6 years Jones 47 74.9 years Smith 43 71.8 years Landry 41 76.3 years Brown 41 69.5 years Jackson 36 69.2 years Leblanc 25 76.8 years Moore 24 64.7 years Davis 20 70.8 years
Port Allen compared to Louisiana state average:
Unemployed percentage below state average. Hispanic race population percentage significantly below state average. Foreign-born population percentage significantly below state average. Length of stay since moving in significantly above state average. House age above state average. Port Allen on our top lists :
#32 on the list of "Top 101 cities with largest percentage of females in occupations: transportation occupations (population 5,000+)"
#56 on the list of "Top 101 cities with the most people born in the same U.S. state as the city (population 5,000+)"
#79 on the list of "Top 101 cities with largest percentage of females in occupations: personal care and service occupations (population 5,000+)"
#57 (70767) on the list of "Top 101 zip codes with the largest percentage of French first ancestries (pop 5,000+)"
#31 on the list of "Top 101 counties with the lowest Ozone (1-hour) air pollution readings in 2012 (ppm)"
#61 on the list of "Top 101 counties with the highest Nitrogen Dioxide air pollution readings in 2012 (ppm)"
Top Patent Applicants
Michael William O'Rourke (4)
Christine Navarre (2)
Stacey Simmons (2)
Chris Reed (1)
Christopher J. Reed (1)
Brian Riddle (1)
Barry Hugghins (1)
Van Bielkiewicz (1)
Total of 13 patent applications in 2008-2024.


 Recent articles from our blog. Our writers, many of them Ph.D. graduates or candidates, create easy-to-read articles on a wide variety of topics.

 (4.2 miles
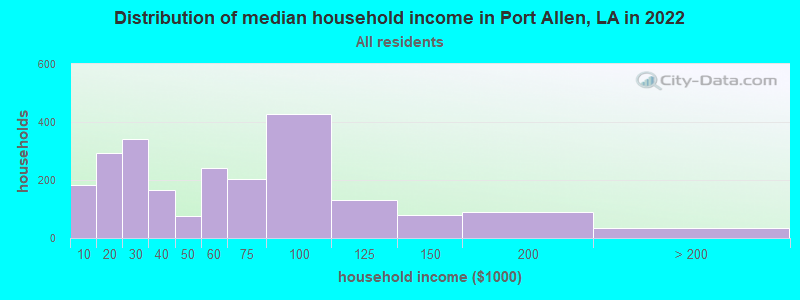

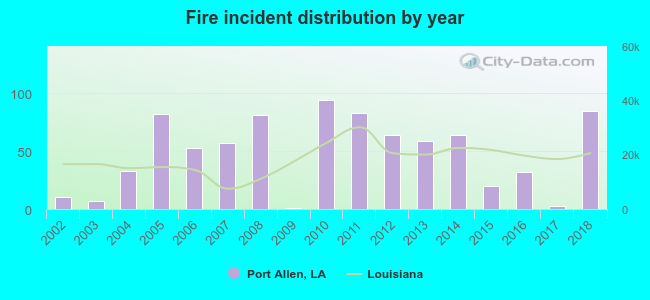 According to the data from the years 2002 - 2018 the average number of fire incidents per year is 49. The highest number of reported fires - 94 took place in 2010, and the least - 1 in 2009. The data has a rising trend.
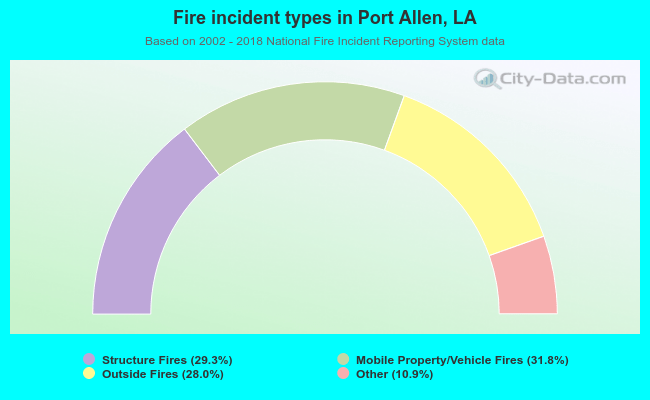 When looking into fire subcategories, the most incidents belonged to: Mobile Property/Vehicle Fires (31.8%), and Structure Fires (29.3%).