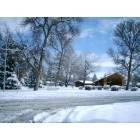
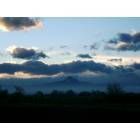
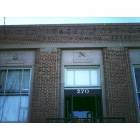
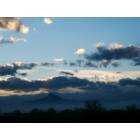
Powell, Wyoming Submit your own pictures of this city and show them to the world
OSM Map
General Map
Google Map
MSN Map
OSM Map
General Map
Google Map
MSN Map
OSM Map
General Map
Google Map
MSN Map
OSM Map
General Map
Google Map
MSN Map
Please wait while loading the map...
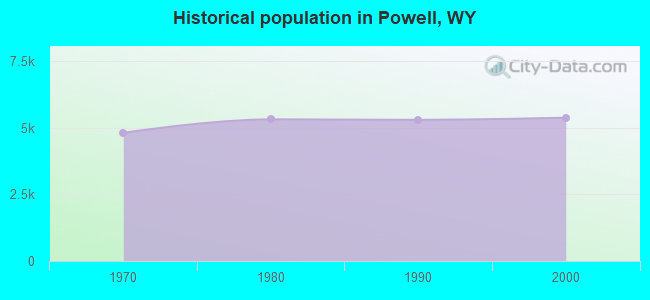
Population in 2022: 6,517 (100% urban, 0% rural). Population change since 2000: +21.3%Males: 3,170 Females: 3,347
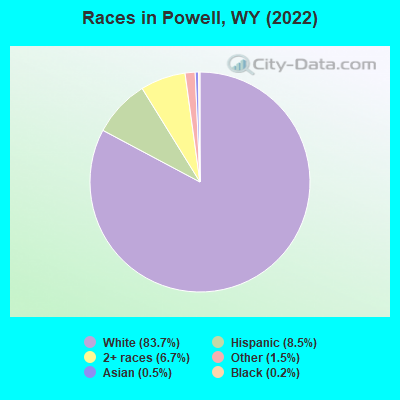
March 2022 cost of living index in Powell: 85.4 (less than average, U.S. average is 100) Percentage of residents living in poverty in 2022: 13.6%for White Non-Hispanic residents , 50.7% for Hispanic or Latino residents , 31.8% for other race residents , 17.3% for two or more races residents )Business Search - 14 Million verified businesses
Data:
Median household income ($)
Median household income (% change since 2000)
Household income diversity
Ratio of average income to average house value (%)
Ratio of average income to average rent
Median household income ($) - White
Median household income ($) - Black or African American
Median household income ($) - Asian
Median household income ($) - Hispanic or Latino
Median household income ($) - American Indian and Alaska Native
Median household income ($) - Multirace
Median household income ($) - Other Race
Median household income for houses/condos with a mortgage ($)
Median household income for apartments without a mortgage ($)
Races - White alone (%)
Races - White alone (% change since 2000)
Races - Black alone (%)
Races - Black alone (% change since 2000)
Races - American Indian alone (%)
Races - American Indian alone (% change since 2000)
Races - Asian alone (%)
Races - Asian alone (% change since 2000)
Races - Hispanic (%)
Races - Hispanic (% change since 2000)
Races - Native Hawaiian and Other Pacific Islander alone (%)
Races - Native Hawaiian and Other Pacific Islander alone (% change since 2000)
Races - Two or more races (%)
Races - Two or more races (% change since 2000)
Races - Other race alone (%)
Races - Other race alone (% change since 2000)
Racial diversity
Unemployment (%)
Unemployment (% change since 2000)
Unemployment (%) - White
Unemployment (%) - Black or African American
Unemployment (%) - Asian
Unemployment (%) - Hispanic or Latino
Unemployment (%) - American Indian and Alaska Native
Unemployment (%) - Multirace
Unemployment (%) - Other Race
Population density (people per square mile)
Population - Males (%)
Population - Females (%)
Population - Males (%) - White
Population - Males (%) - Black or African American
Population - Males (%) - Asian
Population - Males (%) - Hispanic or Latino
Population - Males (%) - American Indian and Alaska Native
Population - Males (%) - Multirace
Population - Males (%) - Other Race
Population - Females (%) - White
Population - Females (%) - Black or African American
Population - Females (%) - Asian
Population - Females (%) - Hispanic or Latino
Population - Females (%) - American Indian and Alaska Native
Population - Females (%) - Multirace
Population - Females (%) - Other Race
Coronavirus confirmed cases (Apr 24, 2024)
Deaths caused by coronavirus (Apr 24, 2024)
Coronavirus confirmed cases (per 100k population) (Apr 24, 2024)
Deaths caused by coronavirus (per 100k population) (Apr 24, 2024)
Daily increase in number of cases (Apr 24, 2024)
Weekly increase in number of cases (Apr 24, 2024)
Cases doubled (in days) (Apr 24, 2024)
Hospitalized patients (Apr 18, 2022)
Negative test results (Apr 18, 2022)
Total test results (Apr 18, 2022)
COVID Vaccine doses distributed (per 100k population) (Sep 19, 2023)
COVID Vaccine doses administered (per 100k population) (Sep 19, 2023)
COVID Vaccine doses distributed (Sep 19, 2023)
COVID Vaccine doses administered (Sep 19, 2023)
Likely homosexual households (%)
Likely homosexual households (% change since 2000)
Likely homosexual households - Lesbian couples (%)
Likely homosexual households - Lesbian couples (% change since 2000)
Likely homosexual households - Gay men (%)
Likely homosexual households - Gay men (% change since 2000)
Cost of living index
Median gross rent ($)
Median contract rent ($)
Median monthly housing costs ($)
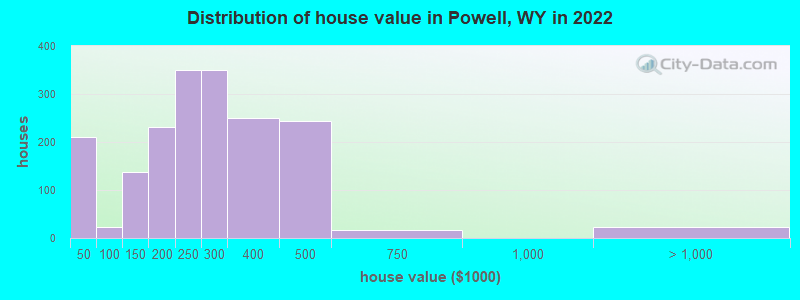
Median house or condo value ($)
Median house or condo value ($ change since 2000)
Mean house or condo value by units in structure - 1, detached ($)
Mean house or condo value by units in structure - 1, attached ($)
Mean house or condo value by units in structure - 2 ($)
Mean house or condo value by units in structure by units in structure - 3 or 4 ($)
Mean house or condo value by units in structure - 5 or more ($)
Mean house or condo value by units in structure - Boat, RV, van, etc. ($)
Mean house or condo value by units in structure - Mobile home ($)
Median house or condo value ($) - White
Median house or condo value ($) - Black or African American
Median house or condo value ($) - Asian
Median house or condo value ($) - Hispanic or Latino
Median house or condo value ($) - American Indian and Alaska Native
Median house or condo value ($) - Multirace
Median house or condo value ($) - Other Race
Median resident age
Resident age diversity
Median resident age - Males
Median resident age - Females
Median resident age - White
Median resident age - Black or African American
Median resident age - Asian
Median resident age - Hispanic or Latino
Median resident age - American Indian and Alaska Native
Median resident age - Multirace
Median resident age - Other Race
Median resident age - Males - White
Median resident age - Males - Black or African American
Median resident age - Males - Asian
Median resident age - Males - Hispanic or Latino
Median resident age - Males - American Indian and Alaska Native
Median resident age - Males - Multirace
Median resident age - Males - Other Race
Median resident age - Females - White
Median resident age - Females - Black or African American
Median resident age - Females - Asian
Median resident age - Females - Hispanic or Latino
Median resident age - Females - American Indian and Alaska Native
Median resident age - Females - Multirace
Median resident age - Females - Other Race
Commute - mean travel time to work (minutes)
Travel time to work - Less than 5 minutes (%)
Travel time to work - Less than 5 minutes (% change since 2000)
Travel time to work - 5 to 9 minutes (%)
Travel time to work - 5 to 9 minutes (% change since 2000)
Travel time to work - 10 to 19 minutes (%)
Travel time to work - 10 to 19 minutes (% change since 2000)
Travel time to work - 20 to 29 minutes (%)
Travel time to work - 20 to 29 minutes (% change since 2000)
Travel time to work - 30 to 39 minutes (%)
Travel time to work - 30 to 39 minutes (% change since 2000)
Travel time to work - 40 to 59 minutes (%)
Travel time to work - 40 to 59 minutes (% change since 2000)
Travel time to work - 60 to 89 minutes (%)
Travel time to work - 60 to 89 minutes (% change since 2000)
Travel time to work - 90 or more minutes (%)
Travel time to work - 90 or more minutes (% change since 2000)
Marital status - Never married (%)
Marital status - Now married (%)
Marital status - Separated (%)
Marital status - Widowed (%)
Marital status - Divorced (%)
Median family income ($)
Median family income (% change since 2000)
Median non-family income ($)
Median non-family income (% change since 2000)
Median per capita income ($)
Median per capita income (% change since 2000)
Median family income ($) - White
Median family income ($) - Black or African American
Median family income ($) - Asian
Median family income ($) - Hispanic or Latino
Median family income ($) - American Indian and Alaska Native
Median family income ($) - Multirace
Median family income ($) - Other Race
Median year house/condo built
Median year apartment built
Year house built - Built 2005 or later (%)
Year house built - Built 2000 to 2004 (%)
Year house built - Built 1990 to 1999 (%)
Year house built - Built 1980 to 1989 (%)
Year house built - Built 1970 to 1979 (%)
Year house built - Built 1960 to 1969 (%)
Year house built - Built 1950 to 1959 (%)
Year house built - Built 1940 to 1949 (%)
Year house built - Built 1939 or earlier (%)
Average household size
Household density (households per square mile)
Average household size - White
Average household size - Black or African American
Average household size - Asian
Average household size - Hispanic or Latino
Average household size - American Indian and Alaska Native
Average household size - Multirace
Average household size - Other Race
Occupied housing units (%)
Vacant housing units (%)
Owner occupied housing units (%)
Renter occupied housing units (%)
Vacancy status - For rent (%)
Vacancy status - For sale only (%)
Vacancy status - Rented or sold, not occupied (%)
Vacancy status - For seasonal, recreational, or occasional use (%)
Vacancy status - For migrant workers (%)
Vacancy status - Other vacant (%)
Residents with income below the poverty level (%)
Residents with income below 50% of the poverty level (%)
Children below poverty level (%)
Poor families by family type - Married-couple family (%)
Poor families by family type - Male, no wife present (%)
Poor families by family type - Female, no husband present (%)
Poverty status for native-born residents (%)
Poverty status for foreign-born residents (%)
Poverty among high school graduates not in families (%)
Poverty among people who did not graduate high school not in families (%)
Residents with income below the poverty level (%) - White
Residents with income below the poverty level (%) - Black or African American
Residents with income below the poverty level (%) - Asian
Residents with income below the poverty level (%) - Hispanic or Latino
Residents with income below the poverty level (%) - American Indian and Alaska Native
Residents with income below the poverty level (%) - Multirace
Residents with income below the poverty level (%) - Other Race
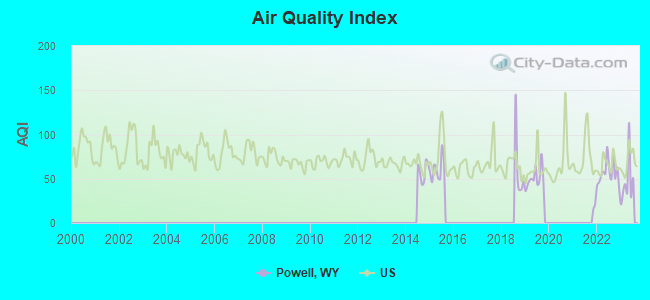
Air pollution - Air Quality Index (AQI)
Air pollution - CO
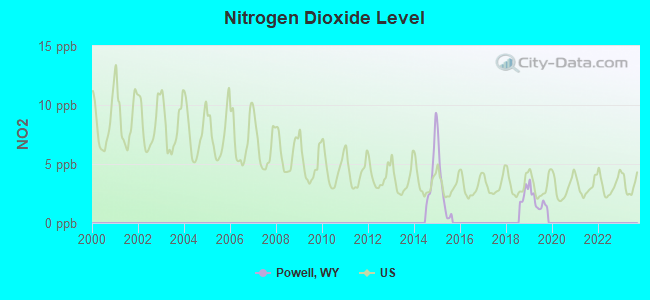
Air pollution - NO2
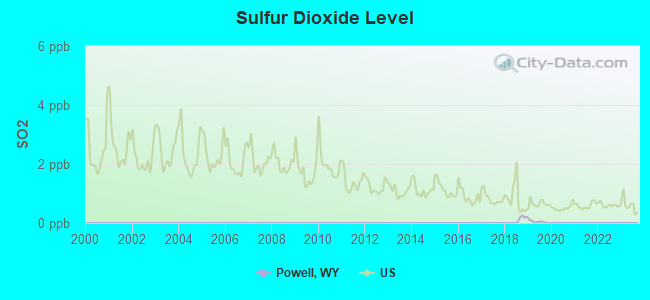
Air pollution - SO2
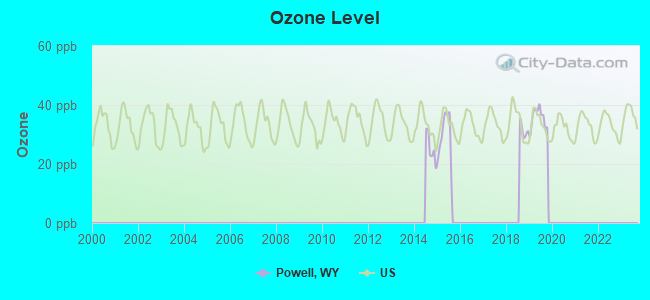
Air pollution - Ozone
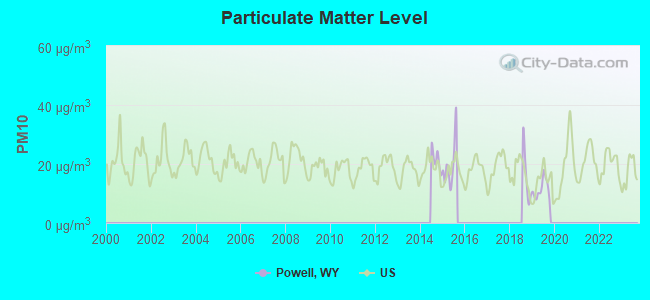
Air pollution - PM10
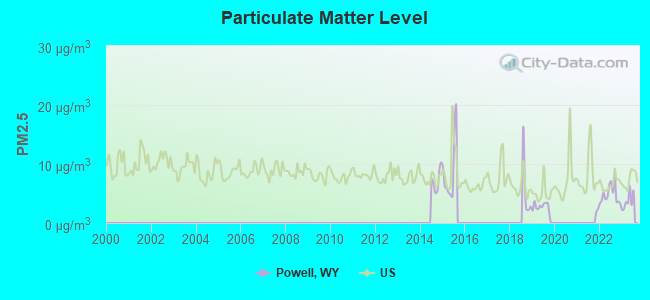
Air pollution - PM25
Air pollution - Pb
Crime - Murders per 100,000 population
Crime - Rapes per 100,000 population
Crime - Robberies per 100,000 population
Crime - Assaults per 100,000 population
Crime - Burglaries per 100,000 population
Crime - Thefts per 100,000 population
Crime - Auto thefts per 100,000 population
Crime - Arson per 100,000 population
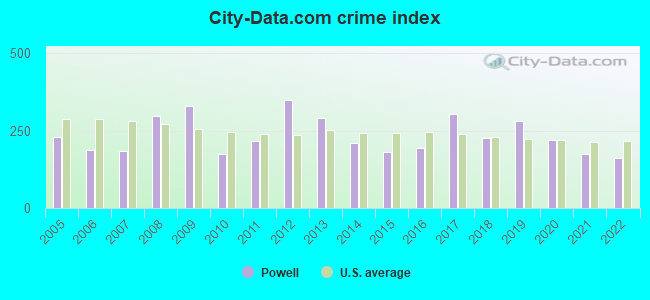
Crime - City-data.com crime index
Crime - Violent crime index
Crime - Property crime index
Crime - Murders per 100,000 population (5 year average)
Crime - Rapes per 100,000 population (5 year average)
Crime - Robberies per 100,000 population (5 year average)
Crime - Assaults per 100,000 population (5 year average)
Crime - Burglaries per 100,000 population (5 year average)
Crime - Thefts per 100,000 population (5 year average)
Crime - Auto thefts per 100,000 population (5 year average)
Crime - Arson per 100,000 population (5 year average)
Crime - City-data.com crime index (5 year average)
Crime - Violent crime index (5 year average)
Crime - Property crime index (5 year average)
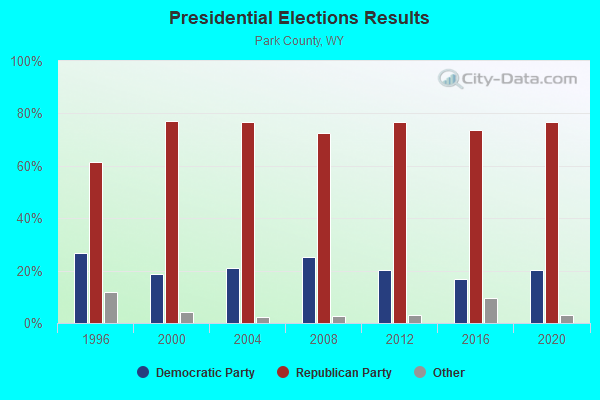
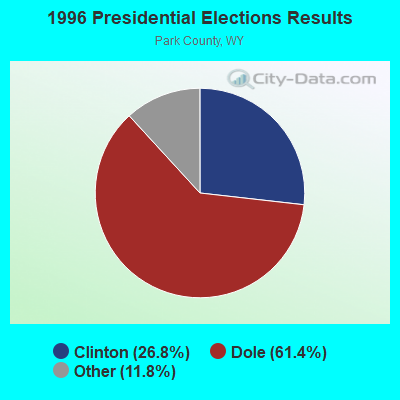
1996 Presidential Elections Results (%) - Democratic Party (Clinton)
1996 Presidential Elections Results (%) - Republican Party (Dole)
1996 Presidential Elections Results (%) - Other
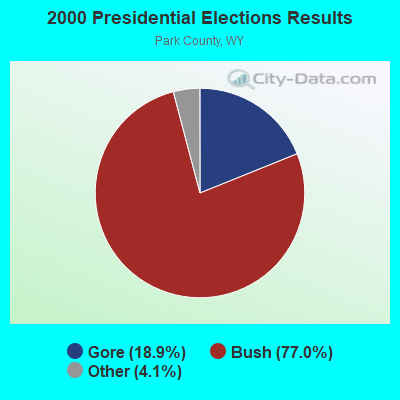
2000 Presidential Elections Results (%) - Democratic Party (Gore)
2000 Presidential Elections Results (%) - Republican Party (Bush)
2000 Presidential Elections Results (%) - Other
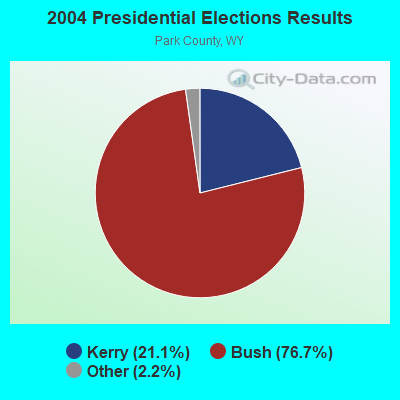
2004 Presidential Elections Results (%) - Democratic Party (Kerry)
2004 Presidential Elections Results (%) - Republican Party (Bush)
2004 Presidential Elections Results (%) - Other
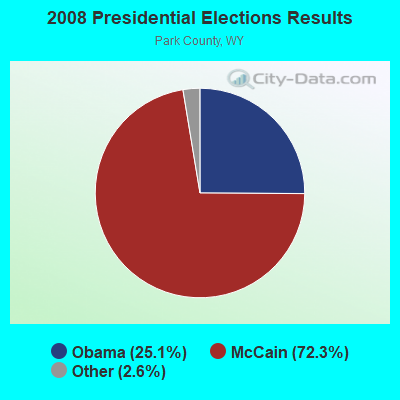
2008 Presidential Elections Results (%) - Democratic Party (Obama)
2008 Presidential Elections Results (%) - Republican Party (McCain)
2008 Presidential Elections Results (%) - Other
2012 Presidential Elections Results (%) - Democratic Party (Obama)
2012 Presidential Elections Results (%) - Republican Party (Romney)
2012 Presidential Elections Results (%) - Other
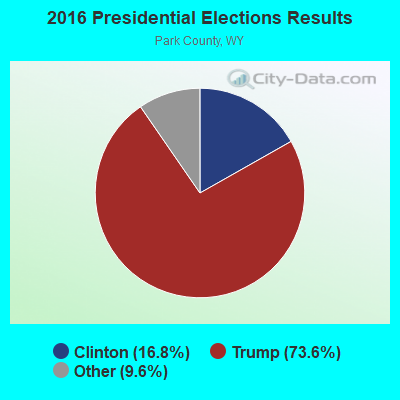
2016 Presidential Elections Results (%) - Democratic Party (Clinton)
2016 Presidential Elections Results (%) - Republican Party (Trump)
2016 Presidential Elections Results (%) - Other
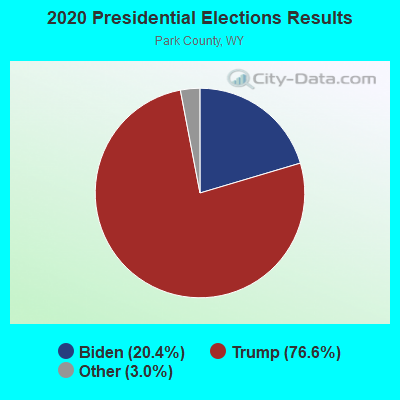
2020 Presidential Elections Results (%) - Democratic Party (Biden)
2020 Presidential Elections Results (%) - Republican Party (Trump)
2020 Presidential Elections Results (%) - Other
Ancestries Reported - Arab (%)
Ancestries Reported - Czech (%)
Ancestries Reported - Danish (%)
Ancestries Reported - Dutch (%)
Ancestries Reported - English (%)
Ancestries Reported - French (%)
Ancestries Reported - French Canadian (%)
Ancestries Reported - German (%)
Ancestries Reported - Greek (%)
Ancestries Reported - Hungarian (%)
Ancestries Reported - Irish (%)
Ancestries Reported - Italian (%)
Ancestries Reported - Lithuanian (%)
Ancestries Reported - Norwegian (%)
Ancestries Reported - Polish (%)
Ancestries Reported - Portuguese (%)
Ancestries Reported - Russian (%)
Ancestries Reported - Scotch-Irish (%)
Ancestries Reported - Scottish (%)
Ancestries Reported - Slovak (%)
Ancestries Reported - Subsaharan African (%)
Ancestries Reported - Swedish (%)
Ancestries Reported - Swiss (%)
Ancestries Reported - Ukrainian (%)
Ancestries Reported - United States (%)
Ancestries Reported - Welsh (%)
Ancestries Reported - West Indian (%)
Ancestries Reported - Other (%)
Educational Attainment - No schooling completed (%)
Educational Attainment - Less than high school (%)
Educational Attainment - High school or equivalent (%)
Educational Attainment - Less than 1 year of college (%)
Educational Attainment - 1 or more years of college (%)
Educational Attainment - Associate degree (%)
Educational Attainment - Bachelor's degree (%)
Educational Attainment - Master's degree (%)
Educational Attainment - Professional school degree (%)
Educational Attainment - Doctorate degree (%)
School Enrollment - Nursery, preschool (%)
School Enrollment - Kindergarten (%)
School Enrollment - Grade 1 to 4 (%)
School Enrollment - Grade 5 to 8 (%)
School Enrollment - Grade 9 to 12 (%)
School Enrollment - College undergrad (%)
School Enrollment - Graduate or professional (%)
School Enrollment - Not enrolled in school (%)
School enrollment - Public schools (%)
School enrollment - Private schools (%)
School enrollment - Not enrolled (%)
Median number of rooms in houses and condos
Median number of rooms in apartments
Housing units lacking complete plumbing facilities (%)
Housing units lacking complete kitchen facilities (%)
Density of houses
Urban houses (%)
Rural houses (%)
Households with people 60 years and over (%)
Households with people 65 years and over (%)
Households with people 75 years and over (%)
Households with one or more nonrelatives (%)
Households with no nonrelatives (%)
Population in households (%)
Family households (%)
Nonfamily households (%)
Population in families (%)
Family households with own children (%)
Median number of bedrooms in owner occupied houses
Mean number of bedrooms in owner occupied houses
Median number of bedrooms in renter occupied houses
Mean number of bedrooms in renter occupied houses
Median number of vehichles in owner occupied houses
Mean number of vehichles in owner occupied houses
Median number of vehichles in renter occupied houses
Mean number of vehichles in renter occupied houses
Mortgage status - with mortgage (%)
Mortgage status - with second mortgage (%)
Mortgage status - with home equity loan (%)
Mortgage status - with both second mortgage and home equity loan (%)
Mortgage status - without a mortgage (%)
Average family size
Average family size - White
Average family size - Black or African American
Average family size - Asian
Average family size - Hispanic or Latino
Average family size - American Indian and Alaska Native
Average family size - Multirace
Average family size - Other Race
Geographical mobility - Same house 1 year ago (%)
Geographical mobility - Moved within same county (%)
Geographical mobility - Moved from different county within same state (%)
Geographical mobility - Moved from different state (%)
Geographical mobility - Moved from abroad (%)
Place of birth - Born in state of residence (%)
Place of birth - Born in other state (%)
Place of birth - Native, outside of US (%)
Place of birth - Foreign born (%)
Housing units in structures - 1, detached (%)
Housing units in structures - 1, attached (%)
Housing units in structures - 2 (%)
Housing units in structures - 3 or 4 (%)
Housing units in structures - 5 to 9 (%)
Housing units in structures - 10 to 19 (%)
Housing units in structures - 20 to 49 (%)
Housing units in structures - 50 or more (%)
Housing units in structures - Mobile home (%)
Housing units in structures - Boat, RV, van, etc. (%)
House/condo owner moved in on average (years ago)
Renter moved in on average (years ago)
Year householder moved into unit - Moved in 1999 to March 2000 (%)
Year householder moved into unit - Moved in 1995 to 1998 (%)
Year householder moved into unit - Moved in 1990 to 1994 (%)
Year householder moved into unit - Moved in 1980 to 1989 (%)
Year householder moved into unit - Moved in 1970 to 1979 (%)
Year householder moved into unit - Moved in 1969 or earlier (%)
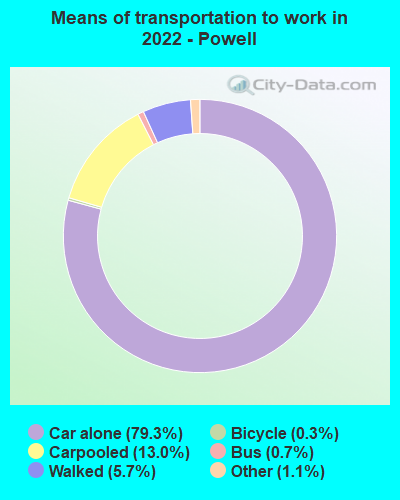
Means of transportation to work - Drove car alone (%)
Means of transportation to work - Carpooled (%)
Means of transportation to work - Public transportation (%)
Means of transportation to work - Bus or trolley bus (%)
Means of transportation to work - Streetcar or trolley car (%)
Means of transportation to work - Subway or elevated (%)
Means of transportation to work - Railroad (%)
Means of transportation to work - Ferryboat (%)
Means of transportation to work - Taxicab (%)
Means of transportation to work - Motorcycle (%)
Means of transportation to work - Bicycle (%)
Means of transportation to work - Walked (%)
Means of transportation to work - Other means (%)
Working at home (%)
Industry diversity
Most Common Industries - Agriculture, forestry, fishing and hunting, and mining (%)
Most Common Industries - Agriculture, forestry, fishing and hunting (%)
Most Common Industries - Mining, quarrying, and oil and gas extraction (%)
Most Common Industries - Construction (%)
Most Common Industries - Manufacturing (%)
Most Common Industries - Wholesale trade (%)
Most Common Industries - Retail trade (%)
Most Common Industries - Transportation and warehousing, and utilities (%)
Most Common Industries - Transportation and warehousing (%)
Most Common Industries - Utilities (%)
Most Common Industries - Information (%)
Most Common Industries - Finance and insurance, and real estate and rental and leasing (%)
Most Common Industries - Finance and insurance (%)
Most Common Industries - Real estate and rental and leasing (%)
Most Common Industries - Professional, scientific, and management, and administrative and waste management services (%)
Most Common Industries - Professional, scientific, and technical services (%)
Most Common Industries - Management of companies and enterprises (%)
Most Common Industries - Administrative and support and waste management services (%)
Most Common Industries - Educational services, and health care and social assistance (%)
Most Common Industries - Educational services (%)
Most Common Industries - Health care and social assistance (%)
Most Common Industries - Arts, entertainment, and recreation, and accommodation and food services (%)
Most Common Industries - Arts, entertainment, and recreation (%)
Most Common Industries - Accommodation and food services (%)
Most Common Industries - Other services, except public administration (%)
Most Common Industries - Public administration (%)
Occupation diversity
Most Common Occupations - Management, business, science, and arts occupations (%)
Most Common Occupations - Management, business, and financial occupations (%)
Most Common Occupations - Management occupations (%)
Most Common Occupations - Business and financial operations occupations (%)
Most Common Occupations - Computer, engineering, and science occupations (%)
Most Common Occupations - Computer and mathematical occupations (%)
Most Common Occupations - Architecture and engineering occupations (%)
Most Common Occupations - Life, physical, and social science occupations (%)
Most Common Occupations - Education, legal, community service, arts, and media occupations (%)
Most Common Occupations - Community and social service occupations (%)
Most Common Occupations - Legal occupations (%)
Most Common Occupations - Education, training, and library occupations (%)
Most Common Occupations - Arts, design, entertainment, sports, and media occupations (%)
Most Common Occupations - Healthcare practitioners and technical occupations (%)
Most Common Occupations - Health diagnosing and treating practitioners and other technical occupations (%)
Most Common Occupations - Health technologists and technicians (%)
Most Common Occupations - Service occupations (%)
Most Common Occupations - Healthcare support occupations (%)
Most Common Occupations - Protective service occupations (%)
Most Common Occupations - Fire fighting and prevention, and other protective service workers including supervisors (%)
Most Common Occupations - Law enforcement workers including supervisors (%)
Most Common Occupations - Food preparation and serving related occupations (%)
Most Common Occupations - Building and grounds cleaning and maintenance occupations (%)
Most Common Occupations - Personal care and service occupations (%)
Most Common Occupations - Sales and office occupations (%)
Most Common Occupations - Sales and related occupations (%)
Most Common Occupations - Office and administrative support occupations (%)
Most Common Occupations - Natural resources, construction, and maintenance occupations (%)
Most Common Occupations - Farming, fishing, and forestry occupations (%)
Most Common Occupations - Construction and extraction occupations (%)
Most Common Occupations - Installation, maintenance, and repair occupations (%)
Most Common Occupations - Production, transportation, and material moving occupations (%)
Most Common Occupations - Production occupations (%)
Most Common Occupations - Transportation occupations (%)
Most Common Occupations - Material moving occupations (%)
People in Group quarters - Institutionalized population (%)
People in Group quarters - Correctional institutions (%)
People in Group quarters - Federal prisons and detention centers (%)
People in Group quarters - Halfway houses (%)
People in Group quarters - Local jails and other confinement facilities (including police lockups) (%)
People in Group quarters - Military disciplinary barracks (%)
People in Group quarters - State prisons (%)
People in Group quarters - Other types of correctional institutions (%)
People in Group quarters - Nursing homes (%)
People in Group quarters - Hospitals/wards, hospices, and schools for the handicapped (%)
People in Group quarters - Hospitals/wards and hospices for chronically ill (%)
People in Group quarters - Hospices or homes for chronically ill (%)
People in Group quarters - Military hospitals or wards for chronically ill (%)
People in Group quarters - Other hospitals or wards for chronically ill (%)
People in Group quarters - Hospitals or wards for drug/alcohol abuse (%)
People in Group quarters - Mental (Psychiatric) hospitals or wards (%)
People in Group quarters - Schools, hospitals, or wards for the mentally retarded (%)
People in Group quarters - Schools, hospitals, or wards for the physically handicapped (%)
People in Group quarters - Institutions for the deaf (%)
People in Group quarters - Institutions for the blind (%)
People in Group quarters - Orthopedic wards and institutions for the physically handicapped (%)
People in Group quarters - Wards in general hospitals for patients who have no usual home elsewhere (%)
People in Group quarters - Wards in military hospitals for patients who have no usual home elsewhere (%)
People in Group quarters - Juvenile institutions (%)
People in Group quarters - Long-term care (%)
People in Group quarters - Homes for abused, dependent, and neglected children (%)
People in Group quarters - Residential treatment centers for emotionally disturbed children (%)
People in Group quarters - Training schools for juvenile delinquents (%)
People in Group quarters - Short-term care, detention or diagnostic centers for delinquent children (%)
People in Group quarters - Type of juvenile institution unknown (%)
People in Group quarters - Noninstitutionalized population (%)
People in Group quarters - College dormitories (includes college quarters off campus) (%)
People in Group quarters - Military quarters (%)
People in Group quarters - On base (%)
People in Group quarters - Barracks, unaccompanied personnel housing (UPH), (Enlisted/Officer), ;and similar group living quarters for military personnel (%)
People in Group quarters - Transient quarters for temporary residents (%)
People in Group quarters - Military ships (%)
People in Group quarters - Group homes (%)
People in Group quarters - Homes or halfway houses for drug/alcohol abuse (%)
People in Group quarters - Homes for the mentally ill (%)
People in Group quarters - Homes for the mentally retarded (%)
People in Group quarters - Homes for the physically handicapped (%)
People in Group quarters - Other group homes (%)
People in Group quarters - Religious group quarters (%)
People in Group quarters - Dormitories (%)
People in Group quarters - Agriculture workers' dormitories on farms (%)
People in Group quarters - Job Corps and vocational training facilities (%)
People in Group quarters - Other workers' dormitories (%)
People in Group quarters - Crews of maritime vessels (%)
People in Group quarters - Other nonhousehold living situations (%)
People in Group quarters - Other noninstitutional group quarters (%)
Residents speaking English at home (%)
Residents speaking English at home - Born in the United States (%)
Residents speaking English at home - Native, born elsewhere (%)
Residents speaking English at home - Foreign born (%)
Residents speaking Spanish at home (%)
Residents speaking Spanish at home - Born in the United States (%)
Residents speaking Spanish at home - Native, born elsewhere (%)
Residents speaking Spanish at home - Foreign born (%)
Residents speaking other language at home (%)
Residents speaking other language at home - Born in the United States (%)
Residents speaking other language at home - Native, born elsewhere (%)
Residents speaking other language at home - Foreign born (%)
Class of Workers - Employee of private company (%)
Class of Workers - Self-employed in own incorporated business (%)
Class of Workers - Private not-for-profit wage and salary workers (%)
Class of Workers - Local government workers (%)
Class of Workers - State government workers (%)
Class of Workers - Federal government workers (%)
Class of Workers - Self-employed workers in own not incorporated business and Unpaid family workers (%)
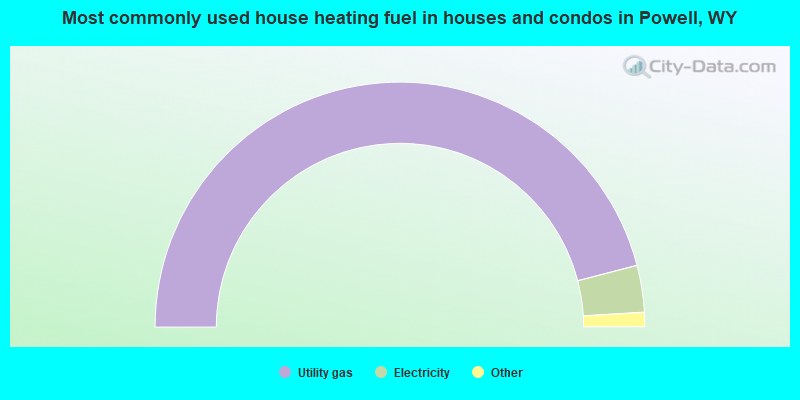
House heating fuel used in houses and condos - Utility gas (%)
House heating fuel used in houses and condos - Bottled, tank, or LP gas (%)
House heating fuel used in houses and condos - Electricity (%)
House heating fuel used in houses and condos - Fuel oil, kerosene, etc. (%)
House heating fuel used in houses and condos - Coal or coke (%)
House heating fuel used in houses and condos - Wood (%)
House heating fuel used in houses and condos - Solar energy (%)
House heating fuel used in houses and condos - Other fuel (%)
House heating fuel used in houses and condos - No fuel used (%)
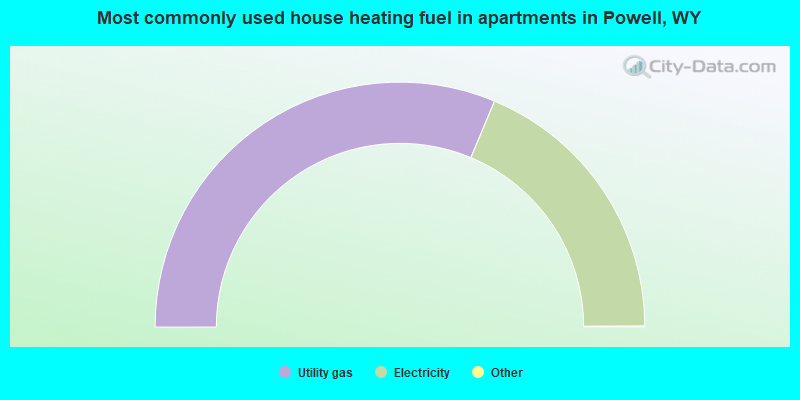
House heating fuel used in apartments - Utility gas (%)
House heating fuel used in apartments - Bottled, tank, or LP gas (%)
House heating fuel used in apartments - Electricity (%)
House heating fuel used in apartments - Fuel oil, kerosene, etc. (%)
House heating fuel used in apartments - Coal or coke (%)
House heating fuel used in apartments - Wood (%)
House heating fuel used in apartments - Solar energy (%)
House heating fuel used in apartments - Other fuel (%)
House heating fuel used in apartments - No fuel used (%)
Armed forces status - In Armed Forces (%)
Armed forces status - Civilian (%)
Armed forces status - Civilian - Veteran (%)
Armed forces status - Civilian - Nonveteran (%)
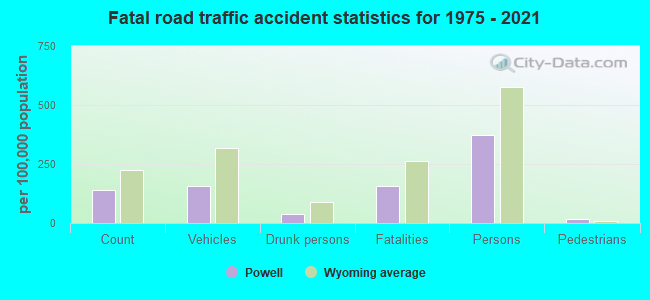
Fatal accidents locations in years 2005-2021
Fatal accidents locations in 2005
Fatal accidents locations in 2006
Fatal accidents locations in 2007
Fatal accidents locations in 2008
Fatal accidents locations in 2009
Fatal accidents locations in 2010
Fatal accidents locations in 2011
Fatal accidents locations in 2012
Fatal accidents locations in 2013
Fatal accidents locations in 2014
Fatal accidents locations in 2015
Fatal accidents locations in 2016
Fatal accidents locations in 2017
Fatal accidents locations in 2018
Fatal accidents locations in 2019
Fatal accidents locations in 2020
Fatal accidents locations in 2021
Alcohol use - People drinking some alcohol every month (%)
Alcohol use - People not drinking at all (%)
Alcohol use - Average days/month drinking alcohol
Alcohol use - Average drinks/week
Alcohol use - Average days/year people drink much
Audiometry - Average condition of hearing (%)
Audiometry - People that can hear a whisper from across a quiet room (%)
Audiometry - People that can hear normal voice from across a quiet room (%)
Audiometry - Ears ringing, roaring, buzzing (%)
Audiometry - Had a job exposure to loud noise (%)
Audiometry - Had off-work exposure to loud noise (%)
Blood Pressure & Cholesterol - Has high blood pressure (%)
Blood Pressure & Cholesterol - Checking blood pressure at home (%)
Blood Pressure & Cholesterol - Frequently checking blood cholesterol (%)
Blood Pressure & Cholesterol - Has high cholesterol level (%)
Consumer Behavior - Money monthly spent on food at supermarket/grocery store
Consumer Behavior - Money monthly spent on food at other stores
Consumer Behavior - Money monthly spent on eating out
Consumer Behavior - Money monthly spent on carryout/delivered foods
Consumer Behavior - Income spent on food at supermarket/grocery store (%)
Consumer Behavior - Income spent on food at other stores (%)
Consumer Behavior - Income spent on eating out (%)
Consumer Behavior - Income spent on carryout/delivered foods (%)
Current Health Status - General health condition (%)
Current Health Status - Blood donors (%)
Current Health Status - Has blood ever tested for HIV virus (%)
Current Health Status - Left-handed people (%)
Dermatology - People using sunscreen (%)
Diabetes - Diabetics (%)
Diabetes - Had a blood test for high blood sugar (%)
Diabetes - People taking insulin (%)
Diet Behavior & Nutrition - Diet health (%)
Diet Behavior & Nutrition - Milk product consumption (# of products/month)
Diet Behavior & Nutrition - Meals not home prepared (#/week)
Diet Behavior & Nutrition - Meals from fast food or pizza place (#/week)
Diet Behavior & Nutrition - Ready-to-eat foods (#/month)
Diet Behavior & Nutrition - Frozen meals/pizza (#/month)
Drug Use - People that ever used marijuana or hashish (%)
Drug Use - Ever used hard drugs (%)
Drug Use - Ever used any form of cocaine (%)
Drug Use - Ever used heroin (%)
Drug Use - Ever used methamphetamine (%)
Health Insurance - People covered by health insurance (%)
Kidney Conditions-Urology - Avg. # of times urinating at night
Medical Conditions - People with asthma (%)
Medical Conditions - People with anemia (%)
Medical Conditions - People with psoriasis (%)
Medical Conditions - People with overweight (%)
Medical Conditions - Elderly people having difficulties in thinking or remembering (%)
Medical Conditions - People who ever received blood transfusion (%)
Medical Conditions - People having trouble seeing even with glass/contacts (%)
Medical Conditions - People with arthritis (%)
Medical Conditions - People with gout (%)
Medical Conditions - People with congestive heart failure (%)
Medical Conditions - People with coronary heart disease (%)
Medical Conditions - People with angina pectoris (%)
Medical Conditions - People who ever had heart attack (%)
Medical Conditions - People who ever had stroke (%)
Medical Conditions - People with emphysema (%)
Medical Conditions - People with thyroid problem (%)
Medical Conditions - People with chronic bronchitis (%)
Medical Conditions - People with any liver condition (%)
Medical Conditions - People who ever had cancer or malignancy (%)
Mental Health - People who have little interest in doing things (%)
Mental Health - People feeling down, depressed, or hopeless (%)
Mental Health - People who have trouble sleeping or sleeping too much (%)
Mental Health - People feeling tired or having little energy (%)
Mental Health - People with poor appetite or overeating (%)
Mental Health - People feeling bad about themself (%)
Mental Health - People who have trouble concentrating on things (%)
Mental Health - People moving or speaking slowly or too fast (%)
Mental Health - People having thoughts they would be better off dead (%)
Oral Health - Average years since last visit a dentist
Oral Health - People embarrassed because of mouth (%)
Oral Health - People with gum disease (%)
Oral Health - General health of teeth and gums (%)
Oral Health - Average days a week using dental floss/device
Oral Health - Average days a week using mouthwash for dental problem
Oral Health - Average number of teeth
Pesticide Use - Households using pesticides to control insects (%)
Pesticide Use - Households using pesticides to kill weeds (%)
Physical Activity - People doing vigorous-intensity work activities (%)
Physical Activity - People doing moderate-intensity work activities (%)
Physical Activity - People walking or bicycling (%)
Physical Activity - People doing vigorous-intensity recreational activities (%)
Physical Activity - People doing moderate-intensity recreational activities (%)
Physical Activity - Average hours a day doing sedentary activities
Physical Activity - Average hours a day watching TV or videos
Physical Activity - Average hours a day using computer
Physical Functioning - People having limitations keeping them from working (%)
Physical Functioning - People limited in amount of work they can do (%)
Physical Functioning - People that need special equipment to walk (%)
Physical Functioning - People experiencing confusion/memory problems (%)
Physical Functioning - People requiring special healthcare equipment (%)
Prescription Medications - Average number of prescription medicines taking
Preventive Aspirin Use - Adults 40+ taking low-dose aspirin (%)
Reproductive Health - Vaginal deliveries (%)
Reproductive Health - Cesarean deliveries (%)
Reproductive Health - Deliveries resulted in a live birth (%)
Reproductive Health - Pregnancies resulted in a delivery (%)
Reproductive Health - Women breastfeeding newborns (%)
Reproductive Health - Women that had a hysterectomy (%)
Reproductive Health - Women that had both ovaries removed (%)
Reproductive Health - Women that have ever taken birth control pills (%)
Reproductive Health - Women taking birth control pills (%)
Reproductive Health - Women that have ever used Depo-Provera or injectables (%)
Reproductive Health - Women that have ever used female hormones (%)
Sexual Behavior - People 18+ that ever had sex (vaginal, anal, or oral) (%)
Sexual Behavior - Males 18+ that ever had vaginal sex with a woman (%)
Sexual Behavior - Males 18+ that ever performed oral sex on a woman (%)
Sexual Behavior - Males 18+ that ever had anal sex with a woman (%)
Sexual Behavior - Males 18+ that ever had any sex with a man (%)
Sexual Behavior - Females 18+ that ever had vaginal sex with a man (%)
Sexual Behavior - Females 18+ that ever performed oral sex on a man (%)
Sexual Behavior - Females 18+ that ever had anal sex with a man (%)
Sexual Behavior - Females 18+ that ever had any kind of sex with a woman (%)
Sexual Behavior - Average age people first had sex
Sexual Behavior - Average number of female sex partners in lifetime (males 18+)
Sexual Behavior - Average number of female vaginal sex partners in lifetime (males 18+)
Sexual Behavior - Average age people first performed oral sex on a woman (18+)
Sexual Behavior - Average number of woman performed oral sex on in lifetime (18+)
Sexual Behavior - Average number of male sex partners in lifetime (males 18+)
Sexual Behavior - Average number of male anal sex partners in lifetime (males 18+)
Sexual Behavior - Average age people first performed oral sex on a man (18+)
Sexual Behavior - Average number of male oral sex partners in lifetime (18+)
Sexual Behavior - People using protection when performing oral sex (%)
Sexual Behavior - Average number of times people have vaginal or anal sex a year
Sexual Behavior - People having sex without condom (%)
Sexual Behavior - Average number of male sex partners in lifetime (females 18+)
Sexual Behavior - Average number of male vaginal sex partners in lifetime (females 18+)
Sexual Behavior - Average number of female sex partners in lifetime (females 18+)
Sexual Behavior - Circumcised males 18+ (%)
Sleep Disorders - Average hours sleeping at night
Sleep Disorders - People that has trouble sleeping (%)
Smoking-Cigarette Use - People smoking cigarettes (%)
Taste & Smell - People 40+ having problems with smell (%)
Taste & Smell - People 40+ having problems with taste (%)
Taste & Smell - People 40+ that ever had wisdom teeth removed (%)
Taste & Smell - People 40+ that ever had tonsils teeth removed (%)
Taste & Smell - People 40+ that ever had a loss of consciousness because of a head injury (%)
Taste & Smell - People 40+ that ever had a broken nose or other serious injury to face or skull (%)
Taste & Smell - People 40+ that ever had two or more sinus infections (%)
Weight - Average height (inches)
Weight - Average weight (pounds)
Weight - Average BMI
Weight - People that are obese (%)
Weight - People that ever were obese (%)
Weight - People trying to lose weight (%)
According to our research of Wyoming and other state lists, there were 12 registered sex offenders living in Powell, Wyoming as of April 24, 2024 . The ratio of all residents to sex offenders in Powell is 535 to 1.The ratio of registered sex offenders to all residents in this city is lower than the state average.
Officers per 1,000 residents here:
2.62Wyoming average:
2.78
Latest news from Powell, WY collected exclusively by city-data.com from local newspapers, TV, and radio stations
Ancestries: German (19.3%), European (8.9%), English (7.2%), American (7.1%), Irish (6.0%), Italian (5.3%).
Current Local Time:
Land area: 3.73 square miles.
Population density: 1,749 people per square mile (low).
79 residents are foreign born
This city:
1.2%Wyoming:
3.4%
Median real estate property taxes paid for housing units with mortgages in 2022: $1,762 (0.6%)Median real estate property taxes paid for housing units with no mortgage in 2022: $1,413 (0.6%)
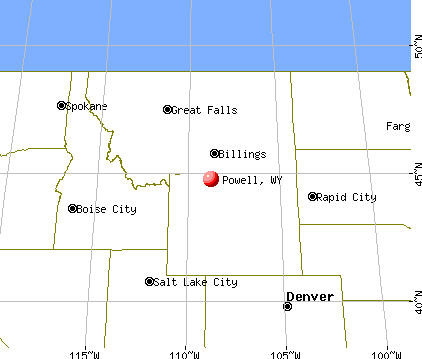
Nearest city with pop. 50,000+: Billings, MT
Nearest city with pop. 200,000+: West Adams, CO (388.8 miles
Nearest city with pop. 1,000,000+: Phoenix, AZ
Nearest cities:
Garland, WY (2.3 miles),
Deaver, WY (3.5 miles),
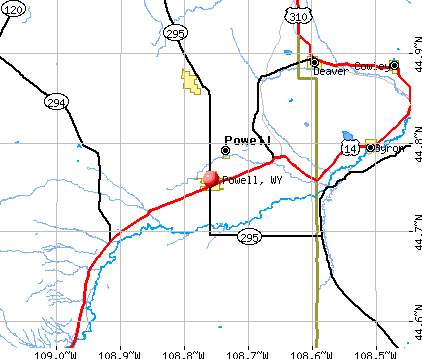
Latitude: 44.76 N, Longitude: 108.76 W
Daytime population change due to commuting: +624 (+9.6%)Workers who live and work in this city: 1,707 (62.4%)
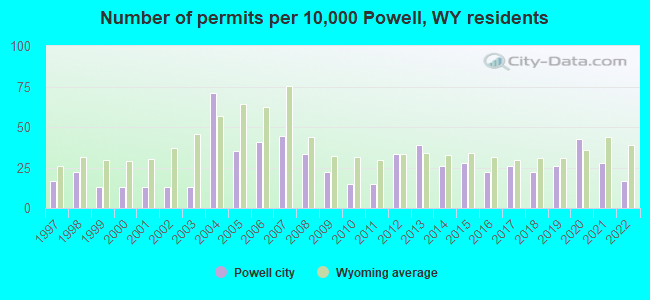
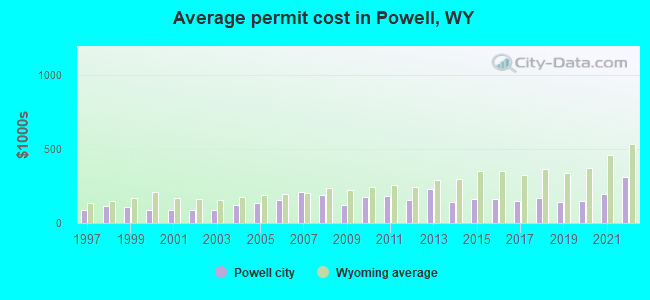
Single-family new house construction building permits:
2022: 9 buildings , average cost: $308,0002021: 15 buildings , average cost: $196,9002020: 23 buildings , average cost: $149,6002019: 14 buildings , average cost: $143,9002018: 12 buildings , average cost: $172,2002017: 14 buildings , average cost: $146,8002016: 12 buildings , average cost: $164,2002015: 15 buildings , average cost: $161,7002014: 14 buildings , average cost: $142,1002013: 21 buildings , average cost: $229,0002012: 18 buildings , average cost: $155,8002011: 8 buildings , average cost: $183,0002010: 8 buildings , average cost: $178,8002009: 12 buildings , average cost: $122,8002008: 18 buildings , average cost: $187,6002007: 24 buildings , average cost: $213,1002006: 22 buildings , average cost: $157,5002005: 19 buildings , average cost: $136,5002004: 38 buildings , average cost: $121,3002003: 7 buildings , average cost: $91,4002002: 7 buildings , average cost: $91,4002001: 7 buildings , average cost: $91,4002000: 7 buildings , average cost: $91,4001999: 7 buildings , average cost: $107,0001998: 12 buildings , average cost: $112,7001997: 9 buildings , average cost: $85,800Unemployment in December 2023:
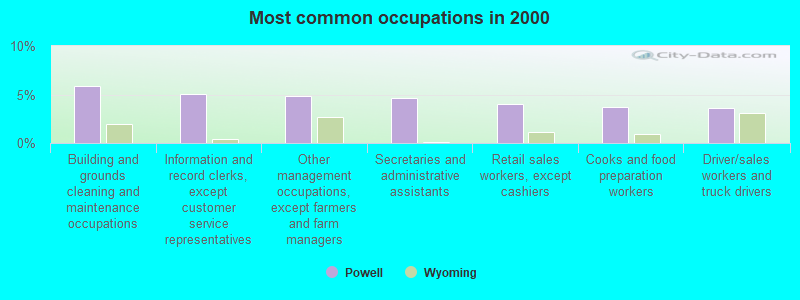
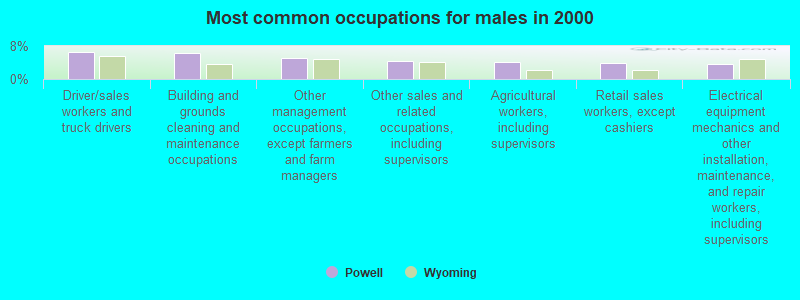
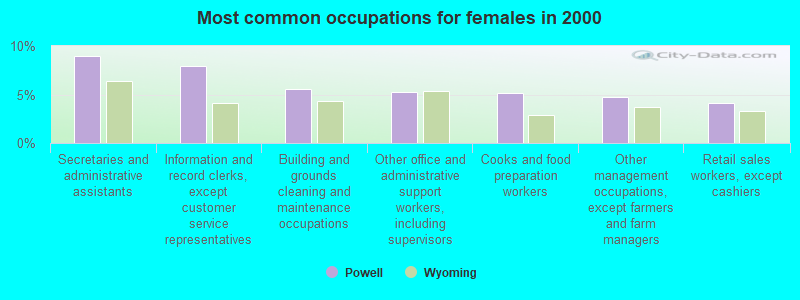
Most common occupations in Powell, WY (%)
Both Males Females
Building and grounds cleaning and maintenance occupations (5.9%)
Information and record clerks, except customer service representatives (5.0%)
Other management occupations, except farmers and farm managers (4.9%)
Secretaries and administrative assistants (4.6%)
Retail sales workers, except cashiers (4.0%)
Cooks and food preparation workers (3.7%)
Driver/sales workers and truck drivers (3.6%)
Driver/sales workers and truck drivers (6.5%)
Building and grounds cleaning and maintenance occupations (6.3%)
Other management occupations, except farmers and farm managers (5.1%)
Other sales and related occupations, including supervisors (4.3%)
Agricultural workers, including supervisors (4.2%)
Retail sales workers, except cashiers (3.9%)
Electrical equipment mechanics and other installation, maintenance, and repair workers, including supervisors (3.7%)
Secretaries and administrative assistants (9.0%)
Information and record clerks, except customer service representatives (7.9%)
Building and grounds cleaning and maintenance occupations (5.6%)
Other office and administrative support workers, including supervisors (5.3%)
Cooks and food preparation workers (5.1%)
Other management occupations, except farmers and farm managers (4.7%)
Retail sales workers, except cashiers (4.1%)
Earthquake activity:
Powell-area historical earthquake activity is significantly above Wyoming state average. It is 758% greater than the overall U.S. average. On 8/18/1959 at 06:37:13, a magnitude 7.7 (7.7 UK, Class: Major, Intensity: VIII - XII) earthquake occurred 94.3 miles away from Powell center, causing $26,000,000 total damage On 10/28/1983 at 14:06:06, a magnitude 7.3 (6.2 MB, 7.3 MS, 7.0 MW) earthquake occurred 253.5 miles away from Powell center, causing 2 deaths ( 2 shaking deaths) and 3 injuries, causing $15,000,000 total damage On 6/30/1975 at 18:54:13, a magnitude 6.1 (5.6 MB, 5.9 MS, 6.1 UK, 6.1 ML, Class: Strong, Intensity: VII - IX) earthquake occurred 97.4 miles away from the city center On 3/31/2020 at 23:52:30, a magnitude 6.5 (6.5 MW, Depth: 7.5 mi) earthquake occurred 313.7 miles away from Powell center On 2/3/1994 at 09:05:04, a magnitude 5.8 (5.4 MB, 5.5 MS, 5.8 MW, 5.8 ML, Depth: 4.9 mi, Class: Moderate, Intensity: VI - VII) earthquake occurred 175.9 miles away from Powell center On 3/28/1975 at 02:31:05, a magnitude 6.2 (6.1 MB, 6.0 MS, 6.2 ML) earthquake occurred 266.4 miles away from Powell center Magnitude types: body-wave magnitude (MB), local magnitude (ML), surface-wave magnitude (MS), moment magnitude (MW) Natural disasters: The number of natural disasters in Park County (3) is a lot smaller than the US average (15).Major Disasters (Presidential) Declared: 1Floods: 2, Mudslide: 1, Storm: 1, Other: 1 (Note: some incidents may be assigned to more than one category). Hospitals and medical centers in Powell: POWELL VALLEY HOSPICE (246 N ABSAROKA) POWELL VALLEY HOSPITAL (Voluntary non-profit - Private, provides emergency services, 777 AVENUE H) POWELL NH (639 AVE H)
POWELL VALLEY CARE CENTER (777 AVENUE H)
College/University in Powell: Northwest College Full-time enrollment: 1,557; Location: 231 W 6th St; Public; Website: www.northwestcollege.edu)
Colleges/universities with over 2000 students nearest to Powell:
Montana State University-Billings (about 73 miles; Billings, MT ; Full-time enrollment: 4,319)
Sheridan College (about 90 miles; Sheridan, WY ; FT enrollment: 2,070)
Montana State University (about 129 miles; Bozeman, MT ; FT enrollment: 12,942)
Brigham Young University-Idaho (about 164 miles; Rexburg, ID ; FT enrollment: 30,522)
Casper College (about 181 miles; Casper, WY ; FT enrollment: 2,770)
Western Wyoming Community College (about 221 miles; Rock Springs, WY ; FT enrollment: 2,086)
Idaho State University (about 226 miles; Pocatello, ID ; FT enrollment: 10,350)
Public high schools in Powell:
Public elementary/middle schools in Powell:
See full list of schools located in Powell Birthplace of: Chris Cooley (American football) - Football player, Chris Cooley - 2005 NFL player (Washington Redskins, born : Jul 11, 1982), Darren Dalton - Actor, Dennis Havig - Football player, Lou Roney - College basketball player.
Park County has a predicted average indoor radon screening level greater than 4 pCi/L (pico curies per liter) - Highest Potential Drinking water stations with addresses in Powell and their reported violations in the past:
NORTH END WATER USERS (Population served: 489, Groundwater):
Past monitoring violations:
Monitoring, Source Water (GWR) - In MAY-10-2013, Contaminant: E. COLI. Follow-up actions: St Compliance achieved (AUG-15-2013), St Public Notif received (AUG-15-2013)
Monitoring and Reporting (DBP) - Between APR-2012 and JUN-2012, Contaminant: Chlorine. Follow-up actions: St Compliance achieved (DEC-05-2012)
One minor monitoring violation
One regular monitoring violation
Population served: 375, Purch surface water):
Past monitoring violations:
Follow-up Or Routine LCR Tap M/R - In JAN-01-2001, Contaminant: Lead and Copper Rule. Follow-up actions: St Violation/Reminder Notice (FEB-03-2004), Fed FAO issued (DEC-14-2004), St Compliance achieved (FEB-10-2005)
Population served: 100, Groundwater):
Past health violations:
MCL, Monthly (TCR) - In AUG-2013, Contaminant: Coliform. Follow-up actions: St Compliance achieved (SEP-11-2013), Fed FAO issued (JAN-21-2014), St Public Notif received (FEB-16-2014)
MCL, Monthly (TCR) - In JUL-2013, Contaminant: Coliform. Follow-up actions: St Compliance achieved (SEP-11-2013), Fed FAO issued (JAN-21-2014), St Public Notif received (FEB-16-2014)
MCL, Monthly (TCR) - In AUG-2011, Contaminant: Coliform. Follow-up actions: St Public Notif requested (SEP-06-2011), St Violation/Reminder Notice (SEP-06-2011), St Compliance achieved (SEP-06-2011), St Public Notif received (SEP-26-2011), Fed FAO issued (JAN-21-2014)
Past monitoring violations:
Initial Tap Sampling for Pb and Cu - In JAN-01-2000, Contaminant: Lead and Copper Rule
Population served: 33, Groundwater):
Past health violations:
MCL, Monthly (TCR) - In SEP-2009, Contaminant: Coliform. Follow-up actions: St Compliance achieved (OCT-05-2009)
Past monitoring violations:
One routine major monitoring violation
Drinking water stations with addresses in Powell that have no violations reported:
POWELL, CITY OF (Population served: 6,700, Primary Water Source Type: Purch surface water)
RIVERS BEND TRAILER COURT (Population served: 96, Primary Water Source Type: Purch surface water)
ENCORE ENERGY PARTNERS, AKA CLARKS FORK (Population served: 60, Primary Water Source Type: Surface water)
Average household size: This city:
2.3 peopleWyoming:
2.4 people
Percentage of family households: This city:
58.8%Whole state:
64.6%
Percentage of households with unmarried partners: This city:
6.6%Whole state:
7.1%
Likely homosexual households (counted as self-reported same-sex unmarried-partner households)
Lesbian couples: 0.4% of all households Gay men: 0.2% of all households
People in group quarters in Powell in 2010:
560 people in college/university student housing
146 people in nursing facilities/skilled-nursing facilities
11 people in group homes intended for adults
People in group quarters in Powell in 2000:
479 people in college dormitories (includes college quarters off campus)
121 people in nursing homes
10 people in agriculture workers' dormitories on farms
8 people in other noninstitutional group quarters
Banks with branches in Powell (2011 data):
Wells Fargo Bank, National Association: Powell Main Branch at 102 E. 2nd Street, branch established on 2001/07/25. Info updated 2011/04/05: Bank assets: $1,161,490.0 mil, Deposits: $905,653.0 mil, headquarters in Sioux Falls, SD, positive income , 6395 total offices , Holding Company: Wells Fargo & Company
First Bank of Wyoming: First Bank Of Wyoming at 245 East First, branch established on 1912/01/01. Info updated 2011/08/08: Bank assets: $391.2 mil, Deposits: $288.5 mil, local headquarters , positive income , 4 total offices , Holding Company: Glacier Bancorp, Inc.
Bank of Bridger, National Association: Powell Branch at 856 Road 8, branch established on 2004/09/27. Info updated 2006/11/03: Bank assets: $303.8 mil, Deposits: $272.1 mil, headquarters in Bridger, MT, positive income , Agricultural Specialization, 9 total offices , Holding Company: Bridger Company, The
Big Horn Federal Savings Bank: 151 E First St Branch at 151 E First St, branch established on 1935/01/01. Info updated 2011/07/21: Bank assets: $204.4 mil, Deposits: $178.9 mil, headquarters in Greybull, WY, positive income , 6 total offices
Bank of the West: Powell Branch at 105 East 2nd Street, branch established on 1963/12/07. Info updated 2009/11/16: Bank assets: $62,408.3 mil, Deposits: $43,995.2 mil, headquarters in San Francisco, CA, positive income , 647 total offices , Holding Company: Bnp Paribas
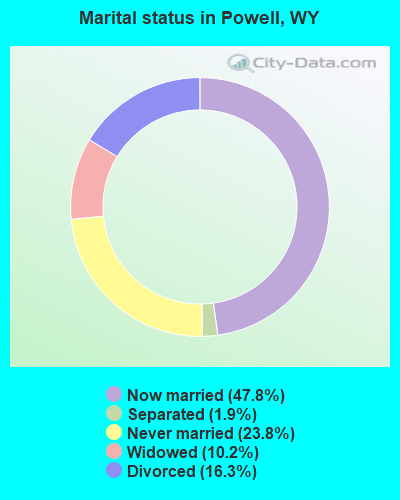
For population 15 years and over in Powell:
Never married: 23.8%Now married: 47.8%Separated: 1.9%Widowed: 10.2%Divorced: 16.3% For population 25 years and over in Powell:
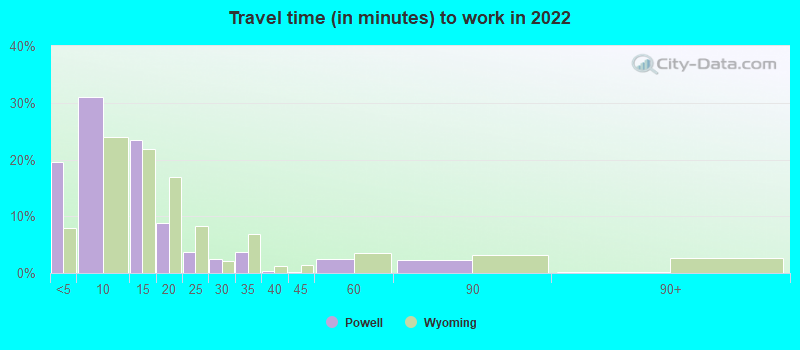
High school or higher: 95.1%Bachelor's degree or higher: 30.9%Graduate or professional degree: 11.0%Unemployed: 5.4%Mean travel time to work (commute): 13.5 minutes
Education Gini index (Inequality in education) Here:
10.1Wyoming average:
10.2
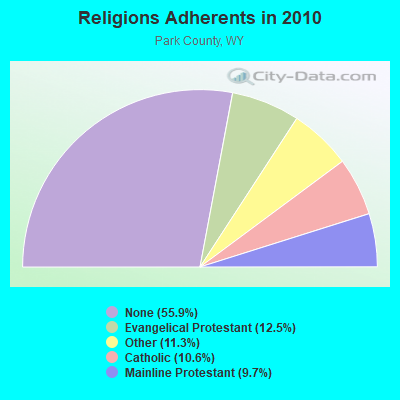
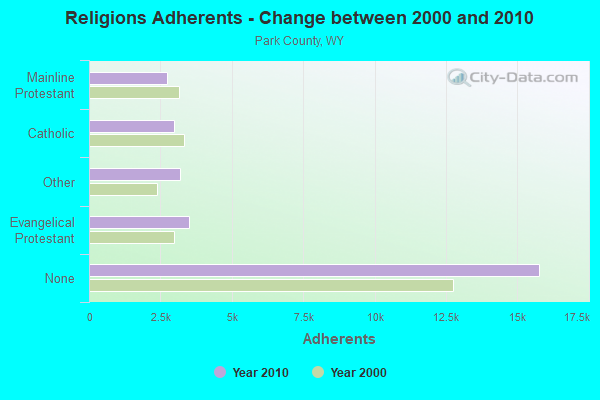
Religion statistics for Powell, WY (based on Park County data)
Religion Adherents Congregations Evangelical Protestant 3,518 37 Other 3,196 13 Catholic 2,985 4 Mainline Protestant 2,732 9 None 15,774 -
Source: Clifford Grammich, Kirk Hadaway, Richard Houseal, Dale E.Jones, Alexei Krindatch, Richie Stanley and Richard H.Taylor. 2012. 2010 U.S.Religion Census: Religious Congregations & Membership Study. Association of Statisticians of American Religious Bodies. Jones, Dale E., et al. 2002. Congregations and Membership in the United States 2000. Nashville, TN: Glenmary Research Center. Graphs represent county-level data
Food Environment Statistics: Number of grocery stores : 5Park County :
1.84 / 10,000 pop.State :
2.10 / 10,000 pop.
Number of supercenters and club stores : 1This county :
0.37 / 10,000 pop.State :
0.27 / 10,000 pop.
Number of convenience stores (no gas) : 2Park County :
0.74 / 10,000 pop.Wyoming :
0.65 / 10,000 pop.
Number of convenience stores (with gas) : 19Park County :
6.99 / 10,000 pop.Wyoming :
5.36 / 10,000 pop.
Number of full-service restaurants : 43Here :
15.82 / 10,000 pop.Wyoming :
10.08 / 10,000 pop.
Adult obesity rate : This county :
22.0%State :
24.4%
Health and Nutrition: Healthy diet rate : Powell:
50.6%Wyoming:
49.4%
Average overall health of teeth and gums : Powell:
48.5%Wyoming:
46.6%
Average BMI : This city:
28.1Wyoming:
28.8
People feeling badly about themselves : People not drinking alcohol at all : Average hours sleeping at night : Overweight people : Powell:
31.9%Wyoming:
34.7%
General health condition : Powell:
57.2%Wyoming:
56.6%
Average condition of hearing : More about Health and Nutrition of Powell, WY Residents
Local government employment and payroll (March 2022)
Function
Full-time employees
Monthly full-time payroll
Average yearly full-time wage
Part-time employees
Monthly part-time payroll
Police Protection - Officers
14 $75,908 $65,064 0 $0 Other Government Administration
10 $28,265 $33,918 0 $0 Parks and Recreation
9 $40,753 $54,337 32 $16,235 Streets and Highways
6 $29,736 $59,472 0 $0 Police - Other
6 $27,809 $55,618 0 $0 Electric Power
5 $37,052 $88,925 0 $0 Solid Waste Management
5 $22,785 $54,684 1 $932 Financial Administration
5 $25,134 $60,322 0 $0 Water Supply
3 $12,447 $49,788 0 $0 Other and Unallocable
3 $14,450 $57,800 0 $0 Judicial and Legal
3 $9,398 $37,592 0 $0 Sewerage
2 $11,601 $69,606 0 $0 Airports
1 $3,461 $41,532 0 $0
Totals for Government
72 $338,798 $56,466 33 $17,168
Powell government finances - Expenditure in 2021 (per resident):
Construction - Electric Utilities: $1,464,000 ($224.64)
Air Transportation: $734,000 ($112.63)Parks and Recreation: $106,000 ($16.27)Sewerage: $52,000 ($7.98)General - Other: $31,000 ($4.76)Current Operations - Electric Utilities: $5,195,000 ($797.15)
Police Protection: $2,258,000 ($346.48)Parks and Recreation: $1,592,000 ($244.28)Water Utilities: $1,171,000 ($179.68)Solid Waste Management: $1,114,000 ($170.94)Regular Highways: $1,018,000 ($156.21)Central Staff Services: $684,000 ($104.96)Financial Administration: $421,000 ($64.60)General - Other: $362,000 ($55.55)Sewerage: $330,000 ($50.64)Air Transportation: $153,000 ($23.48)Judicial and Legal Services: $130,000 ($19.95)Protective Inspection and Regulation - Other: $127,000 ($19.49)General - Interest on Debt: $23,000 ($3.53)
Other Capital Outlay - Police Protection: $100,000 ($15.34)
Regular Highways: $82,000 ($12.58)Water Utilities: $49,000 ($7.52)Sewerage: $47,000 ($7.21)Solid Waste Management: $20,000 ($3.07)Central Staff Services: $19,000 ($2.92)Electric Utilities: $17,000 ($2.61)Parks and Recreation: $9,000 ($1.38)Water Utilities - Interest on Debt: $8,000 ($1.23)
Powell government finances - Revenue in 2021 (per resident):
Charges - Solid Waste Management: $1,451,000 ($222.65)
Sewerage: $757,000 ($116.16)Other: $466,000 ($71.51)Parks and Recreation: $382,000 ($58.62)Air Transportation: $114,000 ($17.49)Federal Intergovernmental - Other: $1,440,000 ($220.96)
Local Intergovernmental - Other: $131,000 ($20.10)
Health and Hospitals: $34,000 ($5.22)General Local Government Support: $3,000 ($0.46)Miscellaneous - General Revenue - Other: $163,000 ($25.01)
Interest Earnings: $157,000 ($24.09)Sale of Property: $92,000 ($14.12)Fines and Forfeits: $23,000 ($3.53)Revenue - Electric Utilities: $6,740,000 ($1034.22)
Water Utilities: $1,827,000 ($280.34)State Intergovernmental - General Local Government Support: $2,777,000 ($426.12)
Other: $674,000 ($103.42)Highways: $152,000 ($23.32)Tax - Property: $526,000 ($80.71)
Other License: $108,000 ($16.57)Public Utilities Sales: $104,000 ($15.96)Other: $76,000 ($11.66)Occupation and Business License - Other: $47,000 ($7.21)Other Selective Sales: $4,000 ($0.61)
Powell government finances - Debt in 2021 (per resident):
Long Term Debt - Beginning Outstanding - Unspecified Public Purpose: $1,002,000 ($153.75)
Outstanding Unspecified Public Purpose: $895,000 ($137.33)Retired Unspecified Public Purpose: $107,000 ($16.42)
Powell government finances - Cash and Securities in 2021 (per resident):
Other Funds - Cash and Securities: $17,969,000 ($2757.25)
Businesses in Powell, WY
Name Count Name Count
Chevrolet 1 Pizza Hut 1 Decora Cabinetry 1 RadioShack 1 Domino's Pizza 1 Subway 1 FedEx 1 Super 8 1 H&R Block 1 Toyota 1 MasterBrand Cabinets 1 True Value 1 McDonald's 1 U-Haul 1 Nike 2 UPS 2
Strongest AM radio stations in Powell:
KPOW (1260 AM; 5 kW; POWELL, WY; Owner: CHAPARRAL BROADCASTING, INC.)
KZMQ (1140 AM; daytime; 10 kW; GREYBULL, WY; Owner: LEGEND COMMUNICATIONS OF WYOMING LLC)
KTWO (1030 AM; 50 kW; CASPER, WY; Owner: CITICASTERS LICENSES, L.P.)
KODI (1400 AM; 1 kW; CODY, WY; Owner: LEGEND COMMUNICATIONS OF WYOMING, LLC)
KGHL (790 AM; 5 kW; BILLINGS, MT; Owner: NEW NORTHWEST BROADCASTERS, LLC)
KURL (730 AM; 5 kW; BILLINGS, MT; Owner: ELENBAAS MEDIA, INC.)
KBUL (970 AM; 5 kW; BILLINGS, MT; Owner: CAPSTAR TX LIMITED PARTNERSHIP)
KUYO (830 AM; daytime; 25 kW; EVANSVILLE, WY; Owner: WYOMING CHRISTIAN BROADCASTING COMPANY)
KGVW (640 AM; 10 kW; BELGRADE, MT; Owner: GALLATIN VALLEY WITNESS, INC.)
KALL (700 AM; 50 kW; NORTH SALT LAKE CITY, UT; Owner: CITICASTERS LICENSES, L.P.)
KROE (930 AM; 5 kW; SHERIDAN, WY; Owner: LOVCOM, INC.)
KERR (750 AM; 50 kW; POLSON, MT; Owner: ANDERSON RADIO BROADCASTING, INC.)
KIQN (1010 AM; 50 kW; TOOELE, UT)
Strongest FM radio stations in Powell:
KUWP (90.1 FM; POWELL, WY; Owner: UNIVERSITY OF WYOMING)
KCGL (104.1 FM; POWELL, WY; Owner: LEGEND COMMUNICATIONS OF WYOMING, LLC)
KTAG (97.9 FM; CODY, WY; Owner: LEGEND COMMUNICATIONS OF WYOMING, LLC)
K233AC (94.5 FM; CODY, WY; Owner: WESTERN INSPIRATIONAL BROADCASTERS, INC)
KLZY (92.5 FM; POWELL, WY; Owner: CHAPARRAL BROADCASTING, INC.)
KMXE (99.3 FM; RED LODGE, MT; Owner: SILVER ROCK COMMUNICATIONS INC.)
KZMQ-FM (100.3 FM; GREYBULL, WY; Owner: LEGEND COMMUNICATIONS OF WYOMING LLC)
K244CK (96.7 FM; COWLEY, ETC., WY; Owner: CONNECTION COMMUNICATIONS ASSOC., INC.)
National Bridge Inventory (NBI) Statistics 14 Number of bridges82ft / 24.9m Total length $330,000 Total costs10,626 Total average daily traffic724 Total average daily truck traffic14,875 Total future (year 2041) average daily traffic
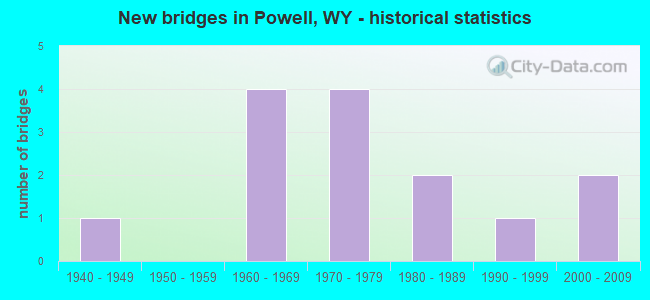
New bridges - historical statistics
1 1940-1949 4 1960-1969 4 1970-1979 2 1980-1989 1 1990-1999 2 2000-2009
See full National Bridge Inventory statistics for Powell, WY
Most common first names in Powell, WY among deceased individuals Name Count Lived (average)
William 58 74.4 years John 57 75.0 years Mary 55 81.6 years James 49 73.1 years Robert 45 78.0 years Helen 30 84.0 years Charles 28 75.3 years George 26 80.0 years Dorothy 22 77.2 years Edith 22 83.5 years
Most common last names in Powell, WY among deceased individuals Last name Count Lived (average)
Johnson 32 83.1 years Smith 28 79.5 years Miller 24 76.9 years Anderson 22 81.0 years Scott 20 79.0 years Jones 19 78.4 years Moore 16 75.4 years Brown 15 79.5 years Nelson 14 82.0 years Martin 12 78.2 years
Powell compared to Wyoming state average:
Unemployed percentage below state average. Black race population percentage below state average. Median age significantly below state average. Foreign-born population percentage significantly below state average. Number of college students above state average. Percentage of population with a bachelor's degree or higher above state average.
#10 on the list of "Top 101 cities with the highest number of rapes per 100,000 residents, excludes tourist destinations and others with a lot of outsiders visiting based on city industries data (population 5,000+)"
#53 on the list of "Top 101 cities with the most residents born in Other Southern Africa (population 500+)"
#72 on the list of "Top 101 cities with the largest city-data.com crime index increase from 2011 to 2012 (population 5,000+)"
#87 on the list of "Top 101 cities with largest percentage of males in industries: mining, quarrying, and oil and gas extraction (population 5,000+)"
#25 on the list of "Top 101 counties with the lowest Particulate Matter (PM2.5 ) Annual air pollution readings in 2012 (µg/m3 )"
#70 on the list of "Top 101 counties with the lowest Particulate Matter (PM10 ) Annual air pollution readings in 2012 (µg/m3 )"
Top Patent Applicants
Michael Dedman (4)
Jerry Wenger (3)
Cornelis C. Valkenburg (2)
Jerry A. Wenger (2)
Donald Wasilewski (1)
Andrew F. Rose (1)
David Michael Frost, Jr. (1)
Vincent H. Rose (1)
Stuart Anthony Frost (1)
Samuel Curlett (1)
Total of 18 patent applications in 2008-2024.


 Recent articles from our blog. Our writers, many of them Ph.D. graduates or candidates, create easy-to-read articles on a wide variety of topics.

 (71.9 miles
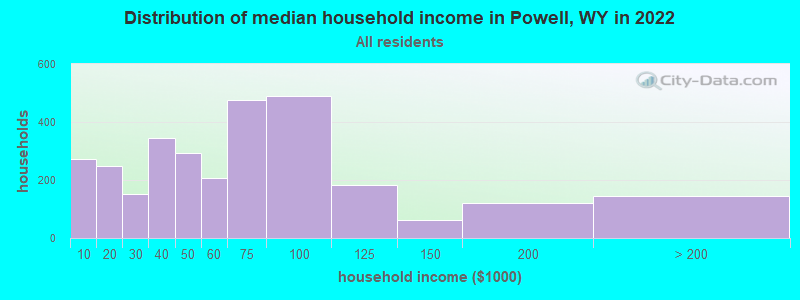


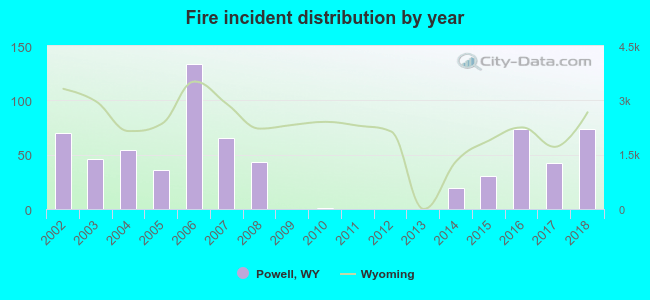 Based on the data from the years 2002 - 2018 the average number of fires per year is 40. The highest number of fires - 133 took place in 2006, and the least - 0 in 2009. The data has a rising trend.
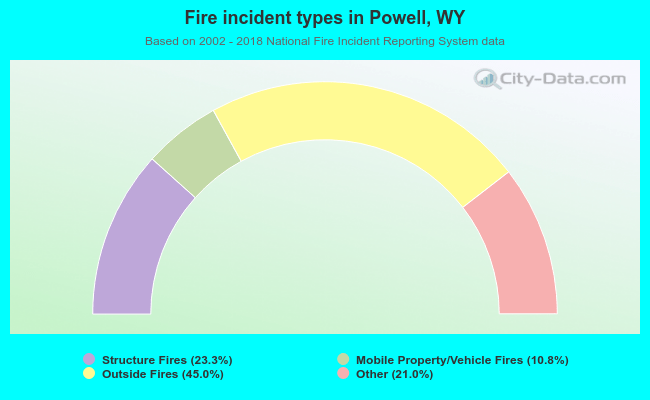 When looking into fire subcategories, the most reports belonged to: Outside Fires (45.0%), and Structure Fires (23.3%).