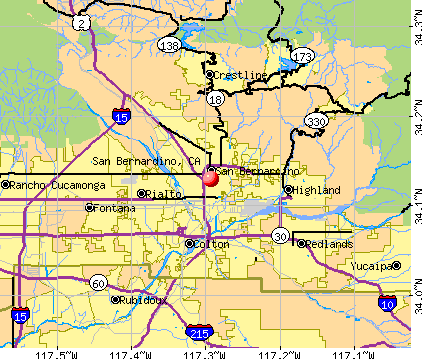
San Bernardino, California
San Bernardino: Fire day in SB
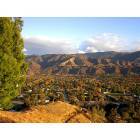
San Bernardino: Looking at Mountains From Backyard - Sept 2007
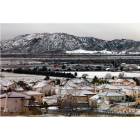
San Bernardino: Blizzard in the San Bernardino Area
San Bernardino: Verdemont
San Bernardino: Average January Snowfall in the city of San Bernardino, California
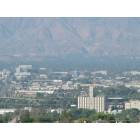
San Bernardino: North End of San Bernardino. Looking North from Little Mountian
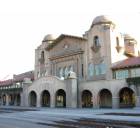
San Bernardino: Santa Fe Train in San Bernardino
San Bernardino: San Bernardino
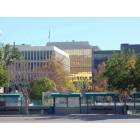
San Bernardino: Downtown San Bernardino

San Bernardino: January Snowfall in San Bernardino
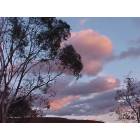
San Bernardino: Cotton Candy Clouds over Devil's Canyon Reservoir
- see
37
more - add
your
Submit your own pictures of this city and show them to the world
- OSM Map
- General Map
- Google Map
- MSN Map
Population change since 2000: +18.8%
 |
| Males: 108,530 | |
| Females: 111,798 |
| Median resident age: | 32.1 years |
| California median age: | 37.9 years |
Zip codes: 92401, 92405, 92411.
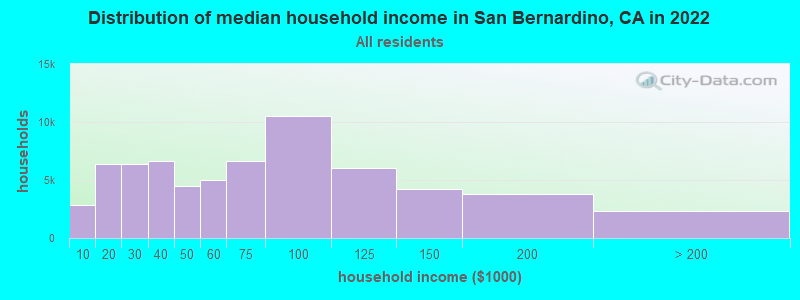
San Bernardino Zip Code Map| San Bernardino: | $62,801 |
| CA: | $91,551 |
Estimated per capita income in 2022: $23,466 (it was $12,925 in 2000)
San Bernardino city income, earnings, and wages data
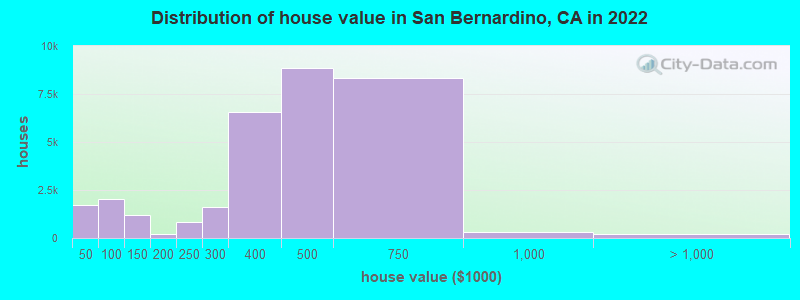
Estimated median house or condo value in 2022: $422,200 (it was $94,300 in 2000)
| San Bernardino: | $422,200 |
| CA: | $715,900 |
Mean prices in 2022: all housing units: $408,330; detached houses: $444,219; townhouses or other attached units: $354,925; in 2-unit structures: $514,251; in 3-to-4-unit structures: $285,003; in 5-or-more-unit structures: $299,230; mobile homes: $91,778
Median gross rent in 2022: $1,349.
San Bernardino, CA residents, houses, and apartments details
(19.1% for White Non-Hispanic residents, 25.7% for Black residents, 16.5% for Hispanic or Latino residents, 13.0% for American Indian residents, 51.1% for Native Hawaiian and other Pacific Islander residents, 17.4% for other race residents, 16.3% for two or more races residents)
Detailed information about poverty and poor residents in San Bernardino, CA


Compare current foreclosures in San Bernardino, CA:


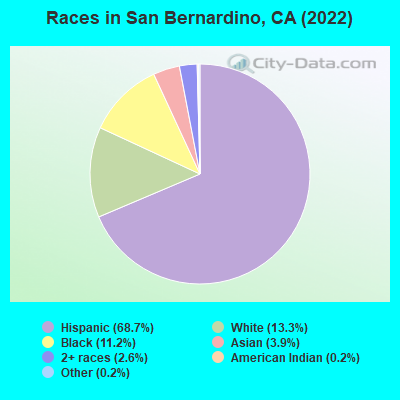
- 151,26268.7%Hispanic
- 29,22613.3%White alone
- 24,68111.2%Black alone
- 8,6103.9%Asian alone
- 5,6632.6%Two or more races
- 4960.2%American Indian alone
- 3760.2%Other race alone
According to our research of California and other state lists, there were 693 registered sex offenders living in San Bernardino, California as of April 20, 2024.
The ratio of all residents to sex offenders in San Bernardino is 312 to 1.
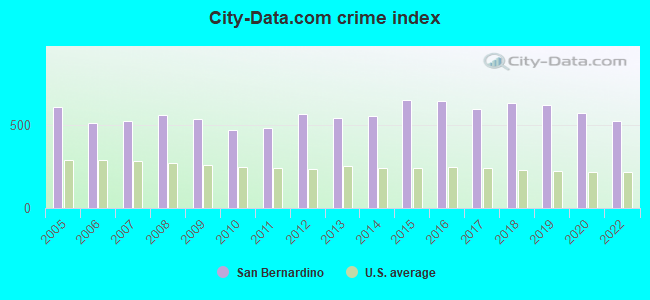
The City-Data.com crime index weighs serious crimes and violent crimes more heavily. Higher means more crime, U.S. average is 246.1. It adjusts for the number of visitors and daily workers commuting into cities.
- means the value is about the same as the state average.- means the value is bigger than the state average.
- means the value is much bigger than the state average.
Crime rate in San Bernardino detailed stats: murders, rapes, robberies, assaults, burglaries, thefts, arson
Full-time law enforcement employees in 2021, including police officers: 345 (245 officers - 214 male; 31 female).
| Officers per 1,000 residents here: | 1.12 |
| California average: | 2.30 |
 Recent articles from our blog. Our writers, many of them Ph.D. graduates or candidates, create easy-to-read articles on a wide variety of topics.


Latest news from San Bernardino, CA collected exclusively by city-data.com from local newspapers, TV, and radio stations
Ancestries: American (1.7%), German (1.2%), Irish (1.1%).
Current Local Time: PST time zone
Elevation: 1200 feet
Land area: 58.8 square miles.
Population density: 3,746 people per square mile (average).
48,195 residents are foreign born (18.1% Latin America, 3.0% Asia).
| This city: | 21.7% |
| California: | 26.5% |
Median real estate property taxes paid for housing units with mortgages in 2022: $2,665 (0.6%)
Median real estate property taxes paid for housing units with no mortgage in 2022: $1,347 (0.4%)
Nearest city with pop. 200,000+: Riverside, CA  (13.9 miles , pop. 255,166).
Nearest city with pop. 1,000,000+: Los Angeles, CA (62.1 miles , pop. 3,694,820).
Nearest cities:
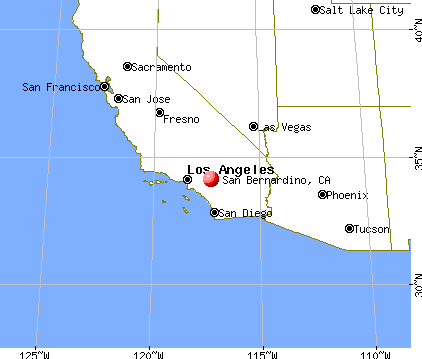
), Latitude: 34.13 N, Longitude: 117.29 W
Daytime population change due to commuting: +32,473 (+14.7%)
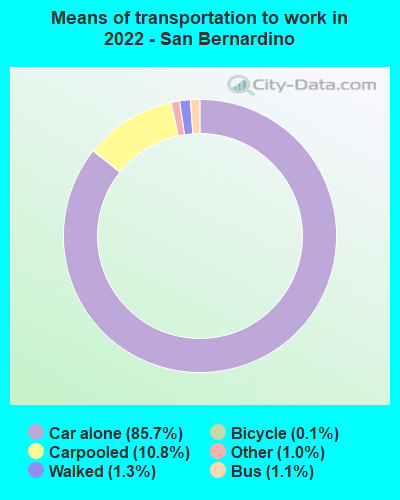
Workers who live and work in this city: 34,732 (35.7%)
Area code: 909
Property values in San Bernardino, CA

San Bernardino tourist attractions:
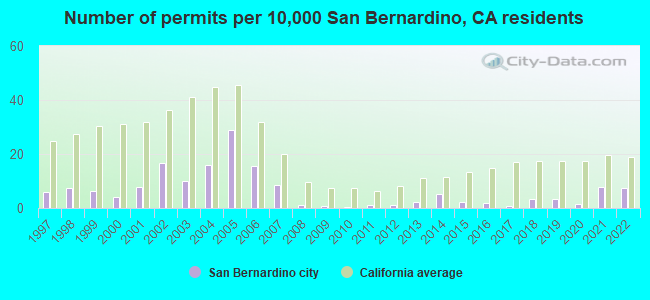
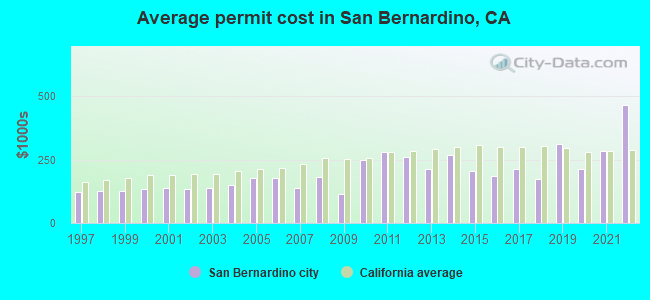
Single-family new house construction building permits:
- 2022: 136 buildings, average cost: $466,000
- 2021: 143 buildings, average cost: $284,200
- 2020: 25 buildings, average cost: $213,700
- 2019: 59 buildings, average cost: $310,800
- 2018: 62 buildings, average cost: $173,400
- 2017: 16 buildings, average cost: $212,100
- 2016: 34 buildings, average cost: $184,900
- 2015: 38 buildings, average cost: $204,400
- 2014: 95 buildings, average cost: $270,300
- 2013: 38 buildings, average cost: $213,500
- 2012: 23 buildings, average cost: $260,300
- 2011: 24 buildings, average cost: $278,700
- 2010: 6 buildings, average cost: $247,600
- 2009: 11 buildings, average cost: $116,200
- 2008: 21 buildings, average cost: $182,700
- 2007: 159 buildings, average cost: $139,400
- 2006: 286 buildings, average cost: $179,200
- 2005: 537 buildings, average cost: $177,800
- 2004: 296 buildings, average cost: $150,400
- 2003: 185 buildings, average cost: $137,300
- 2002: 310 buildings, average cost: $132,700
- 2001: 144 buildings, average cost: $138,600
- 2000: 76 buildings, average cost: $132,800
- 1999: 120 buildings, average cost: $125,500
- 1998: 137 buildings, average cost: $125,500
- 1997: 108 buildings, average cost: $120,700
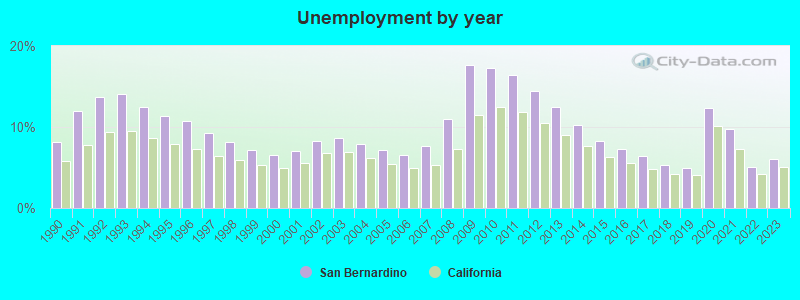
| Here: | 6.1% |
| California: | 5.1% |
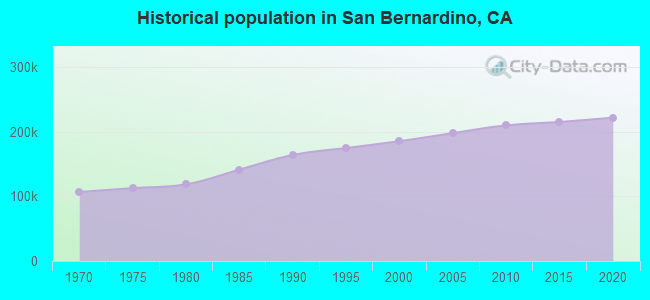
Population change in the 1990s: +11,880 (+6.8%).
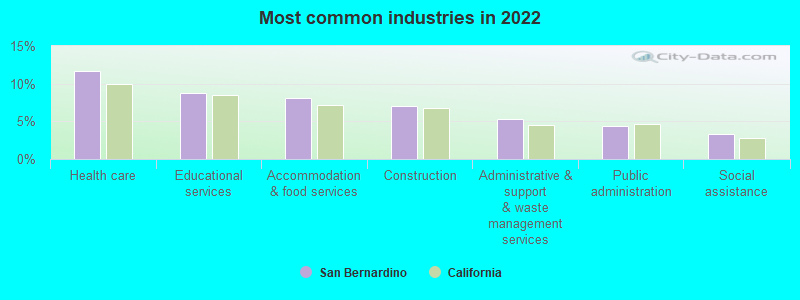
- Health care (11.6%)
- Educational services (8.8%)
- Accommodation & food services (8.0%)
- Construction (7.0%)
- Administrative & support & waste management services (5.3%)
- Public administration (4.4%)
- Social assistance (3.3%)
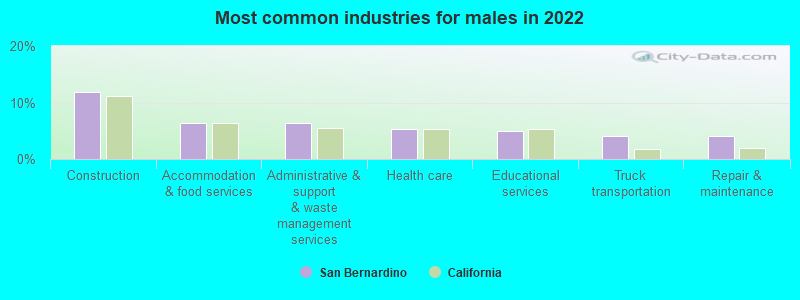
- Construction (11.9%)
- Accommodation & food services (6.4%)
- Administrative & support & waste management services (6.4%)
- Health care (5.3%)
- Educational services (5.0%)
- Truck transportation (4.1%)
- Repair & maintenance (4.0%)
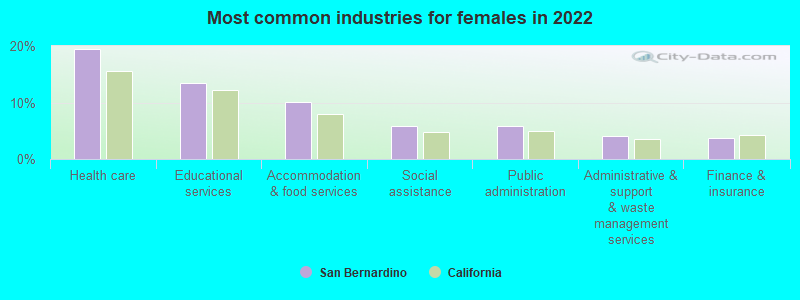
- Health care (19.5%)
- Educational services (13.5%)
- Accommodation & food services (10.1%)
- Social assistance (5.8%)
- Public administration (5.8%)
- Administrative & support & waste management services (4.0%)
- Finance & insurance (3.6%)
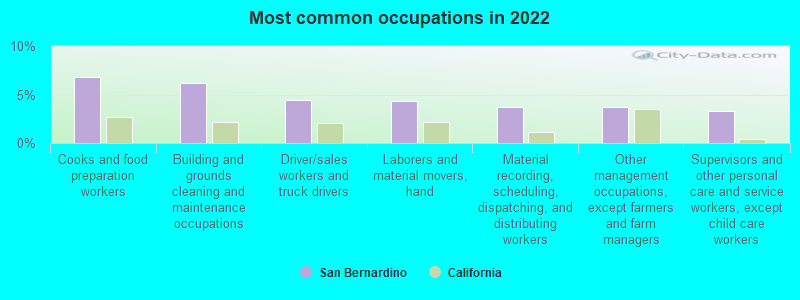
- Cooks and food preparation workers (6.8%)
- Building and grounds cleaning and maintenance occupations (6.2%)
- Driver/sales workers and truck drivers (4.4%)
- Laborers and material movers, hand (4.3%)
- Material recording, scheduling, dispatching, and distributing workers (3.7%)
- Other management occupations, except farmers and farm managers (3.7%)
- Supervisors and other personal care and service workers, except child care workers (3.3%)
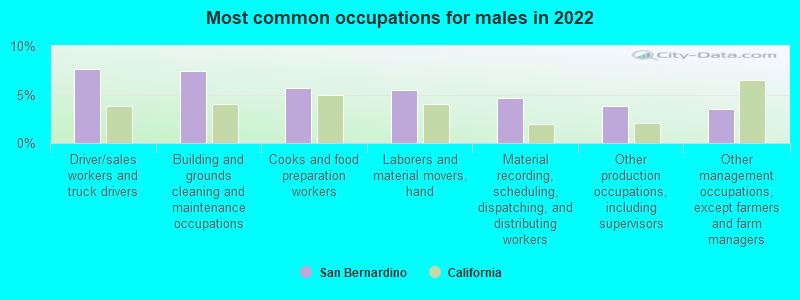
- Driver/sales workers and truck drivers (7.6%)
- Building and grounds cleaning and maintenance occupations (7.4%)
- Cooks and food preparation workers (5.6%)
- Laborers and material movers, hand (5.4%)
- Material recording, scheduling, dispatching, and distributing workers (4.6%)
- Other production occupations, including supervisors (3.9%)
- Other management occupations, except farmers and farm managers (3.5%)
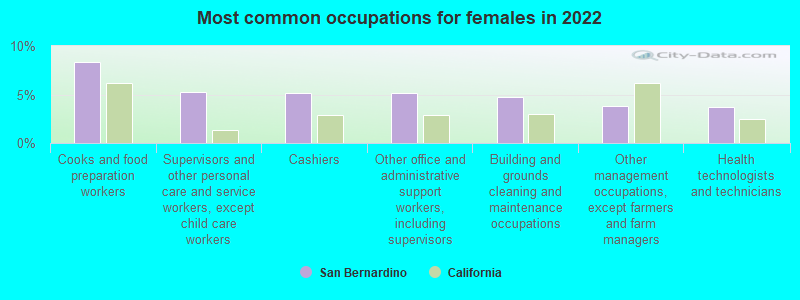
- Cooks and food preparation workers (8.3%)
- Supervisors and other personal care and service workers, except child care workers (5.2%)
- Cashiers (5.2%)
- Other office and administrative support workers, including supervisors (5.1%)
- Building and grounds cleaning and maintenance occupations (4.7%)
- Other management occupations, except farmers and farm managers (3.8%)
- Health technologists and technicians (3.7%)
Average climate in San Bernardino, California
Based on data reported by over 4,000 weather stations


|
|

(lower is better)
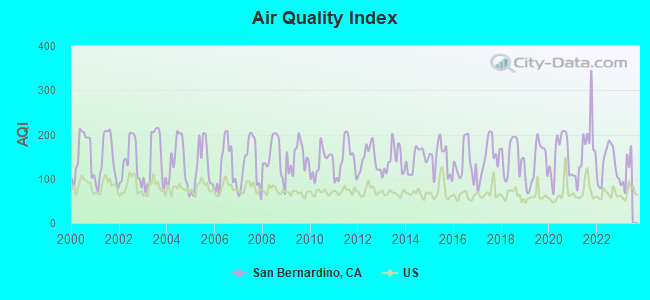
Air Quality Index (AQI) level in 2022 was 133. This is significantly worse than average.
| City: | 133 |
| U.S.: | 73 |
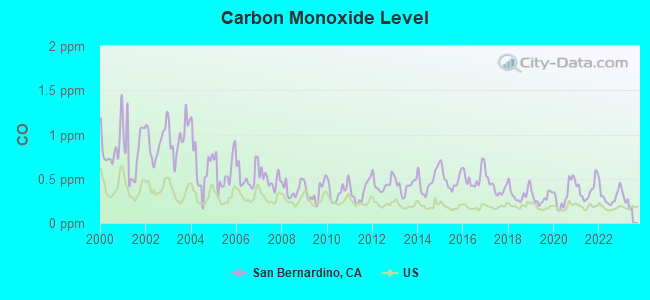
Carbon Monoxide (CO) [ppm] level in 2022 was 0.301. This is about average. Closest monitor was 1.8 miles away from the city center.
| City: | 0.301 |
| U.S.: | 0.251 |
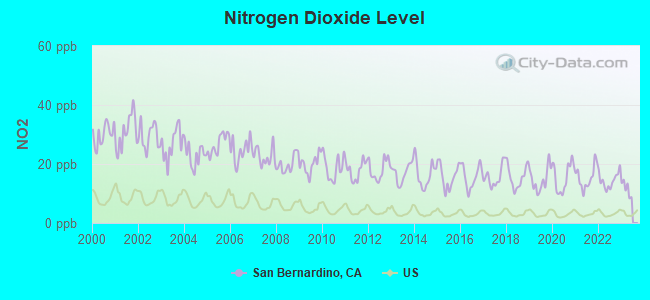
Nitrogen Dioxide (NO2) [ppb] level in 2022 was 14.5. This is significantly worse than average. Closest monitor was 1.8 miles away from the city center.
| City: | 14.5 |
| U.S.: | 5.1 |
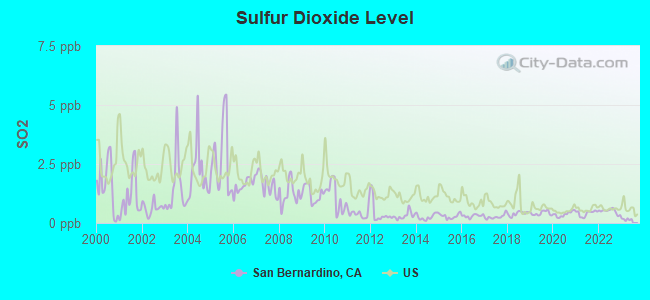
Sulfur Dioxide (SO2) [ppb] level in 2022 was 0.498. This is significantly better than average. Closest monitor was 1.8 miles away from the city center.
| City: | 0.498 |
| U.S.: | 1.515 |
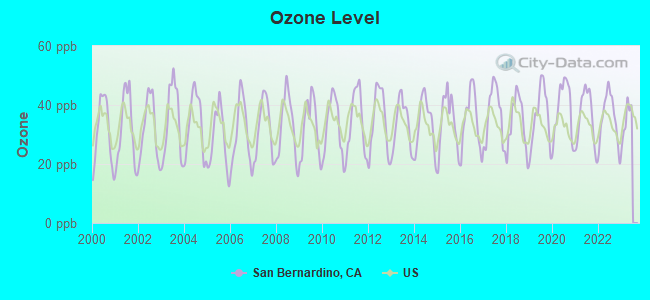
Ozone [ppb] level in 2022 was 35.5. This is about average. Closest monitor was 1.8 miles away from the city center.
| City: | 35.5 |
| U.S.: | 33.3 |
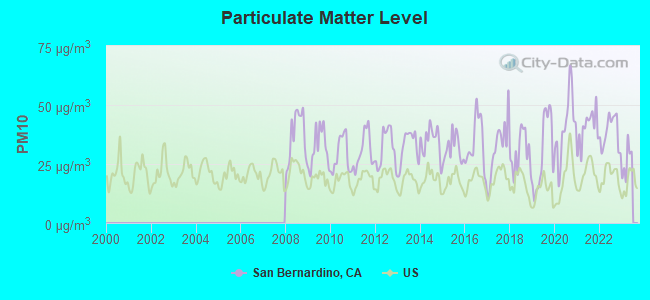
Particulate Matter (PM10) [µg/m3] level in 2022 was 38.4. This is significantly worse than average. Closest monitor was 1.9 miles away from the city center.
| City: | 38.4 |
| U.S.: | 19.2 |
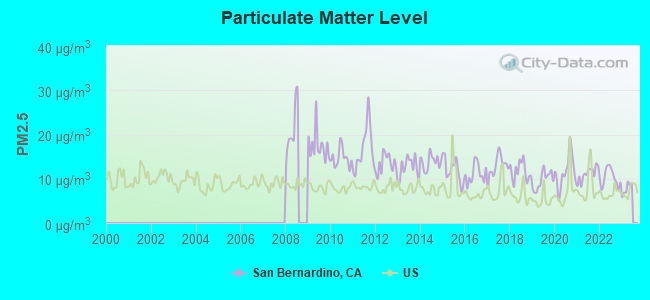
Particulate Matter (PM2.5) [µg/m3] level in 2022 was 10.3. This is worse than average. Closest monitor was 1.9 miles away from the city center.
| City: | 10.3 |
| U.S.: | 8.1 |
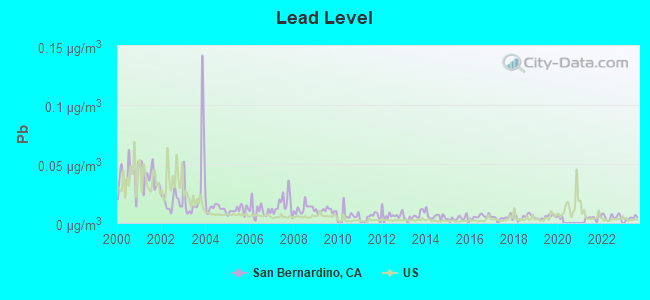
Lead (Pb) [µg/m3] level in 2023 was 0.00426. This is significantly better than average. Closest monitor was 1.8 miles away from the city center.
| City: | 0.00426 |
| U.S.: | 0.00931 |
Earthquake activity:
San Bernardino-area historical earthquake activity is significantly above California state average. It is 7382% greater than the overall U.S. average.On 6/28/1992 at 11:57:34, a magnitude 7.6 (6.2 MB, 7.6 MS, 7.3 MW, Depth: 0.7 mi, Class: Major, Intensity: VIII - XII) earthquake occurred 43.7 miles away from San Bernardino center, causing 3 deaths (1 shaking deaths, 2 other deaths) and 400 injuries, causing $100,000,000 total damage and $40,000,000 insured losses
On 7/21/1952 at 11:52:14, a magnitude 7.7 (7.7 UK) earthquake occurred 114.4 miles away from San Bernardino center, causing $50,000,000 total damage
On 10/16/1999 at 09:46:44, a magnitude 7.4 (6.3 MB, 7.4 MS, 7.2 MW, 7.3 ML) earthquake occurred 55.8 miles away from the city center
On 6/28/1992 at 15:05:30, a magnitude 6.9 (6.3 MB, 6.7 MS, 6.5 MW, 6.9 ME, Depth: 3.1 mi, Class: Strong, Intensity: VII - IX) earthquake occurred 29.4 miles away from the city center
On 5/19/1940 at 04:36:40, a magnitude 7.2 (7.2 UK) earthquake occurred 111.3 miles away from the city center, causing $33,000,000 total damage
On 4/21/1918 at 22:32:30, a magnitude 6.8 (6.8 UK) earthquake occurred 23.5 miles away from San Bernardino center
Magnitude types: body-wave magnitude (MB), energy magnitude (ME), local magnitude (ML), surface-wave magnitude (MS), moment magnitude (MW)
Natural disasters:
The number of natural disasters in San Bernardino County (46) is a lot greater than the US average (15).Major Disasters (Presidential) Declared: 27
Emergencies Declared: 2
Causes of natural disasters: Fires: 24, Floods: 18, Storms: 9, Winter Storms: 6, Landslides: 5, Mudslides: 4, Heavy Rains: 2, Earthquake: 1, Flash Flood: 1, Freeze: 1, Hurricane: 1, Snow: 1, Tornado: 1, Tropical Storm: 1, Wind: 1, Other: 1 (Note: some incidents may be assigned to more than one category).
Hospitals in San Bernardino:
- ALL AMERICAN HOSPICE (669 N ARROWHEAD AVE #200)
- COMMUNITY HOSPITAL OF SAN BERNARDINO (Voluntary non-profit - Private, provides emergency services, 1805 MEDICAL CENTER DRIVE)
- ODYSSEY HEALTHCARE OF RIVERSIDE (255 WEST HOSPITALITY LANE, SUITE 102)
- PACIFIC HOSPICE (1998 N ARROWHEAD AVENUE)
- PACIFIC HOSPICE INTERNATIONAL, LLC (1911 SOUTH COMMERCENTER EAST, #202)
- SAN BERNARDINO COUNTY MED CENTER (700 E GILBERT ST)
- ST BERNARDINE MEDICAL CENTER (Voluntary non-profit - Private, 2101 N WATERMAN AVE)
- VITAS HEALTHCARE CORPORATION OF CALIFORNIA (1845 BUSINESS CTR DRIVE SUITE 120)
Nursing Homes in San Bernardino:
- ARROWHEAD HOME (4343 N. SIERRA WAY)
- COMMUNITY CONVALESCENT CENTER OF SAN BERNARDINO (1676 MEDICAL CTR DR.)
- COUNTRY VILLA HACIENDA HEALTHCARE (1311 EAST DATE STREET)
- DEL ROSA VILLA (2018 N DEL ROSA AVE.)
- LEGACY POST-ACUTE REHABILITATION (1335 N. WATERMAN AVENUE)
- MEDICAL CENTER CONV HOSP (467 E GILBERT ST)
- ROBERT H BALLARD REHAB HOSP D/P (1760 WEST 16TH ST)
- SHANDIN HILLS CONVALESCENT HOSPITAL (4160 N 4TH ST)
- ST. BERNARDINE MED CTR. (2101 N. WATERMAN AVENUE)
- VALLEY HEALTHCARE CENTER (1680 NORTH WATERMAN AVENUE)
Dialysis Facilities in San Bernardino:
- DAVITA-CITRUS VALLEY DIALYSIS (894 HARDT STREET)
- DAVITA-MOUNTAIN VISTA DIALYSIS CENTER (4041 UNIVERSITY PARKWAY)
- FMC-LOMA LINDA (269 E. CAROLINE STREET, SUITE A)
- FMC-SAN BERNARDINO (636 E. BRIER DRIVE, SUITE 150)
- RAI-NORTH WATERMAN-SAN BERNARDINO (1500 N. WATERMAN AVENUE)
- SAN BERNARDINO VALLEY HOME DIALYSIS CENTER (1500 N. WATERMAN AVENUE, SUITE B)
Home Health Centers in San Bernardino:
Airports and heliports located in San Bernardino:
- San Bernardino International Airport (SBD) (Runways: 1, Commercial Ops: 186, Air Taxi Ops: 536, Itinerant Ops: 14,344, Local Ops: 15,000, Military Ops: 454)
- County Headquarters Bldg Heliport (CL95)
- Sce Eastern Division Heliport (8CA4)
Colleges/Universities in San Bernardino:
- California State University-San Bernardino (Full-time enrollment: 15,748; Location: 5500 University Pky; Public; Website: www.csusb.edu; Offers Doctor's degree)
- San Bernardino Valley College (Full-time enrollment: 7,444; Location: 701 South Mount Vernon Avenue; Public; Website: www.valleycollege.edu)
- The Art Institute of California-Argosy University Inland Empire (Full-time enrollment: 2,238; Location: 674 East Brier Drive; Private, for-profit; Website: www.artinstitutes.edu/inlandempire)
- Everest College-San Bernardino (Full-time enrollment: 1,064; Location: 217 E. Club Center Drive, Ste. A; Private, for-profit; Website: everest.edu/campus/san_bernardino)
- Concorde Career College-San Bernardino (Full-time enrollment: 984; Location: 201 East Airport Drive, Suite A; Private, for-profit; Website: www.concorde.edu)
- ITT Technical Institute-San Bernardino (Full-time enrollment: 874; Location: 670 E Carnegie Drive; Private, for-profit; Website: www.itt-tech.edu)
- CET-San Bernardino (Full-time enrollment: 179; Location: 1430 Cooley Court; Private, not-for-profit; Website: cetweb.org)
- Salon Success Academy-San Bernardino (Full-time enrollment: 38; Location: 208 W Highland Ave; Private, for-profit; Website: www.gotobeautyschool.com)
- San Bernardino Community College District (Location: 114 South Del Rosa Drive; Public; Website: www.sbccd.cc.ca.us)
Other colleges/universities with over 2000 students near San Bernardino:
- Loma Linda University (about 6 miles; Loma Linda, CA; Full-time enrollment: 2,839)
- University of Redlands (about 9 miles; Redlands, CA; FT enrollment: 4,854)
- University of California-Riverside (about 11 miles; Riverside, CA; FT enrollment: 20,647)
- Riverside City College (about 13 miles; Riverside, CA; FT enrollment: 10,661)
- Crafton Hills College (about 13 miles; Yucaipa, CA; FT enrollment: 3,222)
- California Baptist University (about 16 miles; Riverside, CA; FT enrollment: 6,085)
- Chaffey College (about 17 miles; Rancho Cucamonga, CA; FT enrollment: 10,496)
Biggest public high schools in San Bernardino:
- SAN GORGONIO HIGH (Students: 2,065, Location: 2299 E. PACIFIC AVE., Grades: 9-12)
- ARROYO VALLEY HIGH (Students: 2,058, Location: 1881 W. BASELINE ST., Grades: 9-12)
- CAJON HIGH (Students: 1,917, Location: 1200 HILL DR., Grades: 9-12)
- SAN BERNARDINO HIGH (Students: 1,561, Location: 1850 N. E ST., Grades: 9-12)
- PACIFIC HIGH (Students: 1,399, Location: 1020 PACIFIC ST., Grades: 9-12)
- CASA RAMONA ACADEMY FOR TECHNOLOGY, COMMUNITY, AND (Students: 281, Location: 1524 W. SEVENTH ST., Grades: KG-12, Charter school)
- PUBLIC SAFETY ACADEMY (Students: 224, Location: 1482 E. ENTERPRISE DR., Grades: 6-12, Charter school)
- ASA CHARTER (Students: 184, Location: 3512 N. E ST., Grades: KG-12, Charter school)
- ANDERSON (Students: 69, Location: 24302 E. FOURTH ST., Grades: KG-12)
- PROVISIONAL ACCELERATED LEARNING ACADEMY (Students: 65, Location: 2450 BLAKE ST., Grades: 9-12, Charter school)
Private high schools in San Bernardino:
- AQUINAS HIGH SCHOOL (Students: 361, Location: 2772 STERLING AVE, Grades: 9-12)
- ODELL YOUNG ALTERNATIVE SCHOOL (Students: 17, Location: 1455 E LYNWOOD DR, Grades: 3-12)
- REGENCY HIGH SCHOOL AT SHANDIN HILLS (Students: 12, Location: 4164 N 4TH AVE, Grades: 9-12)
- MOUNTAINSIDE PRIVATE SCHOOL (Students: 6, Location: 18535 FOOTHILL ST, Grades: 7-11)
Biggest public elementary/middle schools in San Bernardino:
- ARROWVIEW MIDDLE (Students: 1,059, Location: 2299 N. G ST., Grades: 6-8)
- SHANDIN HILLS MIDDLE (Students: 1,055, Location: 4301 LITTLE MOUNTAIN DR., Grades: 6-8)
- GOLDEN VALLEY MIDDLE (Students: 1,049, Location: 3800 WATERMAN AVE., Grades: 6-8)
- CESAR E. CHAVEZ MIDDLE (Students: 974, Location: 6650 N. MAGNOLIA AVE., Grades: 6-8)
- CURTIS MIDDLE (Students: 948, Location: 1050 N. DELROSA DR., Grades: 7-8)
- DEL VALLEJO MIDDLE (Students: 912, Location: 1885 E. LYNWOOD DR., Grades: 6-8)
- MARTIN LUTHER KING JR. MIDDLE (Students: 863, Location: 1250 N. MEDICAL CENTER DR., Grades: 6-8)
- COLONEL JOSEPH C. RODRIGUEZ PREP ACADEMY (Students: 607, Location: 1985 N. GUTHRIE ST., Grades: 4-8)
- RICHARDSON PREP HI (Students: 570, Location: 455 S. K ST., Grades: 6-8)
- DEL ROSA ELEMENTARY (Students: 552, Location: 3395 N. MOUNTAIN AVE., Grades: KG-6)
Private elementary/middle schools in San Bernardino:
- OUR LADY OF THE ASSUMPTION (Students: 238, Location: 796 W 48TH ST, Grades: KG-8)
- HOLY ROSARY ACADEMY (Students: 172, Location: 2620 N ARROWHEAD AVE, Grades: PK-8)
- DEL ROSA CHRISTIAN SCHOOL (Students: 152, Location: 1333 E 39TH ST, Grades: PK-6)
- CLARE CHERRY SCHOOL (Students: 68, Location: 3012 N WATERMAN AVE, Grades: PK-6)
Libraries in San Bernardino:
- SAN BERNARDINO COUNTY LIBRARY (Operating income: $19,178,269; Location: 104 W. FOURTH ST.; 966,878 books; 631 e-books; 48,228 audio materials; 53,848 video materials; 25 local licensed databases; 922 print serial subscriptions)
- SAN BERNARDINO PUBLIC LIBRARY (Operating income: $3,258,345; Location: 555 W. SIXTH ST.; 238,475 books; 4,835 audio materials; 10,324 video materials; 9 local licensed databases; 1 other licensed databases; 478 print serial subscriptions)
User-submitted facts and corrections:
- KRLH is now KTIE effective October 2003
- Other colleges/universities with over 2000 students near San Bernardino: University of California, Riverside (about 13 miles; RIVERSIDE, CA; Full-time enrollment: 17,296)
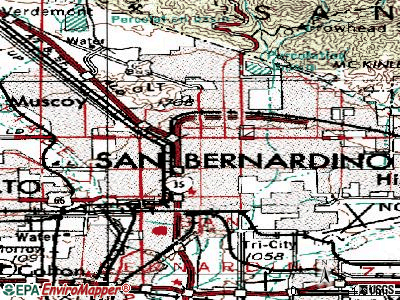
Points of interest:
Notable locations in San Bernardino: San Bernardino City Sewage Treatment Plant (A), Little Mountain Lookout (B), Del Rosa Depot (C), Santa Fe Railroad Yards (D), San Bernardino Public Golf Course (E), San Bernardino Golf Club (F), Twin Creek Spreading Grounds (G), Shandin Hills Golf Course (H), Kendall Curve (I), Arrowhead Springs Station (J), National Orange Show Grounds (K), Arrowhead Country Club (L), University Hall (M), John M Pfau Library (N), Jack H Brown Hall (O), Vanir Tower (P), Mercy Air Service (Q), Patton State Hospital Fire Department (R), San Bernardino City Fire Department Station 230 (S), San Bernardino City Fire Department Station 223 (T). Display/hide their locations on the map
Shopping Centers: Sterling Plaza Shopping Center (1), West Side Plaza Shopping Center (2), Waterman Avenue Shopping Center (3), Second Street Shopping Center (4), Save-A-Minit Shopping Center (5), Central City Mall Shopping Center (6), Wildwood Plaza Shopping Center (7), Westside Shopping Center (8), West Highland Shopping Center (9). Display/hide their locations on the map
Churches in San Bernardino include: Bethel Temple Assembly of God Church (A), Arabic Church of San Bernardino (B), Agape Christian Ministry Church (C), Vineyard Christian Fellowship (D), Vietnamese Evangelical Church (E), Universal Church (F), Twice Called Christian Center (G), Trinity Lutheran Church (H), Trinity Full Gospel Pentecostal Church of God (I). Display/hide their locations on the map
Cemeteries: Indian Cemetery (1), Mountain View Cemetery (2), Home of Eternity Cemetery (3), Campo Santo Cemetery (4), Pioneer Memorial Cemetery (5), Gateway Pet Cemetery (6). Display/hide their locations on the map
Reservoirs: Lynwood Basins (A), Little Mountain Basin (B), Wiggins Percolation Basin (C), West Badger Percolation Basin (D), Waterman Percolation Basins (E), Sweetwater Percolation Basin (F), Sycamore Percolation Basin (G), North Badger Basin (H). Display/hide their locations on the map
Streams, rivers, and creeks: East Twin Creek (A), City Creek (B), Sand Creek (C), San Timoteo Wash (D), Lytle Creek (E). Display/hide their locations on the map
Parks in San Bernardino include: Fourteenth (1), Gateway Park (2), Lytle Creek Park (3), Meadowbrook Park (4), Meadowbrook Recreation Park (5), Perris Hill Park (6), Pioneer Park (7), Plaza Park (8), Sand Hills Park (9). Display/hide their locations on the map
Tourist attractions: Botanica Santa Barbara (Cultural Attractions- Events- & Facilities; 187 East Base Line Street) (1), Deer Park Nudist Resort (Recreation Areas; 1924 Glen Helen Road Ofc) (2), Amf Arrowhead Lanes (Amusement & Theme Parks; 299 West Orange Show Road) (3). Display/hide their approximate locations on the map
Hotels: American Inn (1235 East Rosewood Drive) (1), Best Western Hospitality Lane (294 East Hospitality Lane) (2), American Tex-Chem Corporation (125 East Rialto Avenue) (3), Astro Motel (111 South E St) (4), American Eagle Inn (1551 North Mount Vernon Avenue) (5), Budget Lodge (668 Fairway Drive) (6). Display/hide their approximate locations on the map
Courts: San Bernardino County - Information For Offices Not Listed Below- Superior Co (175 West 5th Street) (1), Courts - County- Juvenile Court (900 East Gilbert Street) (2), San Bernardino County - Information For Offices Not Listed Below- Courts Department- Juvenile C (900 East Gilbert Street) (3), San Bernardino County - Superior & Municipal Court- San Bernardino- General C (351 North Arrowhead Avenue) (4), San Bernardino County - Sheriff Court Services Division- Central Court (351 North Arrowhead Avenue) (5), San Bernardino County - Sheriff Court Services Bureau- Central Divi (157 West 5th Street Floor 3) (6), San Bernardino County - Juvenile Traffic Court (175 West 5th) (7), San Bernardino County - Information- Superior Courts- Juvenile Dependency C (860 East Gilbert Street) (8). Display/hide their approximate locations on the map
Birthplace of: Corey Clark - Idol participant, Claude R. Kirk, Jr. - Soilder, Edith Head - (1907-1981), costumer, Lisa Marie Varon - Professional wrestler, Chris Ault - College football coach, Gene Hackman - (born 1931), actor, Anna Escobedo Cabral - Politician, Dave Stockton - Professional golfer, Jim Leonard (Vivation) - Writer, Margarita Prentice - Politician.
Drinking water stations with addresses in San Bernardino and their reported violations in the past:
PARK MOABI (Population served: 1,000, Groundwater):Past monitoring violations:HANNA FLATS CAMPGROUND (Population served: 500, Groundwater):
- One regular monitoring violation
Past monitoring violations:SHADY COVE (Population served: 100, Groundwater):
- One regular monitoring violation
Past monitoring violations:LUCERNE VALLEY PARKS & RECREATION (Population served: 100, Groundwater):
- One regular monitoring violation
Past health violations:CAMP WATERMAN MWC (Population served: 55, Groundwater):Past monitoring violations:
- MCL, Monthly (TCR) - In OCT-2005, Contaminant: Coliform. Follow-up actions: St Compliance achieved (2 times from NOV-03-2005 to MAY-20-2010)
- One routine major monitoring violation
Past health violations:
- MCL, Acute (TCR) - In JUN-2013, Contaminant: Coliform
Drinking water stations with addresses in San Bernardino that have no violations reported:
- GREEN VALLEY CAMPGROUND (Population served: 10,000, Primary Water Source Type: Groundwater)
- RASOR ROAD SERVICE (Address: 2nd Floor , Population served: 1,000, Primary Water Source Type: )
- DESERT STAR RANCH (Address: 2nd Floor , Population served: 500, Primary Water Source Type: Groundwater)
- JOHNSON VALLEY COMMUNITY CENTER (Address: 2nd Floor , Population served: 100, Primary Water Source Type: Groundwater)
- HINKLEY SENIOR REC CENTER (Population served: 100, Primary Water Source Type: Groundwater)
- THAT CREATIVE CAFE (Address: 2nd Floor , Population served: 100, Primary Water Source Type: Groundwater)
- DEMPSEYS PUB (Address: 2nd Floor , Population served: 100, Primary Water Source Type: Groundwater)
- PINE RIDGE TREATMENT CENTER (Address: 2nd Floor , Population served: 25, Primary Water Source Type: Groundwater)
- MOJAVE RIVER FORKS REGIONAL PARK (Population served: 25, Primary Water Source Type: Groundwater)
- FENDERS (Address: 2nd Floor , Population served: 25, Primary Water Source Type: Groundwater)
| This city: | 3.4 people |
| California: | 2.9 people |
| This city: | 75.1% |
| Whole state: | 68.7% |
| This city: | 9.6% |
| Whole state: | 7.2% |
Likely homosexual households (counted as self-reported same-sex unmarried-partner households)
- Lesbian couples: 0.5% of all households
- Gay men: 0.3% of all households
People in group quarters in San Bernardino in 2010:
- 1,659 people in local jails and other municipal confinement facilities
- 1,506 people in mental (psychiatric) hospitals and psychiatric units in other hospitals
- 1,087 people in college/university student housing
- 878 people in nursing facilities/skilled-nursing facilities
- 870 people in other noninstitutional facilities
- 559 people in group homes intended for adults
- 229 people in residential treatment centers for adults
- 187 people in correctional facilities intended for juveniles
- 181 people in workers' group living quarters and job corps centers
- 152 people in emergency and transitional shelters (with sleeping facilities) for people experiencing homelessness
- 11 people in group homes for juveniles (non-correctional)
- 6 people in residential treatment centers for juveniles (non-correctional)
People in group quarters in San Bernardino in 2000:
- 1,250 people in state prisons
- 908 people in local jails and other confinement facilities (including police lockups)
- 671 people in other noninstitutional group quarters
- 664 people in nursing homes
- 615 people in training schools for juvenile delinquents
- 411 people in college dormitories (includes college quarters off campus)
- 391 people in homes for the mentally retarded
- 226 people in homes or halfway houses for drug/alcohol abuse
- 166 people in other group homes
- 154 people in mental (psychiatric) hospitals or wards
- 85 people in homes for the mentally ill
- 66 people in hospitals/wards and hospices for chronically ill
- 66 people in other hospitals or wards for chronically ill
- 61 people in unknown juvenile institutions
- 59 people in job corps and vocational training facilities
- 51 people in other nonhousehold living situations
- 41 people in halfway houses
- 18 people in religious group quarters
- 6 people in homes for abused, dependent, and neglected children
- 4 people in homes for the physically handicapped
- 2 people in other workers' dormitories
Banks with branches in San Bernardino (2011 data):
- Bank of America, National Association: Sierra Way-40th Branch, Sterling-Highland Branch, Highland-Wall Branch, San Bernardino Main Branch. Info updated 2009/11/18: Bank assets: $1,451,969.3 mil, Deposits: $1,077,176.8 mil, headquarters in Charlotte, NC, positive income, 5782 total offices, Holding Company: Bank Of America Corporation
- JPMorgan Chase Bank, National Association: Kendall & Shandin Hills Banking Cent, 2020 E. Highland Ave Branch, San Bernardino Branch, North D Street Branch. Info updated 2011/11/10: Bank assets: $1,811,678.0 mil, Deposits: $1,190,738.0 mil, headquarters in Columbus, OH, positive income, International Specialization, 5577 total offices, Holding Company: Jpmorgan Chase & Co.
- Wells Fargo Bank, National Association: Highland Arrowhead Branch, Highland And Del Rosa, San Bernardino Branch. Info updated 2011/04/05: Bank assets: $1,161,490.0 mil, Deposits: $905,653.0 mil, headquarters in Sioux Falls, SD, positive income, 6395 total offices, Holding Company: Wells Fargo & Company
- Citizens Business Bank: San Bernardino Branch at 1555 East Highland Avenue, branch established on 1981/02/02; Tri City Branch at 301 Vanderbilt Way, branch established on 1990/09/10. Info updated 2011/03/30: Bank assets: $6,475.4 mil, Deposits: $4,625.6 mil, headquarters in Ontario, CA, positive income, Commercial Lending Specialization, 46 total offices, Holding Company: Cvb Financial Corp.
- Union Bank, National Association: San Bernardino Branch at 505 W 2nd St, branch established on 1984/04/02; Waterman & Highland Branch at 290 E Highland Ave, branch established on 1929/01/01. Info updated 2011/09/01: Bank assets: $88,967.5 mil, Deposits: $65,286.4 mil, headquarters in San Francisco, CA, positive income, Commercial Lending Specialization, 403 total offices, Holding Company: Mitsubishi Ufj Financial Group, Inc.
- Security Bank of California: San Bernardino Branch at 306 West Second Street, Suite 100, branch established on 2007/07/16. Info updated 2012/02/15: Bank assets: $412.0 mil, Deposits: $359.6 mil, headquarters in Riverside, CA, positive income, Commercial Lending Specialization, 4 total offices, Holding Company: Security California Bancorp
- U.S. Bank National Association: San Bernardino Ralphs Branch at 4444 University Parkway, branch established on 1996/10/24. Info updated 2012/01/30: Bank assets: $330,470.8 mil, Deposits: $236,091.5 mil, headquarters in Cincinnati, OH, positive income, 3121 total offices, Holding Company: U.S. Bancorp
- Pacific Premier Bank: San Bernardino Branch at 1598 E. Highland Avenue, branch established on 1983/08/05. Info updated 2011/02/14: Bank assets: $956.6 mil, Deposits: $832.2 mil, headquarters in Costa Mesa, CA, positive income, Commercial Lending Specialization, 9 total offices, Holding Company: Pacific Premier Bancorp, Inc.
For population 15 years and over in San Bernardino:
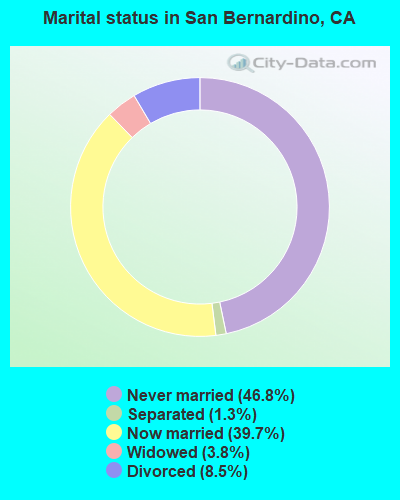
- Never married: 46.8%
- Now married: 39.7%
- Separated: 1.3%
- Widowed: 3.8%
- Divorced: 8.5%
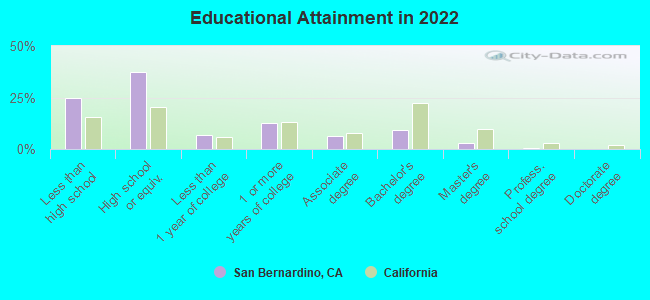
For population 25 years and over in San Bernardino:
- High school or higher: 75.3%
- Bachelor's degree or higher: 12.8%
- Graduate or professional degree: 3.3%
- Unemployed: 11.4%
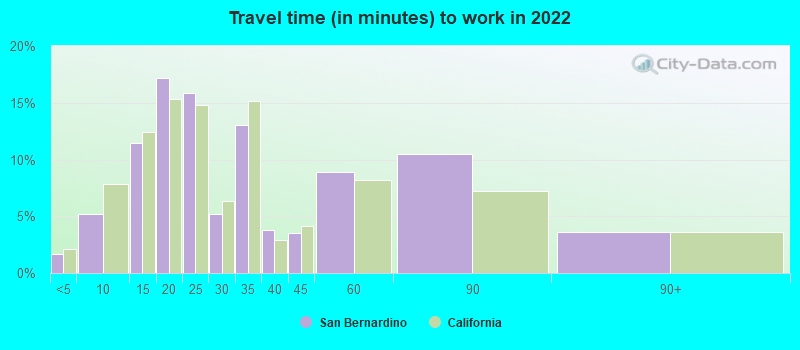
- Mean travel time to work (commute): 26.6 minutes
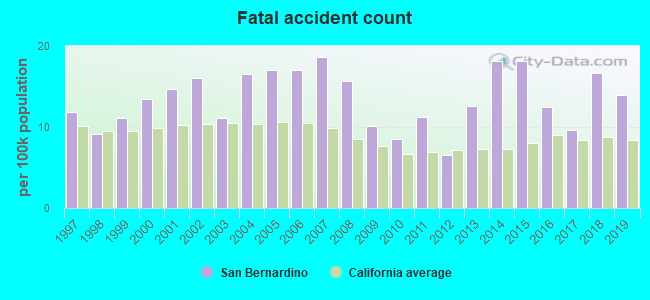
| Here: | 15.3 |
| California average: | 15.5 |
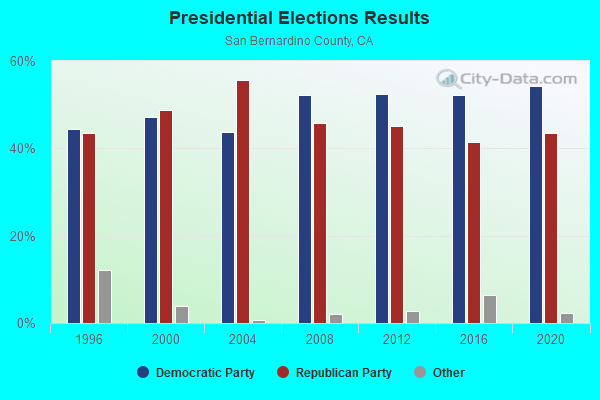
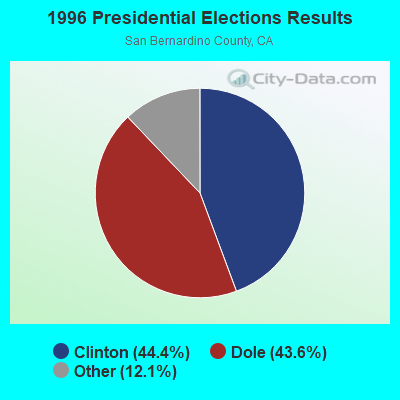
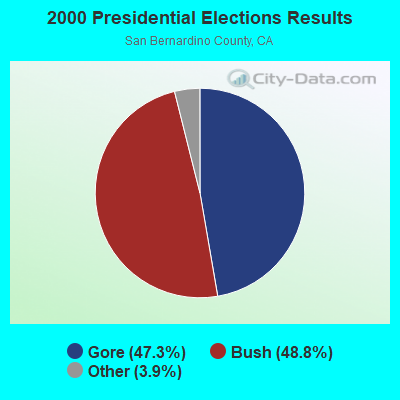
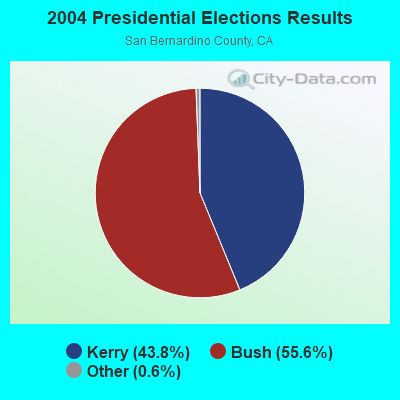
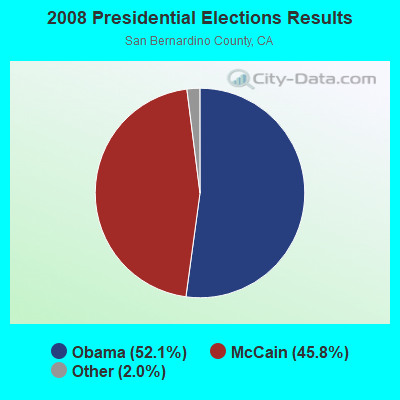
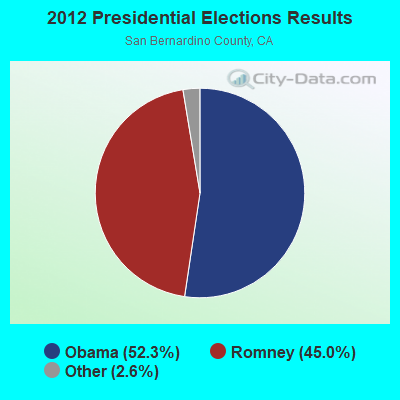
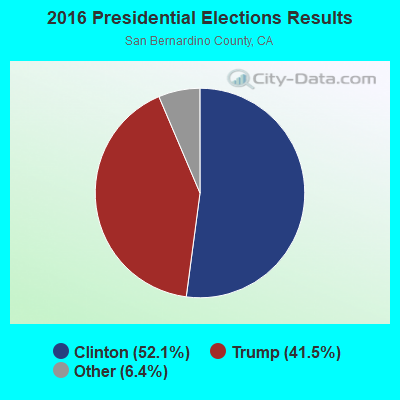
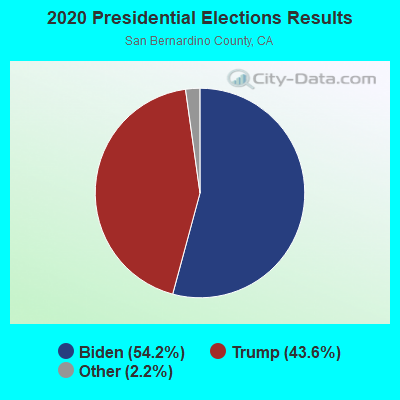
Graphs represent county-level data. Detailed 2008 Election Results
Political contributions by individuals in San Bernardino, CA
Neighborhoods in San Bernardino:
(San Bernardino, California Neighborhood Map)- Del Rosa neighborhood
- Delmann Heights neighborhood
- Devore neighborhood
- Garden Park neighborhood
- Muscoy neighborhood
- North Loma Linda neighborhood
- North Norton neighborhood
- Northpark neighborhood
- Rana neighborhood
- Rialto Bench (The Bench) neighborhood
- University Heights neighborhood
- Valencia neighborhood
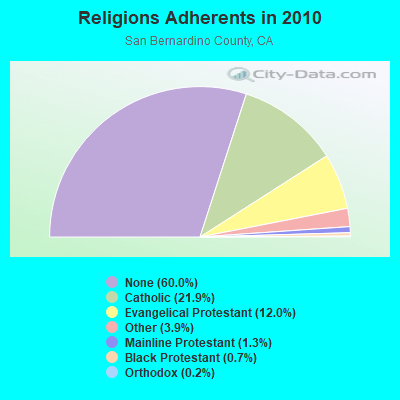
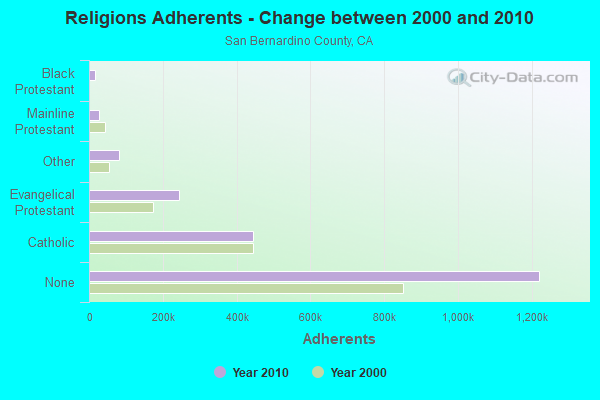
Religion statistics for San Bernardino, CA (based on San Bernardino County data)
| Religion | Adherents | Congregations |
|---|---|---|
| Catholic | 445,334 | 55 |
| Evangelical Protestant | 243,524 | 832 |
| Other | 80,047 | 205 |
| Mainline Protestant | 26,062 | 135 |
| Black Protestant | 14,969 | 37 |
| Orthodox | 3,868 | 10 |
| None | 1,221,406 | - |
Food Environment Statistics:
| This county: | 1.50 / 10,000 pop. |
| State: | 2.14 / 10,000 pop. |
| San Bernardino County: | 0.05 / 10,000 pop. |
| State: | 0.04 / 10,000 pop. |
| San Bernardino County: | 0.57 / 10,000 pop. |
| State: | 0.62 / 10,000 pop. |
| Here: | 1.60 / 10,000 pop. |
| State: | 1.49 / 10,000 pop. |
| San Bernardino County: | 4.69 / 10,000 pop. |
| California: | 7.42 / 10,000 pop. |
| San Bernardino County: | 7.4% |
| California: | 7.3% |
| San Bernardino County: | 27.1% |
| California: | 21.3% |
| This county: | 16.2% |
| State: | 17.9% |
Health and Nutrition:
| San Bernardino: | 46.7% |
| California: | 49.4% |
| Here: | 45.6% |
| California: | 48.0% |
| This city: | 28.7 |
| State: | 28.1 |
| This city: | 22.2% |
| California: | 20.2% |
| San Bernardino: | 11.3% |
| California: | 11.2% |
| San Bernardino: | 6.7 |
| State: | 6.8 |
| This city: | 32.1% |
| State: | 31.5% |
| Here: | 54.2% |
| California: | 56.4% |
| This city: | 81.3% |
| California: | 80.9% |
More about Health and Nutrition of San Bernardino, CA Residents
| Local government employment and payroll (March 2022) | |||||
| Function | Full-time employees | Monthly full-time payroll | Average yearly full-time wage | Part-time employees | Monthly part-time payroll |
|---|---|---|---|---|---|
| Police Protection - Officers | 262 | $2,945,968 | $134,930 | 0 | $0 |
| Water Supply | 248 | $1,850,172 | $89,524 | 4 | $3,454 |
| Other and Unallocable | 145 | $696,922 | $57,676 | 62 | $97,581 |
| Police - Other | 106 | $525,251 | $59,462 | 14 | $35,473 |
| Other Government Administration | 63 | $454,989 | $86,665 | 15 | $20,119 |
| Financial Administration | 39 | $133,041 | $40,936 | 1 | $2,119 |
| Housing and Community Development (Local) | 33 | $211,484 | $76,903 | 0 | $0 |
| Parks and Recreation | 31 | $173,314 | $67,089 | 33 | $53,203 |
| Health | 22 | $198,595 | $108,325 | 1 | $1,497 |
| Solid Waste Management | 19 | $136,141 | $85,984 | 6 | $15,037 |
| Local Libraries | 15 | $82,066 | $65,653 | 27 | $37,255 |
| Streets and Highways | 2 | $9,183 | $55,098 | 0 | $0 |
| Judicial and Legal | 1 | $5,952 | $71,424 | 0 | $0 |
| Totals for Government | 986 | $7,423,078 | $90,342 | 163 | $265,739 |
San Bernardino government finances - Expenditure in 2021 (per resident):
- Construction - Regular Highways: $12,302,000 ($55.83)
General - Other: $2,514,000 ($11.41)
Parks and Recreation: $1,837,000 ($8.34)
- Current Operations - Police Protection: $85,402,000 ($387.61)
Central Staff Services: $36,837,000 ($167.19)
Water Utilities: $34,642,000 ($157.23)
Sewerage: $30,568,000 ($138.74)
Regular Highways: $28,668,000 ($130.12)
Parks and Recreation: $8,617,000 ($39.11)
Financial Administration: $4,097,000 ($18.60)
Judicial and Legal Services: $3,633,000 ($16.49)
Protective Inspection and Regulation - Other: $3,194,000 ($14.50)
Housing and Community Development: $2,842,000 ($12.90)
Health - Other: $2,702,000 ($12.26)
Libraries: $1,887,000 ($8.56)
Solid Waste Management: $578,000 ($2.62)
Miscellaneous Commercial Activities - Other: $194,000 ($0.88)
General - Other: $2,000 ($0.01)
- General - Interest on Debt: $4,377,000 ($19.87)
- Other Capital Outlay - General - Other: $4,864,000 ($22.08)
Parks and Recreation: $89,000 ($0.40)
- Water Utilities - Interest on Debt: $1,926,000 ($8.74)
San Bernardino government finances - Revenue in 2021 (per resident):
- Charges - Sewerage: $40,898,000 ($185.62)
Other: $8,956,000 ($40.65)
Solid Waste Management: $1,229,000 ($5.58)
Housing and Community Development: $571,000 ($2.59)
Parks and Recreation: $305,000 ($1.38)
Miscellaneous Commercial Activities: $32,000 ($0.15)
- Federal Intergovernmental - Other: $11,107,000 ($50.41)
Housing and Community Development: $1,677,000 ($7.61)
- Local Intergovernmental - Other: $2,760,000 ($12.53)
- Miscellaneous - General Revenue - Other: $32,933,000 ($149.47)
Special Assessments: $2,503,000 ($11.36)
Interest Earnings: $1,725,000 ($7.83)
Fines and Forfeits: $1,624,000 ($7.37)
Rents: $1,129,000 ($5.12)
Donations From Private Sources: $1,120,000 ($5.08)
Sale of Property: $188,000 ($0.85)
- Revenue - Water Utilities: $46,619,000 ($211.59)
- State Intergovernmental - Other: $11,539,000 ($52.37)
Highways: $6,798,000 ($30.85)
Water Utilities: $2,011,000 ($9.13)
- Tax - Other: $47,312,000 ($214.73)
Public Utilities Sales: $37,366,000 ($169.59)
General Sales and Gross Receipts: $26,334,000 ($119.52)
Property: $18,482,000 ($83.88)
Occupation and Business License - Other: $8,084,000 ($36.69)
Other License: $5,665,000 ($25.71)
Other Selective Sales: $5,117,000 ($23.22)
Documentary and Stock Transfer: $998,000 ($4.53)
San Bernardino government finances - Debt in 2021 (per resident):
- Long Term Debt - Beginning Outstanding - Unspecified Public Purpose: $116,001,000 ($526.49)
Outstanding Unspecified Public Purpose: $108,319,000 ($491.63)
Retired Unspecified Public Purpose: $27,532,000 ($124.96)
Issue, Unspecified Public Purpose: $19,850,000 ($90.09)
Beginning Outstanding - Public Debt for Private Purpose: $2,570,000 ($11.66)
Outstanding Nonguaranteed - Industrial Revenue: $2,570,000 ($11.66)
San Bernardino government finances - Cash and Securities in 2021 (per resident):
- Bond Funds - Cash and Securities: $38,808,000 ($176.14)
- Other Funds - Cash and Securities: $207,397,000 ($941.31)
- Sinking Funds - Cash and Securities: $26,443,000 ($120.02)
6.45% of this county's 2021 resident taxpayers lived in other counties in 2020 ($54,954 average adjusted gross income)
| Here: | 6.45% |
| California average: | 5.19% |
0.03% of residents moved from foreign countries ($259 average AGI)
San Bernardino County: 0.03% California average: 0.03%
Top counties from which taxpayers relocated into this county between 2020 and 2021:
| from Los Angeles County, CA | |
| from Riverside County, CA | |
| from Orange County, CA |
6.46% of this county's 2020 resident taxpayers moved to other counties in 2021 ($59,647 average adjusted gross income)
| Here: | 6.46% |
| California average: | 6.14% |
0.03% of residents moved to foreign countries ($253 average AGI)
San Bernardino County: 0.03% California average: 0.02%
Top counties to which taxpayers relocated from this county between 2020 and 2021:
| to Riverside County, CA | |
| to Los Angeles County, CA | |
| to Orange County, CA |
| Businesses in San Bernardino, CA | ||||
| Name | Count | Name | Count | |
|---|---|---|---|---|
| 24 Hour Fitness | 1 | Little Caesars Pizza | 4 | |
| 7-Eleven | 8 | Long John Silver's | 1 | |
| 99 Cents Only Stores | 3 | Macy's | 1 | |
| ALDO | 1 | Marriott | 1 | |
| AMF Bowling | 1 | Marshalls | 1 | |
| AT&T | 3 | MasterBrand Cabinets | 2 | |
| Ace Hardware | 1 | McDonald's | 8 | |
| American Eagle Outfitters | 1 | Men's Wearhouse | 1 | |
| Arby's | 1 | Motel 6 | 2 | |
| AutoZone | 7 | Motherhood Maternity | 2 | |
| Baja Fresh Mexican Grill | 1 | New Balance | 1 | |
| Bally Total Fitness | 1 | Nike | 6 | |
| Baskin-Robbins | 3 | Nissan | 1 | |
| Bath & Body Works | 1 | Office Depot | 1 | |
| Best Western | 1 | OfficeMax | 1 | |
| Blockbuster | 1 | Olive Garden | 1 | |
| Burger King | 8 | Outback | 1 | |
| CVS | 3 | Outback Steakhouse | 1 | |
| Carl\s Jr. | 4 | Pac Sun | 1 | |
| Casual Male XL | 1 | Panda Express | 2 | |
| Charlotte Russe | 1 | Panera Bread | 1 | |
| Chevrolet | 1 | Papa John's Pizza | 2 | |
| Chipotle | 1 | Payless | 4 | |
| Chuck E. Cheese's | 2 | Penske | 2 | |
| Church's Chicken | 1 | PetSmart | 1 | |
| Circle K | 5 | Pizza Hut | 4 | |
| Cold Stone Creamery | 1 | Popeyes | 1 | |
| Costco | 1 | Quiznos | 1 | |
| Curves | 1 | RadioShack | 3 | |
| Dairy Queen | 1 | Red Lobster | 1 | |
| Days Inn | 3 | Rite Aid | 2 | |
| Decora Cabinetry | 1 | Rodeway Inn | 1 | |
| Dennys | 5 | SAS Shoes | 1 | |
| Domino's Pizza | 4 | Sam's Club | 1 | |
| El Pollo Loco | 5 | Spencer Gifts | 1 | |
| FedEx | 14 | Sprint Nextel | 1 | |
| Firestone Complete Auto Care | 2 | Staples | 2 | |
| Foot Locker | 1 | Starbucks | 7 | |
| Forever 21 | 1 | Subaru | 1 | |
| Fredericks Of Hollywood | 1 | Subway | 14 | |
| GNC | 3 | Super 8 | 1 | |
| GameStop | 2 | T-Mobile | 9 | |
| H&R Block | 6 | T.G.I. Driday's | 1 | |
| Hilton | 2 | Taco Bell | 4 | |
| Hollister Co. | 1 | Target | 2 | |
| Home Depot | 2 | The Room Place | 1 | |
| Hot Topic | 1 | Torrid | 1 | |
| IHOP | 2 | Toyota | 1 | |
| Jamba Juice | 1 | Travelodge | 1 | |
| Jones New York | 3 | U-Haul | 9 | |
| Journeys | 1 | UPS | 15 | |
| KFC | 4 | Vans | 4 | |
| Kincaid | 1 | Verizon Wireless | 2 | |
| Knights Inn | 1 | Victoria's Secret | 1 | |
| Kroger | 2 | Volkswagen | 1 | |
| LA Fitness | 1 | Walgreens | 4 | |
| La Quinta | 1 | Walmart | 1 | |
| La-Z-Boy | 1 | Wet Seal | 1 | |
| Lane Bryant | 1 | YMCA | 1 | |
| Lane Furniture | 4 | |||
Strongest AM radio stations in San Bernardino:
- KTDD (1350 AM; 5 kW; SAN BERNARDINO, CA)
- KKDD (1290 AM; 5 kW; SAN BERNARDINO, CA; Owner: AMFM RADIO LICENSES, L.L.C.)
- KRLH (590 AM; 2 kW; SAN BERNARDINO, CA; Owner: CARON BROADCASTING, INC.)
- KPLS (830 AM; 50 kW; ORANGE, CA; Owner: CRN LICENSES, LLC)
- KCAL (1410 AM; 5 kW; REDLANDS, CA; Owner: LAZER BROADCASTING CORPORATION)
- KEZY (1240 AM; 1 kW; SAN BERNARDINO, CA; Owner: HI-FAVOR BROADCASTING, LLC)
- KHPY (1670 AM; 10 kW; MORENO VALLEY, CA; Owner: DELBERT L. VAN VOORHIS)
- KLAC (570 AM; 50 kW; LOS ANGELES, CA; Owner: AMFM RADIO LICENSES, L.L.C.)
- KFI (640 AM; 50 kW; LOS ANGELES, CA; Owner: CAPSTAR TX LIMITED PARTNERSHIP)
- KTNQ (1020 AM; 50 kW; LOS ANGELES, CA; Owner: KTNQ-AM LICENSE CORP.)
- KDIS (1110 AM; 50 kW; PASADENA, CA; Owner: ABC,INC.)
- KXTA (1150 AM; 50 kW; LOS ANGELES, CA; Owner: CITICASTERS LICENSES, L.P.)
- KSPA (1510 AM; 10 kW; ONTARIO, CA; Owner: ONTARIO BROADCASTING, LLC)
Strongest FM radio stations in San Bernardino:
- KUOR-FM (89.1 FM; REDLANDS, CA; Owner: UNIVERSITY OF REDLANDS)
- K295AI (106.9 FM; MUSCOY, CA; Owner: ASSOCIATION FOR COMMUNITY EDUCATION, INC.)
- KCXX (103.9 FM; LAKE ARROWHEAD, CA; Owner: ALL-PRO BROADCASTING, INC.)
- KGGI (99.1 FM; RIVERSIDE, CA; Owner: AMFM RADIO LICENSES, L.L.C.)
- KLYY (97.5 FM; RIVERSIDE, CA; Owner: ENTRAVISION HOLDINGS, LLC)
- K201CD (88.1 FM; VICTORVILLE, CA; Owner: SAN BERNARDINO COMMNTY COLLEGE DIST.)
- KOLA (99.9 FM; SAN BERNARDINO, CA; Owner: INLAND EMPIRE BROADCASTING CORP.)
- KLRD (90.1 FM; YUCAIPA, CA; Owner: EDUCATIONAL MEDIA FOUNDATION)
- KUCR (88.3 FM; RIVERSIDE, CA; Owner: THE REGENTS OF THE UNIV. OF CA)
- KVCR (91.9 FM; SAN BERNARDINO, CA; Owner: SAN BERNARDINO COMMUNITY COLLEGE DISTRICT)
- KFRG (95.1 FM; SAN BERNARDINO, CA; Owner: INFINITY RADIO OPERATIONS INC.)
- KCAL-FM (96.7 FM; REDLANDS, CA; Owner: SBR BROADCASTING CORPORATION)
- KSGN (89.7 FM; RIVERSIDE, CA; Owner: KSGN, INC.)
- K264AF (100.7 FM; GUASTI, CA; Owner: EDUCATIONAL MEDIA FOUNDATION)
- K201AR (88.1 FM; BANNING, CA; Owner: KSGN, INC.)
- K232CX (94.3 FM; DESERT HOT SPRINGS, CA; Owner: MCC RADIO, LLC)
- KCBS-FM (93.1 FM; LOS ANGELES, CA; Owner: INFINITY BROADCASTING OPERATIONS, INC.)
- KWVE (107.9 FM; SAN CLEMENTE, CA; Owner: CALVARY CHAPEL OF COSTA MESA)
- KSCA (101.9 FM; GLENDALE, CA; Owner: HBC LICENSE CORPORATION)
- KLOS (95.5 FM; LOS ANGELES, CA; Owner: KLOS-FM RADIO, INC.)
TV broadcast stations around San Bernardino:
- KHIZ (Channel 64; BARSTOW, CA; Owner: SUNBELT TELEVISION, INC.)
- KTRO-LP (Channel 50; LANCASTER, CA; Owner: ROBERT D. ADELMAN)
- KVCR-TV (Channel 24; SAN BERNARDINO, CA; Owner: SAN BERNARDINO COMMUNITY COLLEGE DISTRICT)
- KSGA-LP (Channel 59; SANTA BARBARA, CA; Owner: KJLA, LLC)
- KBLM-LP (Channel 25; RIVERSIDE/PERRIS, CA; Owner: LOUIS MARTINEZ FAMILY GROUP, LLC)
- KTBN1 (Channel 40; LAKE ARROWHEAD, CA; Owner: TRINITY BROADCASTING NETWORK)
Medal of Honor Recipients
Medal of Honor Recipients born in San Bernardino: Bernard Francis Fisher, Clarence B. Craft, Joseph C. Rodriguez.
- National Bridge Inventory (NBI) Statistics
- 339Number of bridges
- 5,141ft / 1,567mTotal length
- $23,924,000Total costs
- 11,722,332Total average daily traffic
- 875,180Total average daily truck traffic

- New bridges - historical statistics
- 21930-1939
- 111940-1949
- 311950-1959
- 931960-1969
- 341970-1979
- 341980-1989
- 281990-1999
- 272000-2009
- 792010-2019
FCC Registered Antenna Towers: 576 (See the full list of FCC Registered Antenna Towers)
FCC Registered Commercial Land Mobile Towers: 6 (See the full list of FCC Registered Commercial Land Mobile Towers in San Bernardino, CA)
FCC Registered Private Land Mobile Towers: 6 (See the full list of FCC Registered Private Land Mobile Towers)
FCC Registered Broadcast Land Mobile Towers: 192 (See the full list of FCC Registered Broadcast Land Mobile Towers)
FCC Registered Microwave Towers: 254 (See the full list of FCC Registered Microwave Towers in this town)
FCC Registered Paging Towers: 10 (See the full list of FCC Registered Paging Towers)
FCC Registered Maritime Coast & Aviation Ground Towers: 20 (See the full list of FCC Registered Maritime Coast & Aviation Ground Towers)
FCC Registered Amateur Radio Licenses: 718 (See the full list of FCC Registered Amateur Radio Licenses in San Bernardino)
FAA Registered Aircraft Manufacturers and Dealers: 3 (See the full list of FAA Registered Manufacturers and Dealers in San Bernardino)
FAA Registered Aircraft: 80 (See the full list of FAA Registered Aircraft)
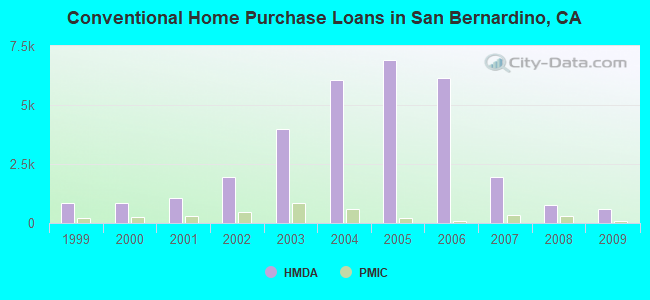
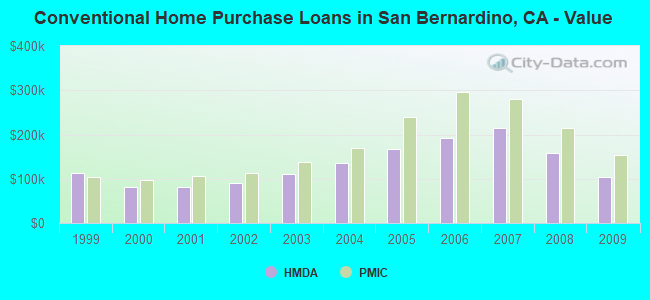
| Home Mortgage Disclosure Act Aggregated Statistics For Year 2009 (Based on 29 full and 17 partial tracts) | ||||||||||||||
| A) FHA, FSA/RHS & VA Home Purchase Loans | B) Conventional Home Purchase Loans | C) Refinancings | D) Home Improvement Loans | E) Loans on Dwellings For 5+ Families | F) Non-occupant Loans on < 5 Family Dwellings (A B C & D) | G) Loans On Manufactured Home Dwelling (A B C & D) | ||||||||
|---|---|---|---|---|---|---|---|---|---|---|---|---|---|---|
| Number | Average Value | Number | Average Value | Number | Average Value | Number | Average Value | Number | Average Value | Number | Average Value | Number | Average Value | |
| LOANS ORIGINATED | 1,258 | $145,638 | 605 | $103,547 | 765 | $167,657 | 53 | $74,125 | 7 | $632,819 | 362 | $84,463 | 21 | $46,448 |
| APPLICATIONS APPROVED, NOT ACCEPTED | 126 | $135,781 | 117 | $129,707 | 156 | $163,194 | 11 | $37,553 | 1 | $6,893,000 | 59 | $123,994 | 20 | $62,993 |
| APPLICATIONS DENIED | 331 | $139,219 | 285 | $127,900 | 671 | $172,836 | 109 | $55,865 | 5 | $4,576,904 | 210 | $115,795 | 23 | $59,358 |
| APPLICATIONS WITHDRAWN | 242 | $141,149 | 171 | $129,302 | 329 | $177,995 | 26 | $55,894 | 1 | $625,000 | 113 | $109,420 | 1 | $155,680 |
| FILES CLOSED FOR INCOMPLETENESS | 66 | $152,922 | 43 | $148,289 | 103 | $179,939 | 8 | $67,081 | 2 | $1,152,500 | 22 | $122,380 | 1 | $73,000 |
Detailed mortgage data for all 47 tracts in San Bernardino, CA
| Private Mortgage Insurance Companies Aggregated Statistics For Year 2009 (Based on 24 full and 16 partial tracts) | ||||
| A) Conventional Home Purchase Loans | B) Refinancings | |||
|---|---|---|---|---|
| Number | Average Value | Number | Average Value | |
| LOANS ORIGINATED | 69 | $154,167 | 9 | $155,499 |
| APPLICATIONS APPROVED, NOT ACCEPTED | 67 | $215,996 | 11 | $244,082 |
| APPLICATIONS DENIED | 15 | $166,845 | 4 | $160,270 |
| APPLICATIONS WITHDRAWN | 8 | $170,891 | 2 | $150,000 |
| FILES CLOSED FOR INCOMPLETENESS | 6 | $196,202 | 2 | $313,870 |
2005 - 2018 National Fire Incident Reporting System (NFIRS) incidents
- Fire incident types reported to NFIRS in San Bernardino, CA
- 85952.3%Outside Fires
- 47528.9%Structure Fires
- 22713.8%Mobile Property/Vehicle Fires
- 804.9%Other
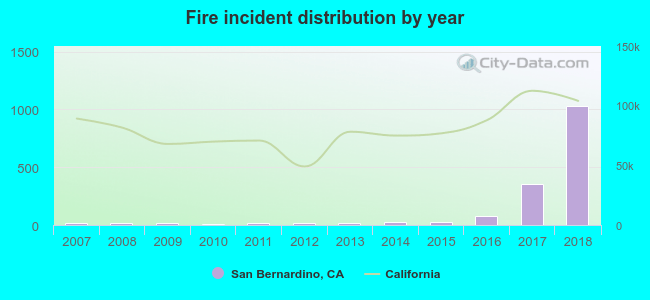 According to the data from the years 2005 - 2018 the average number of fire incidents per year is 135. The highest number of fires - 1,032 took place in 2018, and the least - 5 in 2010. The data has a rising trend.
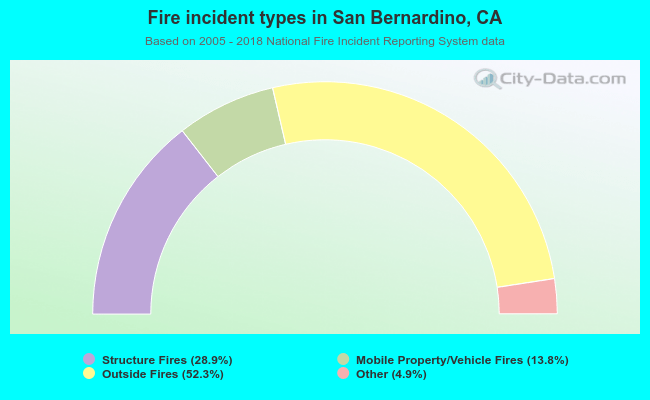 When looking into fire subcategories, the most reports belonged to: Outside Fires (52.3%), and Structure Fires (28.9%).
Fire-safe hotels and motels in San Bernardino, California:
- Days Inn, 1909 S Business Ctr Dr, San Bernardino, California 92408 , Phone: (909) 889-0090, Fax: (909) 889-9894
- Valley Motel, 1640 N MT Vernon Ave, San Bernardino, California 92411 , Phone: (909) 887-4258
- Days Inn, 2000 Ostrems Way, San Bernardino, California 92407 , Phone: (909) 880-8425, Fax: (909) 880-8295
- Quality Inn, 1750 S Waterman Ave, San Bernardino, California 92408 , Phone: (909) 888-4827, Fax: (909) 888-8617
- Doubletree by Hilton San Bernardino, 285 E Hospitality Ln, San Bernardino, California 92408 , Phone: (909) 889-0133, Fax: (909) 381-4299
- Clarion Hotel & Conference Center, 295 N E St, San Bernardino, California 92401 , Phone: (909) 381-6181, Fax: (909) 381-5288
- SureStay Plus Hotel San Bernardino South, 294 E Hospitality Ln, San Bernardino, California 92408 , Phone: (909) 381-1681, Fax: (909) 885-5120
- Econolodge San Bernardino, 450 N G St, San Bernardino, California 92410 , Phone: (909) 885-0055, Fax: (909) 889-0899
- 10 other hotels and motels
| Most common first names in San Bernardino, CA among deceased individuals | ||
| Name | Count | Lived (average) |
|---|---|---|
| John | 1,029 | 73.2 years |
| Mary | 921 | 78.0 years |
| William | 832 | 73.6 years |
| James | 766 | 70.1 years |
| Robert | 748 | 68.5 years |
| George | 539 | 74.7 years |
| Charles | 533 | 72.8 years |
| Frank | 391 | 75.0 years |
| Helen | 389 | 79.2 years |
| Dorothy | 385 | 75.7 years |
| Most common last names in San Bernardino, CA among deceased individuals | ||
| Last name | Count | Lived (average) |
|---|---|---|
| Smith | 438 | 73.6 years |
| Johnson | 367 | 74.2 years |
| Williams | 296 | 71.4 years |
| Jones | 276 | 71.0 years |
| Brown | 245 | 72.3 years |
| Miller | 237 | 72.9 years |
| Davis | 230 | 74.3 years |
| Garcia | 185 | 69.8 years |
| Anderson | 173 | 73.6 years |
| Wilson | 170 | 73.0 years |
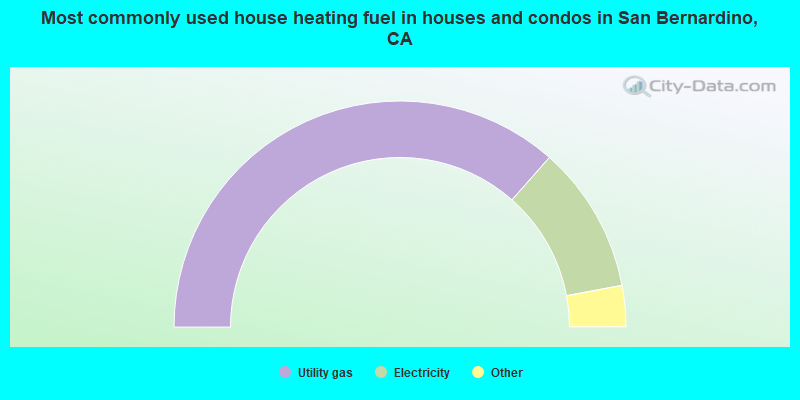
- 73.0%Utility gas
- 21.1%Electricity
- 2.3%No fuel used
- 1.7%Solar energy
- 1.1%Bottled, tank, or LP gas
- 0.5%Wood
- 0.3%Fuel oil, kerosene, etc.
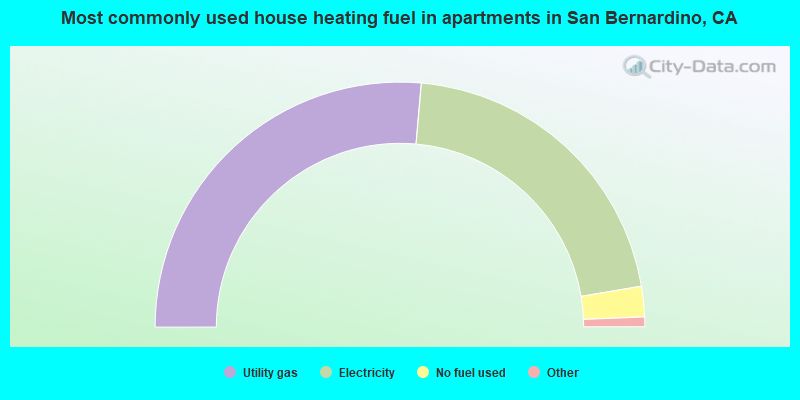
- 52.8%Utility gas
- 41.9%Electricity
- 4.0%No fuel used
- 0.9%Bottled, tank, or LP gas
- 0.2%Fuel oil, kerosene, etc.
- 0.1%Wood
San Bernardino compared to California state average:
- Median house value below state average.
- Black race population percentage above state average.
- Hispanic race population percentage above state average.
- Percentage of population with a bachelor's degree or higher below state average.
San Bernardino, CA compared to other similar cities:
San Bernardino on our top lists:
- #7 on the list of "Top 101 cities with the highest number of auto thefts per 100,000 residents, excludes tourist destinations and others with a lot of outsiders visiting based on city industries data (population 50,000+)"
- #18 on the list of "Top 101 cities with the largest city-data.com crime index per police officer (population 50,000+)"
- #22 on the list of "Top 101 cities with the highest number of murders per 100,000 residents, excludes tourist destinations and others with a lot of outsiders visiting based on city industries data (population 50,000+)"
- #25 on the list of "Top 101 cities with the largest city-data.com crime index increase from 2011 to 2012 (population 50,000+)"
- #27 on the list of "Top 100 least-educated cities (pop. 50,000+)"
- #32 on the list of "Top 101 cities with largest percentage of females in occupations: personal care and service occupations (population 50,000+)"
- #32 on the list of "Top 101 cities with the highest ratio of murders to rapes between 2002 and 2012 (population 50,000+)"
- #34 on the list of "Top 101 cities with largest percentage of females in occupations: farming, fishing, and forestry occupations (population 50,000+)"
- #41 on the list of "Top 101 cities with largest percentage of males in occupations: material moving occupations (population 50,000+)"
- #42 on the list of "Top 101 cities with the least people having Master's or Doctorate degrees (population 50,000+)"
- #43 on the list of "Top 101 cities with the largest percentage of unmarried partner households (population 50,000+)"
- #44 on the list of "Top 100 cities with youngest residents (pop. 50,000+)"
- #47 on the list of "Top 101 cities with largest percentage of females in industries: agriculture, forestry, fishing and hunting (population 50,000+)"
- #50 on the list of "Top 101 cities with the highest number of robberies per 100,000 residents, excludes tourist destinations and others with a lot of outsiders visiting based on city industries data (population 50,000+)"
- #52 on the list of "Top 101 cities with the highest percentage of single-parent households, population 50,000+"
- #52 on the list of "Top 101 cities with the highest city-data.com crime index, excludes tourist destinations and others with a lot of outsiders visiting based on city industries data (population 50,000+)"
- #55 on the list of "Top 101 cities with largest percentage of males in occupations: health technologists and technicians (population 50,000+)"
- #59 on the list of "Top 101 cities with largest percentage of females in occupations: health technologists and technicians (population 50,000+)"
- #61 on the list of "Top 101 cities with the smallest sunshine amount differences during a year (population 50,000+)"
- #62 on the list of "Top 101 cities with the highest percentage of family households, population 100,000+"
- #26 (92411) on the list of "Top 101 zip codes with the largest percentage of Arab first ancestries"
- #68 (92401) on the list of "Top 101 zip codes with the lowest average reported salary/wage in 2012 (pop 1,000+)"
- #98 (92411) on the list of "Top 101 zip codes with the lowest 2012 average taxable interest for individuals (pop 5,000+)"
- #5 on the list of "Top 101 counties with the highest Nitrogen Dioxide air pollution readings in 2012 (ppm)"
- #5 on the list of "Top 101 counties with the highest ground withdrawal of fresh water for public supply"
- #10 on the list of "Top 101 counties with the most Evangelical Protestant congregations"
- #14 on the list of "Top 101 counties with the highest total withdrawal of fresh water for public supply"
- #15 on the list of "Top 101 counties with the most Evangelical Protestant adherents (pop. 50,000+)"

|
|
Total of 98 patent applications in 2008-2024.