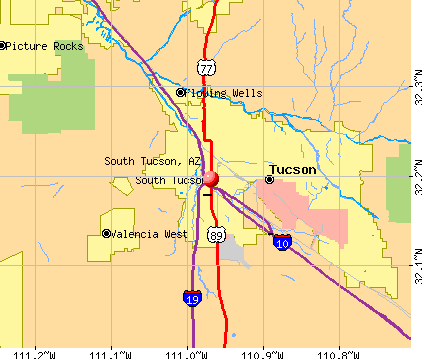
South Tucson, Arizona
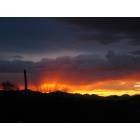
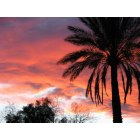
South Tucson: Sunrise from Picture Rocks
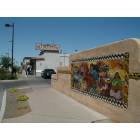
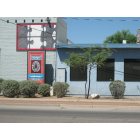
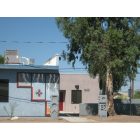
South Tucson: My Favorite Place to Eat
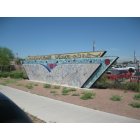
South Tucson: Along sixth avenue in south tucson
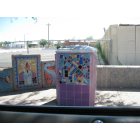
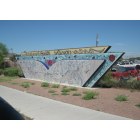
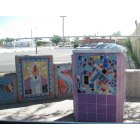
South Tucson: More wonderful tilework of south tucson.
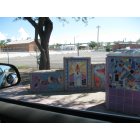
South Tucson: prolific labor-intensive tilework by the primarily hispanic population of south tucson.
South Tucson: ....along park ave. in south tucson.
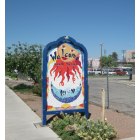
South Tucson: tiled artwork of south tucson
South Tucson: tiled artwork of south tucson
South Tucson: Sunset
South Tucson: tiled artwork of south tucson
South Tucson: tilework of south tucson
- see
17
more - add
your
Submit your own pictures of this city and show them to the world
- OSM Map
- General Map
- Google Map
- MSN Map
Population change since 2000: -17.3%
 |
| Males: 2,374 | |
| Females: 2,167 |
| Median resident age: | 36.1 years |
| Arizona median age: | 38.8 years |
Zip codes: 85713.
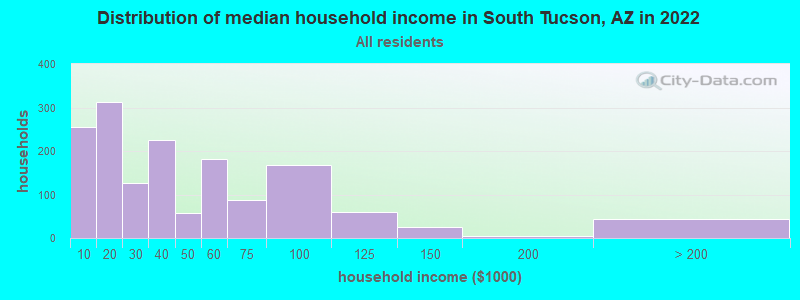
| South Tucson: | $33,851 |
| AZ: | $74,568 |
Estimated per capita income in 2022: $17,006 (it was $8,920 in 2000)
South Tucson city income, earnings, and wages data
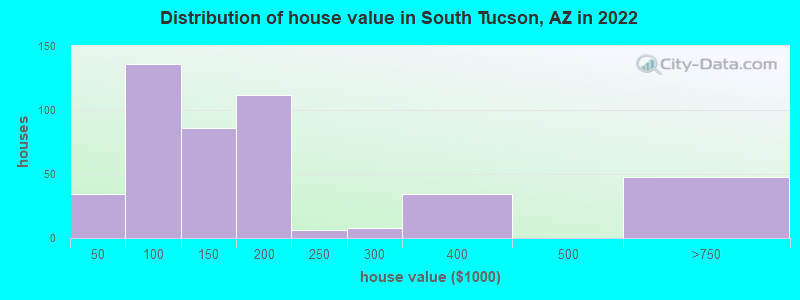
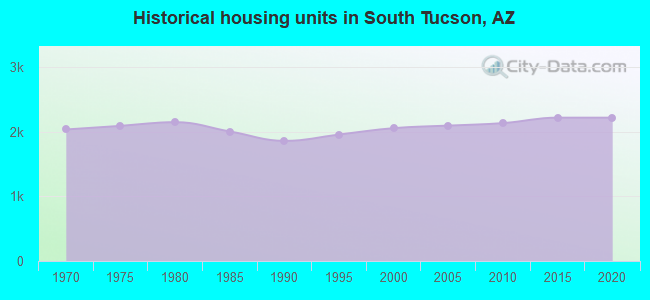
Estimated median house or condo value in 2022: $163,348 (it was $47,100 in 2000)
| South Tucson: | $163,348 |
| AZ: | $402,800 |
Mean prices in 2022: all housing units: $206,450; detached houses: $214,653; townhouses or other attached units: $150,644
Median gross rent in 2022: $864.
(29.6% for White Non-Hispanic residents, 38.0% for Black residents, 33.4% for Hispanic or Latino residents, 45.6% for American Indian residents, 36.3% for other race residents, 49.6% for two or more races residents)
Detailed information about poverty and poor residents in South Tucson, AZ
Compare current foreclosures near South Tucson, AZ:
| Photo | Address | Area | Beds / Baths | Price | Details |
|---|---|---|---|---|---|

|
#1
W 34th St
Tucson, AZ 85713
|
1,469 sq. feet
|
2 baths 3 beds |
show details | |

|
#2
N Lyra Ln
Tucson, AZ 85742
|
1,513 sq. feet
|
3 baths 3 beds |
show details | |

|
#3
E Paseo Juan Tabo
Tucson, AZ 85747
|
1,408 sq. feet
|
2 baths 3 beds |
show details | |

|
#4
S Yellow Rattle Ct
Tucson, AZ 85756
|
1,634 sq. feet
|
2 baths 3 beds |
show details | |

|
#5
S Richardson Dr
Tucson, AZ 85735
|
2,280 sq. feet
|
3 baths 4 beds |
show details | |

|
#6
W Avenida Bella
Tucson, AZ 85746
|
1,583 sq. feet
|
2 baths 3 beds |
show details | |

|
#7
S Sarnoff Dr
Tucson, AZ 85730
|
1,471 sq. feet
|
2 baths 3 beds |
show details | |

|
#8
N Bayou Dr
Tucson, AZ 85741
|
1,351 sq. feet
|
2 baths 3 beds |
show details | |

|
#9
W Country Meadow Dr
Tucson, AZ 85742
|
1,292 sq. feet
|
2 baths 2 beds |
show details | |

|
#10
S Placita Del Barquero
Tucson, AZ 85747
|
1,956 sq. feet
|
2 baths 4 beds |
show details |
| Photo | Address | Area | Beds / Baths | Price | Details |
|---|---|---|---|---|---|

|
#11
W Santa Luisa St
Tucson, AZ 85706
|
1,305 sq. feet
|
2 baths 3 beds |
show details | |

|
#12
S Camino Libertad
Tucson, AZ 85746
|
1,288 sq. feet
|
2 baths 4 beds |
show details | |

|
#13
S Zircon Crystal Dr
Tucson, AZ 85747
|
2,156 sq. feet
|
2 baths 4 beds |
show details | |

|
#14
N Sabino Creek Pl
Tucson, AZ 85750
|
2,569 sq. feet
|
3 baths 4 beds |
show details | |

|
#15
N Camino Esplanade
Tucson, AZ 85750
|
1,975 sq. feet
|
2 baths 3 beds |
show details | |

|
#16
N Midnight Way
Tucson, AZ 85741
|
1,928 sq. feet
|
2 baths 3 beds |
show details | |

|
#17
E Wolfhead Dr
Tucson, AZ 85730
|
1,512 sq. feet
|
2 baths 3 beds |
show details | |

|
#18
N Monmouth Ct
Tucson, AZ 85742
|
1,495 sq. feet
|
2 baths 4 beds |
show details | |

|
#19
E Fortaleza St
Tucson, AZ 85712
|
1,390 sq. feet
|
2 baths 2 beds |
show details | |

|
#20
W Camino De Las Grutas
Tucson, AZ 85742
|
2,522 sq. feet
|
3 baths 5 beds |
show details |
| Photo | Address | Area | Beds / Baths | Price | Details |
|---|---|---|---|---|---|

|
#21
E 18th St
Tucson, AZ 85716
|
1,624 sq. feet
|
2 baths 4 beds |
show details | |

|
#22
W Calle Marojo
Sahuarita, AZ 85629
|
2,575 sq. feet
|
2 baths 4 beds |
show details | |

|
#23
S Desert Promenade Rd
Tucson, AZ 85735
|
1,873 sq. feet
|
2 baths 4 beds |
show details | |

|
#24
N Warner Ter
Tucson, AZ 85705
|
1,369 sq. feet
|
3 baths 3 beds |
show details | |

|
#25
S Camino Chepa
Sahuarita, AZ 85629
|
- sq. feet
|
3 baths 5 beds |
show details | |

|
#26
S Egyptian Dr
Tucson, AZ 85747
|
2,213 sq. feet
|
2 baths 4 beds |
show details | |

|
#27
E Silverlake Rd
Tucson, AZ 85713
|
1,765 sq. feet
|
2 baths 4 beds |
show details | |

|
#28
S Liberty Ave
Tucson, AZ 85706
|
1,083 sq. feet
|
2 baths 3 beds |
show details | |

|
#29
S Kelvin Stra
Tucson, AZ 85713
|
1,374 sq. feet
|
2 baths 3 beds |
show details | |

|
#30
S Hunnic Dr
Tucson, AZ 85747
|
1,417 sq. feet
|
2 baths 3 beds |
show details |
| Photo | Address | Area | Beds / Baths | Price | Details |
|---|---|---|---|---|---|

|
#31
S Gainsborough Rd
Tucson, AZ 85746
|
1,204 sq. feet
|
2 baths 3 beds |
show details | |

|
#32
N Frannea Dr
Tucson, AZ 85712
|
1,894 sq. feet
|
2 baths 3 beds |
show details | |

|
#33
E Calle Dened
Tucson, AZ 85710
|
1,428 sq. feet
|
2 baths 3 beds |
show details | |

|
#34
N Calle De La Reina
Tucson, AZ 85718
|
1,603 sq. feet
|
2 baths 2 beds |
show details | |

|
#35
W Window Rock Dr
Tucson, AZ 85745
|
2,045 sq. feet
|
2 baths 4 beds |
show details | |

|
#36
W Cattail Pl
Tucson, AZ 85745
|
1,278 sq. feet
|
2 baths 3 beds |
show details | |

|
#37
W Jusnic Cir
Tucson, AZ 85705
|
1,080 sq. feet
|
2 baths 3 beds |
show details | |

|
#38
E 6th St
Tucson, AZ 85710
|
1,907 sq. feet
|
2 baths 4 beds |
show details | |

|
#39
S Redwater Dr
Tucson, AZ 85757
|
1,873 sq. feet
|
3 baths 4 beds |
show details | |

|
#40
N Bull Run Dr
Tucson, AZ 85748
|
1,982 sq. feet
|
3 baths 5 beds |
show details |
| Photo | Address | Area | Beds / Baths | Price | Details |
|---|---|---|---|---|---|

|
#41
E 5th St
Tucson, AZ 85711
|
1,343 sq. feet
|
1 baths 2 beds |
show details | |

|
#42
E Lurlene Dr
Tucson, AZ 85730
|
2,293 sq. feet
|
2 baths 4 beds |
show details | |

|
#43
W Tucana St
Tucson, AZ 85745
|
4,496 sq. feet
|
3 baths 5 beds |
show details | |

|
#44
S Helena Stra
Tucson, AZ 85706
|
1,475 sq. feet
|
2 baths 3 beds |
show details | |

|
#45
W Eagle Heart Ct
Tucson, AZ 85757
|
3,443 sq. feet
|
4 baths 5 beds |
show details | |

|
#46
W Bopp Rd
Tucson, AZ 85735
|
1,536 sq. feet
|
2 baths 3 beds |
show details | |

|
#47
S Cowpoke Dr
Tucson, AZ 85757
|
1,524 sq. feet
|
2 baths 3 beds |
show details | |

|
#48
S Paseo Don Rolando
Tucson, AZ 85746
|
1,862 sq. feet
|
2 baths 4 beds |
show details | |

|
#49
S Black Moon Dr
Tucson, AZ 85730
|
1,140 sq. feet
|
2 baths 3 beds |
show details | |

|
Check over 1 million property listings on Foreclosure.com!
|
browse all offers | |||


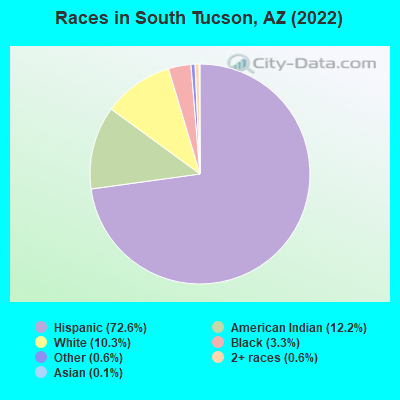
- 3,41872.6%Hispanic
- 57412.2%American Indian alone
- 48610.3%White alone
- 1543.3%Black alone
- 290.6%Other race alone
- 280.6%Two or more races
- 60.1%Asian alone
According to our research of Arizona and other state lists, there were 3 registered sex offenders living in South Tucson, Arizona as of April 17, 2024.
The ratio of all residents to sex offenders in South Tucson is 1,900 to 1.
The ratio of registered sex offenders to all residents in this city is much lower than the state average.
Type |
2009 |
2010 |
2011 |
2012 |
2013 |
2014 |
2015 |
2016 |
2019 |
2020 |
2022 |
|---|---|---|---|---|---|---|---|---|---|---|---|
| Murders (per 100,000) | 2 (32.9) | 0 (0.0) | 3 (52.3) | 0 (0.0) | 5 (87.8) | 4 (70.1) | 3 (52.2) | 0 (0.0) | 0 (0.0) | 1 (17.5) | 2 (44.1) |
| Rapes (per 100,000) | 8 (131.8) | 4 (70.8) | 4 (69.8) | 5 (86.9) | 16 (281.0) | 7 (122.7) | 5 (87.0) | 1 (17.5) | 4 (70.1) | 11 (192.2) | 3 (66.1) |
| Robberies (per 100,000) | 83 (1,367) | 51 (902.3) | 55 (959.5) | 40 (694.8) | 40 (702.5) | 40 (700.9) | 26 (452.3) | 5 (87.3) | 1 (17.5) | 15 (262.1) | 15 (330.6) |
| Assaults (per 100,000) | 85 (1,400) | 94 (1,663) | 87 (1,518) | 114 (1,980) | 89 (1,563) | 88 (1,542) | 65 (1,131) | 13 (227.0) | 18 (315.6) | 86 (1,503) | 89 (1,962) |
| Burglaries (per 100,000) | 116 (1,911) | 83 (1,469) | 101 (1,762) | 140 (2,432) | 104 (1,826) | 101 (1,770) | 46 (800.1) | 5 (87.3) | 33 (578.5) | 108 (1,887) | 51 (1,124) |
| Thefts (per 100,000) | 736 (12,123) | 725 (12,827) | 801 (13,974) | 829 (14,400) | 714 (12,540) | 907 (15,893) | 837 (14,559) | 115 (2,008) | 142 (2,489) | 515 (8,999) | 514 (11,329) |
| Auto thefts (per 100,000) | 69 (1,137) | 46 (813.9) | 24 (418.7) | 34 (590.6) | 31 (544.4) | 17 (297.9) | 22 (382.7) | 3 (52.4) | 18 (315.6) | 42 (733.9) | 38 (837.6) |
| Arson (per 100,000) | 0 (0.0) | 1 (17.7) | 2 (34.9) | 2 (34.7) | 1 (17.6) | 3 (52.6) | 2 (34.8) | 0 (0.0) | 5 (87.7) | 4 (69.9) | 3 (66.1) |
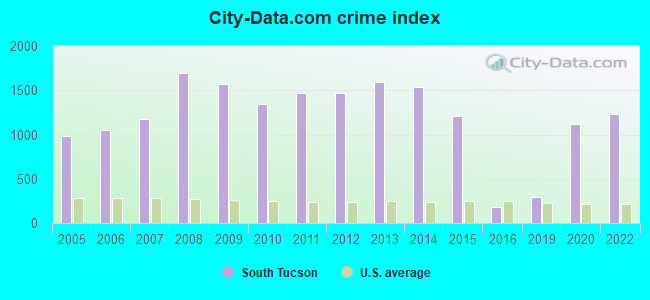
| City-Data.com crime index | 1571.1 | 1340.9 | 1467.7 | 1467.4 | 1596.8 | 1540.4 | 1204.7 | 176.2 | 289.8 | 1118.6 | 1231.4 |
The City-Data.com crime index weighs serious crimes and violent crimes more heavily. Higher means more crime, U.S. average is 246.1. It adjusts for the number of visitors and daily workers commuting into cities.
Crime rate in South Tucson detailed stats: murders, rapes, robberies, assaults, burglaries, thefts, arson
Full-time law enforcement employees in 2021, including police officers: 17 (16 officers - 14 male; 2 female).
| Officers per 1,000 residents here: | 2.78 |
| Arizona average: | 1.75 |
 Recent articles from our blog. Our writers, many of them Ph.D. graduates or candidates, create easy-to-read articles on a wide variety of topics.

 | Moving to Tucson area (55 replies) |
| Retiring to Pima County, AZ: A Wise Move? (32 replies) |
| Tucson of the 60s,70s and 80s (720 replies) |
| Best Mexican restaurants in Tucson (46 replies) |
| Apartments in Tucson (23 replies) |
| Recommended area for older resident (17 replies) |
Latest news from South Tucson, AZ collected exclusively by city-data.com from local newspapers, TV, and radio stations
South Tucson, AZ City Guides:
Ancestries: European (3.7%), American (2.6%), African (1.7%).
Current Local Time: MST (no DST) time zone
Incorporated in 1940
Land area: 1.01 square miles.
Population density: 4,505 people per square mile (average).
844 residents are foreign born (14.4% Latin America).
| This city: | 17.9% |
| Arizona: | 13.0% |
Median real estate property taxes paid for housing units with mortgages in 2022: $990 (0.5%)
Median real estate property taxes paid for housing units with no mortgage in 2022: $755 (0.5%)
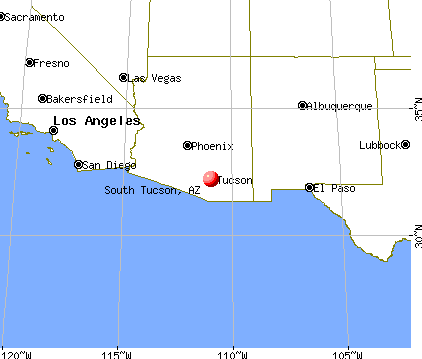
Nearest city with pop. 50,000+: Tucson, AZ  (3.2 miles , pop. 486,699).
Nearest city with pop. 1,000,000+: Phoenix, AZ (112.4 miles , pop. 1,321,045).
Nearest cities:
), ), ), ), ), )Latitude: 32.20 N, Longitude: 110.97 W
Daytime population change due to commuting: +536 (+11.4%)
Workers who live and work in this city: 156 (10.4%)
Area code commonly used in this area: 520
Property values in South Tucson, AZ

South Tucson, Arizona accommodation & food services, waste management - Economy and Business Data
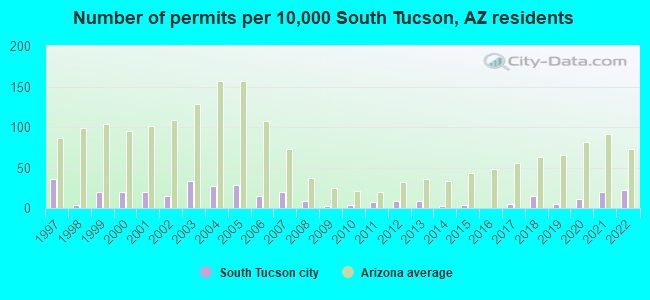
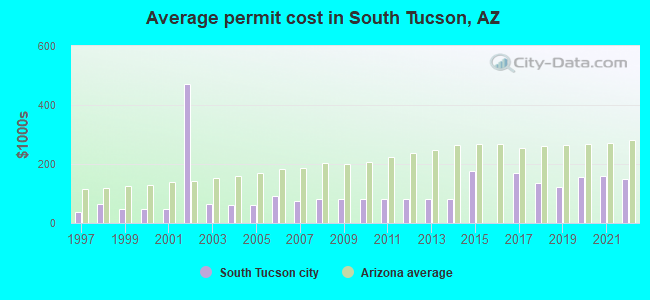
Single-family new house construction building permits:
- 2022: 12 buildings, average cost: $149,200
- 2021: 11 buildings, average cost: $159,500
- 2020: 6 buildings, average cost: $155,800
- 2019: 3 buildings, average cost: $122,700
- 2018: 8 buildings, average cost: $137,400
- 2017: 3 buildings, average cost: $170,800
- 2015: 2 buildings, average cost: $176,000
- 2014: 1 building, cost: $80,100
- 2013: 5 buildings, average cost: $80,100
- 2012: 5 buildings, average cost: $80,100
- 2011: 4 buildings, average cost: $80,100
- 2010: 2 buildings, average cost: $80,100
- 2009: 1 building, cost: $80,100
- 2008: 5 buildings, average cost: $80,100
- 2007: 11 buildings, average cost: $73,000
- 2006: 8 buildings, average cost: $90,600
- 2005: 16 buildings, average cost: $61,900
- 2004: 15 buildings, average cost: $60,800
- 2003: 18 buildings, average cost: $64,400
- 2002: 8 buildings, average cost: $470,000
- 2001: 11 buildings, average cost: $47,700
- 2000: 11 buildings, average cost: $47,700
- 1999: 11 buildings, average cost: $47,700
- 1998: 2 buildings, average cost: $64,700
- 1997: 20 buildings, average cost: $38,000
| Here: | 3.6% |
| Arizona: | 3.8% |
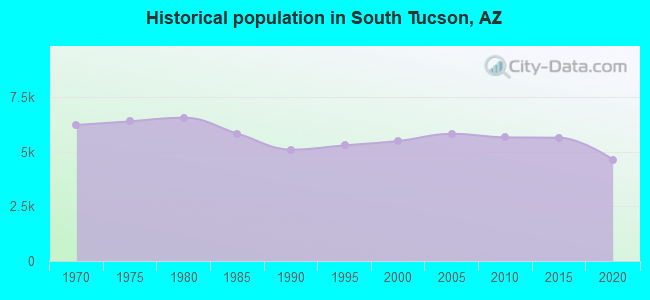
Population change in the 1990s: +298 (+5.7%).
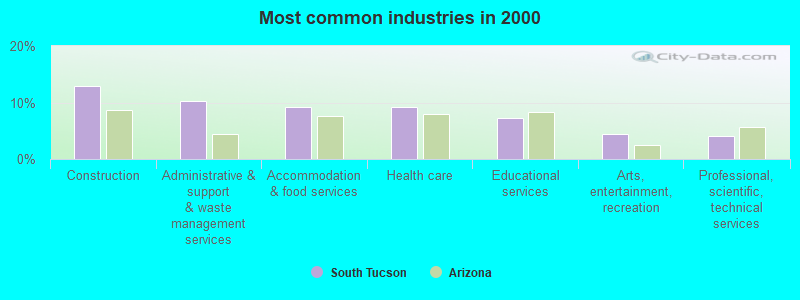
- Construction (12.9%)
- Administrative & support & waste management services (10.3%)
- Accommodation & food services (9.2%)
- Health care (9.2%)
- Educational services (7.3%)
- Arts, entertainment, recreation (4.4%)
- Professional, scientific, technical services (4.0%)
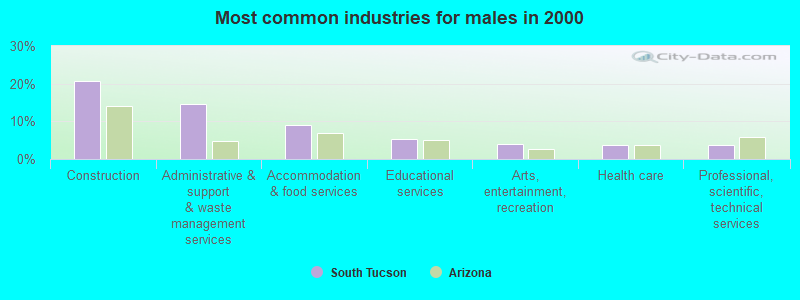
- Construction (20.6%)
- Administrative & support & waste management services (14.7%)
- Accommodation & food services (8.9%)
- Educational services (5.4%)
- Arts, entertainment, recreation (3.9%)
- Health care (3.7%)
- Professional, scientific, technical services (3.7%)
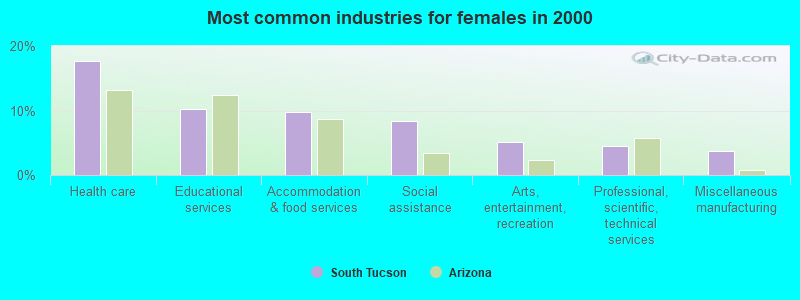
- Health care (17.7%)
- Educational services (10.2%)
- Accommodation & food services (9.7%)
- Social assistance (8.4%)
- Arts, entertainment, recreation (5.1%)
- Professional, scientific, technical services (4.5%)
- Miscellaneous manufacturing (3.7%)
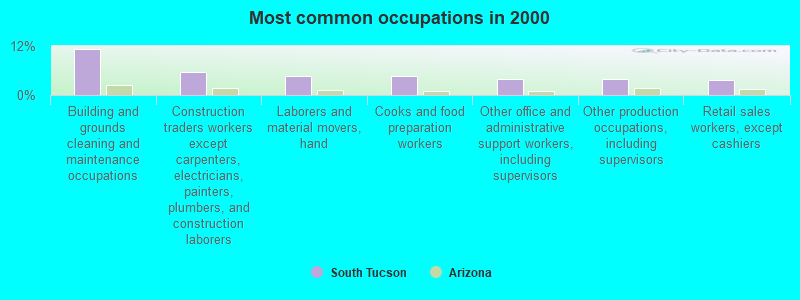
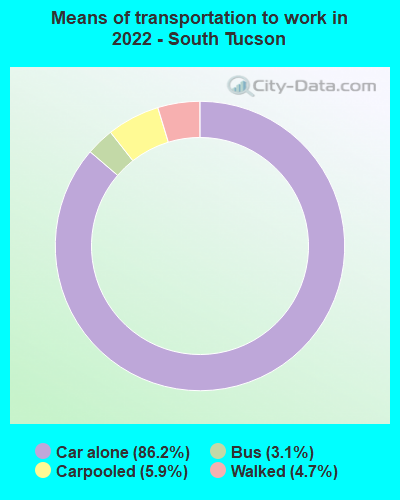
- Building and grounds cleaning and maintenance occupations (11.4%)
- Construction traders workers except carpenters, electricians, painters, plumbers, and construction laborers (5.7%)
- Laborers and material movers, hand (4.7%)
- Cooks and food preparation workers (4.5%)
- Other office and administrative support workers, including supervisors (3.9%)
- Other production occupations, including supervisors (3.8%)
- Retail sales workers, except cashiers (3.7%)

- Building and grounds cleaning and maintenance occupations (14.8%)
- Construction traders workers except carpenters, electricians, painters, plumbers, and construction laborers (9.3%)
- Driver/sales workers and truck drivers (5.3%)
- Cooks and food preparation workers (5.0%)
- Laborers and material movers, hand (4.8%)
- Other production occupations, including supervisors (4.7%)
- Retail sales workers, except cashiers (4.3%)
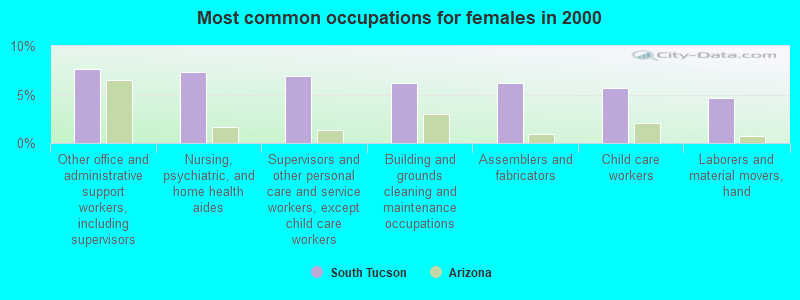
- Other office and administrative support workers, including supervisors (7.6%)
- Nursing, psychiatric, and home health aides (7.3%)
- Supervisors and other personal care and service workers, except child care workers (6.9%)
- Building and grounds cleaning and maintenance occupations (6.1%)
- Assemblers and fabricators (6.1%)
- Child care workers (5.7%)
- Laborers and material movers, hand (4.6%)
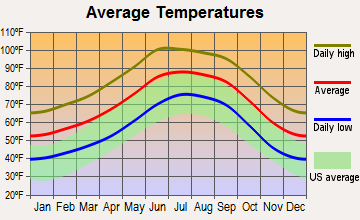
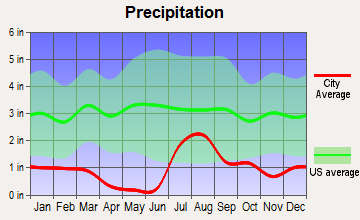
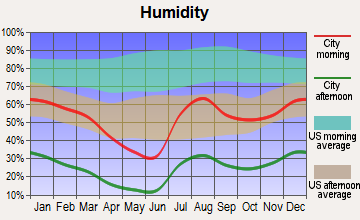
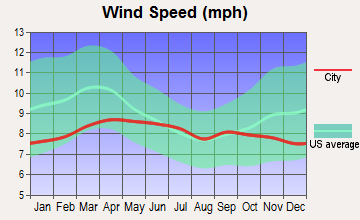
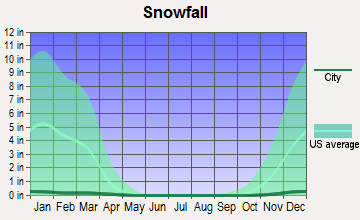
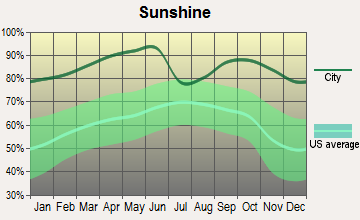
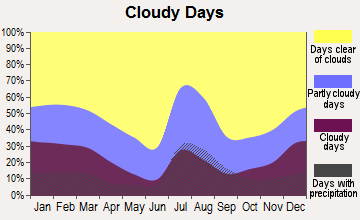
Average climate in South Tucson, Arizona
Based on data reported by over 4,000 weather stations
|
|

(lower is better)
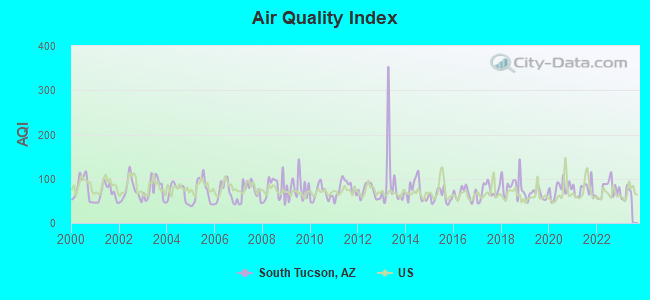
Air Quality Index (AQI) level in 2022 was 77.7. This is about average.
| City: | 77.7 |
| U.S.: | 72.6 |
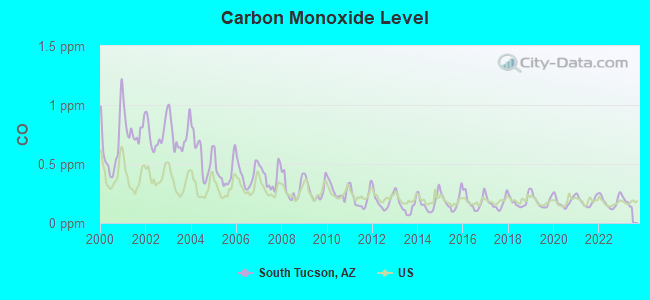
Carbon Monoxide (CO) [ppm] level in 2022 was 0.180. This is better than average. Closest monitor was 1.8 miles away from the city center.
| City: | 0.180 |
| U.S.: | 0.251 |
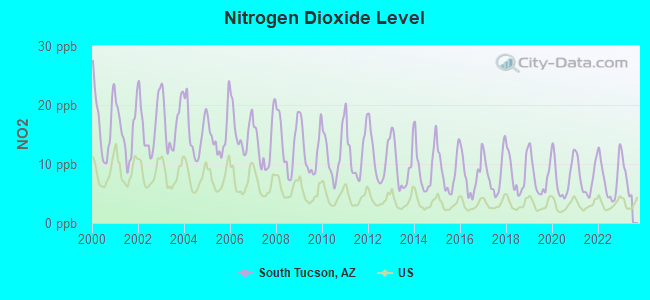
Nitrogen Dioxide (NO2) [ppb] level in 2022 was 7.42. This is significantly worse than average. Closest monitor was 1.8 miles away from the city center.
| City: | 7.42 |
| U.S.: | 5.11 |
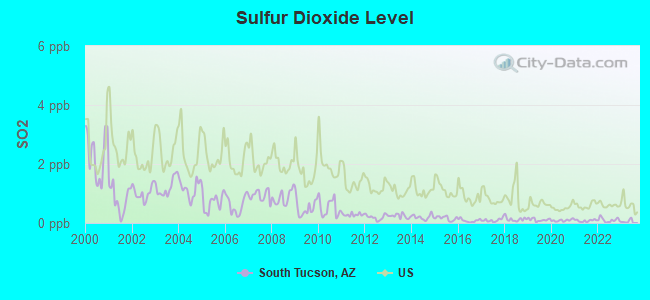
Sulfur Dioxide (SO2) [ppb] level in 2022 was 0.102. This is significantly better than average. Closest monitor was 2.7 miles away from the city center.
| City: | 0.102 |
| U.S.: | 1.515 |
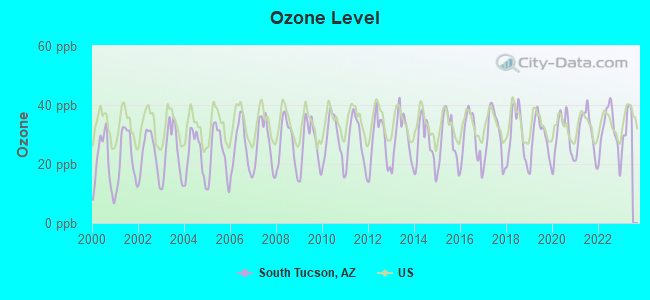
Ozone [ppb] level in 2022 was 31.2. This is about average. Closest monitor was 1.7 miles away from the city center.
| City: | 31.2 |
| U.S.: | 33.3 |
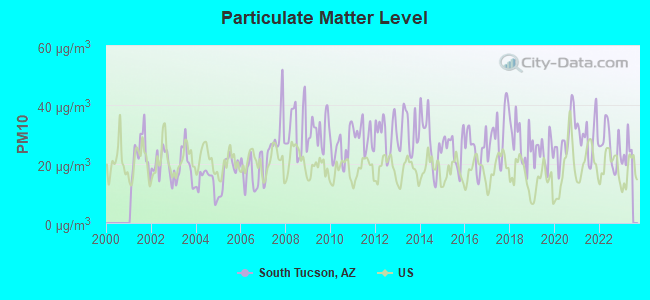
Particulate Matter (PM10) [µg/m3] level in 2022 was 26.2. This is worse than average. Closest monitor was 0.4 miles away from the city center.
| City: | 26.2 |
| U.S.: | 19.2 |
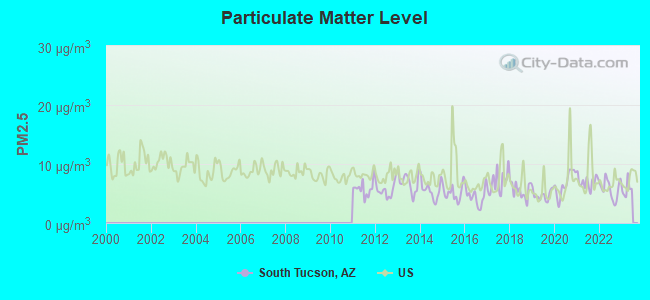
Particulate Matter (PM2.5) [µg/m3] level in 2022 was 5.75. This is significantly better than average. Closest monitor was 6.9 miles away from the city center.
| City: | 5.75 |
| U.S.: | 8.11 |
Earthquake activity:
South Tucson-area historical earthquake activity is significantly above Arizona state average. It is 1501% greater than the overall U.S. average.On 6/28/1992 at 11:57:34, a magnitude 7.6 (6.2 MB, 7.6 MS, 7.3 MW, Depth: 0.7 mi, Class: Major, Intensity: VIII - XII) earthquake occurred 350.1 miles away from South Tucson center, causing 3 deaths (1 shaking deaths, 2 other deaths) and 400 injuries, causing $100,000,000 total damage and $40,000,000 insured losses
On 5/19/1940 at 04:36:40, a magnitude 7.2 (7.2 UK) earthquake occurred 284.1 miles away from South Tucson center, causing $33,000,000 total damage
On 12/31/1934 at 18:45:56, a magnitude 7.1 (7.1 UK) earthquake occurred 281.7 miles away from South Tucson center
On 10/16/1999 at 09:46:44, a magnitude 7.4 (6.3 MB, 7.4 MS, 7.2 MW, 7.3 ML) earthquake occurred 354.1 miles away from the city center
On 10/15/1979 at 23:16:54, a magnitude 7.0 (5.7 MB, 6.9 MS, 7.0 ML, 6.4 MW) earthquake occurred 275.7 miles away from South Tucson center
On 11/24/1987 at 13:15:56, a magnitude 6.7 (6.0 MB, 6.6 MS, 6.7 ML, 6.1 ML, Class: Strong, Intensity: VII - IX) earthquake occurred 296.5 miles away from the city center
Magnitude types: body-wave magnitude (MB), local magnitude (ML), surface-wave magnitude (MS), moment magnitude (MW)
Natural disasters:
The number of natural disasters in Pima County (13) is near the US average (15).Major Disasters (Presidential) Declared: 10
Emergencies Declared: 1
Causes of natural disasters: Floods: 9, Storms: 8, Fires: 2, Hurricane: 1, Tornado: 1, Other: 1 (Note: some incidents may be assigned to more than one category).

Hospitals and medical centers near South Tucson:
- SOUTH TUCSON DIALYSIS (FMC) (Dialysis Facility, about 1 miles away; TUCSON, AZ)
- SU CASA NURSING HOME (Nursing Home, about 1 miles away; TUCSON, AZ)
- RELIABLE NURSES, LLC (Home Health Center, about 2 miles away; TUCSON, AZ)
- TUCSON SOUTH DIALYSIS (DVA) (Dialysis Facility, about 2 miles away; TUCSON, AZ)
- ARIZONA STATE VETERAN HOME-TUCSON (Nursing Home, about 2 miles away; TUCSON, AZ)
- DESERT DIALYSIS CENTER SOUTH TUCSON (DCI) (Dialysis Facility, about 2 miles away; TUCSON, AZ)
- SUNLIFE HOME HEALTH, LLC (Home Health Center, about 3 miles away; TUCSON, AZ)
Colleges/universities with over 2000 students nearest to South Tucson:
- University of Arizona (about 3 miles; Tucson, AZ; Full-time enrollment: 36,324)
- Pima Medical Institute-Tucson (about 5 miles; Tucson, AZ; FT enrollment: 2,357)
- Pima Community College (about 6 miles; Tucson, AZ; FT enrollment: 18,794)
- Central Arizona College (about 67 miles; Coolidge, AZ; FT enrollment: 4,893)
- Eastern Arizona College (about 84 miles; Thatcher, AZ; FT enrollment: 3,810)
- Arizona State University-Polytechnic (about 88 miles; Mesa, AZ; FT enrollment: 3,311)
- Chandler-Gilbert Community College (about 90 miles; Chandler, AZ; FT enrollment: 8,047)
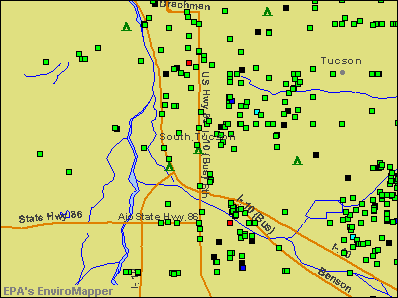
Points of interest:
Notable locations in South Tucson: South Tucson Fire Department (A), Pima County Public Library Sam Lena South Tucson Branch (B), South Tucson Police Department (C). Display/hide their locations on the map
Shopping Center: Soleng Shopping Center (1). Display/hide its location on the map
Churches in South Tucson include: Centro Cristiano Nueva Creacion Asamblea de Dios (A), Blessed Kateri Tekakwitha Parish (B). Display/hide their locations on the map
| This city: | 2.9 people |
| Arizona: | 2.6 people |
| This city: | 63.4% |
| Whole state: | 66.2% |
| This city: | 9.7% |
| Whole state: | 7.8% |
Likely homosexual households (counted as self-reported same-sex unmarried-partner households)
- Lesbian couples: 0.2% of all households
- Gay men: 0.2% of all households
People in group quarters in South Tucson in 2010:
- 153 people in emergency and transitional shelters (with sleeping facilities) for people experiencing homelessness
- 84 people in residential treatment centers for adults
- 55 people in other noninstitutional facilities
- 14 people in residential treatment centers for juveniles (non-correctional)
People in group quarters in South Tucson in 2000:
- 84 people in homes or halfway houses for drug/alcohol abuse
- 54 people in other noninstitutional group quarters
- 31 people in other group homes
Banks with branches in South Tucson (2011 data):
- JPMorgan Chase Bank, National Association: South Tucson Branch at 1818 South 6th Avenue, branch established on 1952/11/17. Info updated 2011/11/10: Bank assets: $1,811,678.0 mil, Deposits: $1,190,738.0 mil, headquarters in Columbus, OH, positive income, International Specialization, 5577 total offices, Holding Company: Jpmorgan Chase & Co.
For population 15 years and over in South Tucson:
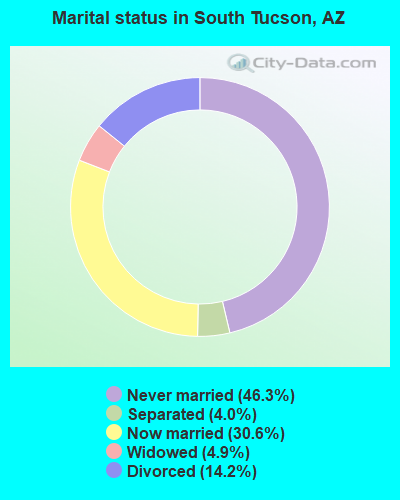
- Never married: 46.3%
- Now married: 30.6%
- Separated: 4.0%
- Widowed: 4.9%
- Divorced: 14.2%
For population 25 years and over in South Tucson:
- High school or higher: 65.2%
- Bachelor's degree or higher: 8.8%
- Graduate or professional degree: 4.1%
- Unemployed: 17.7%
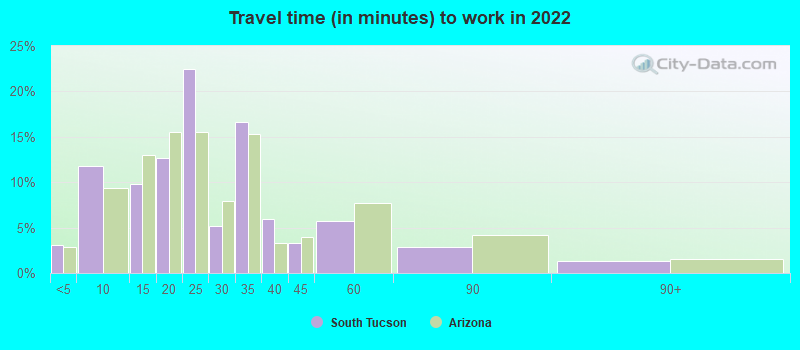
- Mean travel time to work (commute): 20.0 minutes

| Here: | 16.8 |
| Arizona average: | 12.2 |
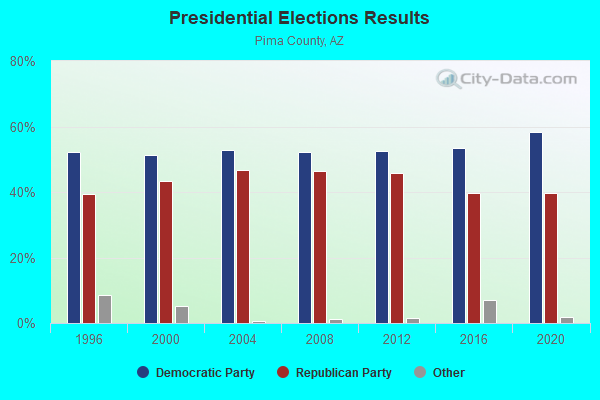
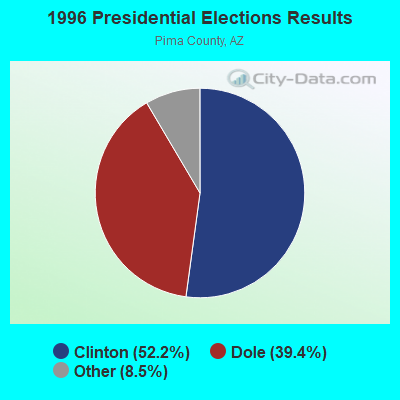
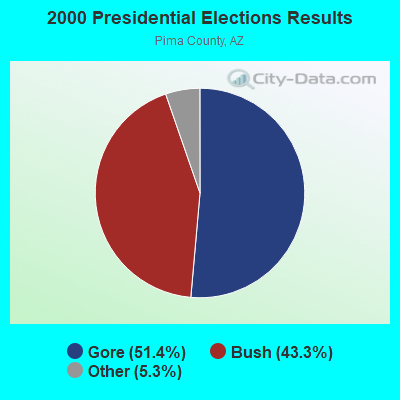
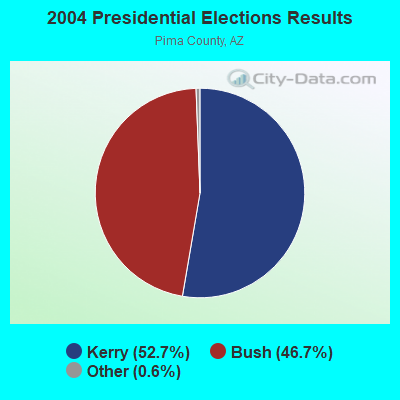
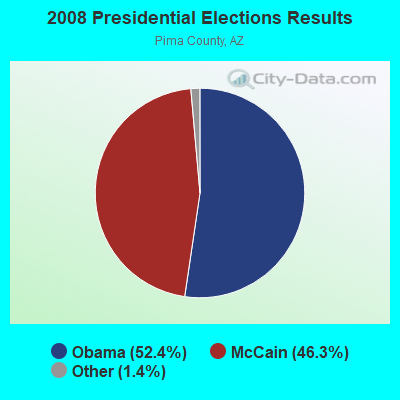

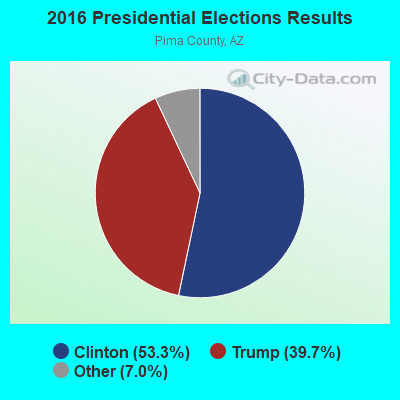
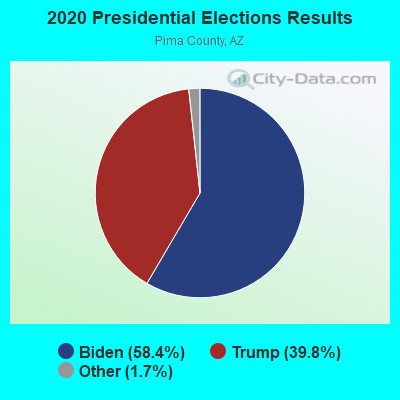
Graphs represent county-level data. Detailed 2008 Election Results
Religion statistics for South Tucson, AZ (based on Pima County data)
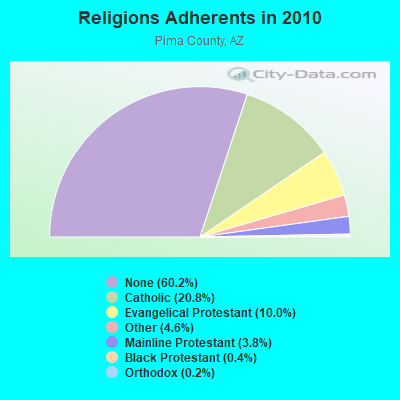
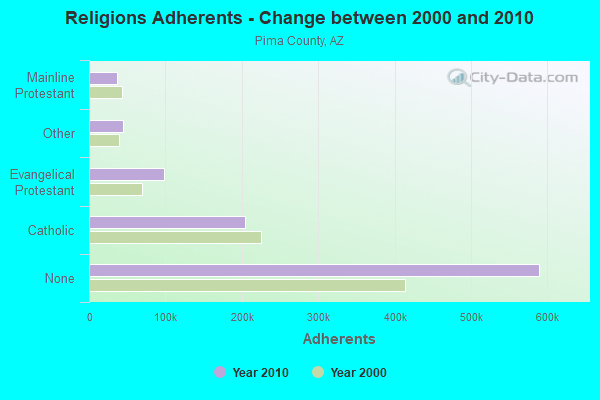
| Religion | Adherents | Congregations |
|---|---|---|
| Catholic | 203,770 | 50 |
| Evangelical Protestant | 98,278 | 362 |
| Other | 45,011 | 128 |
| Mainline Protestant | 37,037 | 77 |
| Black Protestant | 4,190 | 14 |
| Orthodox | 2,260 | 5 |
| None | 589,717 | - |
Food Environment Statistics:
| Here: | 1.22 / 10,000 pop. |
| Arizona: | 1.36 / 10,000 pop. |
| This county: | 0.09 / 10,000 pop. |
| Arizona: | 0.14 / 10,000 pop. |
| Pima County: | 0.52 / 10,000 pop. |
| Arizona: | 0.55 / 10,000 pop. |
| This county: | 2.27 / 10,000 pop. |
| Arizona: | 2.47 / 10,000 pop. |
| This county: | 6.17 / 10,000 pop. |
| Arizona: | 6.21 / 10,000 pop. |
| Pima County: | 7.8% |
| State: | 8.0% |
| This county: | 21.2% |
| Arizona: | 22.8% |
| Here: | 15.2% |
| Arizona: | 14.2% |
Health and Nutrition:
| This city: | 46.5% |
| Arizona: | 49.0% |
| This city: | 43.1% |
| Arizona: | 47.3% |
| South Tucson: | 28.6 |
| State: | 28.5 |
| South Tucson: | 25.0% |
| State: | 20.8% |
| Here: | 11.5% |
| Arizona: | 10.2% |
| This city: | 6.7 |
| Arizona: | 6.8 |
| Here: | 32.4% |
| Arizona: | 33.5% |
| Here: | 51.0% |
| Arizona: | 56.1% |
| This city: | 79.7% |
| Arizona: | 79.4% |
More about Health and Nutrition of South Tucson, AZ Residents
| Local government employment and payroll (March 2022) | |||||
| Function | Full-time employees | Monthly full-time payroll | Average yearly full-time wage | Part-time employees | Monthly part-time payroll |
|---|---|---|---|---|---|
| Police Protection - Officers | 37 | $244,768 | $79,384 | 1 | $2,830 |
| Other Government Administration | 22 | $74,555 | $40,666 | 1 | $5,903 |
| Streets and Highways | 20 | $81,572 | $48,943 | 7 | $10,842 |
| Firefighters | 18 | $114,979 | $76,653 | 25 | $33,120 |
| Fire - Other | 15 | $50,567 | $40,454 | 5 | $3,334 |
| Housing and Community Development (Local) | 14 | $53,336 | $45,717 | 0 | $0 |
| Judicial and Legal | 9 | $32,710 | $43,613 | 1 | $2,490 |
| Financial Administration | 4 | $32,487 | $97,461 | 1 | $5,903 |
| Totals for Government | 139 | $684,974 | $59,134 | 41 | $64,422 |
South Tucson government finances - Expenditure in 2017 (per resident):
- Current Operations - Police Protection: $544,000 ($119.80)
Regular Highways: $528,000 ($116.27)
Judicial and Legal Services: $104,000 ($22.90)
General Public Buildings: $89,000 ($19.60)
Central Staff Services: $81,000 ($17.84)
Libraries: $67,000 ($14.75)
Financial Administration: $18,000 ($3.96)
Parks and Recreation: $1,000 ($0.22)
- General - Interest on Debt: $268,000 ($59.02)
- Total Salaries and Wages: $755,000 ($166.26)
South Tucson government finances - Revenue in 2017 (per resident):
- Federal Intergovernmental - Housing and Community Development: $417,000 ($91.83)
Other: $83,000 ($18.28)
- Miscellaneous - Interest Earnings: $35,000 ($7.71)
General Revenue - Other: $8,000 ($1.76)
- State Intergovernmental - General Local Government Support: $1,540,000 ($339.13)
Highways: $460,000 ($101.30)
- Tax - General Sales and Gross Receipts: $755,000 ($166.26)
Other License: $172,000 ($37.88)
Public Utilities Sales: $11,000 ($2.42)
South Tucson government finances - Debt in 2017 (per resident):
- Long Term Debt - Beginning Outstanding - Unspecified Public Purpose: $6,688,000 ($1472.80)
Outstanding Unspecified Public Purpose: $6,688,000 ($1472.80)
South Tucson government finances - Cash and Securities in 2017 (per resident):
- Other Funds - Cash and Securities: $5,962,000 ($1312.93)
5.84% of this county's 2021 resident taxpayers lived in other counties in 2020 ($71,876 average adjusted gross income)
| Here: | 5.84% |
| Arizona average: | 6.85% |
0.07% of residents moved from foreign countries ($644 average AGI)
Pima County: 0.07% Arizona average: 0.03%
Top counties from which taxpayers relocated into this county between 2020 and 2021:
| from Maricopa County, AZ | |
| from Pinal County, AZ | |
| from Cochise County, AZ |
5.17% of this county's 2020 resident taxpayers moved to other counties in 2021 ($65,979 average adjusted gross income)
| Here: | 5.17% |
| Arizona average: | 5.72% |
0.06% of residents moved to foreign countries ($677 average AGI)
Pima County: 0.06% Arizona average: 0.03%
Top counties to which taxpayers relocated from this county between 2020 and 2021:
| to Maricopa County, AZ | |
| to Pinal County, AZ | |
| to Cochise County, AZ |
| Businesses in South Tucson, AZ | ||||
| Name | Count | Name | Count | |
|---|---|---|---|---|
| Circle K | 1 | Little Caesars Pizza | 1 | |
| Discount Tire | 1 | McDonald's | 1 | |
Strongest AM radio stations in South Tucson:
- KXEW (1600 AM; 1 kW; SOUTH TUCSON, AZ; Owner: CAM BROADCASTING COMPANY, INC.)
- KTKT (990 AM; 10 kW; TUCSON, AZ; Owner: ARIZONA LOTUS CORP.)
- KTZR (1450 AM; 1 kW; TUCSON, AZ; Owner: CLEAR CHANNEL BROADCASTING LICENSES, INC.)
- KNST (790 AM; 5 kW; TUCSON, AZ)
- KFLT (830 AM; 50 kW; TUCSON, AZ; Owner: FAMILY LIFE B/CING SYSTEM, INC.)
- KUAZ (1550 AM; daytime; 50 kW; TUCSON, AZ; Owner: ARIZONA BOARD OF REGENTS)
- KGMS (940 AM; 1 kW; TUCSON, AZ)
- KEVT (1030 AM; 10 kW; CORTARO, AZ; Owner: ONE MART CORP.)
- KQTL (1210 AM; 10 kW; SAHUARITA, AZ; Owner: RADIO UNICA OF TUCSON LICENSE CORP.)
- KFFN (1490 AM; 1 kW; TUCSON, AZ; Owner: JOURNAL BROADCAST CORPORATION)
- KJLL (1330 AM; 5 kW; SOUTH TUCSON, AZ; Owner: HUDSON COMMUNICATIONS, INC)
- KCUB (1290 AM; 1 kW; TUCSON, AZ; Owner: CITADEL BROADCASTING COMPANY)
- KTUC (1400 AM; 1 kW; TUCSON, AZ; Owner: CITADEL BROADCASTING COMPANY)
Strongest FM radio stations in South Tucson:
- KXCI (91.3 FM; TUCSON, AZ; Owner: FOUNDATION FOR CREATIVE BROADCASTING, INC.)
- KLPX (96.1 FM; TUCSON, AZ; Owner: ARIZONA LOTUS CORPORATION)
- KIIM-FM (99.5 FM; TUCSON, AZ; Owner: CITADEL BROADCASTING COMPANY)
- KOYT (92.9 FM; TUCSON, AZ; Owner: CAPSTAR TX LIMITED PARTNERSHIP)
- KHYT (107.5 FM; TUCSON, AZ; Owner: CITADEL BROADCASTING COMPANY)
- KRQQ (93.7 FM; TUCSON, AZ; Owner: CAPSTAR TX LIMITED PARTNERSHIP)
- KMXZ-FM (94.9 FM; TUCSON, AZ; Owner: JOURNAL BROADCAST CORPORATION)
- KZLZ-FM2 (105.3 FM; TUCSON, AZ; Owner: ENTRAVISION HOLDINGS, LLC)
- K263AA (100.5 FM; TUCSON, AZ; Owner: EDUCATIONAL MEDIA FOUNDATION)
- K255AC (98.9 FM; TUCSON, AZ; Owner: MARICOPA COUNTY COMMUN. COLLEGE DIST)
- KUAT-FM (90.5 FM; TUCSON, AZ; Owner: ARIZONA BOARD OF REGENTS)
- K292CM (106.3 FM; SUMMERHAVEN, AZ; Owner: ARIZONA LOTUS CORPORATION)
- KZLZ-FM1 (105.3 FM; TUCSON, AZ; Owner: ENTRAVISION HOLDINGS, LLC)
- KWFM-FM (97.1 FM; GREEN VALLEY, AZ; Owner: CAPSTAR TX LIMITED PARTNERSHIP)
- KCDX (103.1 FM; FLORENCE, AZ; Owner: DESERT WEST AIR RANCHERS CORPORATION)
- K261CK (100.1 FM; SAN XAVIER, AZ; Owner: WORLD RADIO NETWORK, INC.)
- KGMG (106.3 FM; ORACLE, AZ; Owner: JOURNAL BROADCAST CORPORATION)
- KZPT (104.1 FM; TUCSON, AZ; Owner: JOURNAL BROADCAST CORPORATION)
- KUAZ-FM (89.1 FM; TUCSON, AZ; Owner: ARIZONA BOARD OF REGENTS)
- KXKQ (94.1 FM; SAFFORD, AZ; Owner: MCMURRAY COMMUNICATIONS, INC.)
TV broadcast stations around South Tucson:
- K02BW (Channel 2; CASAS ADOBES, AZ; Owner: EMMIS TELEVISION LICENSE CORPORATION)
- K16EO (Channel 16; ORO VALLEY/TUCSON, AZ; Owner: EMMIS TELEVISION LICENSE CORPORATION)
- KHRR (Channel 40; TUCSON, AZ; Owner: NBC TELEMUNDO PHOENIX, INC.)
- KUAS-TV (Channel 27; TUCSON, AZ; Owner: ARIZONA BOARD OF REGENTS FOR BENEFIT OF UNIV OF AZ.)
- K54FW (Channel 54; TUCSON, AZ; Owner: TRINITY BROADCASTING OF ARIZONA, INC)
- KTTU-TV (Channel 18; TUCSON, AZ; Owner: KTTU-TV, INC.)
- K64BV (Channel 64; CASAS ADOBES, AZ; Owner: KVOA COMMUNICATIONS, INC.)
- KTLL-LP (Channel 65; TUCSON, AZ; Owner: LA LUZ BROADCASTING, INC.)
- K48GX (Channel 48; TUCSON, AZ; Owner: KTVW LICENSE PARTNERSHIP, G.P.)
- KUVE-CA (Channel 38; TUCSON, AZ; Owner: KTVW LICENSE PARTNERSHIP, G.P.)
- K07DA (Channel 7; CASAS ADOBES, AZ; Owner: RAYCOM AMERICA, INC.)
- National Bridge Inventory (NBI) Statistics
- 4Number of bridges
- 210ft / 63.7mTotal length
- 180,211Total average daily traffic
- 30,522Total average daily truck traffic
FCC Registered Microwave Towers: 13 (See the full list of FCC Registered Microwave Towers in this town)
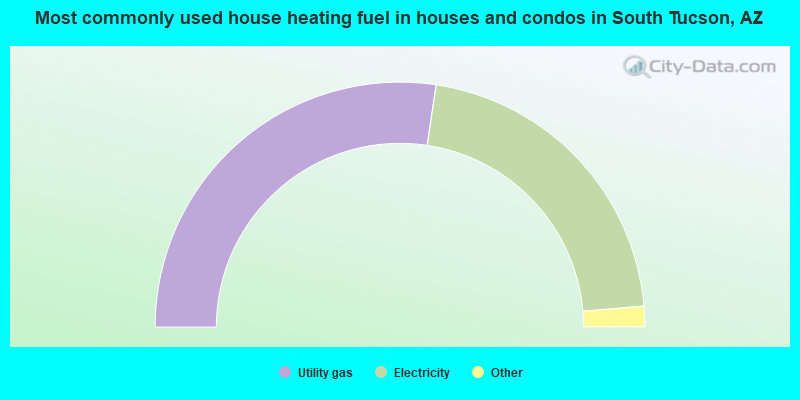
- 54.9%Utility gas
- 42.7%Electricity
- 1.2%Bottled, tank, or LP gas
- 1.2%Wood
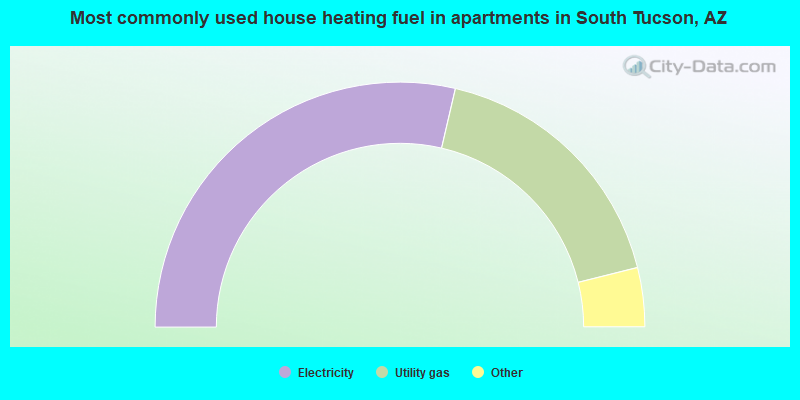
- 57.4%Electricity
- 35.0%Utility gas
- 2.1%Bottled, tank, or LP gas
- 1.7%No fuel used
- 1.5%Fuel oil, kerosene, etc.
- 1.4%Solar energy
- 0.9%Wood
South Tucson compared to Arizona state average:
- Median household income below state average.
- Median house value significantly below state average.
- Hispanic race population percentage above state average.
- Renting percentage above state average.
- Length of stay since moving in significantly above state average.
- House age significantly above state average.
- Number of college students below state average.
- Percentage of population with a bachelor's degree or higher significantly below state average.
South Tucson on our top lists:
- #1 on the list of "Top 101 cities with the most people below the poverty level, excluding cities with 15% or more of residents in college and with the median age below 28 (population 5,000+)"
- #4 on the list of "Top 101 cities with the highest city-data.com crime index, excludes tourist destinations and others with a lot of outsiders visiting based on city industries data (population 5,000+)"
- #5 on the list of "Top 101 cities with the highest number of thefts per 100,000 residents, excludes tourist destinations and others with a lot of outsiders visiting based on city industries data (population 5,000+)"
- #6 on the list of "Top 101 cities with the most people below 50% of the poverty level, excluding cities with 15% or more of residents in college and with the median age below 28 (population 5,000+)"
- #7 on the list of "Top 101 cities with the highest number of assaults per 100,000 residents, excludes tourist destinations and others with a lot of outsiders visiting based on city industries data (population 5,000+)"
- #12 on the list of "Top 101 cities with the least people having Master's or Doctorate degrees (population 5,000+)"
- #15 on the list of "Top 101 cities with largest percentage of females in occupations: food preparation and serving related occupations (population 5,000+)"
- #18 on the list of "Top 100 least-safe cities (highest city-data.com crime index)"
- #20 on the list of "Top 101 cities with the highest number of robberies per 100,000 residents, excludes tourist destinations and others with a lot of outsiders visiting based on city industries data (population 5,000+)"
- #31 on the list of "Top 101 cities with largest percentage of females in industries: accommodation and food services (population 5,000+)"
- #32 on the list of "Top 101 cities with largest percentage of males in occupations: construction and extraction occupations (population 5,000+)"
- #34 on the list of "Top 101 cities with the least cars per house, population 5,000+"
- #37 on the list of "Top 101 cities with the largest percentage of people in homes or halfway houses for drug/alcohol abuse (population 1,000+)"
- #44 on the list of "Top 101 cities with the largest city-data.com crime index per police officer (population 5,000+)"
- #66 on the list of "Top 101 cities with the highest number of burglaries per 100,000 residents, excludes tourist destinations and others with a lot of outsiders visiting based on city industries data (population 5,000+)"
- #80 on the list of "Top 100 cities with smallest houses (pop. 5,000+)"
- #11 on the list of "Top 101 counties with the highest Particulate Matter (PM10) Annual air pollution readings in 2012 (µg/m3)"
- #14 on the list of "Top 101 counties with the highest ground withdrawal of fresh water for public supply"
- #29 on the list of "Top 101 counties with the highest carbon monoxide air pollution readings in 2012 (ppm)"
- #35 on the list of "Top 101 counties with the most Other congregations"
- #45 on the list of "Top 101 counties with the highest total withdrawal of fresh water for public supply (pop. 50,000+)"