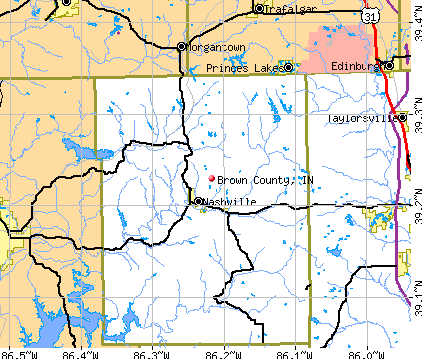
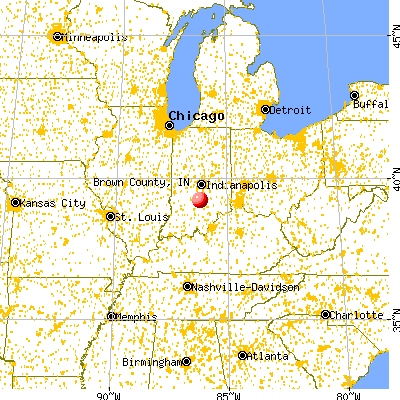
Brown County, Indiana (IN)
County owner-occupied free and clear houses and condos in 2010: 1,570
County owner-occupied houses and condos in 2000: 5,011
Renter-occupied apartments: 1,004 (it was 886 in 2000)
| % of renters here: | 15% |
| State: | 30% |
Land area: 312 sq. mi.
Water area: 4.4 sq. mi.
Population density: 50 people per square mile (average).
Industries providing employment: Educational, health and social services (18.9%), Manufacturing (17.9%), Retail trade (12.0%), Construction (10.3%).
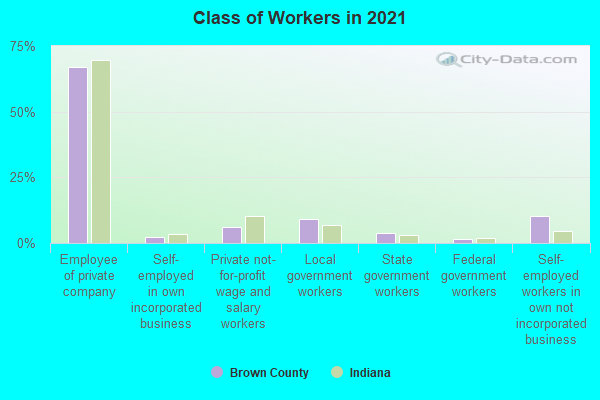
Type of workers:
- Private wage or salary: 77%
- Government: 14%
- Self-employed, not incorporated: 9%
- Unpaid family work: 0%
- OSM Map
- General Map
- Google Map
- MSN Map

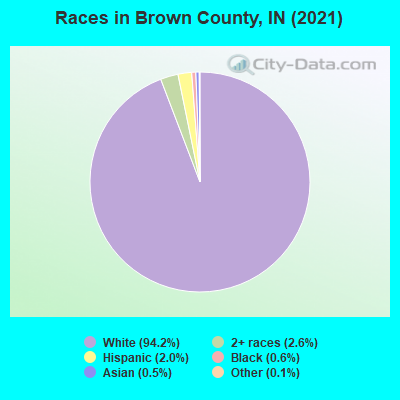
- 14,59294.3%White Non-Hispanic Alone
- 3382.2%Hispanic or Latino
- 2641.7%Two or more races
- 910.6%Black Non-Hispanic Alone
- 900.6%Asian alone
- 630.4%Native Hawaiian and Other
Pacific Islander alone - 180.1%Some other race alone
- 140.09%American Indian and Alaska Native alone
| Median resident age: | 51.0 years |
| Indiana median age: | 38.2 years |
| Males: 7,826 | |
| Females: 7,798 |

 | Greencastle Up and Coming? (17 replies) |
| Vacation home in Monroe or Brown counties (1 reply) |
| Tell me about Franklin/Greenwood Indiana (28 replies) |
| Living in Indiana (74 replies) |
| Is Indiana right for me? (6 replies) |
| Best Small Towns (20 replies) |
| Brown County: | 2.0 people |
| Indiana: | 3 people |
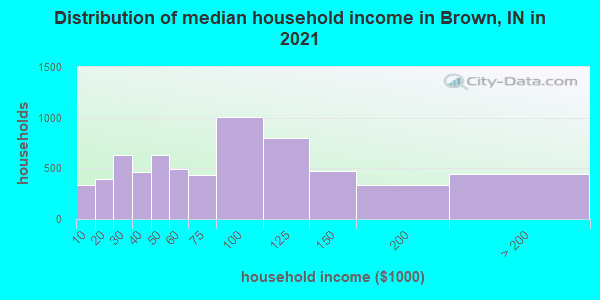
Estimated median household income in 2022: $73,505 ($43,708 in 1999)
| This county: | $73,505 |
| Indiana: | $66,785 |
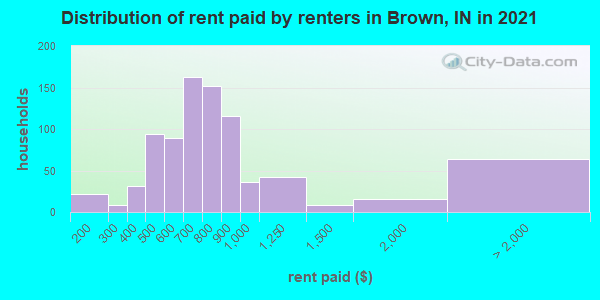
Median contract rent in 2022 for apartments: $742 (lower quartile is $598, upper quartile is $937)
| This county: | $742 |
| State: | $780 |
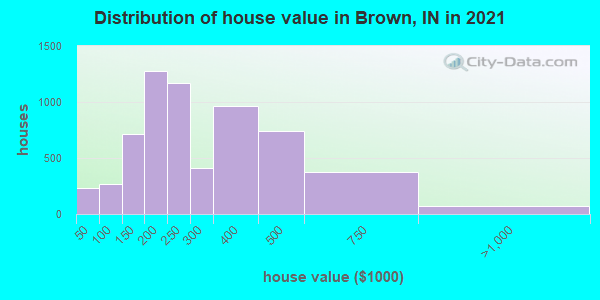
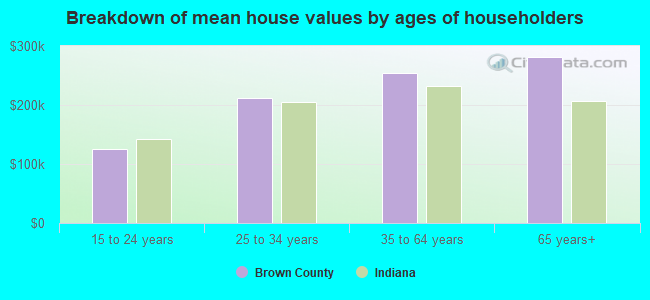
Estimated median house or condo value in 2022: $258,715 (it was $118,300 in 2000)
| Brown: | $258,715 |
| Indiana: | $208,700 |
Median monthly housing costs for homes and condos with a mortgage: $1,270
Median monthly housing costs for units without a mortgage: $520
Institutionalized population: 120
Crime in 2018 (reported by the sheriff's office or county police, not the county total):
- Murders: 0
- Rapes: 3
- Robberies: 0
- Assaults: 38
- Burglaries: 56
- Thefts: 143
- Auto thefts: 14
Crime in 2017 (reported by the sheriff's office or county police, not the county total):
- Murders: 0
- Rapes: 4
- Robberies: 3
- Assaults: 26
- Burglaries: 55
- Thefts: 130
- Auto thefts: 27
Health of residents in Brown County based on CDC Behavioral Risk Factor Surveillance System Survey Questionnaires from 2013 to 2021:
General health status score of residents in this county from 1 (poor) to 5 (excellent) is 3.4. This is about average.69.9% of residents exercised in the past month. This is less than average.
43.0% of residents smoked 100+ cigarettes in their lives. This is about average.
49.9% of adult residents drank alcohol in the past 30 days. This is less than average.
68.8% of residents visited a dentist within the past year. This is about average.
Average weight of males is 200 pounds. This is more than average.
Average weight of females is 166 pounds. This is about average.
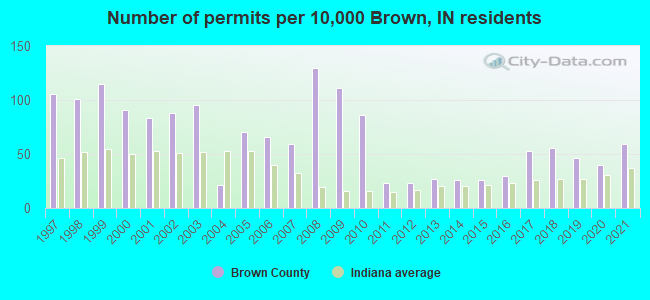
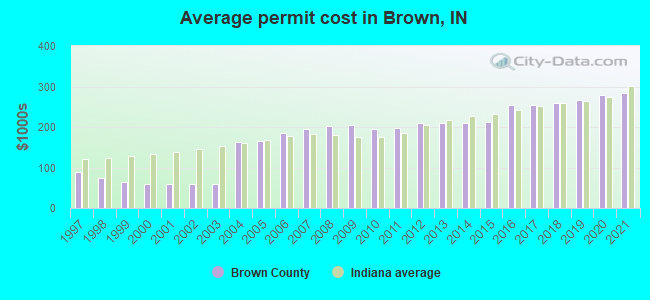
Single-family new house construction building permits:
- 2022: 84 buildings, average cost: $303,800
- 2021: 88 buildings, average cost: $283,800
- 2020: 60 buildings, average cost: $277,800
- 2019: 69 buildings, average cost: $266,100
- 2018: 84 buildings, average cost: $258,500
- 2017: 79 buildings, average cost: $254,400
- 2016: 45 buildings, average cost: $253,600
- 2015: 39 buildings, average cost: $212,500
- 2014: 39 buildings, average cost: $209,200
- 2013: 41 buildings, average cost: $209,200
- 2012: 34 buildings, average cost: $211,400
- 2011: 35 buildings, average cost: $198,400
- 2010: 128 buildings, average cost: $196,200
- 2009: 166 buildings, average cost: $205,800
- 2008: 195 buildings, average cost: $201,700
- 2007: 88 buildings, average cost: $193,800
- 2006: 98 buildings, average cost: $183,900
- 2005: 104 buildings, average cost: $165,300
- 2004: 32 buildings, average cost: $162,700
- 2003: 142 buildings, average cost: $59,800
- 2002: 131 buildings, average cost: $59,800
- 2001: 124 buildings, average cost: $59,800
- 2000: 136 buildings, average cost: $59,800
- 1999: 172 buildings, average cost: $65,100
- 1998: 151 buildings, average cost: $74,900
- 1997: 158 buildings, average cost: $89,400
Median real estate property taxes paid for housing units with mortgages in 2022: $1,283 (0.5%)
Median real estate property taxes paid for housing units with no mortgage in 2022: $1,099 (0.5%)
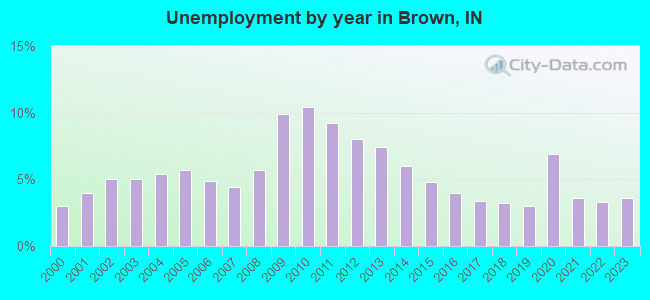
| Brown County: | 8.3% |
| Indiana: | 12.6% |
Median age of residents in 2022: 51.0 years old
(Males: 50.0 years old, Females: 51.4 years old)
(Median age for: White residents: 51.0 years old, Black residents: 23.2 years old, Asian residents: 56.2 years old, Hispanic or Latino residents: 25.6 years old, Other race residents: 19.9 years old)
Area name: Indianapolis, IN HUD Metro FMR Area
Fair market rent in 2006 for a 1-bedroom apartment in Brown County is $567 a month.
Fair market rent for a 2-bedroom apartment is $673 a month.
Fair market rent for a 3-bedroom apartment is $871 a month.
Cities in this county include: Cordry Sweetwater Lakes, Nashville.
2023 air pollution in Brown County:
Ozone (1-hour): 0.029 ppm (standard limit: 0.12 ppm). Below U.S. average.
Neighboring counties: Arapahoe County, Colorado  , Colusa County, California , Callaway County, Missouri , Carroll County, Missouri , Carson City, Nevada .
| Here: | 2.8% |
| Indiana: | 2.8% |
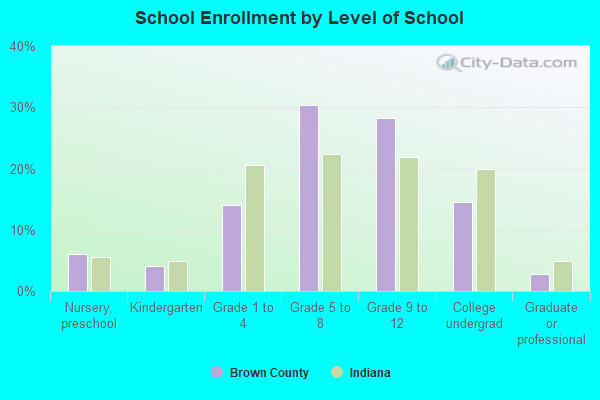
Current college students: 496
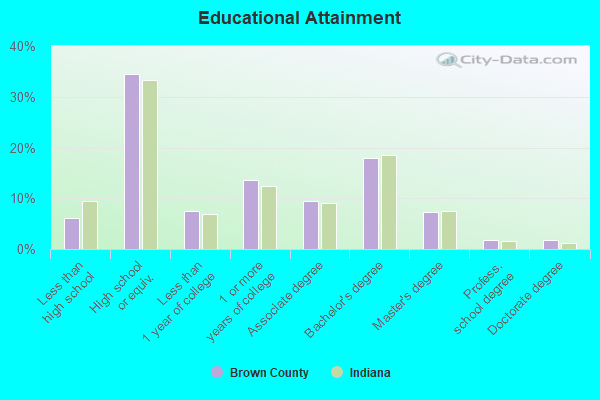
People 25 years of age or older with a high school degree or higher: 92.9%
People 25 years of age or older with a bachelor's degree or higher: 27.5%
Number of foreign born residents: 315 (52.2% naturalized citizens)
| Brown County: | 2.0% |
| Whole state: | 6.1% |
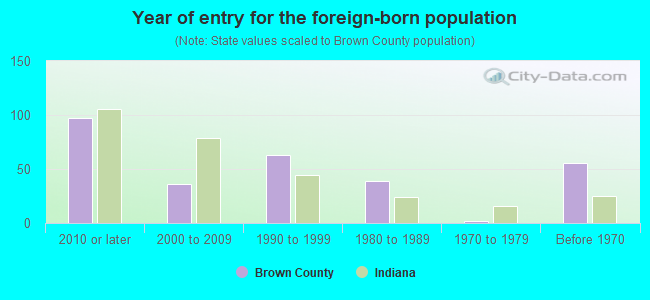
- Year of entry for the foreign-born population
- 1122010 or later
- 472000 to 2009
- 541990 to 1999
- 391980 to 1989
- 21970 to 1979
- 56Before 1970
Mean travel time to work (commute): # minutes
Percentage of county residents living and working in this county: 98.2%
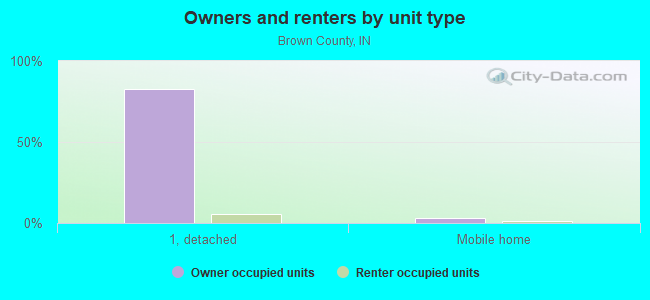
Housing units in structures:
- One, detached: 7,431
- One, attached: 135
- Two: 120
- 3 or 4: 47
- 5 to 9: 58
- 10 to 19: 117
- 20 to 49: 76
- 50 or more: 174
- Mobile homes: 420
- Boats, RVs, vans, etc.: 12
Housing units in Brown County with a mortgage: 3,538 (504 second mortgage, 0 home equity loan, 488 both second mortgage and home equity loan)
Houses without a mortgage: 171
| Here: | 1.7% with mortgage |
| State: | 96.6% with mortgage |
Religion statistics for Brown County
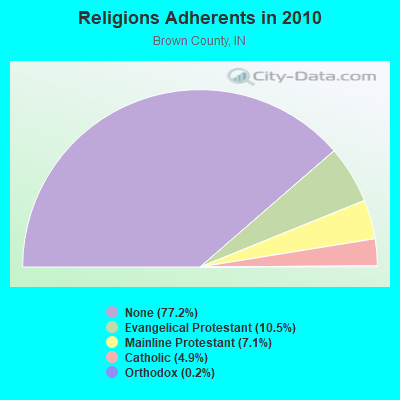
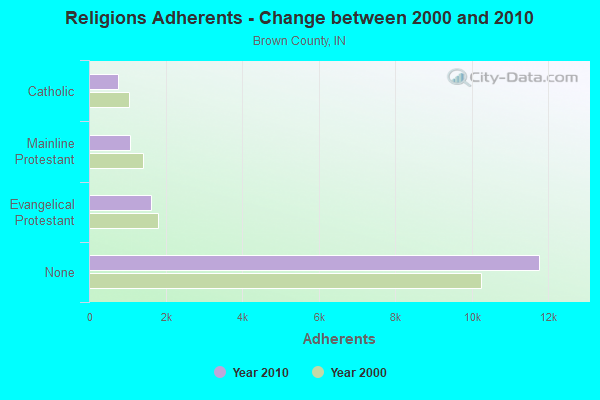
| Religion | Adherents | Congregations |
|---|---|---|
| Evangelical Protestant | 1,607 | 15 |
| Mainline Protestant | 1,080 | 6 |
| Catholic | 750 | 1 |
| Orthodox | 30 | 1 |
| Other | 7 | 2 |
| None | 11,768 | - |
Source: Clifford Grammich, Kirk Hadaway, Richard Houseal, Dale E.Jones, Alexei Krindatch, Richie Stanley and Richard H.Taylor. 2012. 2010 U.S.Religion Census: Religious Congregations & Membership Study. Association of Statisticians of American Religious Bodies. Jones, Dale E., et al. 2002. Congregations and Membership in the United States 2000. Nashville, TN: Glenmary Research Center.
Food Environment Statistics:
| Brown County: | 2.05 / 10,000 pop. |
| State: | 1.73 / 10,000 pop. |
| This county: | 1.37 / 10,000 pop. |
| Indiana: | 0.50 / 10,000 pop. |
| Brown County: | 4.78 / 10,000 pop. |
| Indiana: | 3.57 / 10,000 pop. |
| This county: | 9.56 / 10,000 pop. |
| State: | 6.78 / 10,000 pop. |
| Brown County: | 9.5% |
| Indiana: | 9.2% |
| Brown County: | 27.6% |
| State: | 29.0% |
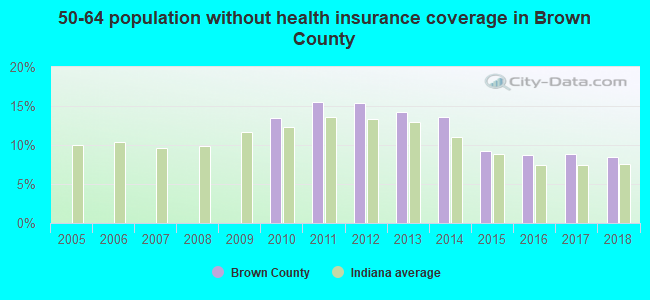
| Here: | 13.7% |
| State: | 14.3% |
Agriculture in Brown County:
Average size of farms: 92 acresAverage value of agricultural products sold per farm: $8,775
Average value of crops sold per acre for harvested cropland: $175.93
The value of nursery, greenhouse, floriculture, and sod as a percentage of the total market value of agricultural products sold: 11.92%
The value of livestock, poultry, and their products as a percentage of the total market value of agricultural products sold: 34.79%
Average total farm production expenses per farm: $14,791
Harvested cropland as a percentage of land in farms: 35.41%
Irrigated harvested cropland as a percentage of land in farms: 0.18%
Average market value of all machinery and equipment per farm: $21,071
The percentage of farms operated by a family or individual: 94.59%
Average age of principal farm operators: 57 years
Average number of cattle and calves per 100 acres of all land in farms: 9.27
Corn for grain: 1830 harvested acres
Soybeans for beans: 1801 harvested acres
Vegetables: 56 harvested acres
Land in orchards: 4 acres
Earthquake activity:
Brown County-area historical earthquake activity is significantly above Indiana state average. It is 101% greater than the overall U.S. average.On 4/18/2008 at 09:36:59, a magnitude 5.4 (5.1 MB, 4.8 MS, 5.4 MW, 5.2 MW, Class: Moderate, Intensity: VI - VII) earthquake occurred 104.7 miles away from Brown County center
On 4/18/2008 at 09:36:59, a magnitude 5.2 (5.2 MW, Depth: 8.9 mi) earthquake occurred 104.7 miles away from the county center
On 6/10/1987 at 23:48:54, a magnitude 5.1 (4.9 MB, 4.4 MS, 4.6 MS, 5.1 LG) earthquake occurred 93.9 miles away from the county center
On 7/27/1980 at 18:52:21, a magnitude 5.2 (5.1 MB, 4.7 MS, 5.0 UK, 5.2 UK) earthquake occurred 141.7 miles away from the county center
On 6/18/2002 at 17:37:15, a magnitude 5.0 (4.3 MB, 4.6 MW, 5.0 LG) earthquake occurred 120.4 miles away from Brown County center
On 4/18/2008 at 15:14:16, a magnitude 4.8 (4.5 MB, 4.8 MW, 4.6 MW, Class: Light, Intensity: IV - V) earthquake occurred 102.0 miles away from the county center
Magnitude types: regional Lg-wave magnitude (LG), body-wave magnitude (MB), surface-wave magnitude (MS), moment magnitude (MW)
Most recent natural disasters:
- Indiana Covid-19 Pandemic, Incident Period: January 31, 2020, FEMA Id: 4515, Natural disaster type: Other
- Indiana Severe Storms and Flooding, Incident Period: May 30, 2008 to June 27, 2008, Major Disaster (Presidential) Declared DR-1766: June 08, 2008, FEMA Id: 1766, Natural disaster type: Storm, Flood
- Indiana Hurricane Katrina Evacuation, Incident Period: August 29, 2005 to October 01, 2005, Emergency Declared EM-3238: September 10, 2005, FEMA Id: 3238, Natural disaster type: Hurricane
- Indiana Severe Winter Storms and Flooding, Incident Period: January 01, 2005 to February 11, 2005, Major Disaster (Presidential) Declared DR-1573: January 21, 2005, FEMA Id: 1573, Natural disaster type: Winter Storm, Flood
- Indiana Snow, Incident Period: December 21, 2004 to December 23, 2004, Emergency Declared EM-3197: January 11, 2005, FEMA Id: 3197, Natural disaster type: Snow
- Indiana Severe Storms, Tornadoes, and Flooding, Incident Period: May 25, 2004 to June 25, 2004, Major Disaster (Presidential) Declared DR-1520: June 03, 2004, FEMA Id: 1520, Natural disaster type: Storm, Tornado, Flood
- Indiana Severe Storms and Tornadoes, Incident Period: September 20, 2002, Major Disaster (Presidential) Declared DR-1433: September 25, 2002, FEMA Id: 1433, Natural disaster type: Storm, Tornado
- Indiana Severe Storms, Tornadoes and Flooding, Incident Period: April 28, 2002 to June 07, 2002, Major Disaster (Presidential) Declared DR-1418: June 13, 2002, FEMA Id: 1418, Natural disaster type: Storm, Tornado, Flood
- Indiana Flooding, Incident Period: April 28, 1996 to May 25, 1996, Major Disaster (Presidential) Declared DR-1125: July 03, 1996, FEMA Id: 1125, Natural disaster type: Flood
- Indiana Blizzard of 96, Incident Period: January 06, 1996 to January 12, 1996, Major Disaster (Presidential) Declared DR-1109: April 02, 1996, FEMA Id: 1109, Natural disaster type: Blizzard
- 3 other natural disasters have been reported since 1953.
The number of natural disasters in Brown County (13) is near the US average (15).
Major Disasters (Presidential) Declared: 10
Emergencies Declared: 2
Causes of natural disasters: Floods: 8, Storms: 6, Tornadoes: 4, Blizzard: 1, Hurricane: 1, Snow: 1, Winter Storm: 1, Other: 1 (Note: some incidents may be assigned to more than one category).
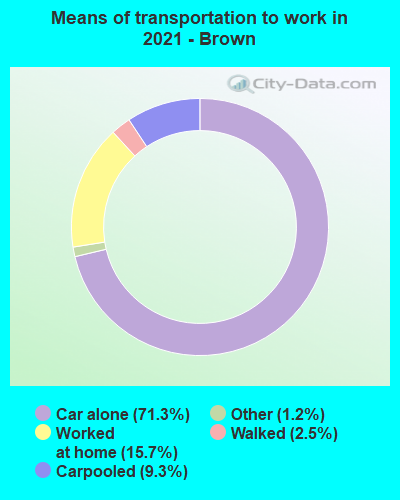
Means of transportation to work:
- Drove a car alone: 2,332 (62.4%)
- Carpooled: 463 (12.4%)
- Bus: 11 (0.3%)
- Taxicab, motorcycle, or other means: 86 (2.3%)
- Walked: 92 (2.5%)
- Worked at home: 888 (23.7%)
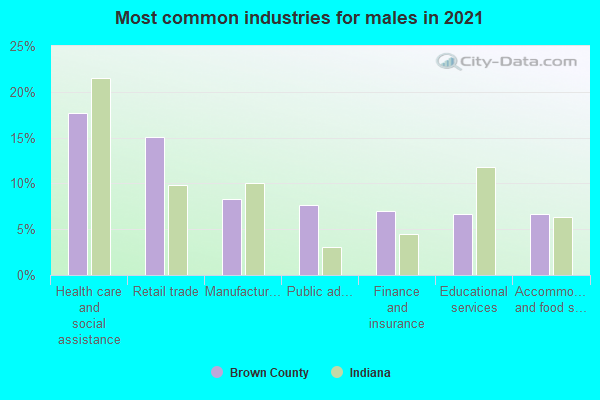
- Health care and social assistance (21%)
- Retail trade (14%)
- Accommodation and food services (8%)
- Manufacturing (7%)
- Public administration (7%)
- Educational services (7%)
- Finance and insurance (5%)

- Health care and social assistance (24%)
- Retail trade (16%)
- Accommodation and food services (9%)
- Manufacturing (8%)
- Public administration (8%)
- Educational services (8%)
- Finance and insurance (6%)
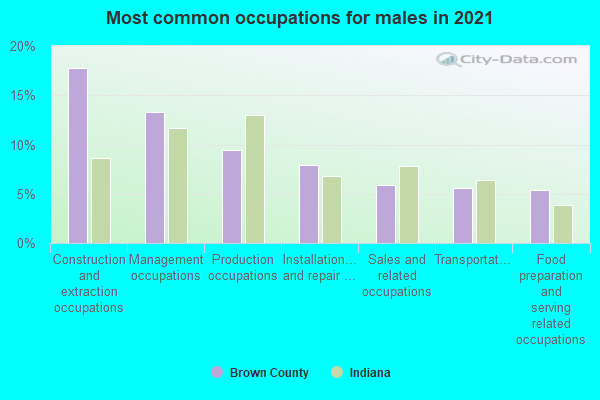
- Construction and extraction occupations (16%)
- Management occupations (14%)
- Production occupations (10%)
- Installation, maintenance, and repair occupations (7%)
- Transportation occupations (6%)
- Architecture and engineering occupations (5%)
- Computer and mathematical occupations (5%)
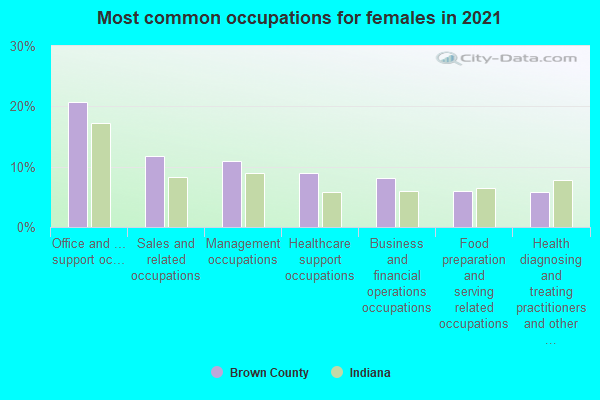
- Office and administrative support occupations (17%)
- Sales and related occupations (11%)
- Healthcare support occupations (10%)
- Health diagnosing and treating practitioners and other technical occupations (9%)
- Management occupations (9%)
- Business and financial operations occupations (8%)
- Food preparation and serving related occupations (6%)
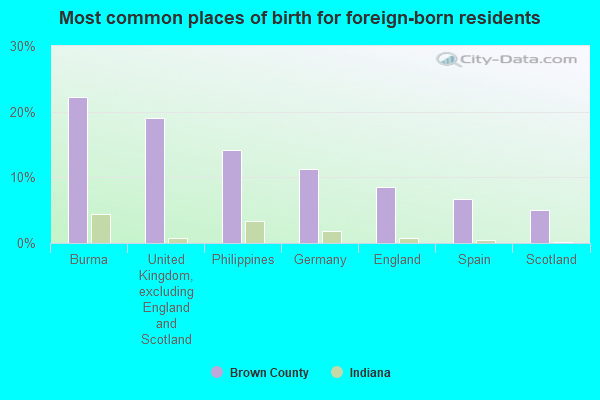
- Burma (Myanmar) (18%)
- United Kingdom, excluding England and Scotland (18%)
- Mexico (13%)
- Philippines (8%)
- Germany (7%)
- Scotland (5%)
- Spain (4%)
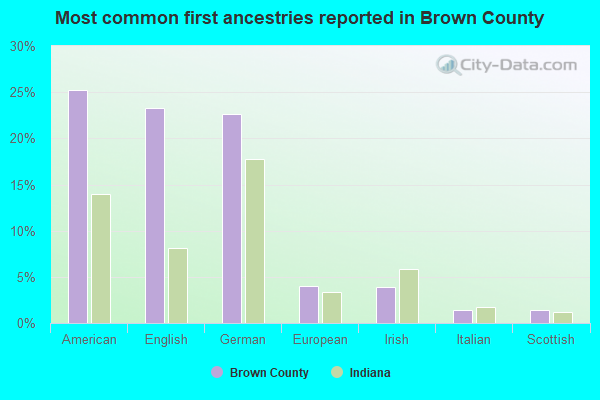
- American (26%)
- German (21%)
- English (19%)
- Irish (5%)
- European (4%)
- Polish (3%)
- Italian (2%)
People in group quarters in Brown County, Indiana in 2010:
- 115 people in nursing facilities/skilled-nursing facilities
- 37 people in other noninstitutional facilities
- 6 people in group homes intended for adults
- 5 people in group homes for juveniles (non-correctional)
People in group quarters in Brown County, Indiana in 2000:
- 92 people in nursing homes
- 35 people in local jails and other confinement facilities (including police lockups)
- 12 people in other group homes
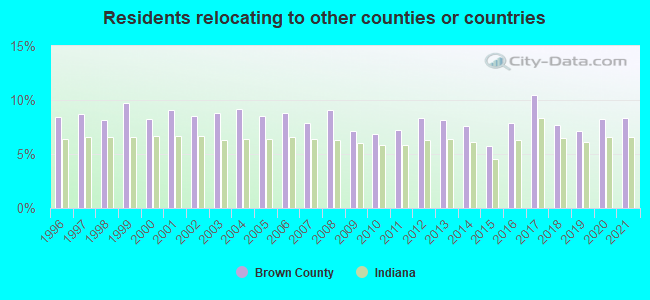
9.00% of this county's 2021 resident taxpayers lived in other counties in 2020 ($72,418 average adjusted gross income)
| Here: | 9.00% |
| Indiana average: | 6.66% |
10 or fewer of this county's residents moved from foreign countries.
7.28% relocated from other counties in Indiana ($55,542 average AGI)
1.73% relocated from other states ($16,876 average AGI)
Brown County: 1.73% Indiana average: 2.58%

Top counties from which taxpayers relocated into this county between 2020 and 2021:
| from Johnson County, IN | |
| from Marion County, IN | |
| from Bartholomew County, IN | |
| from Monroe County, IN | |
| from Morgan County, IN |
8.36% of this county's 2020 resident taxpayers moved to other counties in 2021 ($50,814 average adjusted gross income)
| Here: | 8.36% |
| Indiana average: | 6.55% |
10 or fewer of this county's residents moved to foreign countries.
6.76% relocated to other counties in Indiana ($40,157 average AGI)
1.60% relocated to other states ($10,659 average AGI)
Brown County: 1.60% Indiana average: 2.46%
Top counties to which taxpayers relocated from this county between 2020 and 2021:
| to Bartholomew County, IN | |
| to Johnson County, IN | |
| to Monroe County, IN | |
| to Morgan County, IN | |
| to Marion County, IN | |
| to Jackson County, IN |
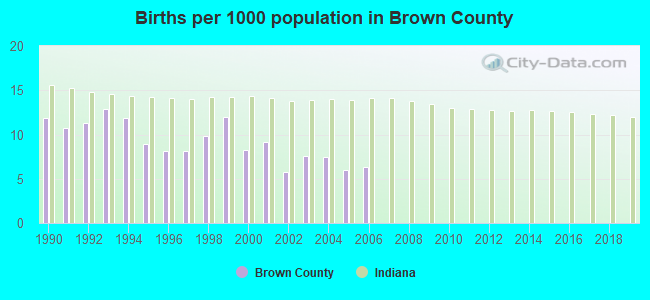
Births per 1000 population from 1990 to 1999: 10.6
Births per 1000 population from 2000 to 2006: 7.2
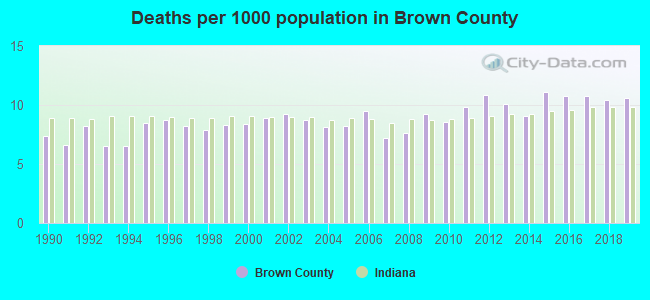
Deaths per 1000 population from 1990 to 1999: 7.7
Deaths per 1000 population from 2000 to 2009: 8.5
Deaths per 1000 population from 2010 to 2020: 10.5
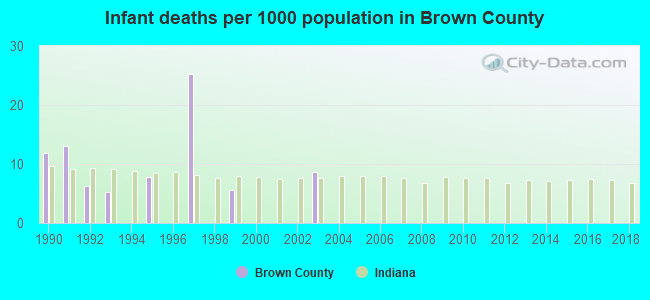
Infant deaths per 1000 live births from 1990 to 1999: 7.5
Infant deaths per 1000 live births from 2000 to 2006: 1.2
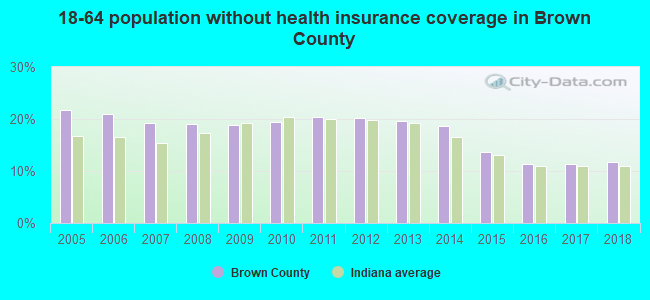
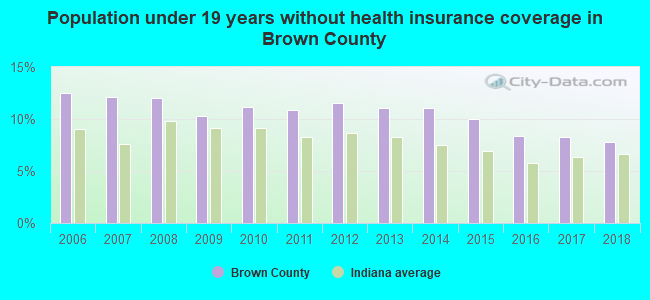
Persons under 19 years old without health insurance coverage in 2018: 7.8%
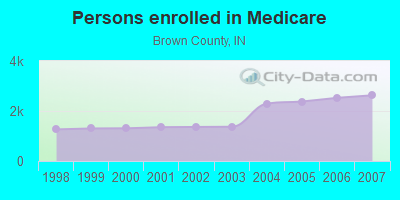
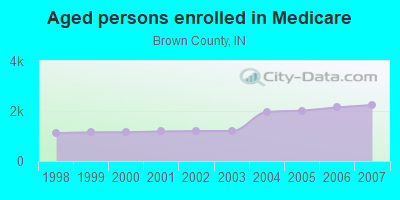
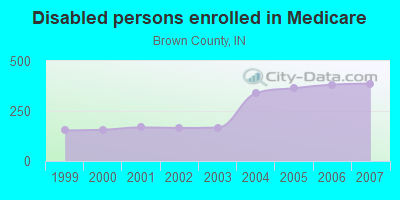
Persons enrolled in hospital insurance and/or supplemental medical insurance (Medicare) in July 1, 2007: 2,628 (2,241 aged, 387 disabled)
Children under 18 without health insurance coverage in 2007: 328 (12%)
Most common underlying causes of death in Brown County, Indiana in 1999 - 2019:
- Bronchus or lung, unspecified - Malignant neoplasms (179)
- Acute myocardial infarction, unspecified (139)
- Chronic obstructive pulmonary disease, unspecified (42)
- Unspecified dementia (25)
- Pure hypercholesterolaemia (22)
- Atherosclerotic heart disease (10)
- Other lack of expected normal physiological development (10)
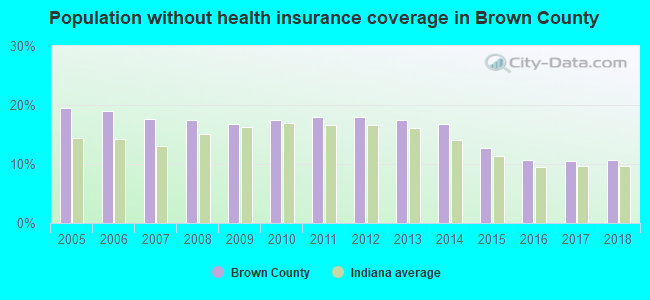
Population without health insurance coverage in 2000: 11%
Children under 18 without health insurance coverage in 2000: 10%
Medical specialist MDs per 100,000 population in 2005: 845
Dentists per 100,000 population in 1998: 7
Total births per 100,000 population, July 2005 - July 2006 : 6
Total deaths per 100,000 population, July 2005 - July 2006: 79
Household type by relationship:
Households: 15,624- Male householders: 3,390 (588 living alone), Female householders: 3,369 (828 living alone)
4,360 spouses (4,217 opposite-sex spouses), 269 unmarried partners, (261 opposite-sex unmarried partners), 3,154 children (2,644 natural, 111 adopted, 405 stepchildren), 406 grandchildren, 54 brothers or sisters, 35 parents, 14 foster children, 149 other relatives, 364 non-relatives
- In group quarters: 145
Size of family households: 3,024 2-persons, 932 3-persons, 704 4-persons, 252 5-persons, 153 6-persons, 63 7-or-more-persons.
Size of nonfamily households: 1,417 1-person, 196 2-persons, 5 3-persons, 15 4-persons.
1,802 married couples with children.
388 single-parent households (117 men, 271 women).
97.8% of residents of Brown speak English at home.
1.0% of residents speak Spanish at home (93% speak English very well, 7% speak English not well).
0.3% of residents speak other Indo-European language at home (92% speak English very well, 8% speak English not well).
0.5% of residents speak Asian or Pacific Island language at home (26% speak English very well, 4% speak English well, 70% speak English not well).
In fiscal year 2004:
Federal Government expenditure: $41,861,000 ($2,749 per capita)
Department of Defense expenditure: $702,000
Federal direct payments to individuals for retirement and disability: $24,437,000
Federal other direct payments to individuals: $8,021,000
Federal direct payments not to individuals: $218,000
Federal grants: $7,777,000
Federal procurement contracts: $288,000 ($3,000 Department of Defense)
Federal salaries and wages: $1,120,000 ($0,000 Department of Defense)
Federal Government direct loans: $4,000
Federal guaranteed/insured loans: $4,950,000
Federal Government insurance: $11,279,000
Population change from April 1, 2000 to July 1, 2005:
Births: 794| Here: | 52 per 1000 residents |
| State: | 72 per 1000 residents |
Deaths: 741
| Here: | 49 per 1000 residents |
| State: | 47 per 1000 residents |
Net international migration: +37
| Here: | +2 per 1000 residents |
| State: | +9 per 1000 residents |
Net internal migration: +136
| Here: | |
| State: |
Total withdrawal of fresh water for public supply: 0.00 millions of gallons per day (all from surface)
| Here: | 6.0 |
| State: | 6.6 |
| Here: | 4.3 |
| State: | 4.3 |
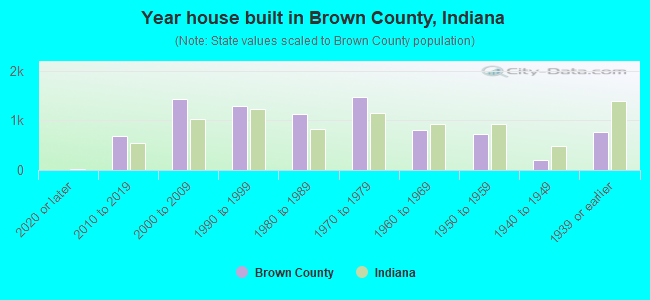
- Year house built in Brown County, Indiana
- 42020 or later
- 8302010 to 2019
- 1,3082000 to 2009
- 1,1731990 to 1999
- 1,2031980 to 1989
- 1,3671970 to 1979
- 9361960 to 1969
- 7671950 to 1959
- 1901940 to 1949
- 7751939 or earlier
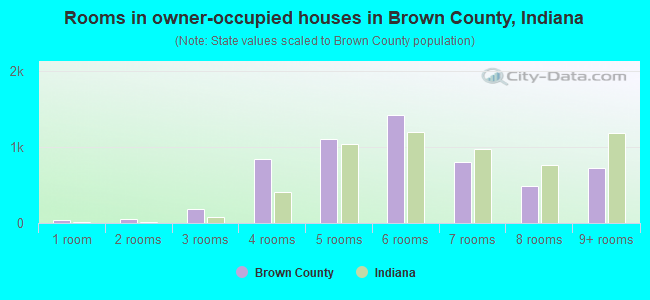
- Rooms in owner-occupied houses in Brown County, Indiana
- 161 room
- 792 rooms
- 2243 rooms
- 8284 rooms
- 1,1415 rooms
- 1,4406 rooms
- 7747 rooms
- 4898 rooms
- 8789+ rooms
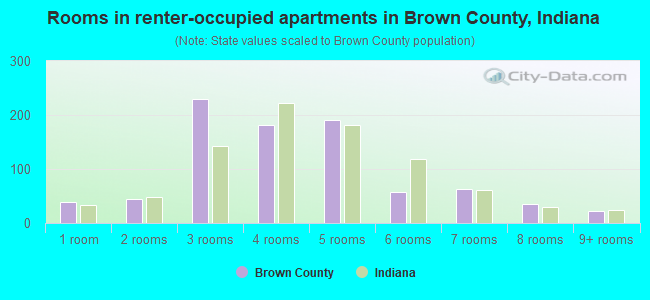
- Rooms in renter-occupied apartments in Brown County, Indiana
- 101 room
- 332 rooms
- 2373 rooms
- 2324 rooms
- 2195 rooms
- 716 rooms
- 727 rooms
- 408 rooms
- 309+ rooms
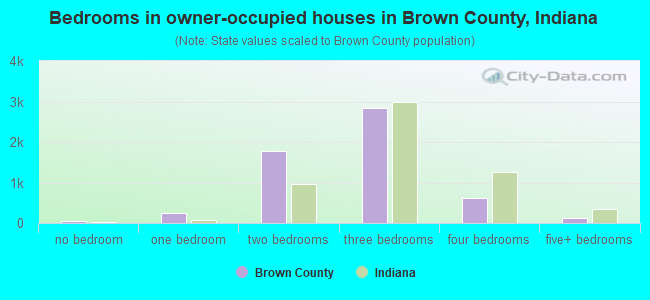
- Bedrooms in owner-occupied houses in Brown County, Indiana
- 34no bedroom
- 2621 bedroom
- 1,9562 bedrooms
- 2,7663 bedrooms
- 6694 bedrooms
- 1585+ bedrooms
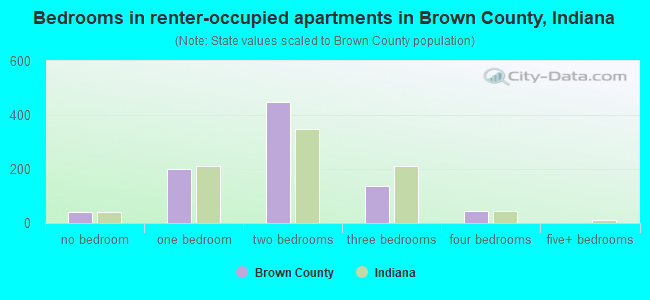
- Bedrooms in renter-occupied apartments in Brown County, Indiana
- 10no bedroom
- 1871 bedroom
- 5062 bedrooms
- 2063 bedrooms
- 434 bedrooms
- 05+ bedrooms
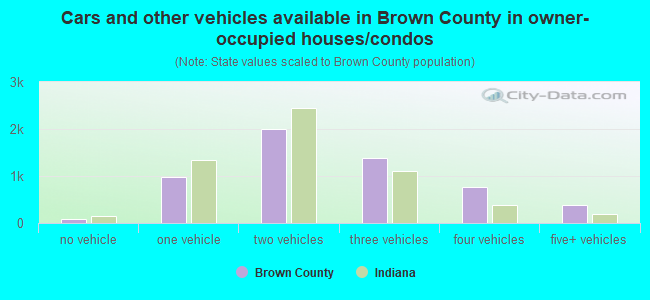
- Cars and other vehicles available in Brown County in owner-occupied houses/condos
- 180no vehicle
- 9941 vehicle
- 2,2102 vehicles
- 1,3823 vehicles
- 7134 vehicles
- 3395+ vehicles
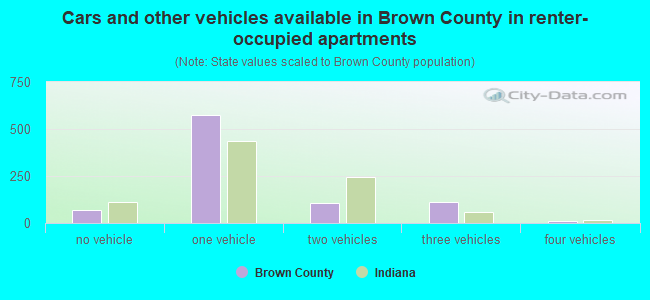
- Cars and other vehicles available in Brown County in renter-occupied apartments
- 80no vehicle
- 6101 vehicle
- 1572 vehicles
- 893 vehicles
- 154 vehicles
- 05+ vehicles
90.4% of Brown County residents lived in the same house 1 years ago.
Out of people who lived in different houses, 25% lived in this county.
Out of people who lived in different counties, 68% lived in Indiana.
| Brown County: | 90.4% |
| State average: | 87.1% |
Place of birth for U.S.-born residents:
- This state: 11,497
- Other state: 3,650
- Northeast: 222
- Midwest: 1,968
- South: 1,094
- West: 364
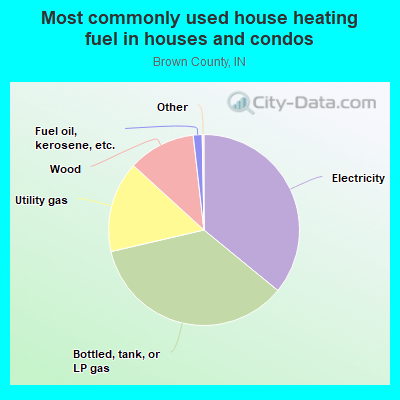
- 35.1%Electricity
- 34.5%Bottled, tank, or LP gas
- 16.8%Utility gas
- 10.9%Wood
- 2.2%Fuel oil, kerosene, etc.
- 0.3%Other fuel
- 0.2%No fuel used
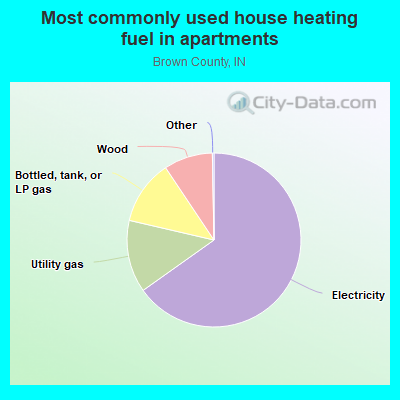
- 66.0%Electricity
- 13.1%Bottled, tank, or LP gas
- 12.0%Utility gas
- 8.9%Wood
Private vs. public school enrollment:
| Here: | 9.1% |
| Indiana: | 14.9% |
| Here: | 12.4% |
| Indiana: | 11.4% |
| Here: | 8.0% |
| Indiana: | 22.3% |
Brown County government finances - Expenditure in 2017:
- Bond Funds - Cash and Securities: $3,431,000
- Charges - Other: $1,779,000
Parks and Recreation: $96,000
- Construction - General - Other: $730,000
Regular Highways: $222,000
- Current Operations - Central Staff Services: $2,521,000
General - Other: $1,890,000
Regular Highways: $1,442,000
Judicial and Legal Services: $976,000
Parks and Recreation: $942,000
Police Protection: $799,000
Health - Other: $598,000
Financial Administration: $590,000
Correctional Institutions: $565,000
Corrections - Other: $212,000
Natural Resources - Other: $129,000
Local Fire Protection: $12,000
- Federal Intergovernmental - Other: $9,000
- General - Interest on Debt: $87,000
- Local Intergovernmental - Highways: $186,000
- Long Term Debt - Outstanding Unspecified Public Purpose: $2,180,000
Beginning Outstanding - Unspecified Public Purpose: $2,180,000
- Miscellaneous - General Revenue - Other: $799,000
Fines and Forfeits: $116,000
Interest Earnings: $63,000
Donations From Private Sources: $37,000
Rents: $2,000
- Other Capital Outlay - Regular Highways: $149,000
Parks and Recreation: $11,000
Health - Other: $1,000
Judicial and Legal Services: $1,000
- Other Funds - Cash and Securities: $10,470,000
- Sinking Funds - Cash and Securities: $31,000
- State Intergovernmental - General Local Government Support: $2,228,000
Other: $1,707,000
Highways: $176,000
- Tax - Property: $6,165,000
Public Utilities Sales: $287,000
Other License: $108,000
Brown County government finances - Revenue in 2017:
- Bond Funds - Cash and Securities: $3,431,000
- Charges - Other: $1,779,000
Parks and Recreation: $96,000
- Construction - General - Other: $730,000
Regular Highways: $222,000
- Current Operations - Central Staff Services: $2,521,000
General - Other: $1,890,000
Regular Highways: $1,442,000
Judicial and Legal Services: $976,000
Parks and Recreation: $942,000
Police Protection: $799,000
Health - Other: $598,000
Financial Administration: $590,000
Correctional Institutions: $565,000
Corrections - Other: $212,000
Natural Resources - Other: $129,000
Local Fire Protection: $12,000
- Federal Intergovernmental - Other: $9,000
- General - Interest on Debt: $87,000
- Local Intergovernmental - Highways: $186,000
- Long Term Debt - Outstanding Unspecified Public Purpose: $2,180,000
Beginning Outstanding - Unspecified Public Purpose: $2,180,000
- Miscellaneous - General Revenue - Other: $799,000
Fines and Forfeits: $116,000
Interest Earnings: $63,000
Donations From Private Sources: $37,000
Rents: $2,000
- Other Capital Outlay - Regular Highways: $149,000
Parks and Recreation: $11,000
Health - Other: $1,000
Judicial and Legal Services: $1,000
- Other Funds - Cash and Securities: $10,470,000
- Sinking Funds - Cash and Securities: $31,000
- State Intergovernmental - General Local Government Support: $2,228,000
Other: $1,707,000
Highways: $176,000
- Tax - Property: $6,165,000
Public Utilities Sales: $287,000
Other License: $108,000
Brown County government finances - Debt in 2017:
- Bond Funds - Cash and Securities: $3,431,000
- Charges - Other: $1,779,000
Parks and Recreation: $96,000
- Construction - General - Other: $730,000
Regular Highways: $222,000
- Current Operations - Central Staff Services: $2,521,000
General - Other: $1,890,000
Regular Highways: $1,442,000
Judicial and Legal Services: $976,000
Parks and Recreation: $942,000
Police Protection: $799,000
Health - Other: $598,000
Financial Administration: $590,000
Correctional Institutions: $565,000
Corrections - Other: $212,000
Natural Resources - Other: $129,000
Local Fire Protection: $12,000
- Federal Intergovernmental - Other: $9,000
- General - Interest on Debt: $87,000
- Local Intergovernmental - Highways: $186,000
- Long Term Debt - Outstanding Unspecified Public Purpose: $2,180,000
Beginning Outstanding - Unspecified Public Purpose: $2,180,000
- Miscellaneous - General Revenue - Other: $799,000
Fines and Forfeits: $116,000
Interest Earnings: $63,000
Donations From Private Sources: $37,000
Rents: $2,000
- Other Capital Outlay - Regular Highways: $149,000
Parks and Recreation: $11,000
Health - Other: $1,000
Judicial and Legal Services: $1,000
- Other Funds - Cash and Securities: $10,470,000
- Sinking Funds - Cash and Securities: $31,000
- State Intergovernmental - General Local Government Support: $2,228,000
Other: $1,707,000
Highways: $176,000
- Tax - Property: $6,165,000
Public Utilities Sales: $287,000
Other License: $108,000
Brown County government finances - Cash and Securities in 2017:
- Bond Funds - Cash and Securities: $3,431,000
- Charges - Other: $1,779,000
Parks and Recreation: $96,000
- Construction - General - Other: $730,000
Regular Highways: $222,000
- Current Operations - Central Staff Services: $2,521,000
General - Other: $1,890,000
Regular Highways: $1,442,000
Judicial and Legal Services: $976,000
Parks and Recreation: $942,000
Police Protection: $799,000
Health - Other: $598,000
Financial Administration: $590,000
Correctional Institutions: $565,000
Corrections - Other: $212,000
Natural Resources - Other: $129,000
Local Fire Protection: $12,000
- Federal Intergovernmental - Other: $9,000
- General - Interest on Debt: $87,000
- Local Intergovernmental - Highways: $186,000
- Long Term Debt - Outstanding Unspecified Public Purpose: $2,180,000
Beginning Outstanding - Unspecified Public Purpose: $2,180,000
- Miscellaneous - General Revenue - Other: $799,000
Fines and Forfeits: $116,000
Interest Earnings: $63,000
Donations From Private Sources: $37,000
Rents: $2,000
- Other Capital Outlay - Regular Highways: $149,000
Parks and Recreation: $11,000
Health - Other: $1,000
Judicial and Legal Services: $1,000
- Other Funds - Cash and Securities: $10,470,000
- Sinking Funds - Cash and Securities: $31,000
- State Intergovernmental - General Local Government Support: $2,228,000
Other: $1,707,000
Highways: $176,000
- Tax - Property: $6,165,000
Public Utilities Sales: $287,000
Other License: $108,000
Supplemental Security Income (SSI) in 2006:
- Total number of recipients: 155
- Number of aged recipients: 14
- Number of blind and disabled recipients: 141
- Number of recipients under 18: 37
- Number of recipients between 18 and 64: 95
- Number of recipients older than 64: 23
- Number of recipients also receiving OASDI: 49
- Amount of payments (thousands of dollars): 74
| Most common first names in Brown County, IN among deceased individuals | ||
| Name | Count | Lived (average) |
|---|---|---|
| Mary | 59 | 82.7 years |
| William | 50 | 76.2 years |
| Robert | 46 | 72.5 years |
| James | 43 | 72.6 years |
| John | 41 | 74.0 years |
| Charles | 38 | 71.1 years |
| Ruth | 21 | 83.4 years |
| Helen | 19 | 78.6 years |
| Richard | 19 | 71.9 years |
| Paul | 18 | 68.8 years |
| Most common last names in Brown County, IN among deceased individuals | ||
| Last name | Count | Lived (average) |
|---|---|---|
| Smith | 33 | 81.6 years |
| Miller | 18 | 74.9 years |
| Roberts | 18 | 73.6 years |
| Brown | 17 | 76.4 years |
| Johnson | 15 | 79.5 years |
| Robertson | 14 | 79.0 years |
| Moore | 13 | 79.5 years |
| Lucas | 12 | 73.2 years |
| Percifield | 12 | 74.4 years |
| Henderson | 12 | 75.2 years |
| Businesses in Brown County, IN | ||||
| Name | Count | Name | Count | |
|---|---|---|---|---|
| CVS | 1 | McDonald's | 1 | |
| Comfort Inn | 1 | UPS | 1 | |
| H&R Block | 1 | YMCA | 1 | |