Brule County, South Dakota (SD)
County owner-occupied free and clear houses and condos in 2010: 752
County owner-occupied houses and condos in 2000: 1,422
Renter-occupied apartments: 627 (it was 576 in 2000)
| % of renters here: | 29% |
| State: | 32% |
Land area: 819 sq. mi.
Water area: 27.5 sq. mi.
Population density: 7 people per square mile (very low).
Industries providing employment: Educational, health and social services (31.4%), Agriculture,forestry,fishing and hunting, and mining (17.7%).
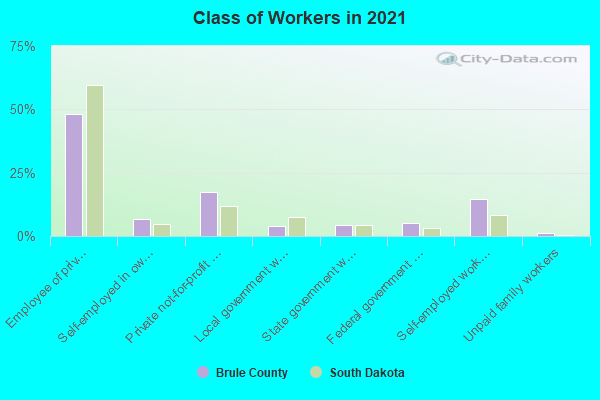
Type of workers:
- Private wage or salary: 66%
- Government: 17%
- Self-employed, not incorporated: 16%
- Unpaid family work: 1%
- OSM Map
- General Map
- Google Map
- MSN Map

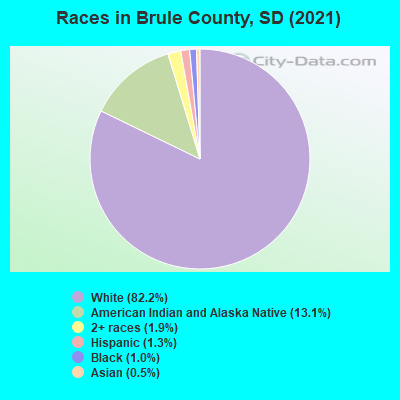
- 4,31280.9%White Non-Hispanic Alone
- 61811.6%American Indian and Alaska Native alone
- 2334.4%Two or more races
- 1011.9%Hispanic or Latino
- 641.2%Black Non-Hispanic Alone
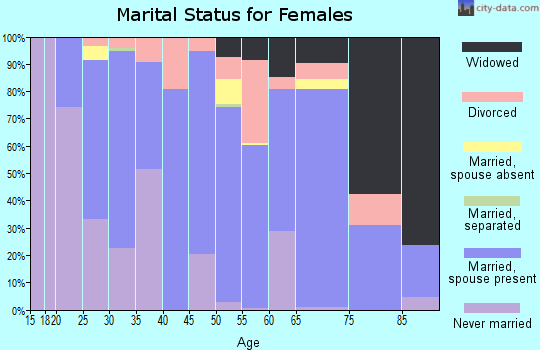
| Median resident age: | 42.6 years |
| South Dakota median age: | 38.5 years |
| Males: 2,739 | |
| Females: 2,622 |

 | Buffalo County, South Dakota- one of the poorest places in america (15 replies) |
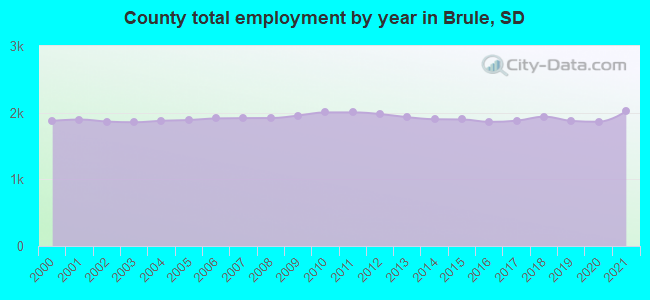
| Brule County: | 2.0 people |
| South Dakota: | 2 people |
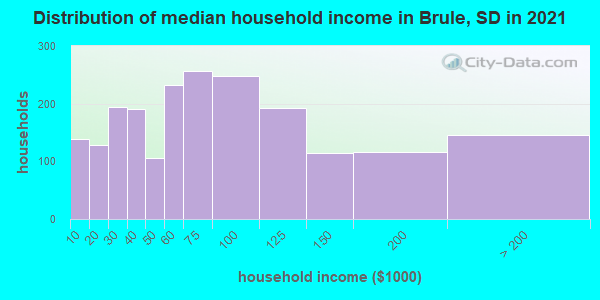
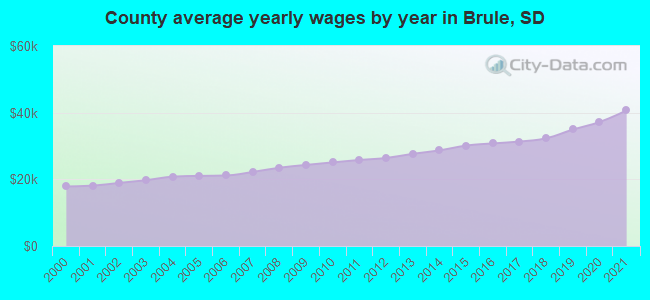
Estimated median household income in 2022: $65,073 ($32,370 in 1999)
| This county: | $65,073 |
| South Dakota: | $69,728 |
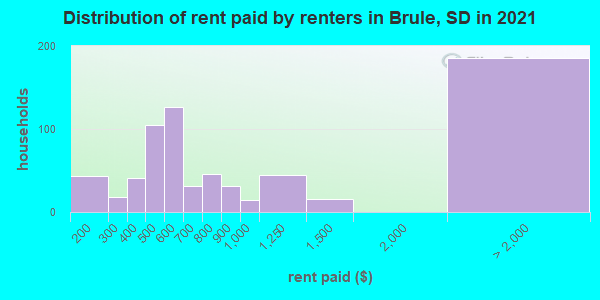
Median contract rent in 2022 for apartments: $536 (lower quartile is $346, upper quartile is $725)
| This county: | $536 |
| State: | $747 |
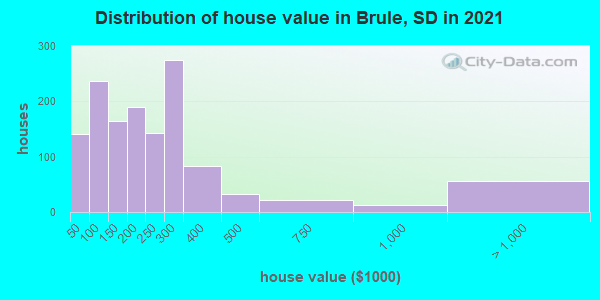
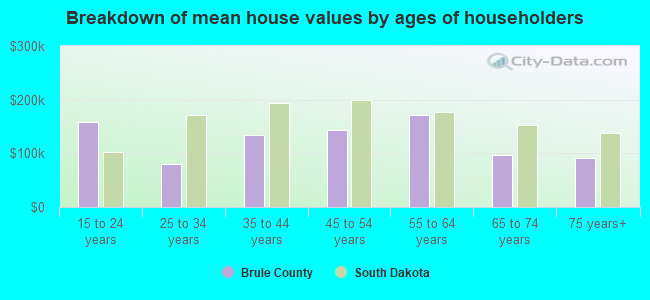
Estimated median house or condo value in 2022: $209,729 (it was $61,800 in 2000)
| Brule: | $209,729 |
| South Dakota: | $245,000 |
Mean price in 2022:
Median monthly housing costs for homes and condos with a mortgage: $1,291Detached houses: $211,728
Here: $211,728 State: $303,134 Townhouses or other attached units: $177,768
Here: $177,768 State: $292,182 Mobile homes: $71,130
Here: $71,130 State: $82,732
Median monthly housing costs for units without a mortgage: $553
Institutionalized population: 102
Crime in 2021 (reported by the sheriff's office or county police, not the county total):
- Murders: 0
- Rapes: 0
- Robberies: 0
- Assaults: 0
- Burglaries: 0
- Thefts: 0
- Auto thefts: 0
Crime in 2020 (reported by the sheriff's office or county police, not the county total):
- Murders: 0
- Rapes: 0
- Robberies: 0
- Assaults: 1
- Burglaries: 0
- Thefts: 4
- Auto thefts: 1

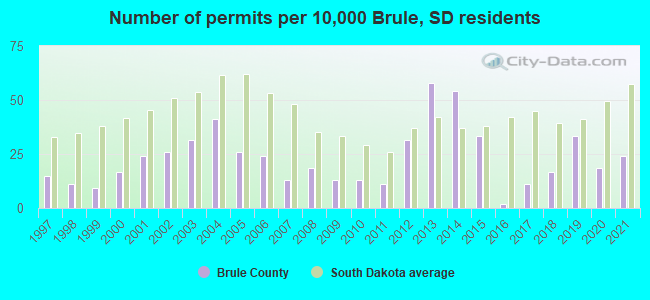
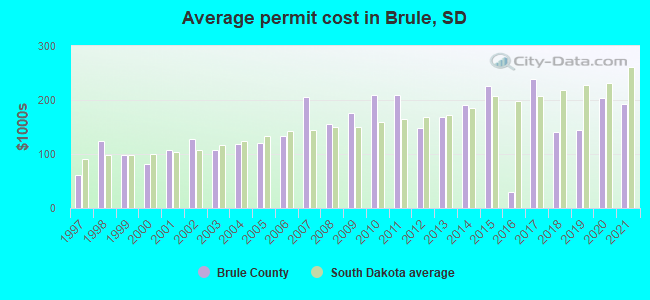
Single-family new house construction building permits:
- 2022: 21 buildings, average cost: $202,000
- 2021: 13 buildings, average cost: $193,100
- 2020: 10 buildings, average cost: $203,900
- 2019: 18 buildings, average cost: $144,200
- 2018: 9 buildings, average cost: $140,600
- 2017: 6 buildings, average cost: $238,300
- 2016: 1 building, cost: $30,000
- 2015: 18 buildings, average cost: $225,700
- 2014: 29 buildings, average cost: $191,000
- 2013: 31 buildings, average cost: $168,200
- 2012: 17 buildings, average cost: $148,500
- 2011: 6 buildings, average cost: $209,300
- 2010: 7 buildings, average cost: $209,300
- 2009: 7 buildings, average cost: $175,600
- 2008: 10 buildings, average cost: $155,400
- 2007: 7 buildings, average cost: $205,100
- 2006: 13 buildings, average cost: $133,900
- 2005: 14 buildings, average cost: $119,500
- 2004: 22 buildings, average cost: $119,000
- 2003: 17 buildings, average cost: $107,400
- 2002: 14 buildings, average cost: $126,900
- 2001: 13 buildings, average cost: $107,500
- 2000: 9 buildings, average cost: $80,700
- 1999: 5 buildings, average cost: $97,600
- 1998: 6 buildings, average cost: $124,700
- 1997: 8 buildings, average cost: $61,100
Median real estate property taxes paid for housing units with mortgages in 2022: $1,871 (0.9%)
Median real estate property taxes paid for housing units with no mortgage in 2022: $1,476 (0.7%)
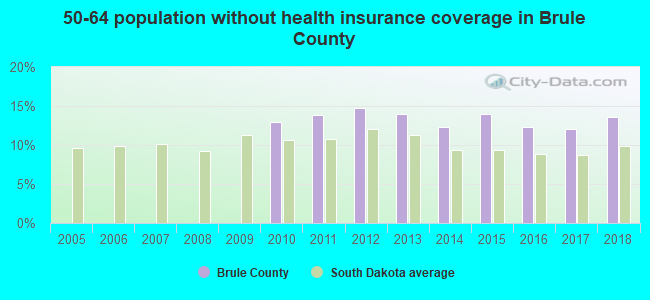
| Brule County: | 14.2% |
| South Dakota: | 12.5% |
Median age of residents in 2022: 42.6 years old
(Males: 41.7 years old, Females: 43.6 years old)
(Median age for: White residents: 48.4 years old, Black residents: 74.0 years old, American Indian residents: 24.0 years old, Hispanic or Latino residents: 41.7 years old)
Fair market rent in 2006 for a 1-bedroom apartment in Brule County is $368 a month.
Fair market rent for a 2-bedroom apartment is $484 a month.
Fair market rent for a 3-bedroom apartment is $620 a month.
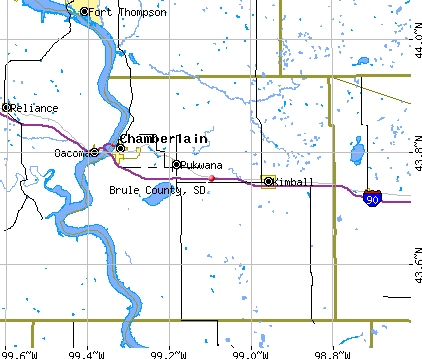
Cities in this county include: Chamberlain, Kimball, Pukwana, Ola, Bijou Hills.
Neighboring counties: Caledonia County, Vermont  , Blaine County, Idaho
  , Dodge County, Wisconsin , Huron County, Michigan .
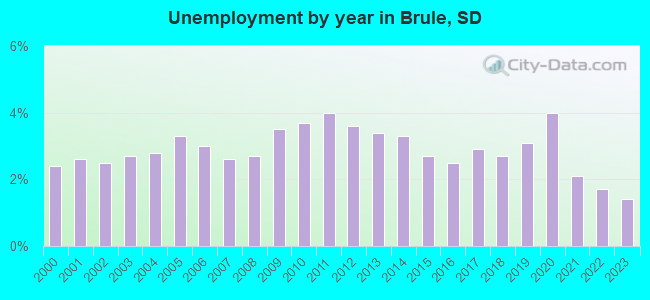
| Here: | 1.6% |
| South Dakota: | 2.0% |
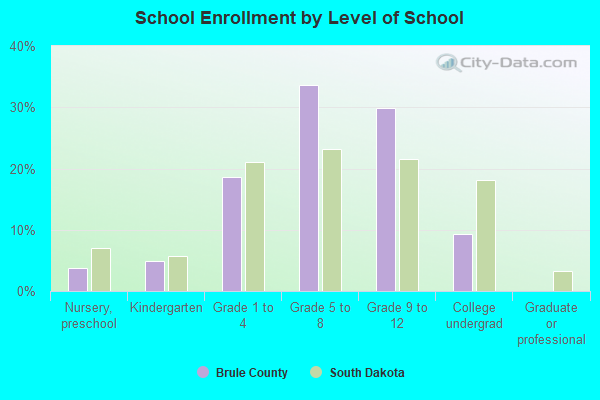
Current college students: 78
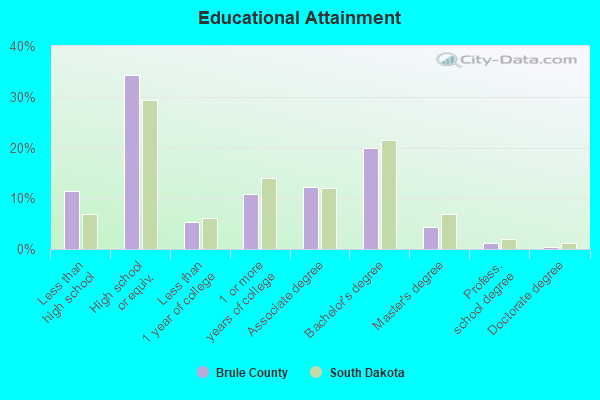
People 25 years of age or older with a high school degree or higher: 85.8%
People 25 years of age or older with a bachelor's degree or higher: 25.7%
Number of foreign born residents: 52 (74.4% naturalized citizens)
| Brule County: | 1.0% |
| Whole state: | 3.5% |
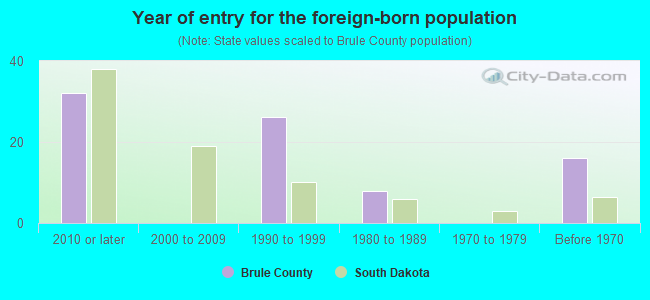
- Year of entry for the foreign-born population
- 322010 or later
- 02000 to 2009
- 41990 to 1999
- 81980 to 1989
- 01970 to 1979
- 16Before 1970
Mean travel time to work (commute): minutes
Percentage of county residents living and working in this county: 99.4%
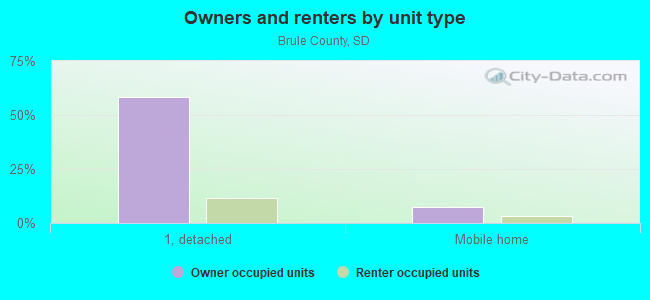
Housing units in structures:
- One, detached: 1,755
- One, attached: 46
- Two: 12
- 3 or 4: 113
- 5 to 9: 135
- 10 to 19: 135
- 20 or more: 21
- Mobile homes: 189
- Boats, RVs, vans, etc.: 4
Housing units in Brule County with a mortgage: 478 (43 second mortgage, 0 home equity loan, 46 both second mortgage and home equity loan)
Houses without a mortgage: 8
| Here: | 98.4% with mortgage |
| State: | 98.3% with mortgage |
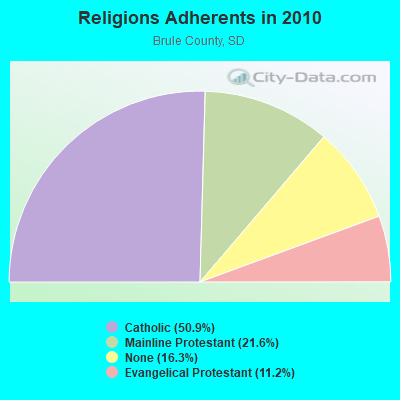
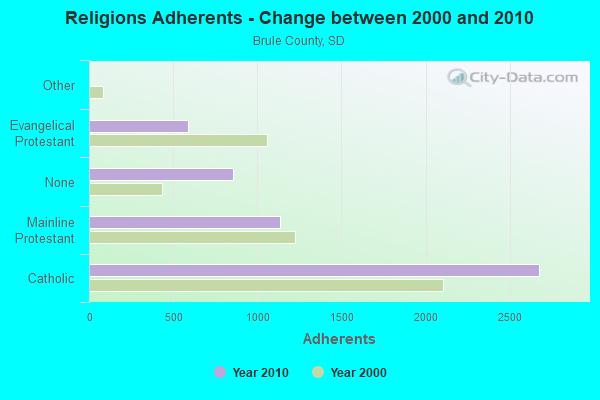
Religion statistics for Brule County
| Religion | Adherents | Congregations |
|---|---|---|
| Catholic | 2,676 | 3 |
| Mainline Protestant | 1,135 | 7 |
| Evangelical Protestant | 586 | 5 |
| Other | 2 | 1 |
| None | 856 | - |
Source: Clifford Grammich, Kirk Hadaway, Richard Houseal, Dale E.Jones, Alexei Krindatch, Richie Stanley and Richard H.Taylor. 2012. 2010 U.S.Religion Census: Religious Congregations & Membership Study. Association of Statisticians of American Religious Bodies. Jones, Dale E., et al. 2002. Congregations and Membership in the United States 2000. Nashville, TN: Glenmary Research Center.
Food Environment Statistics:
| Brule County: | 5.79 / 10,000 pop. |
| State: | 2.84 / 10,000 pop. |
| Brule County: | 15.44 / 10,000 pop. |
| South Dakota: | 6.68 / 10,000 pop. |
| This county: | 13.51 / 10,000 pop. |
| State: | 9.21 / 10,000 pop. |
| Brule County: | 7.6% |
| South Dakota: | 7.7% |
| Brule County: | 28.6% |
| State: | 27.7% |
| Here: | 18.5% |
| State: | 14.9% |
Agriculture in Brule County:
Average size of farms: 1225 acresAverage value of agricultural products sold per farm: $139,627
Average value of crops sold per acre for harvested cropland: $66.67
The value of nursery, greenhouse, floriculture, and sod as a percentage of the total market value of agricultural products sold: 0.00%
The value of livestock, poultry, and their products as a percentage of the total market value of agricultural products sold: 75.81%
Average total farm production expenses per farm: $132,135
Harvested cropland as a percentage of land in farms: 41.38%
Irrigated harvested cropland as a percentage of land in farms: 1.43%
Average market value of all machinery and equipment per farm: $115,520
The percentage of farms operated by a family or individual: 85.48%
Average age of principal farm operators: 53 years
Average number of cattle and calves per 100 acres of all land in farms: 16.57
Milk cows as a percentage of all cattle and calves: 0.70%
Corn for grain: 28875 harvested acres
All wheat for grain: 25081 harvested acres
Soybeans for beans: 39941 harvested acres
Earthquake activity:
Brule County-area historical earthquake activity is significantly above South Dakota state average. It is 222% greater than the overall U.S. average.On 8/18/1959 at 06:37:13, a magnitude 7.7 (7.7 UK, Class: Major, Intensity: VIII - XII) earthquake occurred 575.7 miles away from Brule County center, causing $26,000,000 total damage
On 3/4/1983 at 06:32:18, a magnitude 4.6 (4.4 MB, 4.6 LG, 4.4 ML, Class: Light, Intensity: IV - V) earthquake occurred 35.6 miles away from the county center
On 11/3/2002 at 20:41:56, a magnitude 4.3 (4.3 MB, Depth: 3.1 mi) earthquake occurred 68.8 miles away from the county center
On 10/18/1984 at 15:30:23, a magnitude 5.5 (5.4 MB, 5.1 MS, 5.5 ML, Class: Moderate, Intensity: VI - VII) earthquake occurred 340.0 miles away from the county center
On 10/25/1990 at 06:25:25, a magnitude 3.9 (3.6 MB, 3.9 LG, Depth: 3.1 mi, Class: Light, Intensity: II - III) earthquake occurred 31.4 miles away from Brule County center
On 7/9/1975 at 14:54:15, a magnitude 4.6 (4.6 MB) earthquake occurred 200.4 miles away from the county center
Magnitude types: regional Lg-wave magnitude (LG), body-wave magnitude (MB), local magnitude (ML), surface-wave magnitude (MS)
Most recent natural disasters:
- South Dakota Covid-19 Pandemic, Incident Period: January 20, 2020, FEMA Id: 4527, Natural disaster type: Other
- South Dakota Severe Storms, Tornadoes, And Flooding, Incident Period: September 9, 2019 - September 26, 2019, Major Disaster (Presidential) Declared DR-4469-SD: November 18, 2019, FEMA Id: 4469, Natural disaster type: Storm, Tornado, Flood
- South Dakota Severe Storms And Flooding, Incident Period: May 26, 2019 - June 7, 2019, FEMA Id: 4463, Natural disaster type: Storm, Flood
- South Dakota Severe Winter Storm, Snowstorm, And Flooding, Incident Period: March 13, 2019 - April 26, 2019, FEMA Id: 4440, Natural disaster type: Snowstorm, Winter Storm, Flood
- South Dakota Severe Storms, Tornadoes, Straight-line Winds, and Flooding, Incident Period: June 17, 2015 to June 24, 2015, Major Disaster (Presidential) Declared DR-4233: July 30, 2015, FEMA Id: 4233, Natural disaster type: Storm, Tornado, Flood, Wind
- South Dakota Flooding, Incident Period: March 11, 2011 to July 22, 2011, Major Disaster (Presidential) Declared DR-1984: May 13, 2011, FEMA Id: 1984, Natural disaster type: Flood
- South Dakota Severe Storms and Flooding, Incident Period: July 21, 2010 to July 30, 2010, Major Disaster (Presidential) Declared DR-1938: September 23, 2010, FEMA Id: 1938, Natural disaster type: Storm, Flood
- South Dakota Flooding, Incident Period: March 10, 2010 to June 20, 2010, Major Disaster (Presidential) Declared DR-1915: May 13, 2010, FEMA Id: 1915, Natural disaster type: Flood
- South Dakota Severe Winter Storm, Incident Period: January 20, 2010 to January 26, 2010, Major Disaster (Presidential) Declared DR-1887: March 10, 2010, FEMA Id: 1887, Natural disaster type: Winter Storm
- South Dakota Severe Winter Storm and Snowstorm, Incident Period: December 23, 2009 to December 27, 2009, Major Disaster (Presidential) Declared DR-1886: March 09, 2010, FEMA Id: 1886, Natural disaster type: Snowstorm, Winter Storm
- 9 other natural disasters have been reported since 1953.
The number of natural disasters in Brule County (19) is greater than the US average (15).
Major Disasters (Presidential) Declared: 14
Emergencies Declared: 2
Causes of natural disasters: Floods: 11, Storms: 8, Winter Storms: 5, Tornadoes: 3, Snowstorms: 2, Blizzard: 1, Drought: 1, Hurricane: 1, Ice Storm: 1, Wind: 1, Other: 1 (Note: some incidents may be assigned to more than one category).
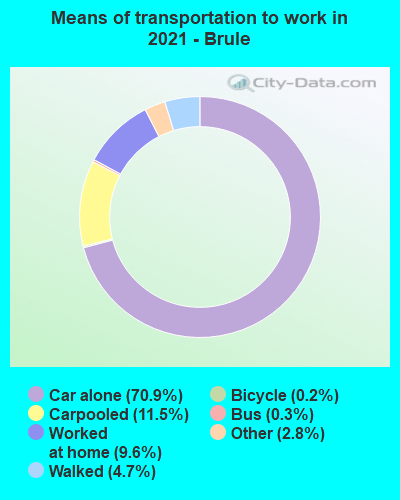
Means of transportation to work:
- Drove a car alone: 1,933 (68.9%)
- Carpooled: 323 (11.5%)
- Bus: 8 (0.3%)
- Ferryboat: 2 (0.1%)
- Taxicab, motorcycle, or other means: 75 (2.7%)
- Bicycle: 1 (0.0%)
- Walked: 84 (3.0%)
- Worked at home: 382 (13.6%)
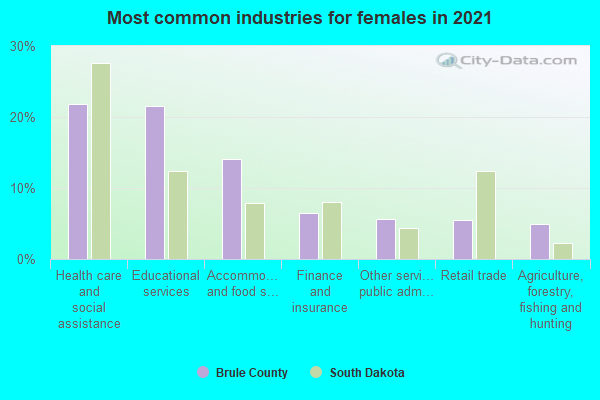
- Educational services (24%)
- Health care and social assistance (20%)
- Accommodation and food services (10%)
- Agriculture, forestry, fishing and hunting (5%)
- Retail trade (4%)
- Other services, except public administration (4%)
- Information (4%)
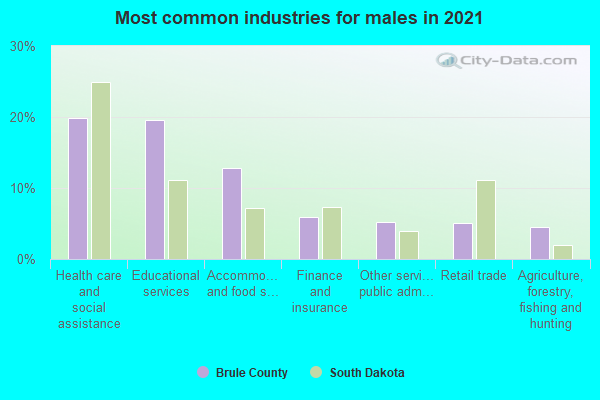
- Educational services (29%)
- Health care and social assistance (25%)
- Accommodation and food services (13%)
- Agriculture, forestry, fishing and hunting (6%)
- Retail trade (5%)
- Other services, except public administration (5%)
- Information (5%)
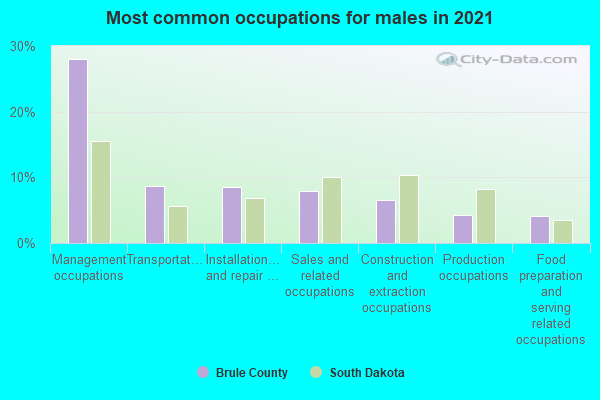
- Management occupations (28%)
- Transportation occupations (12%)
- Sales and related occupations (10%)
- Farming, fishing, and forestry occupations (7%)
- Installation, maintenance, and repair occupations (7%)
- Construction and extraction occupations (6%)
- Production occupations (4%)
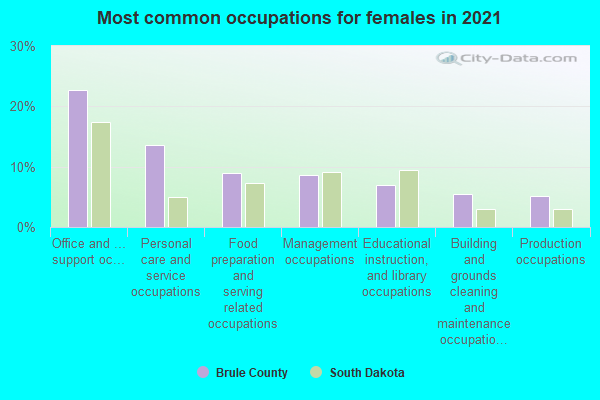
- Office and administrative support occupations (18%)
- Personal care and service occupations (14%)
- Food preparation and serving related occupations (11%)
- Educational instruction, and library occupations (11%)
- Management occupations (7%)
- Production occupations (5%)
- Arts, design, entertainment, sports, and media occupations (4%)
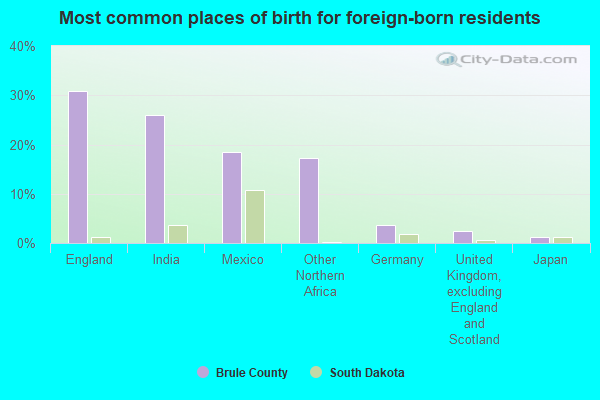
- Mexico (31%)
- England (22%)
- Other Northern Africa (21%)
- Philippines (17%)
- Germany (2%)
- Norway (0%)
- Sweden (0%)
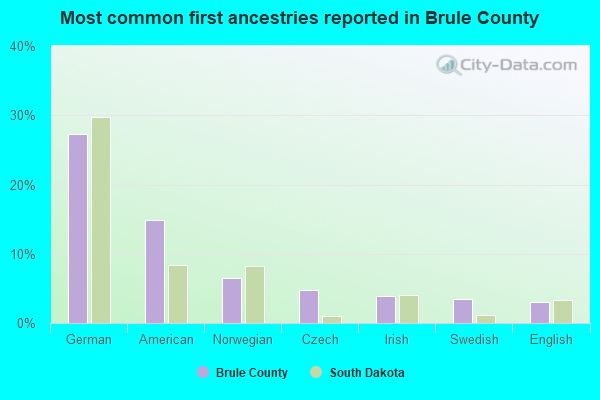
- German (28%)
- American (14%)
- Norwegian (7%)
- Irish (4%)
- Czech (3%)
- European (3%)
- Swedish (3%)
People in group quarters in Brule County, South Dakota in 2010:
- 58 people in nursing facilities/skilled-nursing facilities
- 30 people in residential treatment centers for juveniles (non-correctional)
- 24 people in group homes intended for adults
- 14 people in local jails and other municipal confinement facilities
- 4 people in workers' group living quarters and job corps centers
- 2 people in other noninstitutional facilities
People in group quarters in Brule County, South Dakota in 2000:
- 173 people in other group homes
- 68 people in other noninstitutional group quarters
- 57 people in training schools for juvenile delinquents
- 54 people in homes for the mentally retarded
- 16 people in wards in general hospitals for patients who have no usual home elsewhere
- 11 people in local jails and other confinement facilities (including police lockups)
- 3 people in nursing homes
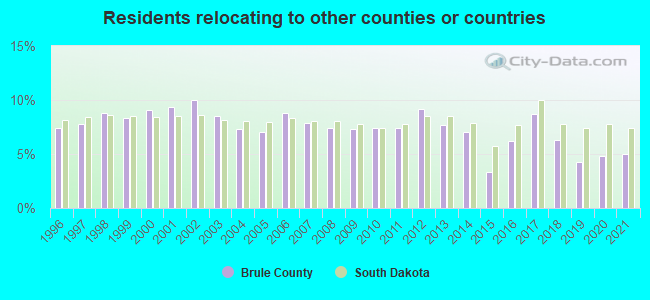
6.29% of this county's 2021 resident taxpayers lived in other counties in 2020 ($44,097 average adjusted gross income)
| Here: | 6.29% |
| South Dakota average: | 8.18% |
10 or fewer of this county's residents moved from foreign countries.
5.02% relocated from other counties in South Dakota ($31,040 average AGI)
1.27% relocated from other states ($13,056 average AGI)
Brule County: 1.27% South Dakota average: 4.11%

5.04% of this county's 2020 resident taxpayers moved to other counties in 2021 ($43,714 average adjusted gross income)
| Here: | 5.04% |
| South Dakota average: | 7.42% |
10 or fewer of this county's residents moved to foreign countries.
5.04% relocated to other counties in South Dakota ($43,714 average AGI)
10 or fewer of this county's residents relocated to other states.
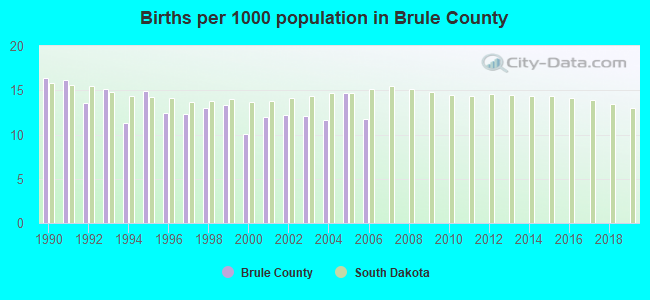
Births per 1000 population from 1990 to 1999: 13.8
Births per 1000 population from 2000 to 2006: 12.1
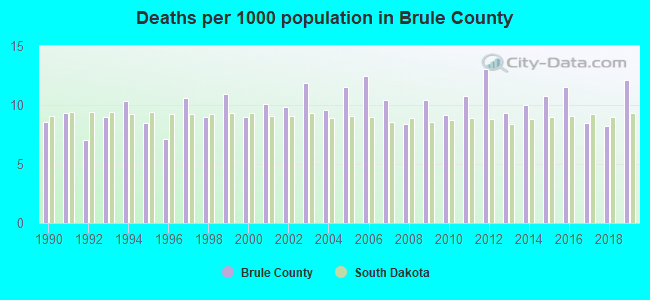
Deaths per 1000 population from 1990 to 1999: 9.0
Deaths per 1000 population from 2000 to 2009: 10.4
Deaths per 1000 population from 2010 to 2020: 10.3
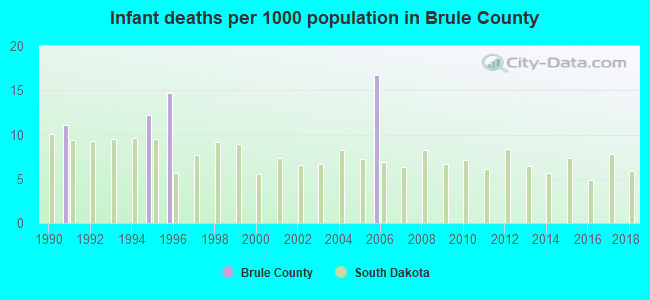
Infant deaths per 1000 live births from 1990 to 1999: 3.8
Infant deaths per 1000 live births from 2000 to 2006: 2.4
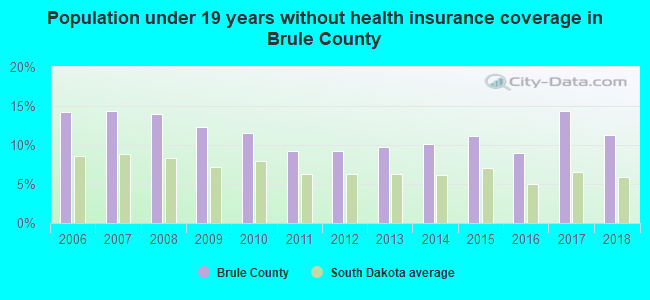
Persons under 19 years old without health insurance coverage in 2018: 11.3%
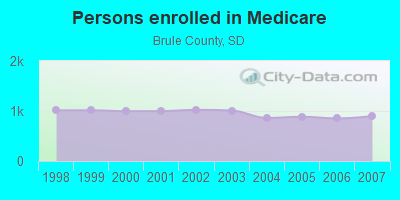
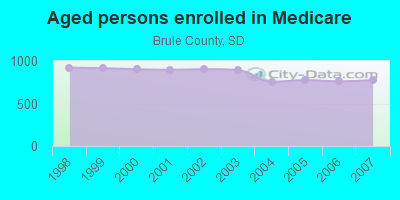
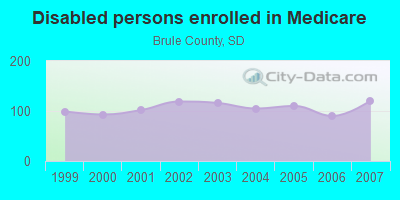
Persons enrolled in hospital insurance and/or supplemental medical insurance (Medicare) in July 1, 2007: 897 (776 aged, 121 disabled)
Children under 18 without health insurance coverage in 2007: 186 (14%)
Most common underlying causes of death in Brule County, South Dakota in 1999 - 2019:
- Acute myocardial infarction, unspecified (78)
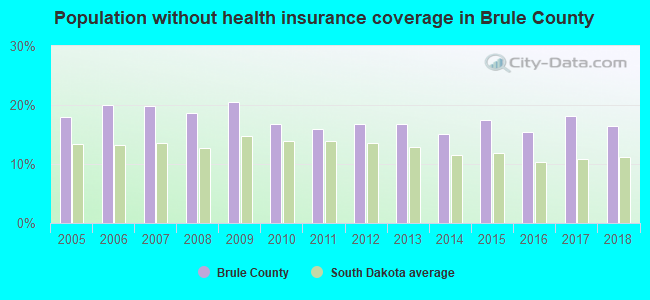
Population without health insurance coverage in 2000: 15%
Children under 18 without health insurance coverage in 2000: 14%
Short term general hospital admissions per 100,000 population in 2004: 19,884
Short term general hospital beds per 100,000 population in 2004: 1,350
Emergency room visits per 100,000 population in 2004: 61,659
General practice office based MDs per 100,000 population in 2005: 1,581
Medical specialist MDs per 100,000 population in 2005: 1,080
Total births per 100,000 population, July 2005 - July 2006 : 36
Total deaths per 100,000 population, July 2005 - July 2006: 154
Limited-service eating places per 100,000 population in 2005 : 19
Household type by relationship:
Households: 5,361- Male householders: 984 (285 living alone), Female householders: 1,065 (429 living alone)
1,027 spouses (1,022 opposite-sex spouses), 110 unmarried partners, (107 opposite-sex unmarried partners), 1,522 children (1,424 natural, 49 adopted, 39 stepchildren), 99 grandchildren, 61 brothers or sisters, 54 parents, 23 foster children, 23 other relatives, 78 non-relatives
- In group quarters: 302
Size of family households: 631 2-persons, 180 3-persons, 163 4-persons, 197 5-persons, 70 6-persons, 4 7-or-more-persons.
Size of nonfamily households: 718 1-person, 66 2-persons, 15 3-persons.
883 married couples with children.
222 single-parent households (106 men, 116 women).
93.7% of residents of Brule speak English at home.
1.0% of residents speak Spanish at home (94% speak English very well, 6% speak English not well).
5.1% of residents speak other Indo-European language at home (69% speak English very well, 31% speak English well).
0.3% of residents speak Asian or Pacific Island language at home (50% speak English very well, 50% speak English well).
0.1% of residents speak other language at home (100% speak English very well).
In fiscal year 2004:
Federal Government expenditure: $40,561,000 ($7,823 per capita)
Department of Defense expenditure: $725,000
Federal direct payments to individuals for retirement and disability: $12,825,000
Federal other direct payments to individuals: $7,659,000
Federal direct payments not to individuals: $9,835,000
Federal grants: $7,453,000
Federal procurement contracts: $1,108,000 ($333,000 Department of Defense)
Federal salaries and wages: $1,680,000 ($72,000 Department of Defense)
Federal Government direct loans: $1,632,000
Federal guaranteed/insured loans: $1,480,000
Federal Government insurance: $23,377,000
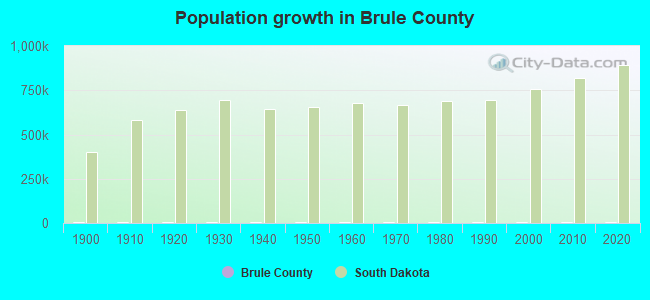
Population change from April 1, 2000 to July 1, 2005:
Births: 325| Here: | 63 per 1000 residents |
| State: | 72 per 1000 residents |
Deaths: 291
| Here: | 56 per 1000 residents |
| State: | 48 per 1000 residents |
Net international migration: 0
| Here: | 0 per 1000 residents |
| State: | +5 per 1000 residents |
Net internal migration: -203
| Here: | |
| State: |
Total withdrawal of fresh water for public supply: 1.09 millions of gallons per day (all from surface)
| Here: | 6.9 |
| State: | 7.0 |
| Here: | 4.8 |
| State: | 4.1 |
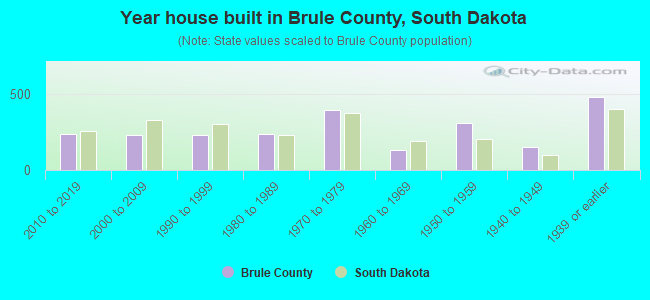
- Year house built in Brule County, South Dakota
- 22020 or later
- 1812010 to 2019
- 2612000 to 2009
- 1941990 to 1999
- 2441980 to 1989
- 4481970 to 1979
- 1161960 to 1969
- 2571950 to 1959
- 1531940 to 1949
- 4951939 or earlier
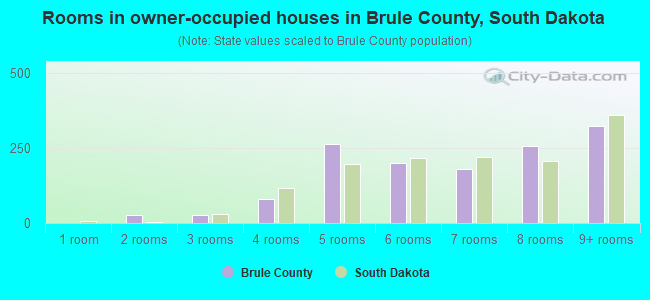
- Rooms in owner-occupied houses in Brule County, South Dakota
- 21 room
- 302 rooms
- 213 rooms
- 1074 rooms
- 2305 rooms
- 2006 rooms
- 2127 rooms
- 2158 rooms
- 3409+ rooms
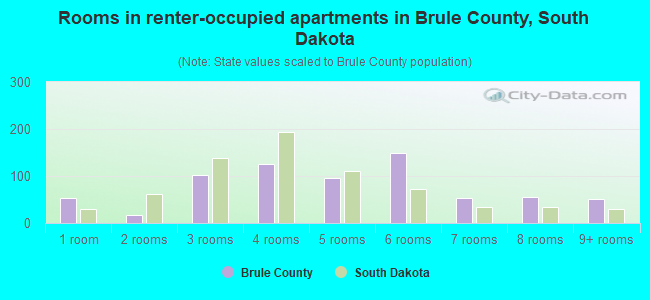
- Rooms in renter-occupied apartments in Brule County, South Dakota
- 591 room
- 132 rooms
- 983 rooms
- 1484 rooms
- 915 rooms
- 1366 rooms
- 547 rooms
- 498 rooms
- 389+ rooms
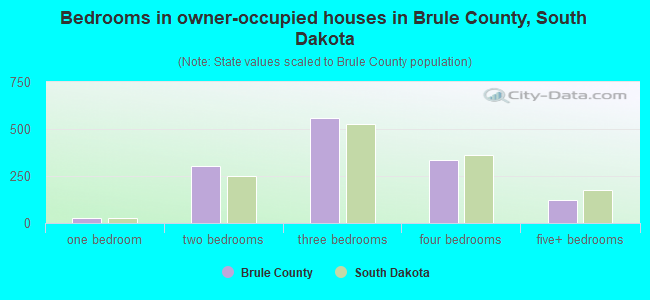
- Bedrooms in owner-occupied houses in Brule County, South Dakota
- 2no bedroom
- 321 bedroom
- 3042 bedrooms
- 5063 bedrooms
- 3244 bedrooms
- 1885+ bedrooms
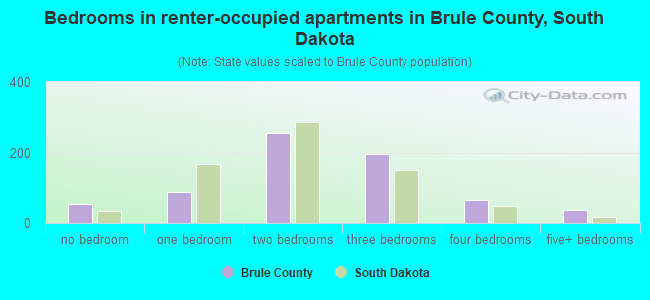
- Bedrooms in renter-occupied apartments in Brule County, South Dakota
- 62no bedroom
- 981 bedroom
- 2502 bedrooms
- 1963 bedrooms
- 524 bedrooms
- 345+ bedrooms
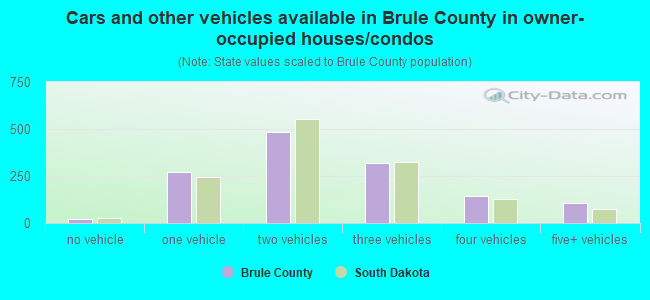
- Cars and other vehicles available in Brule County in owner-occupied houses/condos
- 11no vehicle
- 2631 vehicle
- 4622 vehicles
- 3353 vehicles
- 1924 vehicles
- 885+ vehicles
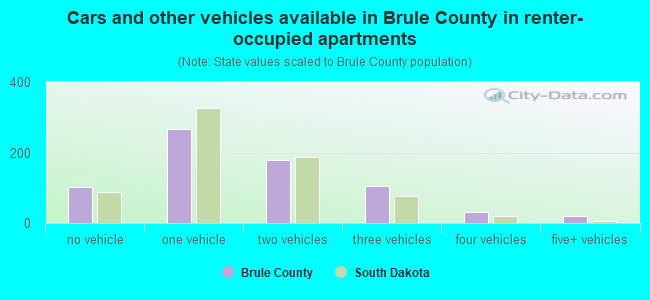
- Cars and other vehicles available in Brule County in renter-occupied apartments
- 91no vehicle
- 2541 vehicle
- 2182 vehicles
- 873 vehicles
- 274 vehicles
- 85+ vehicles
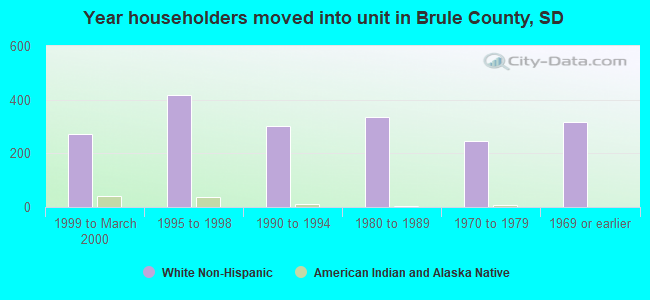
92.4% of Brule County residents lived in the same house 1 years ago.
Out of people who lived in different houses, 34% lived in this county.
Out of people who lived in different counties, 78% lived in South Dakota.
| Brule County: | 92.4% |
| State average: | 86.6% |
Place of birth for U.S.-born residents:
- This state: 4,277
- Other state: 981
- Northeast: 79
- Midwest: 473
- South: 280
- West: 155
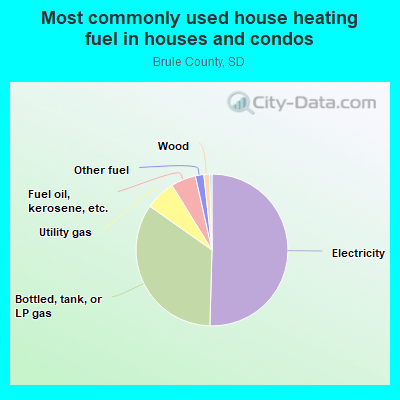
- 47.4%Electricity
- 37.5%Bottled, tank, or LP gas
- 7.3%Utility gas
- 3.8%Fuel oil, kerosene, etc.
- 1.6%Other fuel
- 1.4%Wood
- 0.9%No fuel used
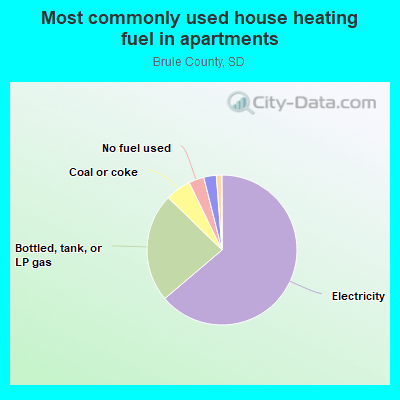
- 65.3%Electricity
- 18.5%Bottled, tank, or LP gas
- 9.3%Coal or coke
- 3.6%Utility gas
- 2.6%Fuel oil, kerosene, etc.
- 0.6%No fuel used
Private vs. public school enrollment:
| Here: | 4.2% |
| South Dakota: | 11.9% |
| Here: | 0.0% |
| South Dakota: | 7.2% |
| Here: | 4.8% |
| South Dakota: | 10.2% |

Brule County government finances - Expenditure in 2018:
- Charges - Regular Highways: $139,000
- Construction - Regular Highways: $345,000
General - Other: $5,000
- Current Operations - Regular Highways: $740,000
Correctional Institutions: $346,000
General - Other: $340,000
Financial Administration: $338,000
Police Protection: $320,000
Central Staff Services: $252,000
Judicial and Legal Services: $198,000
General Public Buildings: $115,000
Health - Other: $57,000
Local Fire Protection: $53,000
Natural Resources - Other: $28,000
Protective Inspection and Regulation - Other: $26,000
Parks and Recreation: $3,000
- Federal Intergovernmental - Public Welfare: $21,000
General Local Government Support: $1,000
- Intergovernmental to Local - Other - Corrections: $102,000
Other - Public Welfare - Other: $91,000
Other - Health - Other: $31,000
Other - Regular Highways: $26,000
Other - General - Other: $10,000
- Intergovernmental to State - Corrections: $5,000
- Local Intergovernmental - General Local Government Support: $284,000
Other: $4,000
- Miscellaneous - General Revenue - Other: $199,000
Rents: $14,000
Interest Earnings: $13,000
Fines and Forfeits: $10,000
Sale of Property: $2,000
- Other Capital Outlay - Regular Highways: $75,000
Police Protection: $8,000
Correctional Institutions: $2,000
- Other Funds - Cash and Securities: $4,333,000
- State Intergovernmental - Highways: $1,052,000
General Local Government Support: $146,000
Public Welfare: $6,000
- Tax - Property: $2,380,000
Other License: $6,000
Alcoholic Beverage License: $2,000
- Total Salaries and Wages: $1,555,000
Brule County government finances - Revenue in 2018:
- Charges - Regular Highways: $139,000
- Construction - Regular Highways: $345,000
General - Other: $5,000
- Current Operations - Regular Highways: $740,000
Correctional Institutions: $346,000
General - Other: $340,000
Financial Administration: $338,000
Police Protection: $320,000
Central Staff Services: $252,000
Judicial and Legal Services: $198,000
General Public Buildings: $115,000
Health - Other: $57,000
Local Fire Protection: $53,000
Natural Resources - Other: $28,000
Protective Inspection and Regulation - Other: $26,000
Parks and Recreation: $3,000
- Federal Intergovernmental - Public Welfare: $21,000
General Local Government Support: $1,000
- Intergovernmental to Local - Other - Corrections: $102,000
Other - Public Welfare - Other: $91,000
Other - Health - Other: $31,000
Other - Regular Highways: $26,000
Other - General - Other: $10,000
- Intergovernmental to State - Corrections: $5,000
- Local Intergovernmental - General Local Government Support: $284,000
Other: $4,000
- Miscellaneous - General Revenue - Other: $199,000
Rents: $14,000
Interest Earnings: $13,000
Fines and Forfeits: $10,000
Sale of Property: $2,000
- Other Capital Outlay - Regular Highways: $75,000
Police Protection: $8,000
Correctional Institutions: $2,000
- Other Funds - Cash and Securities: $4,333,000
- State Intergovernmental - Highways: $1,052,000
General Local Government Support: $146,000
Public Welfare: $6,000
- Tax - Property: $2,380,000
Other License: $6,000
Alcoholic Beverage License: $2,000
- Total Salaries and Wages: $1,555,000
Brule County government finances - Debt in 2018:
- Charges - Regular Highways: $139,000
- Construction - Regular Highways: $345,000
General - Other: $5,000
- Current Operations - Regular Highways: $740,000
Correctional Institutions: $346,000
General - Other: $340,000
Financial Administration: $338,000
Police Protection: $320,000
Central Staff Services: $252,000
Judicial and Legal Services: $198,000
General Public Buildings: $115,000
Health - Other: $57,000
Local Fire Protection: $53,000
Natural Resources - Other: $28,000
Protective Inspection and Regulation - Other: $26,000
Parks and Recreation: $3,000
- Federal Intergovernmental - Public Welfare: $21,000
General Local Government Support: $1,000
- Intergovernmental to Local - Other - Corrections: $102,000
Other - Public Welfare - Other: $91,000
Other - Health - Other: $31,000
Other - Regular Highways: $26,000
Other - General - Other: $10,000
- Intergovernmental to State - Corrections: $5,000
- Local Intergovernmental - General Local Government Support: $284,000
Other: $4,000
- Miscellaneous - General Revenue - Other: $199,000
Rents: $14,000
Interest Earnings: $13,000
Fines and Forfeits: $10,000
Sale of Property: $2,000
- Other Capital Outlay - Regular Highways: $75,000
Police Protection: $8,000
Correctional Institutions: $2,000
- Other Funds - Cash and Securities: $4,333,000
- State Intergovernmental - Highways: $1,052,000
General Local Government Support: $146,000
Public Welfare: $6,000
- Tax - Property: $2,380,000
Other License: $6,000
Alcoholic Beverage License: $2,000
- Total Salaries and Wages: $1,555,000
Brule County government finances - Cash and Securities in 2018:
- Charges - Regular Highways: $139,000
- Construction - Regular Highways: $345,000
General - Other: $5,000
- Current Operations - Regular Highways: $740,000
Correctional Institutions: $346,000
General - Other: $340,000
Financial Administration: $338,000
Police Protection: $320,000
Central Staff Services: $252,000
Judicial and Legal Services: $198,000
General Public Buildings: $115,000
Health - Other: $57,000
Local Fire Protection: $53,000
Natural Resources - Other: $28,000
Protective Inspection and Regulation - Other: $26,000
Parks and Recreation: $3,000
- Federal Intergovernmental - Public Welfare: $21,000
General Local Government Support: $1,000
- Intergovernmental to Local - Other - Corrections: $102,000
Other - Public Welfare - Other: $91,000
Other - Health - Other: $31,000
Other - Regular Highways: $26,000
Other - General - Other: $10,000
- Intergovernmental to State - Corrections: $5,000
- Local Intergovernmental - General Local Government Support: $284,000
Other: $4,000
- Miscellaneous - General Revenue - Other: $199,000
Rents: $14,000
Interest Earnings: $13,000
Fines and Forfeits: $10,000
Sale of Property: $2,000
- Other Capital Outlay - Regular Highways: $75,000
Police Protection: $8,000
Correctional Institutions: $2,000
- Other Funds - Cash and Securities: $4,333,000
- State Intergovernmental - Highways: $1,052,000
General Local Government Support: $146,000
Public Welfare: $6,000
- Tax - Property: $2,380,000
Other License: $6,000
Alcoholic Beverage License: $2,000
- Total Salaries and Wages: $1,555,000
Supplemental Security Income (SSI) in 2006:
- Total number of recipients: 65
- Number of aged recipients: 7
- Number of blind and disabled recipients: 58
- Number of recipients under 18: 11
- Number of recipients between 18 and 64: 42
- Number of recipients older than 64: 12
- Number of recipients also receiving OASDI: 34
- Amount of payments (thousands of dollars): 20
| Most common first names in Brule County, SD among deceased individuals | ||
| Name | Count | Lived (average) |
|---|---|---|
| William | 80 | 79.9 years |
| John | 60 | 78.4 years |
| Mary | 53 | 79.1 years |
| Robert | 50 | 68.2 years |
| George | 42 | 77.3 years |
| Harold | 41 | 78.0 years |
| Charles | 34 | 76.1 years |
| Frank | 34 | 81.9 years |
| Joseph | 32 | 75.9 years |
| Helen | 30 | 75.2 years |
| Most common last names in Brule County, SD among deceased individuals | ||
| Last name | Count | Lived (average) |
|---|---|---|
| Johnson | 34 | 79.3 years |
| Olson | 30 | 86.3 years |
| Miller | 29 | 81.4 years |
| Nelson | 25 | 83.2 years |
| Smith | 25 | 81.4 years |
| Leiferman | 23 | 87.1 years |
| Steckelberg | 22 | 81.0 years |
| Swanson | 19 | 81.8 years |
| Thompson | 17 | 81.1 years |
| Feltman | 16 | 82.1 years |
| Businesses in Brule County, SD | ||||
| Name | Count | Name | Count | |
|---|---|---|---|---|
| Alco Stores | 1 | Pizza Hut | 1 | |
| AmericInn | 1 | RadioShack | 1 | |
| Best Western | 1 | Subway | 1 | |
| Dairy Queen | 1 | Super 8 | 2 | |
| FedEx | 1 | True Value | 1 | |
| Ford | 1 | U-Haul | 1 | |
| Howard Johnson | 1 | UPS | 1 | |
| McDonald's | 1 | |||