Custer County, Montana (MT)
County owner-occupied free and clear houses and condos in 2010: 1,531
County owner-occupied houses and condos in 2000: 3,341
Renter-occupied apartments: 1,682 (it was 1,427 in 2000)
| % of renters here: | 30% |
| State: | 32% |
Land area: 3783 sq. mi.
Water area: 10.1 sq. mi.
Population density: 3 people per square mile (very low).
Industries providing employment: Educational, health and social services (22.5%), Retail trade (19.2%).
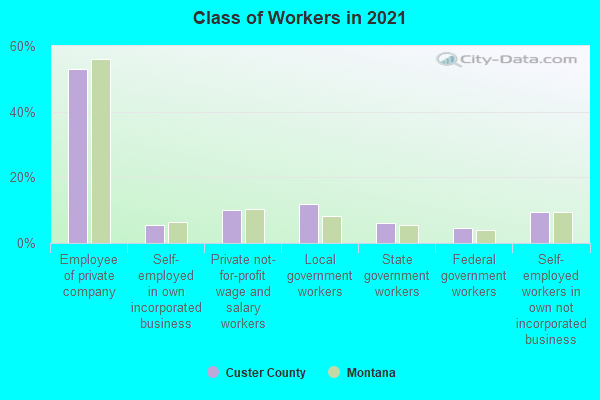
Type of workers:
- Private wage or salary: 72%
- Government: 18%
- Self-employed, not incorporated: 10%
- Unpaid family work: 0%
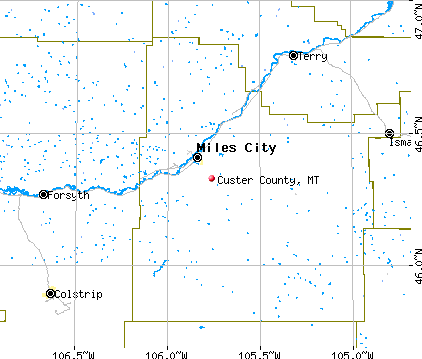
- OSM Map
- General Map
- Google Map
- MSN Map

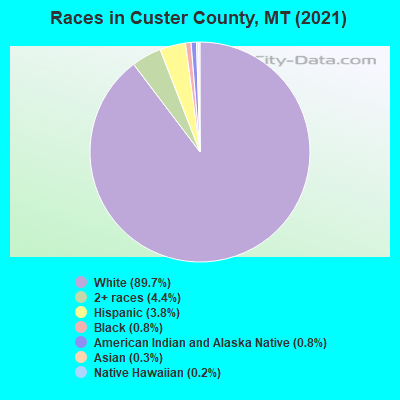
- 10,85387.8%White Non-Hispanic Alone
- 7376.0%Two or more races
- 4673.8%Hispanic or Latino
- 1401.1%American Indian and Alaska Native alone
- 650.5%Some other race alone
- 410.3%Native Hawaiian and Other
Pacific Islander alone - 390.3%Asian alone
- 180.1%Black Non-Hispanic Alone
| Median resident age: | 42.9 years |
| Montana median age: | 40.2 years |
| Males: 6,171 | |
| Females: 6,125 |

 | Billings & Miles City Areas (10 replies) |
| Summer Weather Alerts, 2013 (Road Conditions and Highway Cams) (41 replies) |
| Montana has a deadly culture... (106 replies) |
| Where to stay in Custer Country? (6 replies) |
| Recommendations on affordable, mid-size towns for libertarian couple (15 replies) |
| severe weather 2009 (16 replies) |
| Custer County: | 2.0 people |
| Montana: | 2 people |
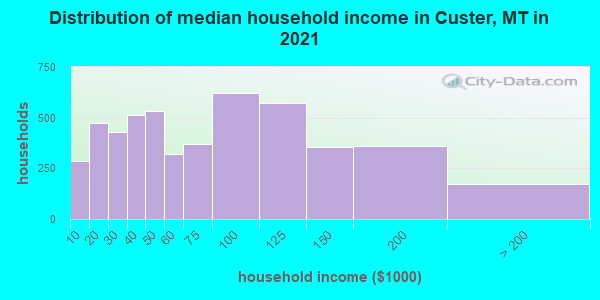
Estimated median household income in 2022: $62,302 ($30,000 in 1999)
| This county: | $62,302 |
| Montana: | $67,631 |
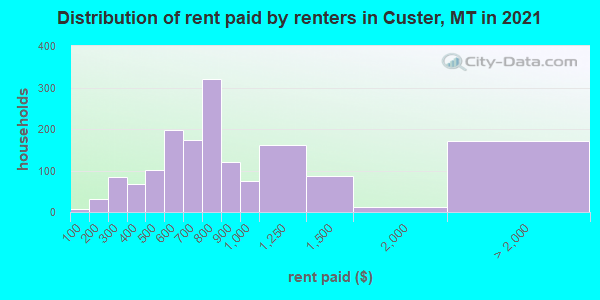
Median contract rent in 2022 for apartments: $714 (lower quartile is $550, upper quartile is $990)
| This county: | $714 |
| State: | $871 |
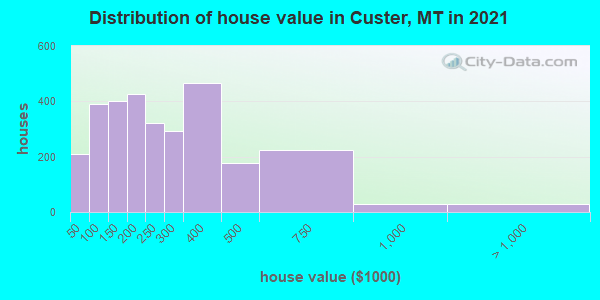
Estimated median house or condo value in 2022: $240,911 (it was $62,800 in 2000)
| Custer: | $240,911 |
| Montana: | $366,400 |
Median monthly housing costs for homes and condos with a mortgage: $1,375
Median monthly housing costs for units without a mortgage: $535
Institutionalized population: 216
Crime in 2021 (reported by the sheriff's office or county police, not the county total):
- Murders: 0
- Rapes: 4
- Robberies: 0
- Assaults: 11
- Burglaries: 2
- Thefts: 10
- Auto thefts: 2
Crime in 2020 (reported by the sheriff's office or county police, not the county total):
- Murders: 0
- Rapes: 2
- Robberies: 0
- Assaults: 2
- Burglaries: 2
- Thefts: 4
- Auto thefts: 0
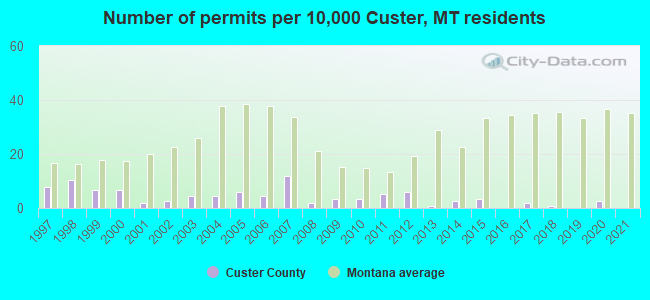
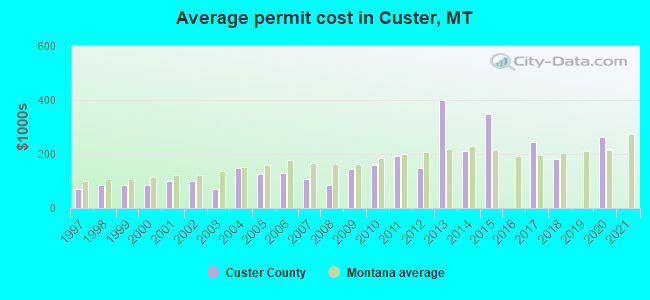
Single-family new house construction building permits:
- 2022: 2 buildings, average cost: $59,000
- 2021: 0 buildings
- 2020: 3 buildings, average cost: $263,300
- 2019: 0 buildings
- 2018: 1 building, cost: $181,800
- 2017: 2 buildings, average cost: $245,000
- 2016: 0 buildings
- 2015: 4 buildings, average cost: $347,500
- 2014: 3 buildings, average cost: $211,700
- 2013: 1 building, cost: $400,000
- 2012: 7 buildings, average cost: $147,000
- 2011: 6 buildings, average cost: $194,200
- 2010: 4 buildings, average cost: $160,000
- 2009: 4 buildings, average cost: $146,000
- 2008: 2 buildings, average cost: $85,000
- 2007: 14 buildings, average cost: $106,700
- 2006: 5 buildings, average cost: $129,900
- 2005: 7 buildings, average cost: $125,000
- 2004: 5 buildings, average cost: $147,200
- 2003: 5 buildings, average cost: $69,700
- 2002: 3 buildings, average cost: $100,000
- 2001: 2 buildings, average cost: $100,000
- 2000: 8 buildings, average cost: $84,500
- 1999: 8 buildings, average cost: $86,400
- 1998: 12 buildings, average cost: $83,800
- 1997: 9 buildings, average cost: $70,900
Median real estate property taxes paid for housing units with mortgages in 2022: $2,244 (0.9%)
Median real estate property taxes paid for housing units with no mortgage in 2022: $2,149 (0.9%)
| Custer County: | 10.9% |
| Montana: | 12.1% |
Median age of residents in 2022: 42.9 years old
(Males: 41.0 years old, Females: 45.6 years old)
(Median age for: White residents: 44.1 years old, American Indian residents: 48.5 years old, Asian residents: 39.5 years old, Hispanic or Latino residents: 26.7 years old, Other race residents: 19.4 years old)
Fair market rent in 2006 for a 1-bedroom apartment in Custer County is $455 a month.
Fair market rent for a 2-bedroom apartment is $503 a month.
Fair market rent for a 3-bedroom apartment is $732 a month.
Cities in this county include: Miles City, Mizpah-Pumpkin, North Custer, Shirley-Ismay, Ismay.
2023 air pollution in Custer County:
Nitrogen Dioxide: 0.00 ppm (standard limit: 0.053 ppm). Below U.S. average.
Ozone (1-hour): 0.034 ppm (standard limit: 0.12 ppm). Near U.S. average.
Particulate Matter (PM10) Annual: 12.4 µg/m3. Near U.S. average.
Particulate Matter (PM2.5) Annual: 7.8 µg/m3(standard limit: 15.0 µg/m3). Near U.S. average.
Notable locations in this county outside city limits:
Notable locations in Custer County: Aldinger Ranch (A), McKay Ranch (B), Bailey Ranch (C), Bones Ranch (D), McDonald Ranch (E), Barley Ranch (F), Mc Kinney Ranch (G), Maudru Spur (H), Mardis Ranch (I), Bixby Ranch (J), Blacktail Ranch (K), Brewster Camp (L), Brewster Ranch (M), Brock Camp (N), Brockel Homestead (O), Burning Coal Vein Area (P), Forsyth Country Club (Q), Cox Ranch (R), O'Dell Windmill (S), Erickson Ranch (T). Display/hide their locations on the map
Churches in Custer County include: Church of Christ (A), The Church of Jesus Christ of Latter Day Saints (B), Ashland Christian Fellowship (C), Ashland Community Church (D), Saint Isadore Church (E), Birney Church (F), Trinity Church (G). Display/hide their locations on the map
Cemeteries: Forsyth Cemetery (1), Brown Cemetery (2), Lee Cemetery (3), Vanstel Cemetery (4), Bean Cemetery (5), Sumatra Cemetery (6), Birney Cemetery (7). Display/hide their locations on the map
Reservoirs: Red Rock Reservoir Number One (A), Red Rock Reservoir Number Two (B), Snyder Reservoir (C), Brown Coulee Reservoir (D), Boies Reservoir (E), Blacktail Reservoir (F), Black Sea Reservoir (G), Black Coulee Reservoir (H). Display/hide their locations on the map
Streams, rivers, and creeks: Zook Creek (A), Big Breed Creek (B), Bowman Creek (C), Bridge Creek (D), Bringoff Creek (E), Burning Creek (F), Cedar Creek (G), Antelope Creek (H), Big Porcupine Creek (I). Display/hide their locations on the map
Parks in Custer County include: West Rosebud State Park (1), Tongue River Breaks Hiding and Riding Area (2), Poker Jim Research Natural Area (3), King Mountain Hiking and Riding Area (4), East Rosebud State Park (5), Rosebud Historical Marker (6), Cattle Brands Historical Marker (7), Rosebud River Historical Marker (8). Display/hide their locations on the map
Neighboring counties: Ashland County, Wisconsin  , Douglas County, Wisconsin , Klickitat County, Washington
  , Emmet County, Michigan , Kootenai County, Idaho , Powell County , Yellowstone County , Schoolcraft County, Michigan .
| Here: | 3.6% |
| Montana: | 3.8% |
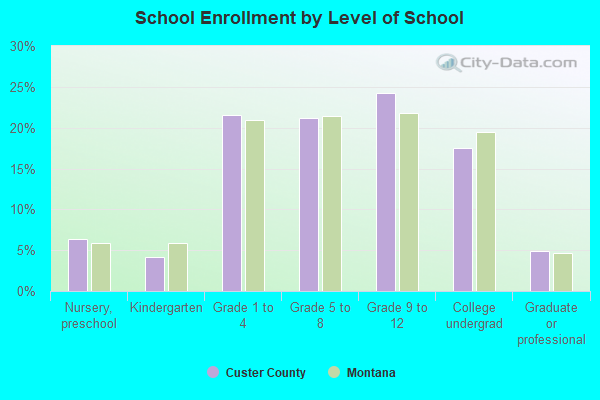
Current college students: 514
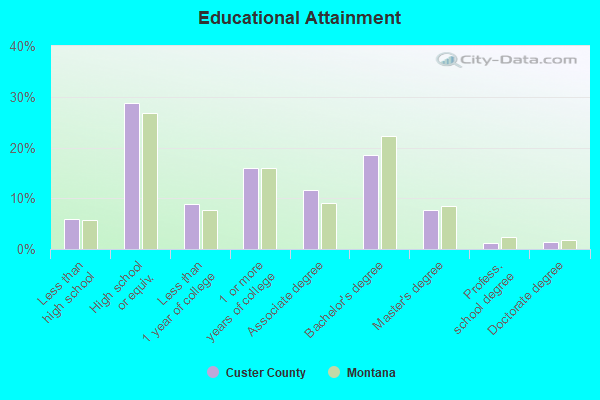
People 25 years of age or older with a high school degree or higher: 94.4%
People 25 years of age or older with a bachelor's degree or higher: 26.6%
Number of foreign born residents: 239 (64.4% naturalized citizens)
| Custer County: | 1.9% |
| Whole state: | 2.3% |
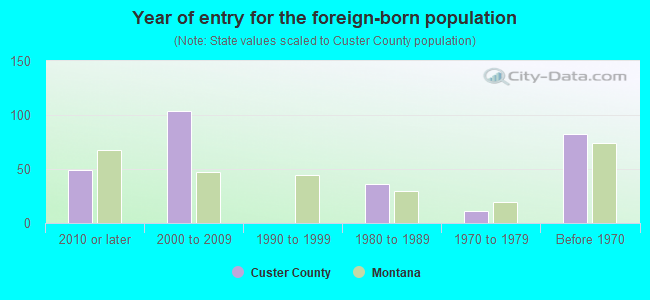
- Year of entry for the foreign-born population
- 912010 or later
- 992000 to 2009
- 01990 to 1999
- 361980 to 1989
- 111970 to 1979
- 82Before 1970
Mean travel time to work (commute): minutes
Percentage of county residents living and working in this county: 99.3%
Housing units in structures:
- One, detached: 4,115
- One, attached: 185
- Two: 110
- 3 or 4: 175
- 5 to 9: 277
- 10 to 19: 167
- 20 to 49: 102
- 50 or more: 211
- Mobile homes: 522
- Boats, RVs, vans, etc.: 15
Housing units in Custer County with a mortgage: 1,671 (97 second mortgage, 0 home equity loan, 80 both second mortgage and home equity loan)
Houses without a mortgage: 31
| Here: | 3.1% with mortgage |
| State: | 97.4% with mortgage |
Religion statistics for Custer County
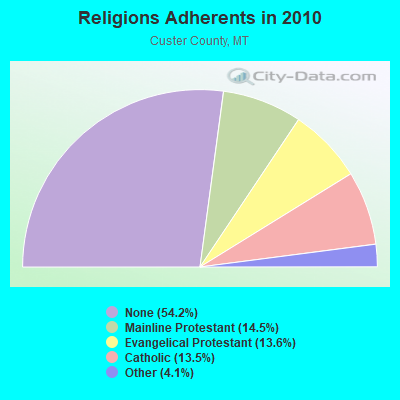
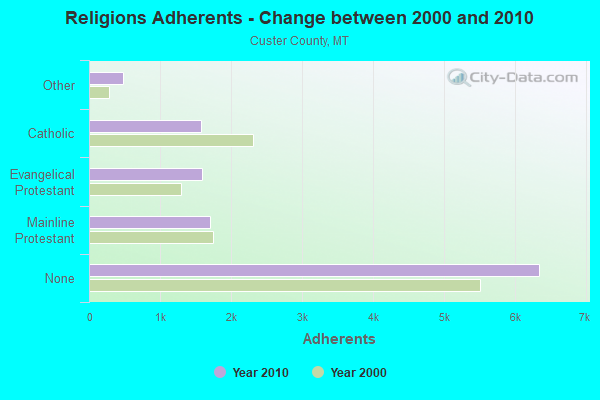
| Religion | Adherents | Congregations |
|---|---|---|
| Mainline Protestant | 1,699 | 7 |
| Evangelical Protestant | 1,594 | 9 |
| Catholic | 1,580 | 1 |
| Other | 483 | 1 |
| None | 6,343 | - |
Source: Clifford Grammich, Kirk Hadaway, Richard Houseal, Dale E.Jones, Alexei Krindatch, Richie Stanley and Richard H.Taylor. 2012. 2010 U.S.Religion Census: Religious Congregations & Membership Study. Association of Statisticians of American Religious Bodies. Jones, Dale E., et al. 2002. Congregations and Membership in the United States 2000. Nashville, TN: Glenmary Research Center.
Food Environment Statistics:
| Custer County: | 1.79 / 10,000 pop. |
| State: | 2.55 / 10,000 pop. |
| Custer County: | 8.06 / 10,000 pop. |
| Montana: | 4.69 / 10,000 pop. |
| This county: | 8.96 / 10,000 pop. |
| State: | 10.38 / 10,000 pop. |
| Custer County: | 8.3% |
| Montana: | 7.2% |
| Custer County: | 25.8% |
| State: | 23.1% |
| Here: | 15.3% |
| State: | 10.7% |
Agriculture in Custer County:
Average size of farms: 4480 acresAverage value of agricultural products sold per farm: $95,735
Average value of crops sold per acre for harvested cropland: $105.26
The value of livestock, poultry, and their products as a percentage of the total market value of agricultural products sold: 85.21%
Average total farm production expenses per farm: $86,323
Harvested cropland as a percentage of land in farms: 3.00%
Irrigated harvested cropland as a percentage of land in farms: 44.71%
Average market value of all machinery and equipment per farm: $70,665
The percentage of farms operated by a family or individual: 81.88%
Average age of principal farm operators: 54 years
Average number of cattle and calves per 100 acres of all land in farms: 4.58
Milk cows as a percentage of all cattle and calves: 0.06%
Corn for grain: 367 harvested acres
All wheat for grain: 12185 harvested acres
Tornado activity:
Custer County historical area-adjusted tornado activity is significantly below Montana state average. It is 375668781.5 times below overall U.S. average.Tornadoes in this county have caused 3 injuries recorded between 1950 and 2004.
On 7/20/1993, a tornado injured 3 people and caused between $50,000 and $500,000 in damages.
Earthquake activity:
Custer County-area historical earthquake activity is significantly above Montana state average. It is 332% greater than the overall U.S. average.On 8/18/1959 at 06:37:13, a magnitude 7.7 (7.7 UK, Class: Major, Intensity: VIII - XII) earthquake occurred 266.5 miles away from Custer County center, causing $26,000,000 total damage
On 10/28/1983 at 14:06:06, a magnitude 7.3 (6.2 MB, 7.3 MS, 7.0 MW) earthquake occurred 421.1 miles away from the county center, causing 2 deaths (2 shaking deaths) and 3 injuries, causing $15,000,000 total damage
On 6/30/1975 at 18:54:13, a magnitude 6.1 (5.6 MB, 5.9 MS, 6.1 UK, 6.1 ML, Class: Strong, Intensity: VII - IX) earthquake occurred 266.6 miles away from the county center
On 9/8/1984 at 00:59:31, a magnitude 5.1 (5.1 MB, Class: Moderate, Intensity: VI - VII) earthquake occurred 145.1 miles away from the county center
On 5/29/1984 at 20:18:32, a magnitude 5.0 (5.0 MB) earthquake occurred 145.0 miles away from Custer County center
On 7/6/2017 at 06:30:17, a magnitude 5.8 (5.8 MW, Depth: 7.6 mi) earthquake occurred 325.7 miles away from the county center
Magnitude types: body-wave magnitude (MB), local magnitude (ML), surface-wave magnitude (MS), moment magnitude (MW)
Most recent natural disasters:
- Montana Covid-19 Pandemic, Incident Period: January 20, 2020, FEMA Id: 4508, Natural disaster type: Other
- Montana Flooding, Incident Period: May 1, 2018 - June 10, 2018, FEMA Id: 4405, Natural disaster type: Flood
- Montana Flooding, Incident Period: May 19, 2013 to June 03, 2013, Major Disaster (Presidential) Declared DR-4127: July 10, 2013, FEMA Id: 4127, Natural disaster type: Flood
- Montana Severe Storms and Flooding, Incident Period: April 04, 2011 to July 22, 2011, Major Disaster (Presidential) Declared DR-1996: June 17, 2011, FEMA Id: 1996, Natural disaster type: Storm, Flood
- Montana Severe Winter Storm, Incident Period: May 01, 2008 to May 02, 2008, Major Disaster (Presidential) Declared DR-1767: June 13, 2008, FEMA Id: 1767, Natural disaster type: Winter Storm
- Montana Hurricane Katrina Evacuation, Incident Period: August 29, 2005 to October 01, 2005, Emergency Declared EM-3253: September 13, 2005, FEMA Id: 3253, Natural disaster type: Hurricane
- Montana Wildfires, Incident Period: July 13, 2000 to September 25, 2000, Major Disaster (Presidential) Declared DR-1340: August 30, 2000, FEMA Id: 1340, Natural disaster type: Fire
The number of natural disasters in Custer County (7) is smaller than the US average (15).
Major Disasters (Presidential) Declared: 4
Emergencies Declared: 1
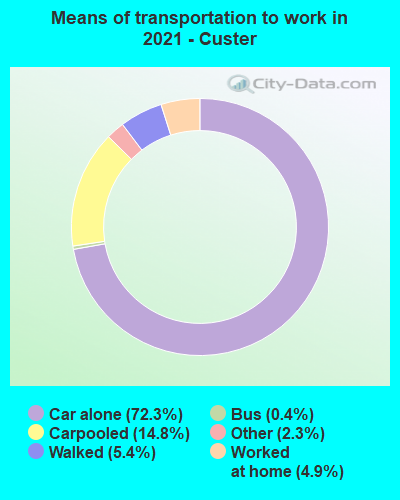
Means of transportation to work:
- Drove a car alone: 4,404 (68.3%)
- Carpooled: 1,214 (18.8%)
- Bus: 3 (0.0%)
- Taxicab, motorcycle, or other means: 156 (2.4%)
- Walked: 337 (5.2%)
- Worked at home: 359 (5.6%)
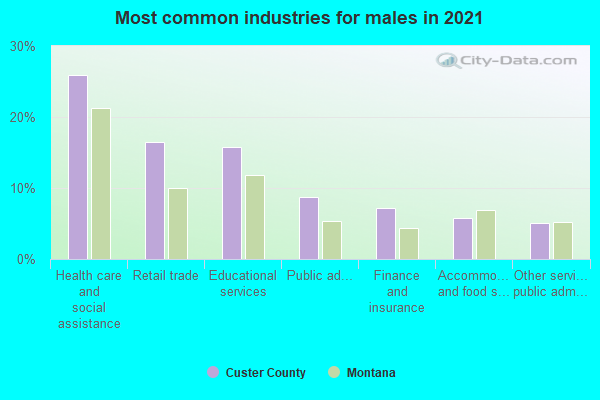
- Health care and social assistance (22%)
- Retail trade (18%)
- Educational services (10%)
- Accommodation and food services (8%)
- Finance and insurance (6%)
- Public administration (5%)
- Other services, except public administration (5%)
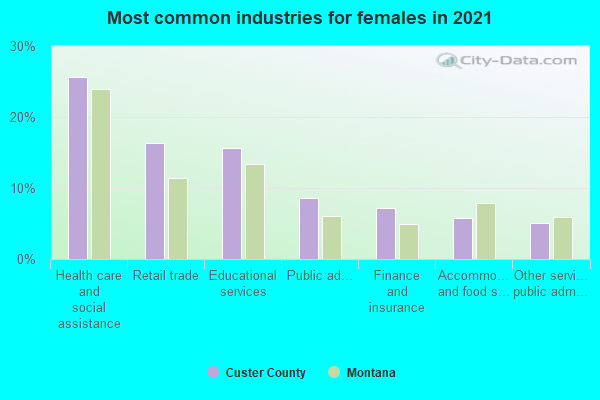
- Health care and social assistance (24%)
- Retail trade (20%)
- Educational services (11%)
- Accommodation and food services (8%)
- Finance and insurance (7%)
- Public administration (6%)
- Other services, except public administration (5%)
- Management occupations (12%)
- Construction and extraction occupations (12%)
- Sales and related occupations (11%)
- Material moving occupations (10%)
- Installation, maintenance, and repair occupations (8%)
- Transportation occupations (6%)
- Farming, fishing, and forestry occupations (6%)
- Office and administrative support occupations (16%)
- Sales and related occupations (14%)
- Health diagnosing and treating practitioners and other technical occupations (10%)
- Educational instruction, and library occupations (9%)
- Food preparation and serving related occupations (8%)
- Business and financial operations occupations (8%)
- Management occupations (7%)
- Ghana (13%)
- Vietnam (11%)
- Russia (10%)
- Japan (10%)
- Armenia (9%)
- Guatemala (9%)
- United Kingdom, excluding England and Scotland (7%)
- German (23%)
- American (10%)
- Irish (9%)
- English (9%)
- Norwegian (7%)
- Italian (3%)
- Swedish (3%)
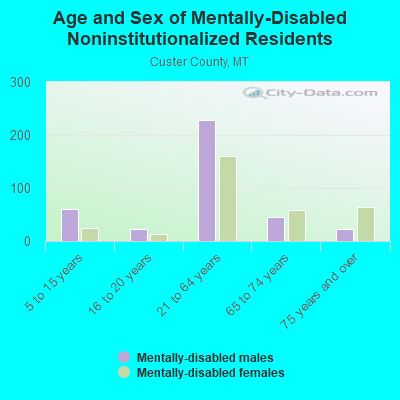
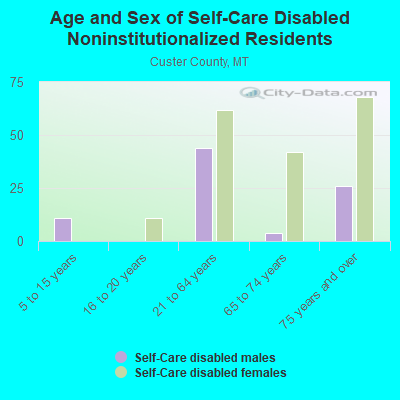
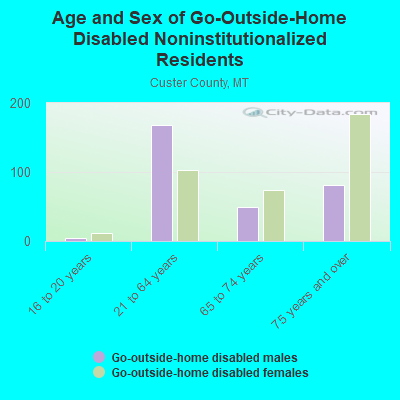
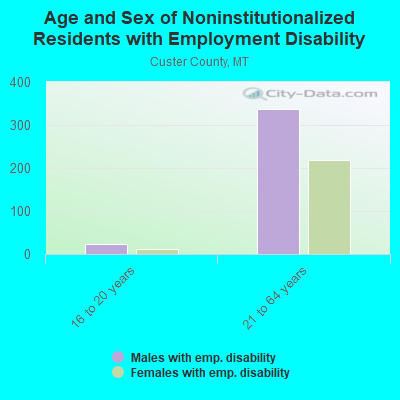
People in group quarters in Custer County, Montana in 2010:
- 142 people in college/university student housing
- 134 people in nursing facilities/skilled-nursing facilities
- 69 people in correctional facilities intended for juveniles
- 52 people in group homes intended for adults
- 13 people in local jails and other municipal confinement facilities
- 3 people in other noninstitutional facilities
People in group quarters in Custer County, Montana in 2000:
- 237 people in nursing homes
- 53 people in college dormitories (includes college quarters off campus)
- 52 people in training schools for juvenile delinquents
- 33 people in homes for the physically handicapped
- 25 people in other noninstitutional group quarters
- 10 people in local jails and other confinement facilities (including police lockups)
- 8 people in homes for the mentally ill
- 3 people in religious group quarters
6.33% of this county's 2021 resident taxpayers lived in other counties in 2020 ($49,380 average adjusted gross income)
| Here: | 6.33% |
| Montana average: | 8.17% |
10 or fewer of this county's residents moved from foreign countries.
3.15% relocated from other counties in Montana ($23,310 average AGI)
3.17% relocated from other states ($26,066 average AGI)
Custer County: 3.17% Montana average: 5.13%

Top counties from which taxpayers relocated into this county between 2020 and 2021:
| from Yellowstone County, MT |
6.12% of this county's 2020 resident taxpayers moved to other counties in 2021 ($45,527 average adjusted gross income)
| Here: | 6.12% |
| Montana average: | 6.62% |
10 or fewer of this county's residents moved to foreign countries.
3.40% relocated to other counties in Montana ($23,960 average AGI)
2.72% relocated to other states ($21,567 average AGI)
Custer County: 2.72% Montana average: 3.54%
Top counties to which taxpayers relocated from this county between 2020 and 2021:
| to Yellowstone County, MT |
Births per 1000 population from 1990 to 1999: 12.6
Births per 1000 population from 2000 to 2006: 12.3
Deaths per 1000 population from 1990 to 1999: 12.2
Deaths per 1000 population from 2000 to 2009: 12.3
Deaths per 1000 population from 2010 to 2020: 12.0

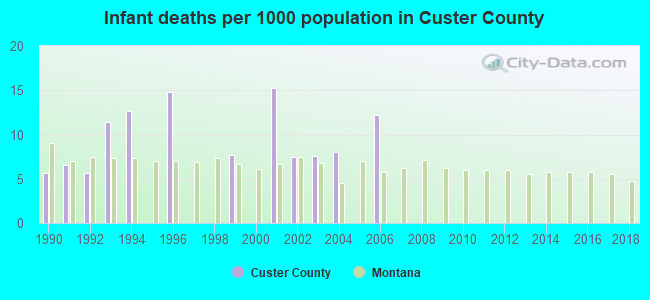
Infant deaths per 1000 live births from 1990 to 1999: 6.5
Infant deaths per 1000 live births from 2000 to 2006: 7.2
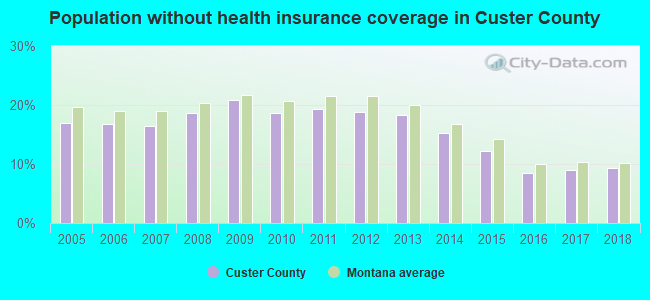
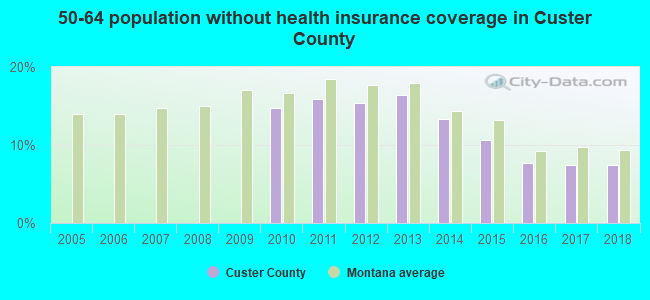
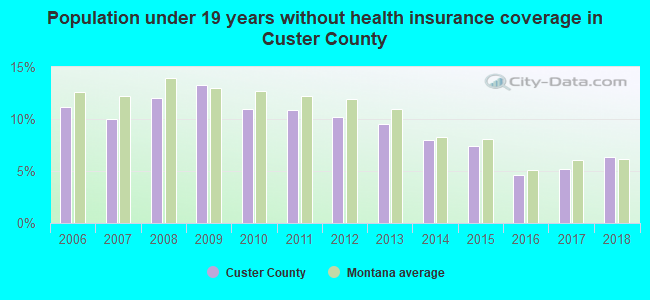
Persons under 19 years old without health insurance coverage in 2018: 6.3%
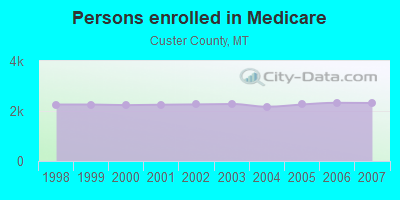
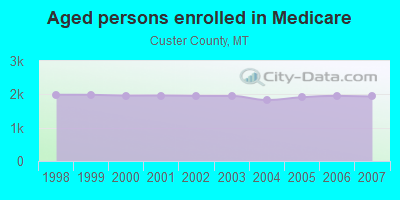
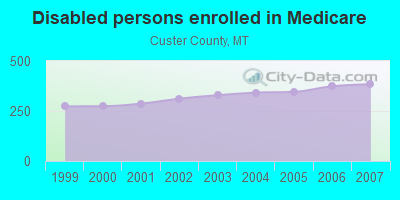
Persons enrolled in hospital insurance and/or supplemental medical insurance (Medicare) in July 1, 2007: 2,320 (1,936 aged, 384 disabled)
Children under 18 without health insurance coverage in 2007: 238 (9%)
Most common underlying causes of death in Custer County, Montana in 1999 - 2019:
- Bronchus or lung, unspecified - Malignant neoplasms (130)
- Chronic obstructive pulmonary disease, unspecified (98)
- Unspecified dementia (51)
- Acute myocardial infarction, unspecified (37)
- Atherosclerotic heart disease (29)
- Congestive heart failure (20)
- Alzheimer disease, unspecified (15)
Population without health insurance coverage in 2000: 16%
Children under 18 without health insurance coverage in 2000: 15%
Short term general hospital admissions per 100,000 population in 2004: 18,596
Short term general hospital beds per 100,000 population in 2004: 1,187
Emergency room visits per 100,000 population in 2004: 38,947
General practice office based MDs per 100,000 population in 2005: 1,092
Medical specialist MDs per 100,000 population in 2005: 1,367
Dentists per 100,000 population in 1998: 9
Total births per 100,000 population, July 2005 - July 2006 : 50
Total deaths per 100,000 population, July 2005 - July 2006: 107
Limited-service eating places per 100,000 population in 2005 : 9
Suicides per 1,000,000 population from 2000 to 2006: 302.5. This is more than state average.
Household type by relationship:
Households: 12,296- Male householders: 2,326 (835 living alone), Female householders: 2,909 (817 living alone)
2,645 spouses (2,645 opposite-sex spouses), 384 unmarried partners, (384 opposite-sex unmarried partners), 2,795 children (2,539 natural, 139 adopted, 117 stepchildren), 156 grandchildren, 64 brothers or sisters, 110 parents, 25 foster children, 42 other relatives, 383 non-relatives
- In group quarters: 454
Size of family households: 1,552 2-persons, 610 3-persons, 568 4-persons, 221 5-persons, 126 6-persons, 126 7-or-more-persons.
Size of nonfamily households: 1,653 1-person, 275 2-persons, 31 3-persons, 35 4-persons, 20 7-or-more-persons.
1,666 married couples with children.
475 single-parent households (179 men, 296 women).
95.3% of residents of Custer speak English at home.
0.9% of residents speak Spanish at home (94% speak English very well, 6% speak English not well).
2.5% of residents speak other Indo-European language at home (73% speak English very well, 9% speak English well, 18% speak English not well).
0.6% of residents speak Asian or Pacific Island language at home (44% speak English very well, 47% speak English well, 9% speak English not well).
0.6% of residents speak other language at home (100% speak English very well).
In fiscal year 2004:
Federal Government expenditure: $86,854,000 ($7,583 per capita)
Department of Defense expenditure: $1,097,000
Federal direct payments to individuals for retirement and disability: $35,211,000
Federal other direct payments to individuals: $13,608,000
Federal direct payments not to individuals: $4,606,000
Federal grants: $16,680,000
Federal procurement contracts: $3,083,000 ($0,000 Department of Defense)
Federal salaries and wages: $13,665,000 ($335,000 Department of Defense)
Federal Government direct loans: $0,000
Federal guaranteed/insured loans: $6,252,000
Federal Government insurance: $35,316,000
Population change from April 1, 2000 to July 1, 2005:
Births: 693| Here: | 62 per 1000 residents |
| State: | 62 per 1000 residents |
Deaths: 731
| Here: | 65 per 1000 residents |
| State: | 47 per 1000 residents |
Net international migration: +28
| Here: | +2 per 1000 residents |
| State: | +2 per 1000 residents |
Net internal migration: -405
| Here: | |
| State: |
Total withdrawal of fresh water for public supply: 1.67 millions of gallons per day (13% from ground, 87% from surface)
| Here: | 6.7 |
| State: | 6.4 |
| Here: | 4.5 |
| State: | 4.2 |
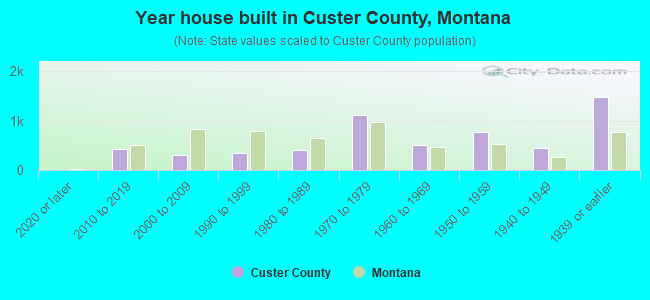
- Year house built in Custer County, Montana
- 52020 or later
- 4552010 to 2019
- 2482000 to 2009
- 3461990 to 1999
- 3421980 to 1989
- 1,1401970 to 1979
- 4871960 to 1969
- 7231950 to 1959
- 4731940 to 1949
- 1,4651939 or earlier
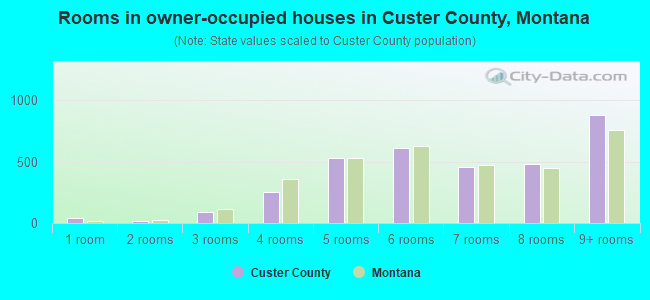
- Rooms in owner-occupied houses in Custer County, Montana
- 211 room
- 92 rooms
- 853 rooms
- 2754 rooms
- 6025 rooms
- 6076 rooms
- 5477 rooms
- 4448 rooms
- 9089+ rooms
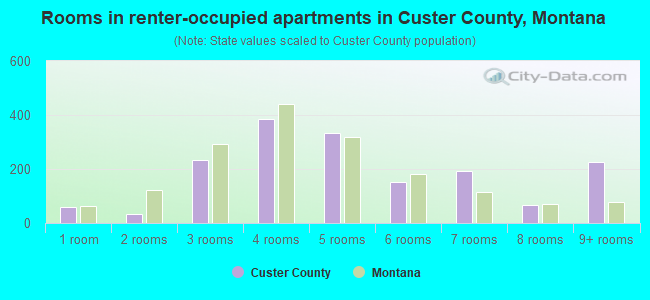
- Rooms in renter-occupied apartments in Custer County, Montana
- 771 room
- 782 rooms
- 3443 rooms
- 3534 rooms
- 3225 rooms
- 1726 rooms
- 967 rooms
- 438 rooms
- 2199+ rooms
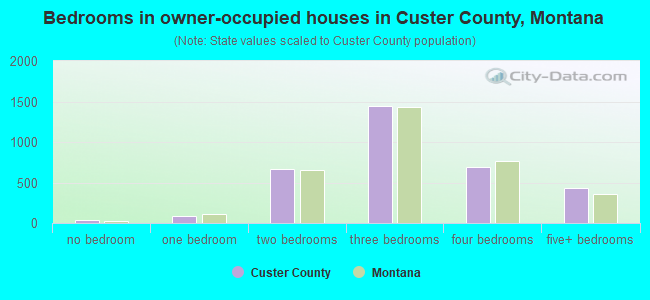
- Bedrooms in owner-occupied houses in Custer County, Montana
- 24no bedroom
- 841 bedroom
- 6302 bedrooms
- 1,4923 bedrooms
- 8094 bedrooms
- 4605+ bedrooms
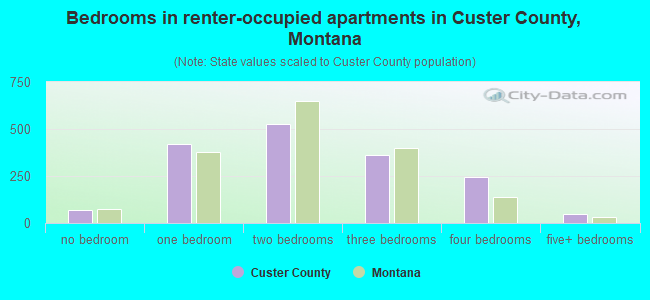
- Bedrooms in renter-occupied apartments in Custer County, Montana
- 97no bedroom
- 4441 bedroom
- 6442 bedrooms
- 3233 bedrooms
- 1454 bedrooms
- 655+ bedrooms
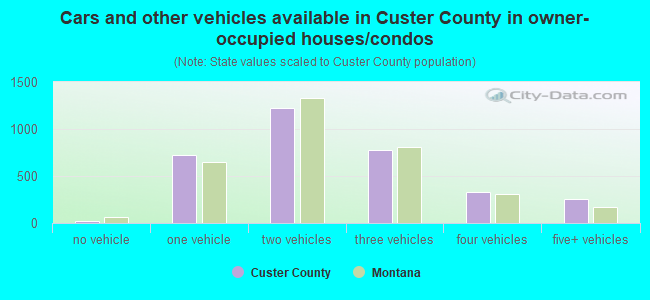
- Cars and other vehicles available in Custer County in owner-occupied houses/condos
- 36no vehicle
- 7901 vehicle
- 1,2842 vehicles
- 7403 vehicles
- 3394 vehicles
- 3285+ vehicles
- Cars and other vehicles available in Custer County in renter-occupied apartments
- 166no vehicle
- 8171 vehicle
- 4372 vehicles
- 1433 vehicles
- 714 vehicles
- 1115+ vehicles
85.7% of Custer County residents lived in the same house 1 years ago.
Out of people who lived in different houses, 31% lived in this county.
Out of people who lived in different counties, 50% lived in Montana.
| Custer County: | 85.7% |
| State average: | 86.7% |
Place of birth for U.S.-born residents:
- This state: 7,388
- Other state: 4,523
- Northeast: 279
- Midwest: 1,561
- South: 574
- West: 2,101
- 63.9%Utility gas
- 16.8%Electricity
- 14.8%Bottled, tank, or LP gas
- 2.0%Wood
- 1.0%Other fuel
- 0.8%Coal or coke
- 0.5%No fuel used
- 0.1%Fuel oil, kerosene, etc.
- 53.5%Utility gas
- 37.0%Electricity
- 7.2%Bottled, tank, or LP gas
- 1.5%Other fuel
- 0.5%Wood
- 0.2%No fuel used
Private vs. public school enrollment:
| Here: | 20.6% |
| Montana: | 15.3% |
| Here: | 7.5% |
| Montana: | 12.2% |
| Here: | 10.9% |
| Montana: | 15.0% |
Custer County government finances - Expenditure in 2018:
- Bond Funds - Cash and Securities: $321,000
- Charges - Other: $763,000
Solid Waste Management: $206,000
Parks and Recreation: $184,000
Miscellaneous Commercial Activities: $56,000
- Current Operations - Police Protection: $2,081,000
Regular Highways: $1,438,000
Judicial and Legal Services: $1,282,000
Health - Other: $713,000
Solid Waste Management: $699,000
General - Other: $469,000
Parks and Recreation: $429,000
Public Welfare - Other: $426,000
Financial Administration: $248,000
Miscellaneous Commercial Activities - Other: $200,000
General Public Buildings: $185,000
Central Staff Services: $130,000
Local Fire Protection: $91,000
Libraries: $41,000
Air Transportation: $29,000
Correctional Institutions: $8,000
- Federal Intergovernmental - Other: $564,000
General Local Government Support: $78,000
Highways: $11,000
- General - Interest on Debt: $237,000
- Intergovernmental to Local - Other - Elementary and Secondary Education: $1,740,000
- Local Intergovernmental - Other: $862,000
- Long Term Debt - Beginning Outstanding - Unspecified Public Purpose: $7,321,000
Outstanding Unspecified Public Purpose: $6,924,000
Beginning Outstanding - Public Debt for Private Purpose: $531,000
Outstanding Nonguaranteed - Industrial Revenue: $500,000
Retired Unspecified Public Purpose: $397,000
Retired Nonguaranteed - Public Debt for Private Purpose: $31,000
- Miscellaneous - Special Assessments: $498,000
Fines and Forfeits: $123,000
General Revenue - Other: $117,000
Interest Earnings: $84,000
- Other Capital Outlay - General Public Building: $135,000
General - Other: $38,000
Police Protection: $7,000
Judicial and Legal Services: $5,000
- Other Funds - Cash and Securities: $8,026,000
- Sinking Funds - Cash and Securities: $622,000
- State Intergovernmental - Other: $730,000
General Local Government Support: $299,000
Highways: $226,000
- Tax - Property: $6,598,000
Alcoholic Beverage License: $2,000
Custer County government finances - Revenue in 2018:
- Bond Funds - Cash and Securities: $321,000
- Charges - Other: $763,000
Solid Waste Management: $206,000
Parks and Recreation: $184,000
Miscellaneous Commercial Activities: $56,000
- Current Operations - Police Protection: $2,081,000
Regular Highways: $1,438,000
Judicial and Legal Services: $1,282,000
Health - Other: $713,000
Solid Waste Management: $699,000
General - Other: $469,000
Parks and Recreation: $429,000
Public Welfare - Other: $426,000
Financial Administration: $248,000
Miscellaneous Commercial Activities - Other: $200,000
General Public Buildings: $185,000
Central Staff Services: $130,000
Local Fire Protection: $91,000
Libraries: $41,000
Air Transportation: $29,000
Correctional Institutions: $8,000
- Federal Intergovernmental - Other: $564,000
General Local Government Support: $78,000
Highways: $11,000
- General - Interest on Debt: $237,000
- Intergovernmental to Local - Other - Elementary and Secondary Education: $1,740,000
- Local Intergovernmental - Other: $862,000
- Long Term Debt - Beginning Outstanding - Unspecified Public Purpose: $7,321,000
Outstanding Unspecified Public Purpose: $6,924,000
Beginning Outstanding - Public Debt for Private Purpose: $531,000
Outstanding Nonguaranteed - Industrial Revenue: $500,000
Retired Unspecified Public Purpose: $397,000
Retired Nonguaranteed - Public Debt for Private Purpose: $31,000
- Miscellaneous - Special Assessments: $498,000
Fines and Forfeits: $123,000
General Revenue - Other: $117,000
Interest Earnings: $84,000
- Other Capital Outlay - General Public Building: $135,000
General - Other: $38,000
Police Protection: $7,000
Judicial and Legal Services: $5,000
- Other Funds - Cash and Securities: $8,026,000
- Sinking Funds - Cash and Securities: $622,000
- State Intergovernmental - Other: $730,000
General Local Government Support: $299,000
Highways: $226,000
- Tax - Property: $6,598,000
Alcoholic Beverage License: $2,000
Custer County government finances - Debt in 2018:
- Bond Funds - Cash and Securities: $321,000
- Charges - Other: $763,000
Solid Waste Management: $206,000
Parks and Recreation: $184,000
Miscellaneous Commercial Activities: $56,000
- Current Operations - Police Protection: $2,081,000
Regular Highways: $1,438,000
Judicial and Legal Services: $1,282,000
Health - Other: $713,000
Solid Waste Management: $699,000
General - Other: $469,000
Parks and Recreation: $429,000
Public Welfare - Other: $426,000
Financial Administration: $248,000
Miscellaneous Commercial Activities - Other: $200,000
General Public Buildings: $185,000
Central Staff Services: $130,000
Local Fire Protection: $91,000
Libraries: $41,000
Air Transportation: $29,000
Correctional Institutions: $8,000
- Federal Intergovernmental - Other: $564,000
General Local Government Support: $78,000
Highways: $11,000
- General - Interest on Debt: $237,000
- Intergovernmental to Local - Other - Elementary and Secondary Education: $1,740,000
- Local Intergovernmental - Other: $862,000
- Long Term Debt - Beginning Outstanding - Unspecified Public Purpose: $7,321,000
Outstanding Unspecified Public Purpose: $6,924,000
Beginning Outstanding - Public Debt for Private Purpose: $531,000
Outstanding Nonguaranteed - Industrial Revenue: $500,000
Retired Unspecified Public Purpose: $397,000
Retired Nonguaranteed - Public Debt for Private Purpose: $31,000
- Miscellaneous - Special Assessments: $498,000
Fines and Forfeits: $123,000
General Revenue - Other: $117,000
Interest Earnings: $84,000
- Other Capital Outlay - General Public Building: $135,000
General - Other: $38,000
Police Protection: $7,000
Judicial and Legal Services: $5,000
- Other Funds - Cash and Securities: $8,026,000
- Sinking Funds - Cash and Securities: $622,000
- State Intergovernmental - Other: $730,000
General Local Government Support: $299,000
Highways: $226,000
- Tax - Property: $6,598,000
Alcoholic Beverage License: $2,000
Custer County government finances - Cash and Securities in 2018:
- Bond Funds - Cash and Securities: $321,000
- Charges - Other: $763,000
Solid Waste Management: $206,000
Parks and Recreation: $184,000
Miscellaneous Commercial Activities: $56,000
- Current Operations - Police Protection: $2,081,000
Regular Highways: $1,438,000
Judicial and Legal Services: $1,282,000
Health - Other: $713,000
Solid Waste Management: $699,000
General - Other: $469,000
Parks and Recreation: $429,000
Public Welfare - Other: $426,000
Financial Administration: $248,000
Miscellaneous Commercial Activities - Other: $200,000
General Public Buildings: $185,000
Central Staff Services: $130,000
Local Fire Protection: $91,000
Libraries: $41,000
Air Transportation: $29,000
Correctional Institutions: $8,000
- Federal Intergovernmental - Other: $564,000
General Local Government Support: $78,000
Highways: $11,000
- General - Interest on Debt: $237,000
- Intergovernmental to Local - Other - Elementary and Secondary Education: $1,740,000
- Local Intergovernmental - Other: $862,000
- Long Term Debt - Beginning Outstanding - Unspecified Public Purpose: $7,321,000
Outstanding Unspecified Public Purpose: $6,924,000
Beginning Outstanding - Public Debt for Private Purpose: $531,000
Outstanding Nonguaranteed - Industrial Revenue: $500,000
Retired Unspecified Public Purpose: $397,000
Retired Nonguaranteed - Public Debt for Private Purpose: $31,000
- Miscellaneous - Special Assessments: $498,000
Fines and Forfeits: $123,000
General Revenue - Other: $117,000
Interest Earnings: $84,000
- Other Capital Outlay - General Public Building: $135,000
General - Other: $38,000
Police Protection: $7,000
Judicial and Legal Services: $5,000
- Other Funds - Cash and Securities: $8,026,000
- Sinking Funds - Cash and Securities: $622,000
- State Intergovernmental - Other: $730,000
General Local Government Support: $299,000
Highways: $226,000
- Tax - Property: $6,598,000
Alcoholic Beverage License: $2,000
Supplemental Security Income (SSI) in 2006:
- Total number of recipients: 257
- Number of aged recipients: 21
- Number of blind and disabled recipients: 236
- Number of recipients under 18: 31
- Number of recipients between 18 and 64: 186
- Number of recipients older than 64: 40
- Number of recipients also receiving OASDI: 125
- Amount of payments (thousands of dollars): 109
| Most common first names in Custer County, MT among deceased individuals | ||
| Name | Count | Lived (average) |
|---|---|---|
| John | 132 | 79.2 years |
| Mary | 96 | 81.3 years |
| William | 69 | 77.2 years |
| James | 66 | 73.5 years |
| Robert | 56 | 73.7 years |
| George | 53 | 79.6 years |
| Charles | 51 | 74.9 years |
| Helen | 42 | 80.1 years |
| Margaret | 37 | 80.7 years |
| Frank | 36 | 79.3 years |
| Most common last names in Custer County, MT among deceased individuals | ||
| Last name | Count | Lived (average) |
|---|---|---|
| Anderson | 29 | 82.8 years |
| Johnson | 29 | 78.5 years |
| Miller | 29 | 81.8 years |
| Peterson | 21 | 74.0 years |
| Smith | 21 | 79.0 years |
| Olson | 20 | 72.6 years |
| Thompson | 19 | 77.9 years |
| Brown | 19 | 77.4 years |
| Jones | 17 | 77.3 years |
| Young | 16 | 75.5 years |
| Businesses in Custer County, MT | ||||
| Name | Count | Name | Count | |
|---|---|---|---|---|
| Ace Hardware | 1 | Lane Furniture | 2 | |
| Albertsons | 1 | Little Caesars Pizza | 1 | |
| Arby's | 1 | MasterBrand Cabinets | 2 | |
| Best Western | 1 | Maurices | 1 | |
| Chevrolet | 1 | McDonald's | 1 | |
| Comfort Inn | 1 | New Balance | 1 | |
| Dairy Queen | 1 | Nike | 1 | |
| Econo Lodge | 1 | RadioShack | 1 | |
| FedEx | 3 | Super 8 | 1 | |
| Ford | 1 | U-Haul | 1 | |
| H&R Block | 1 | UPS | 4 | |
| Holiday Inn | 1 | Walmart | 1 | |
| La-Z-Boy | 1 | Wendy's | 1 | |