Franklin County, Indiana (IN)
County owner-occupied free and clear houses and condos in 2010: 2,280
County owner-occupied houses and condos in 2000: 6,408
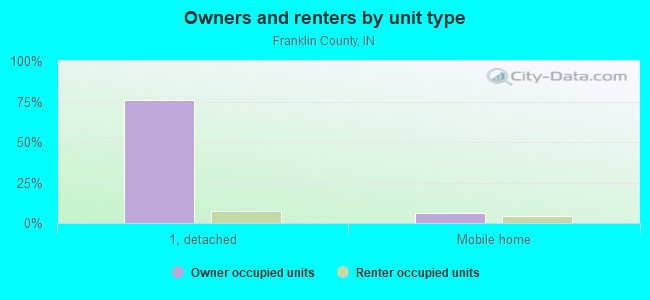
Renter-occupied apartments: 1,686 (it was 1,460 in 2000)
| % of renters here: | 19% |
| State: | 30% |
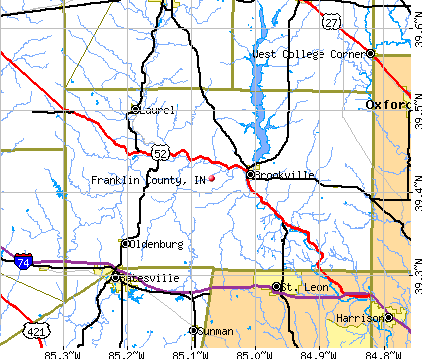
Land area: 386 sq. mi.
Water area: 5.3 sq. mi.
Population density: 60 people per square mile (average).
Industries providing employment: Manufacturing (23.7%), Educational, health and social services (20.8%), Retail trade (11.0%).
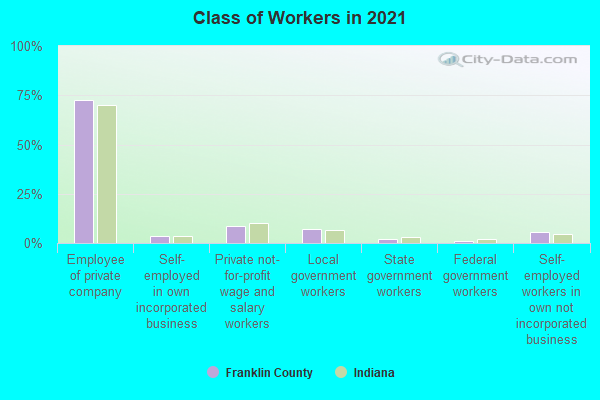
Type of workers:
- Private wage or salary: 85%
- Government: 9%
- Self-employed, not incorporated: 6%
- Unpaid family work: 0%
- OSM Map
- General Map
- Google Map
- MSN Map

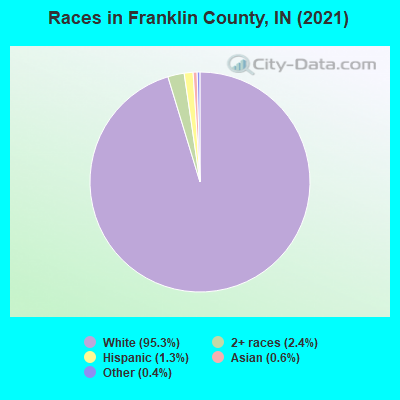
- 21,78795.6%White Non-Hispanic Alone
- 4572.0%Two or more races
- 3071.3%Hispanic or Latino
- 1360.6%Asian alone
- 940.4%Some other race alone
- 200.09%Black Non-Hispanic Alone
| Median resident age: | 42.0 years |
| Indiana median age: | 38.2 years |
| Males: 11,454 | |
| Females: 11,559 |

 | Is my impression of Indianapolis accurate? (167 replies) |
| Has Indy really gone downhill in the past 5 years ?? (122 replies) |
| Pros and Cons of Indianapolis? Indianapolis or Madison? (60 replies) |
| Anyone from COlumbus, Ohio move to Indianapolis? (51 replies) |
| Movies about Indiana.....name them (32 replies) |
| any areas in Indiana that are rural but liberal? (73 replies) |
| Franklin County: | 2.0 people |
| Indiana: | 3 people |
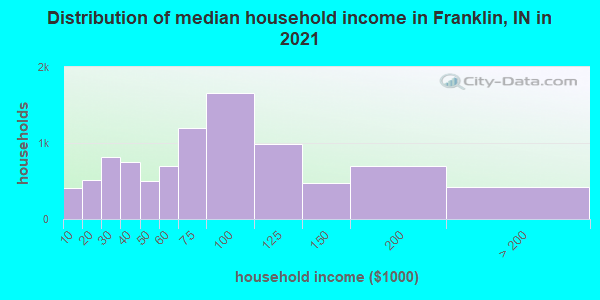
Estimated median household income in 2022: $75,546 ($43,530 in 1999)
| This county: | $75,546 |
| Indiana: | $66,785 |
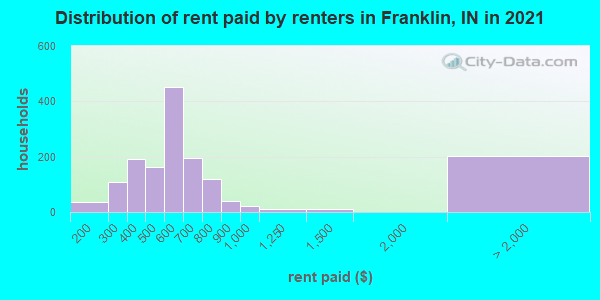
Median contract rent in 2022 for apartments: $532 (lower quartile is $425, upper quartile is $700)
| This county: | $532 |
| State: | $780 |
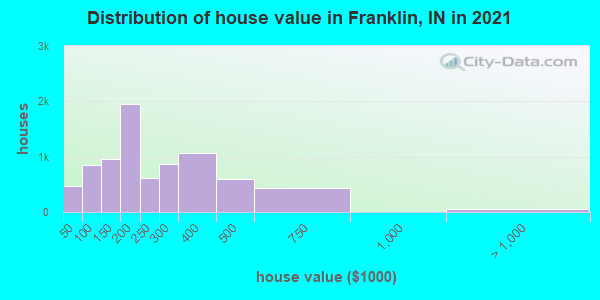
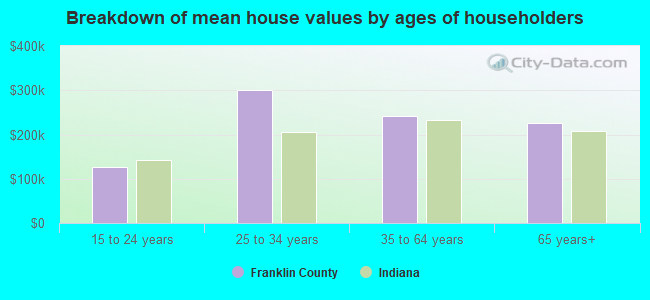
Estimated median house or condo value in 2022: $228,138 (it was $98,700 in 2000)
| Franklin: | $228,138 |
| Indiana: | $208,700 |
Median monthly housing costs for homes and condos with a mortgage: $1,421
Median monthly housing costs for units without a mortgage: $457
Institutionalized population: 74
Crime in 2020 (reported by the sheriff's office or county police, not the county total):
- Murders: 0
- Rapes: 0
- Robberies: 0
- Assaults: 8
- Burglaries: 40
- Thefts: 58
- Auto thefts: 18
Crime in 2019 (reported by the sheriff's office or county police, not the county total):
- Murders: 0
- Rapes: 0
- Robberies: 0
- Assaults: 4
- Burglaries: 30
- Thefts: 89
- Auto thefts: 18
Health of residents in Franklin County based on CDC Behavioral Risk Factor Surveillance System Survey Questionnaires from 2013 to 2021:
General health status score of residents in this county from 1 (poor) to 5 (excellent) is 3.4. This is about average.71.1% of residents exercised in the past month. This is about average.
44.4% of residents smoked 100+ cigarettes in their lives. This is about average.
51.4% of adult residents drank alcohol in the past 30 days. This is less than average.
67.6% of residents visited a dentist within the past year. This is about average.
Average weight of males is 202 pounds. This is more than average.
Average weight of females is 167 pounds. This is more than average.
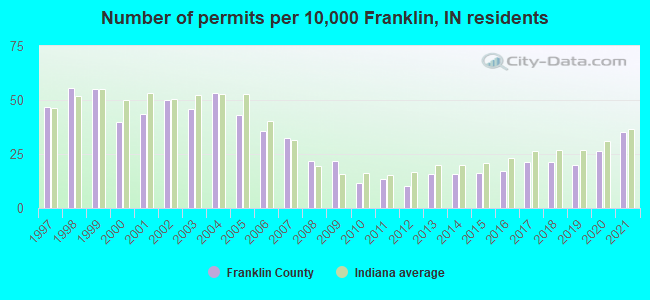
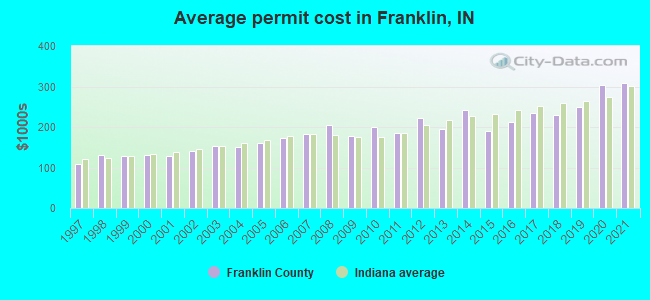
Single-family new house construction building permits:
- 2022: 50 buildings, average cost: $296,800
- 2021: 78 buildings, average cost: $309,200
- 2020: 58 buildings, average cost: $303,700
- 2019: 44 buildings, average cost: $248,800
- 2018: 47 buildings, average cost: $230,300
- 2017: 47 buildings, average cost: $233,800
- 2016: 38 buildings, average cost: $212,700
- 2015: 36 buildings, average cost: $191,400
- 2014: 35 buildings, average cost: $240,900
- 2013: 35 buildings, average cost: $195,400
- 2012: 23 buildings, average cost: $221,000
- 2011: 30 buildings, average cost: $185,300
- 2010: 26 buildings, average cost: $201,100
- 2009: 48 buildings, average cost: $176,800
- 2008: 48 buildings, average cost: $205,300
- 2007: 72 buildings, average cost: $181,800
- 2006: 79 buildings, average cost: $172,900
- 2005: 95 buildings, average cost: $161,400
- 2004: 118 buildings, average cost: $150,200
- 2003: 102 buildings, average cost: $152,300
- 2002: 111 buildings, average cost: $139,600
- 2001: 96 buildings, average cost: $128,700
- 2000: 88 buildings, average cost: $131,800
- 1999: 122 buildings, average cost: $128,800
- 1998: 123 buildings, average cost: $131,000
- 1997: 104 buildings, average cost: $108,500
Median real estate property taxes paid for housing units with mortgages in 2022: $1,427 (0.5%)
Median real estate property taxes paid for housing units with no mortgage in 2022: $1,337 (0.7%)
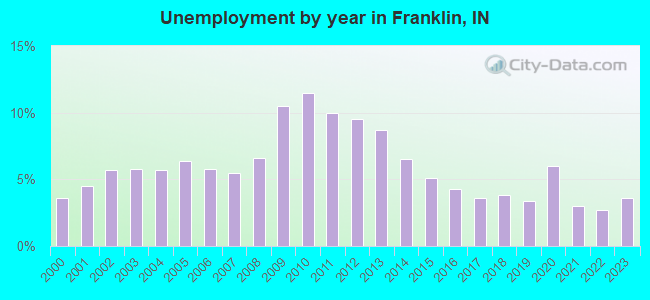
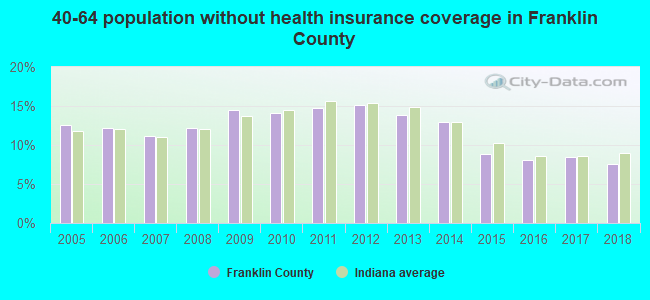
| Franklin County: | 7.5% |
| Indiana: | 12.6% |
Median age of residents in 2022: 42.0 years old
(Males: 41.0 years old, Females: 42.8 years old)
(Median age for: White residents: 42.7 years old, Asian residents: 71.4 years old, Hispanic or Latino residents: 33.7 years old, Other race residents: 19.0 years old)
Area name: Cincinnati-Middleton, OH-KY-IN HUD Metro FMR Area
Fair market rent in 2006 for a 1-bedroom apartment in Franklin County is $506 a month.
Fair market rent for a 2-bedroom apartment is $655 a month.
Fair market rent for a 3-bedroom apartment is $877 a month.
Cities in this county include: Brookville, Oldenburg, Laurel, New Trenton, Metamora, Cedar Grove, Mount Carmel.
Neighboring counties: Adams County, Colorado  , Marion County, West Virginia
  , Loudoun County, Virginia , Susquehanna County, Pennsylvania
  .
.
| Here: | 2.5% |
| Indiana: | 2.8% |
Current college students: 684
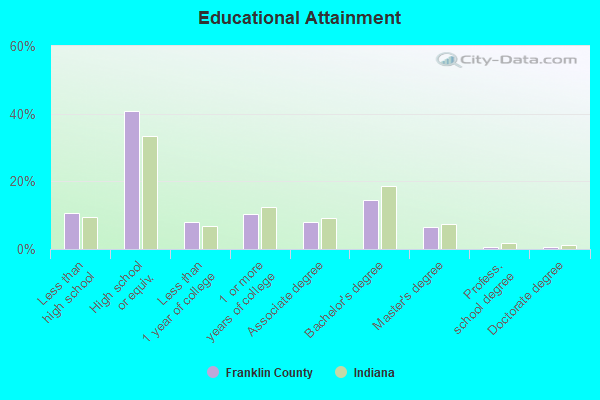
People 25 years of age or older with a high school degree or higher: 89.5%
People 25 years of age or older with a bachelor's degree or higher: 20.7%
Number of foreign born residents: 268 (64.7% naturalized citizens)
| Franklin County: | 1.2% |
| Whole state: | 6.1% |
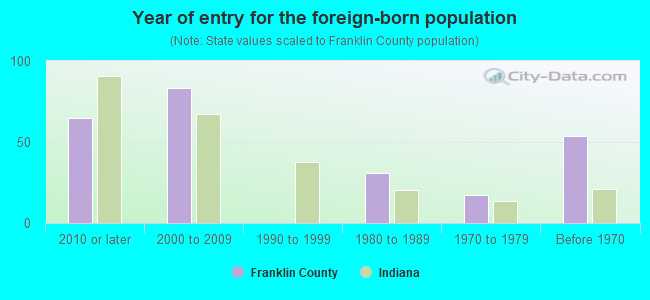
- Year of entry for the foreign-born population
- 762010 or later
- 852000 to 2009
- 01990 to 1999
- 311980 to 1989
- 171970 to 1979
- 54Before 1970
Mean travel time to work (commute): " minutes
Percentage of county residents living and working in this county: 68.9%
Housing units in structures:
- One, detached: 7,835
- One, attached: 18
- Two: 307
- 3 or 4: 96
- 5 to 9: 113
- 10 to 19: 53
- 20 to 49: 76
- 50 or more: 84
- Mobile homes: 1,189
- Boats, RVs, vans, etc.: 12
Housing units in Franklin County with a mortgage: 4,225 (661 second mortgage, 27 home equity loan, 541 both second mortgage and home equity loan)
Houses without a mortgage: 104
| Here: | 3.7% with mortgage |
| State: | 96.6% with mortgage |
Religion statistics for Franklin County
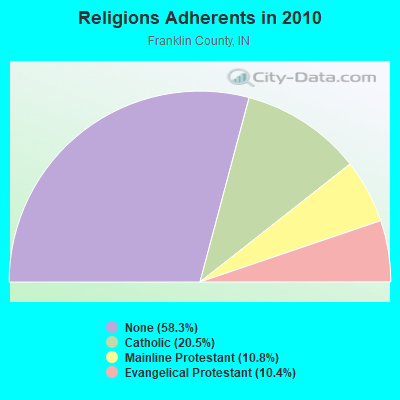
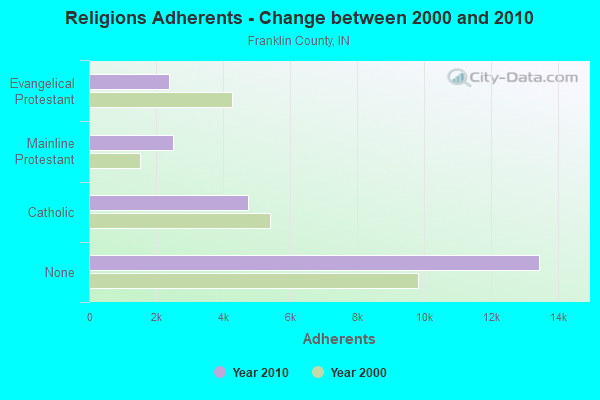
| Religion | Adherents | Congregations |
|---|---|---|
| Catholic | 4,743 | 7 |
| Mainline Protestant | 2,499 | 15 |
| Evangelical Protestant | 2,391 | 20 |
| Other | 4 | - |
| None | 13,450 | - |
Source: Clifford Grammich, Kirk Hadaway, Richard Houseal, Dale E.Jones, Alexei Krindatch, Richie Stanley and Richard H.Taylor. 2012. 2010 U.S.Religion Census: Religious Congregations & Membership Study. Association of Statisticians of American Religious Bodies. Jones, Dale E., et al. 2002. Congregations and Membership in the United States 2000. Nashville, TN: Glenmary Research Center.
Food Environment Statistics:
| Franklin County: | 5.18 / 10,000 pop. |
| State: | 1.73 / 10,000 pop. |
| This county: | 0.43 / 10,000 pop. |
| Indiana: | 0.50 / 10,000 pop. |
| Franklin County: | 2.59 / 10,000 pop. |
| Indiana: | 3.57 / 10,000 pop. |
| This county: | 6.47 / 10,000 pop. |
| State: | 6.78 / 10,000 pop. |
| Franklin County: | 9.1% |
| Indiana: | 9.2% |
| Franklin County: | 28.6% |
| State: | 29.0% |
| Here: | 13.0% |
| State: | 14.3% |
Agriculture in Franklin County:
Average size of farms: 171 acresAverage value of agricultural products sold per farm: $30,464
Average value of crops sold per acre for harvested cropland: $179.51
The value of nursery, greenhouse, floriculture, and sod as a percentage of the total market value of agricultural products sold: 3.33%
The value of livestock, poultry, and their products as a percentage of the total market value of agricultural products sold: 43.14%
Average total farm production expenses per farm: $26,430
Harvested cropland as a percentage of land in farms: 56.53%
Average market value of all machinery and equipment per farm: $51,222
The percentage of farms operated by a family or individual: 90.82%
Average age of principal farm operators: 53 years
Average number of cattle and calves per 100 acres of all land in farms: 10.24
Milk cows as a percentage of all cattle and calves: 8.06%
Corn for grain: 29218 harvested acres
All wheat for grain: 2193 harvested acres
Soybeans for beans: 34891 harvested acres
Vegetables: 49 harvested acres
Land in orchards: 97 acres
Earthquake activity:
Franklin County-area historical earthquake activity is significantly above Indiana state average. It is 58% greater than the overall U.S. average.On 7/27/1980 at 18:52:21, a magnitude 5.2 (5.1 MB, 4.7 MS, 5.0 UK, 5.2 UK, Class: Moderate, Intensity: VI - VII) earthquake occurred 103.5 miles away from Franklin County center
On 4/18/2008 at 09:36:59, a magnitude 5.4 (5.1 MB, 4.8 MS, 5.4 MW, 5.2 MW) earthquake occurred 165.6 miles away from the county center
On 4/18/2008 at 09:36:59, a magnitude 5.2 (5.2 MW, Depth: 8.9 mi) earthquake occurred 165.6 miles away from the county center
On 6/10/1987 at 23:48:54, a magnitude 5.1 (4.9 MB, 4.4 MS, 4.6 MS, 5.1 LG) earthquake occurred 156.6 miles away from the county center
On 6/18/2002 at 17:37:15, a magnitude 5.0 (4.3 MB, 4.6 MW, 5.0 LG) earthquake occurred 176.6 miles away from Franklin County center
On 7/12/1986 at 08:19:37, a magnitude 4.5 (4.5 MB, Class: Light, Intensity: IV - V) earthquake occurred 85.9 miles away from the county center
Magnitude types: regional Lg-wave magnitude (LG), body-wave magnitude (MB), surface-wave magnitude (MS), moment magnitude (MW)
Most recent natural disasters:
- Indiana Covid-19 Pandemic, Incident Period: January 31, 2020, FEMA Id: 4515, Natural disaster type: Other
- Indiana Severe Storms, Tornadoes, Straight-Line Winds, and Flooding, Incident Period: April 19, 2011 to June 06, 2011, Major Disaster (Presidential) Declared DR-1997: June 23, 2011, FEMA Id: 1997, Natural disaster type: Storm, Tornado, Flood, Wind
- Indiana Severe Storms and Flooding, Incident Period: September 12, 2008 to October 06, 2008, Major Disaster (Presidential) Declared DR-1795: September 23, 2008, FEMA Id: 1795, Natural disaster type: Storm, Flood
- Indiana Severe Storms and Flooding, Incident Period: May 30, 2008 to June 27, 2008, Major Disaster (Presidential) Declared DR-1766: June 08, 2008, FEMA Id: 1766, Natural disaster type: Storm, Flood
- Indiana Hurricane Katrina Evacuation, Incident Period: August 29, 2005 to October 01, 2005, Emergency Declared EM-3238: September 10, 2005, FEMA Id: 3238, Natural disaster type: Hurricane
- Indiana Severe Winter Storms and Flooding, Incident Period: January 01, 2005 to February 11, 2005, Major Disaster (Presidential) Declared DR-1573: January 21, 2005, FEMA Id: 1573, Natural disaster type: Winter Storm, Flood
- Indiana Snow, Incident Period: December 21, 2004 to December 23, 2004, Emergency Declared EM-3197: January 11, 2005, FEMA Id: 3197, Natural disaster type: Snow
- Indiana Severe Storms, Tornadoes, and Flooding, Incident Period: May 25, 2004 to June 25, 2004, Major Disaster (Presidential) Declared DR-1520: June 03, 2004, FEMA Id: 1520, Natural disaster type: Storm, Tornado, Flood
- Indiana Severe Storms and Tornadoes, Incident Period: September 20, 2002, Major Disaster (Presidential) Declared DR-1433: September 25, 2002, FEMA Id: 1433, Natural disaster type: Storm, Tornado
- Indiana Severe Storms, Tornadoes and Flooding, Incident Period: April 28, 2002 to June 07, 2002, Major Disaster (Presidential) Declared DR-1418: June 13, 2002, FEMA Id: 1418, Natural disaster type: Storm, Tornado, Flood
- 9 other natural disasters have been reported since 1953.
The number of natural disasters in Franklin County (19) is greater than the US average (15).
Major Disasters (Presidential) Declared: 15
Emergencies Declared: 3
Causes of natural disasters: Floods: 12, Storms: 10, Tornadoes: 8, Blizzard: 1, Hurricane: 1, Snow: 1, Snowstorm: 1, Wind: 1, Winter Storm: 1, Other: 1 (Note: some incidents may be assigned to more than one category).
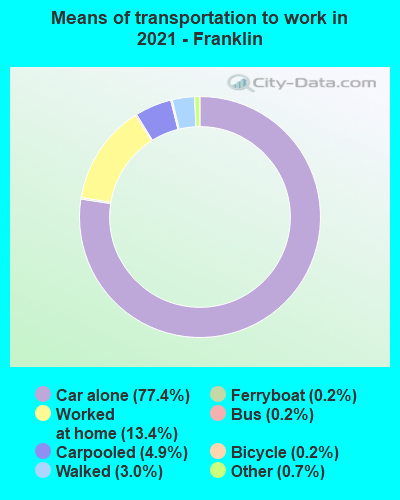
Means of transportation to work:
- Drove a car alone: 4,577 (70.1%)
- Carpooled: 377 (5.8%)
- Ferryboat: 9 (0.1%)
- Taxicab, motorcycle, or other means: 44 (0.7%)
- Bicycle: 19 (0.3%)
- Walked: 196 (3.0%)
- Worked at home: 1,472 (22.5%)
- Health care and social assistance (23%)
- Manufacturing (10%)
- Educational services (9%)
- Retail trade (9%)
- Other services, except public administration (5%)
- Finance and insurance (4%)
- Professional, scientific, and technical services (4%)
- Health care and social assistance (28%)
- Manufacturing (13%)
- Educational services (11%)
- Retail trade (11%)
- Other services, except public administration (6%)
- Finance and insurance (5%)
- Professional, scientific, and technical services (4%)
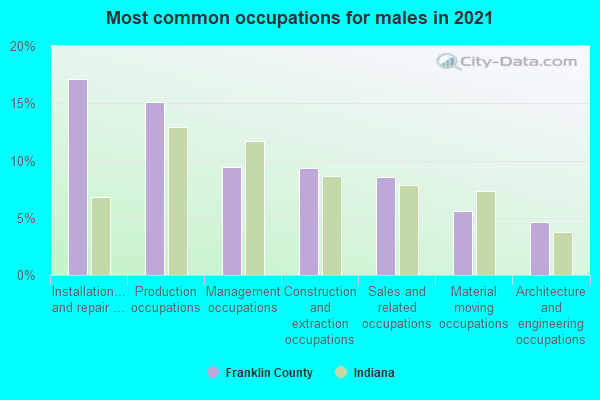
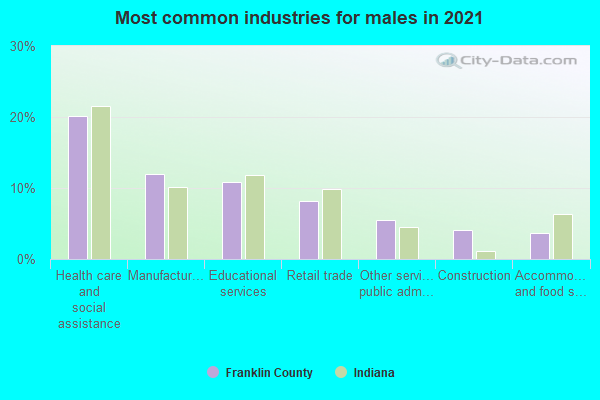
- Production occupations (15%)
- Installation, maintenance, and repair occupations (14%)
- Construction and extraction occupations (11%)
- Sales and related occupations (8%)
- Management occupations (7%)
- Material moving occupations (6%)
- Office and administrative support occupations (5%)
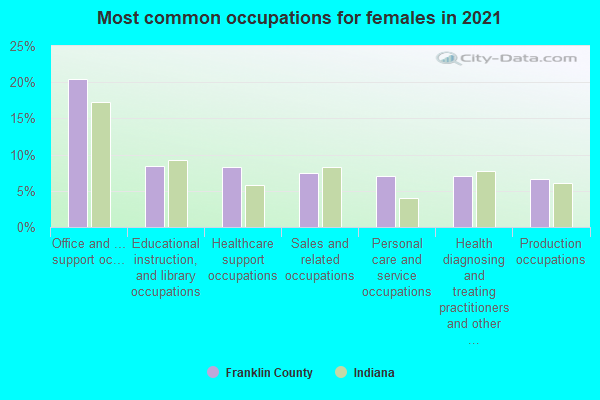
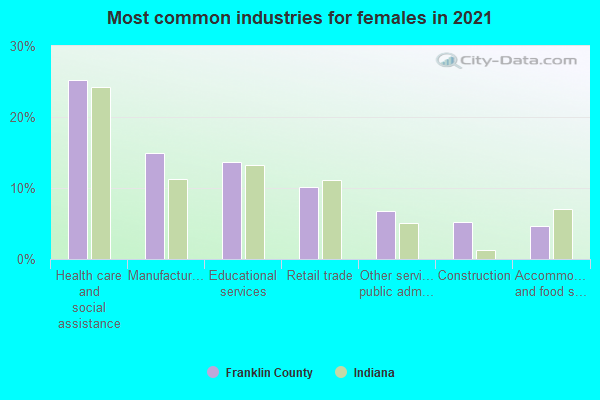
- Office and administrative support occupations (20%)
- Health technologists and technicians (8%)
- Health diagnosing and treating practitioners and other technical occupations (8%)
- Management occupations (8%)
- Production occupations (8%)
- Sales and related occupations (7%)
- Healthcare support occupations (6%)
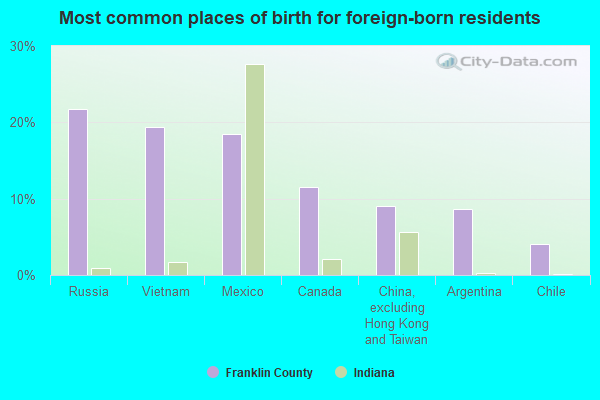
- Vietnam (22%)
- Mexico (20%)
- Russia (13%)
- Canada (13%)
- China, excluding Hong Kong and Taiwan (7%)
- Argentina (5%)
- Chile (3%)
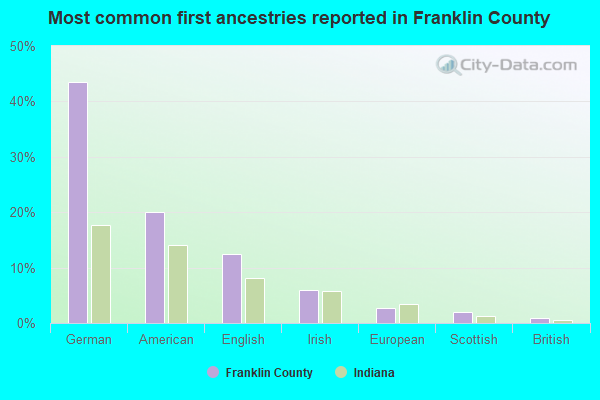
- German (38%)
- American (25%)
- English (10%)
- Irish (5%)
- European (3%)
- Scottish (2%)
- British (1%)
74 people in nursing facilities/skilled-nursing facilities
People in group quarters in Franklin County, Indiana in 2000:
- 155 people in religious group quarters
- 139 people in nursing homes
- 56 people in local jails and other confinement facilities (including police lockups)
- 8 people in other group homes
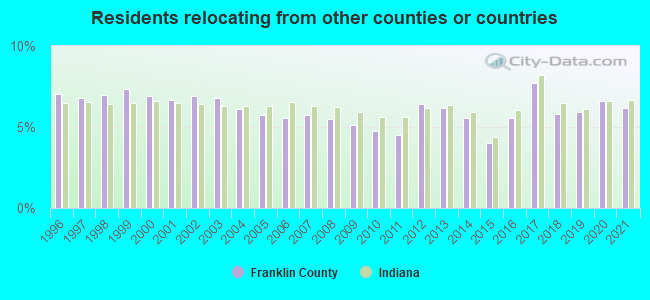
6.20% of this county's 2021 resident taxpayers lived in other counties in 2020 ($60,778 average adjusted gross income)
| Here: | 6.20% |
| Indiana average: | 6.66% |
10 or fewer of this county's residents moved from foreign countries.
3.81% relocated from other counties in Indiana ($36,229 average AGI)
2.39% relocated from other states ($24,550 average AGI)
Franklin County: 2.39% Indiana average: 2.58%
Top counties from which taxpayers relocated into this county between 2020 and 2021:
| from Ripley County, IN | |
| from Hamilton County, OH | |
| from Dearborn County, IN | |
| from Butler County, OH | |
| from Decatur County, IN | |
| from Fayette County, IN | |
| from Marion County, IN |
5.52% of this county's 2020 resident taxpayers moved to other counties in 2021 ($51,479 average adjusted gross income)
| Here: | 5.52% |
| Indiana average: | 6.55% |
10 or fewer of this county's residents moved to foreign countries.
3.51% relocated to other counties in Indiana ($32,925 average AGI)
2.01% relocated to other states ($18,554 average AGI)
Franklin County: 2.01% Indiana average: 2.46%

Top counties to which taxpayers relocated from this county between 2020 and 2021:
| to Ripley County, IN | |
| to Hamilton County, OH | |
| to Fayette County, IN | |
| to Dearborn County, IN | |
| to Butler County, OH | |
| to Decatur County, IN |
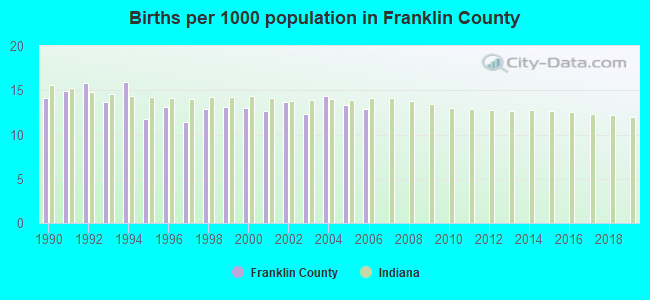
Births per 1000 population from 1990 to 1999: 13.7
Births per 1000 population from 2000 to 2006: 13.2
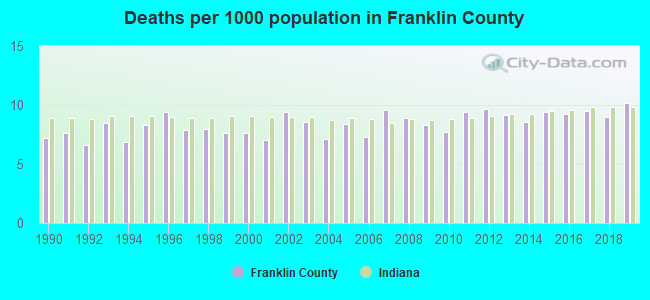
Deaths per 1000 population from 1990 to 1999: 7.8
Deaths per 1000 population from 2000 to 2009: 8.2
Deaths per 1000 population from 2010 to 2020: 9.5
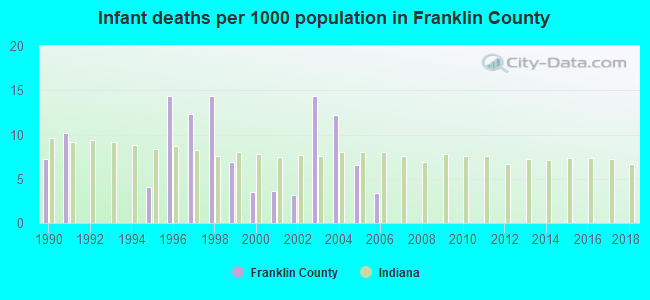
Infant deaths per 1000 live births from 1990 to 1999: 6.9
Infant deaths per 1000 live births from 2000 to 2006: 6.7
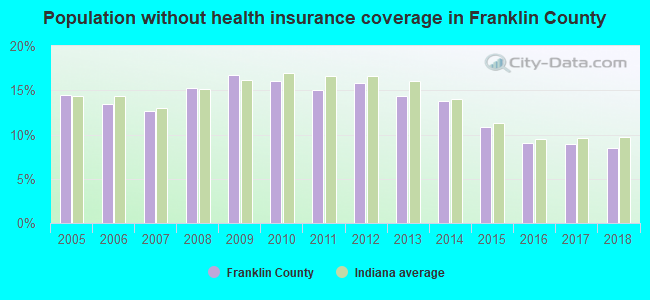
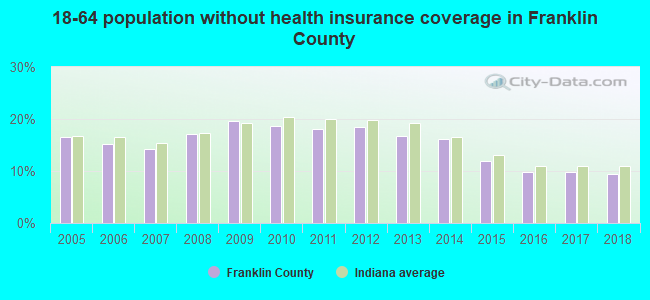
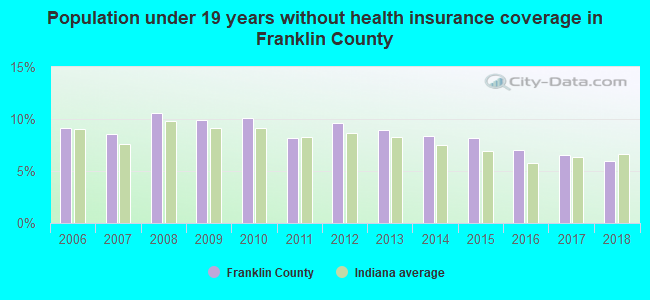
Persons under 19 years old without health insurance coverage in 2018: 6.0%
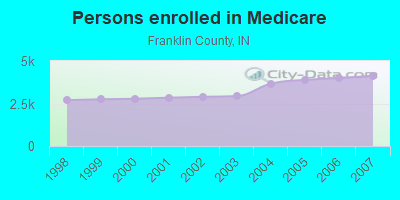
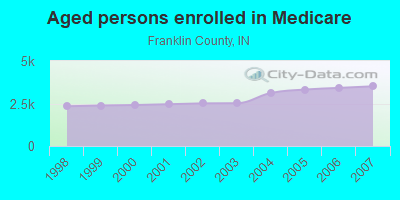
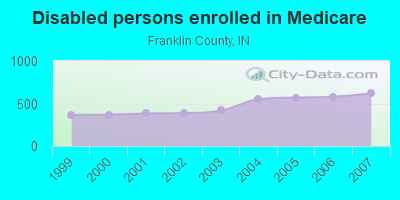
Persons enrolled in hospital insurance and/or supplemental medical insurance (Medicare) in July 1, 2007: 4,132 (3,512 aged, 620 disabled)
Children under 18 without health insurance coverage in 2007: 488 (8%)
Most common underlying causes of death in Franklin County, Indiana in 1999 - 2019:
- Atherosclerotic heart disease (316)
- Bronchus or lung, unspecified - Malignant neoplasms (240)
- Acute myocardial infarction, unspecified (224)
- Chronic obstructive pulmonary disease, unspecified (104)
- Alzheimer disease, unspecified (92)
- Unspecified dementia (75)
- Congestive heart failure (20)
- Stroke, not specified as haemorrhage or infarction (13)
Population without health insurance coverage in 2000: 9%
Children under 18 without health insurance coverage in 2000: 8%
Medical specialist MDs per 100,000 population in 2005: 663
Dentists per 100,000 population in 1998: 9
Total births per 100,000 population, July 2005 - July 2006 : 14
Total deaths per 100,000 population, July 2005 - July 2006: 52
Limited-service eating places per 100,000 population in 2005 : 13
Household type by relationship:
Households: 23,013- Male householders: 4,769 (1,353 living alone), Female householders: 4,448 (1,204 living alone)
5,159 spouses (5,099 opposite-sex spouses), 517 unmarried partners, (511 opposite-sex unmarried partners), 6,918 children (6,477 natural, 183 adopted, 253 stepchildren), 327 grandchildren, 218 brothers or sisters, 133 parents, 15 foster children, 161 other relatives, 240 non-relatives
- In group quarters: 186
Size of family households: 3,169 2-persons, 1,386 3-persons, 833 4-persons, 581 5-persons, 134 6-persons, 217 7-or-more-persons.
Size of nonfamily households: 2,555 1-person, 340 2-persons, 6 3-persons, 11 5-persons.
3,618 married couples with children.
1,102 single-parent households (416 men, 686 women).
95.8% of residents of Franklin speak English at home.
0.6% of residents speak Spanish at home (18% speak English very well, 14% speak English well, 68% speak English not well).
1.8% of residents speak other Indo-European language at home (64% speak English very well, 5% speak English well, 26% speak English not well, 4% don't speak English at all).
1.3% of residents speak Asian or Pacific Island language at home (83% speak English very well, 10% speak English well, 6% speak English not well).
0.2% of residents speak other language at home (100% speak English not well).
In fiscal year 2004:
Federal Government expenditure: $81,687,000 ($3,575 per capita)
Department of Defense expenditure: $1,187,000
Federal direct payments to individuals for retirement and disability: $41,149,000
Federal other direct payments to individuals: $16,909,000
Federal direct payments not to individuals: $3,182,000
Federal grants: $16,768,000
Federal procurement contracts: $1,011,000 ($350,000 Department of Defense)
Federal salaries and wages: $2,668,000 ($88,000 Department of Defense)
Federal Government direct loans: $450,000
Federal guaranteed/insured loans: $7,079,000
Federal Government insurance: $17,865,000
Population change from April 1, 2000 to July 1, 2005:
Births: 1,358| Here: | 59 per 1000 residents |
| State: | 72 per 1000 residents |
Deaths: 894
| Here: | 39 per 1000 residents |
| State: | 47 per 1000 residents |
Net international migration: +6
| Here: | +0 per 1000 residents |
| State: | +9 per 1000 residents |
Net internal migration: +496
| Here: | |
| State: |
Total withdrawal of fresh water for public supply: 2.39 millions of gallons per day (all from ground)
| Here: | 6.7 |
| State: | 6.6 |
| Here: | 4.3 |
| State: | 4.3 |
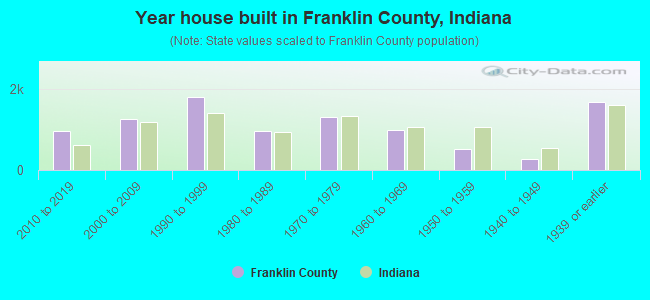
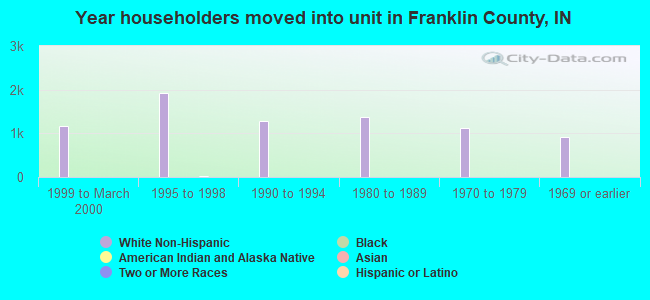
- Year house built in Franklin County, Indiana
- 832020 or later
- 9442010 to 2019
- 1,1192000 to 2009
- 1,8161990 to 1999
- 1,1101980 to 1989
- 1,2021970 to 1979
- 9531960 to 1969
- 5901950 to 1959
- 3611940 to 1949
- 1,5501939 or earlier
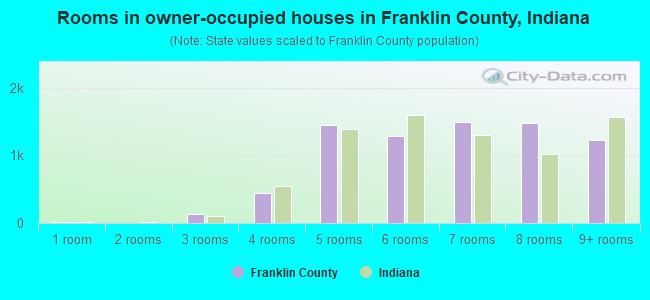
- Rooms in owner-occupied houses in Franklin County, Indiana
- 121 room
- 72 rooms
- 1623 rooms
- 5724 rooms
- 1,5545 rooms
- 1,1596 rooms
- 1,4427 rooms
- 1,3678 rooms
- 1,2859+ rooms
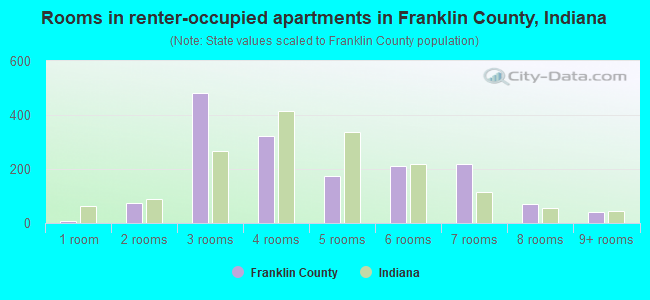
- Rooms in renter-occupied apartments in Franklin County, Indiana
- 01 room
- 472 rooms
- 5093 rooms
- 3294 rooms
- 2485 rooms
- 2156 rooms
- 1937 rooms
- 838 rooms
- 459+ rooms
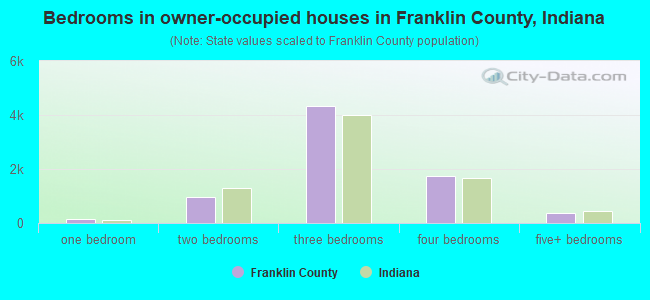
- Bedrooms in owner-occupied houses in Franklin County, Indiana
- 20no bedroom
- 1271 bedroom
- 1,0062 bedrooms
- 4,3253 bedrooms
- 1,7814 bedrooms
- 3165+ bedrooms

- Bedrooms in renter-occupied apartments in Franklin County, Indiana
- 0no bedroom
- 6051 bedroom
- 4872 bedrooms
- 4503 bedrooms
- 1214 bedrooms
- 245+ bedrooms
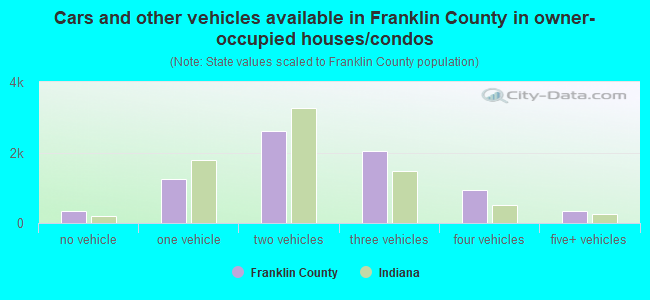
- Cars and other vehicles available in Franklin County in owner-occupied houses/condos
- 398no vehicle
- 1,4251 vehicle
- 2,3532 vehicles
- 2,0603 vehicles
- 9424 vehicles
- 3815+ vehicles
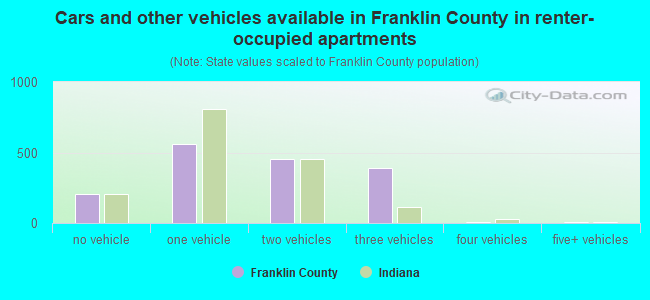
- Cars and other vehicles available in Franklin County in renter-occupied apartments
- 305no vehicle
- 5961 vehicle
- 4582 vehicles
- 2573 vehicles
- 304 vehicles
- 115+ vehicles
93.6% of Franklin County residents lived in the same house 1 years ago.
Out of people who lived in different houses, 25% lived in this county.
Out of people who lived in different counties, 71% lived in Indiana.
| Franklin County: | 93.6% |
| State average: | 87.1% |
Place of birth for U.S.-born residents:
- This state: 10,992
- Other state: 11,622
- Northeast: 387
- Midwest: 9,203
- South: 1,647
- West: 411
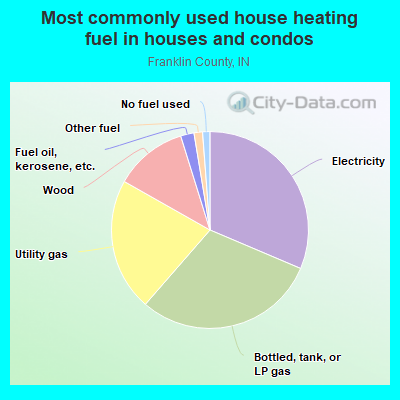
- 32.0%Bottled, tank, or LP gas
- 29.9%Electricity
- 20.5%Utility gas
- 12.2%Wood
- 3.3%Fuel oil, kerosene, etc.
- 1.1%Other fuel
- 1.0%No fuel used
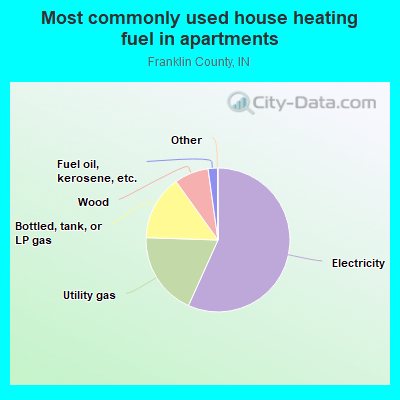
- 56.5%Electricity
- 18.7%Utility gas
- 15.1%Bottled, tank, or LP gas
- 7.5%Wood
- 2.2%Fuel oil, kerosene, etc.
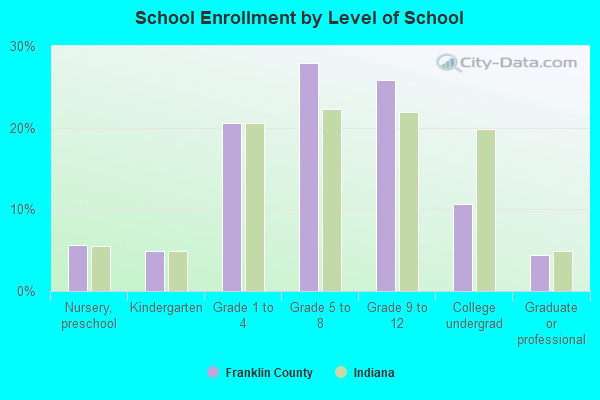
Private vs. public school enrollment:
| Here: | 25.1% |
| Indiana: | 14.9% |
| Here: | 18.3% |
| Indiana: | 11.4% |
| Here: | 15.3% |
| Indiana: | 22.3% |
Franklin County government finances - Expenditure in 2020:
- Bond Funds - Cash and Securities: $1,047,000
Cash and Securities: $679,000
- Charges - Other: $1,095,000
Sewerage: $15,000
Sewerage: $1,000
- Construction - Regular Highways: $1,177,000
Regular Highways: $449,000
General - Other: $174,000
General - Other: $143,000
- Current Operations - Police Protection: $3,326,000
Police Protection: $3,273,000
Regular Highways: $2,565,000
General - Other: $2,344,000
Central Staff Services: $2,053,000
Central Staff Services: $1,971,000
General - Other: $994,000
Judicial and Legal Services: $805,000
Correctional Institutions: $787,000
Financial Administration: $780,000
Financial Administration: $758,000
Judicial and Legal Services: $722,000
Regular Highways: $353,000
Health - Other: $353,000
Health - Other: $339,000
Correctional Institutions: $259,000
Parks and Recreation: $245,000
Natural Resources - Other: $225,000
Corrections - Other: $217,000
Natural Resources - Other: $182,000
Parks and Recreation: $178,000
Corrections - Other: $174,000
Public Welfare - Other: $142,000
Solid Waste Management: $133,000
Solid Waste Management: $122,000
Sewerage: $34,000
Miscellaneous Commercial Activities - Other: $22,000
Miscellaneous Commercial Activities - Other: $11,000
Housing and Community Development: $10,000
Sewerage: $1,000
- Federal Intergovernmental - Other: $14,000
Other: $13,000
- General - Interest on Debt: $57,000
Interest on Debt: $46,000
- Local Intergovernmental - Highways: $23,000
- Long Term Debt - Beginning Outstanding - Unspecified Public Purpose: $1,423,000
Outstanding Unspecified Public Purpose: $1,423,000
Outstanding Unspecified Public Purpose: $1,142,000
Beginning Outstanding - Unspecified Public Purpose: $1,142,000
- Miscellaneous - General Revenue - Other: $883,000
General Revenue - Other: $697,000
Interest Earnings: $282,000
Donations From Private Sources: $52,000
Donations From Private Sources: $41,000
Interest Earnings: $38,000
Sale of Property: $28,000
Sale of Property: $5,000
Fines and Forfeits: $4,000
Rents: $4,000
Fines and Forfeits: $4,000
- Other Capital Outlay - Regular Highways: $814,000
Regular Highways: $360,000
General - Other: $110,000
Police Protection: $107,000
Parks and Recreation: $57,000
Correctional Institutions: $46,000
Police Protection: $37,000
Parks and Recreation: $24,000
Correctional Institutions: $23,000
Corrections - Other: $22,000
Central Staff Services: $20,000
Financial Administration: $5,000
Health - Other: $4,000
Judicial and Legal Services: $4,000
Solid Waste Management: $3,000
Financial Administration: $2,000
Natural Resources - Other: $2,000
Central Staff Services: $1,000
General - Other: $1,000
Health - Other: $1,000
Natural Resources - Other: $1,000
Judicial and Legal Services: $1,000
- Other Funds - Cash and Securities: $12,191,000
Cash and Securities: $10,439,000
- State Intergovernmental - Other: $13,706,000
Other: $11,561,000
Highways: $4,052,000
General Local Government Support: $619,000
General Local Government Support: $519,000
Highways: $171,000
- Tax - Property: $3,995,000
Property: $3,587,000
Public Utilities Sales: $415,000
Public Utilities Sales: $392,000
Other Selective Sales: $118,000
Other: $116,000
Other Selective Sales: $75,000
Other License: $66,000
Other License: $59,000
Other: $52,000
- Total Salaries and Wages: $27,000
: $16,000
Franklin County government finances - Revenue in 2020:
- Bond Funds - Cash and Securities: $1,047,000
Cash and Securities: $679,000
- Charges - Other: $1,095,000
Sewerage: $15,000
Sewerage: $1,000
- Construction - Regular Highways: $1,177,000
Regular Highways: $449,000
General - Other: $174,000
General - Other: $143,000
- Current Operations - Police Protection: $3,326,000
Police Protection: $3,273,000
Regular Highways: $2,565,000
General - Other: $2,344,000
Central Staff Services: $2,053,000
Central Staff Services: $1,971,000
General - Other: $994,000
Judicial and Legal Services: $805,000
Correctional Institutions: $787,000
Financial Administration: $780,000
Financial Administration: $758,000
Judicial and Legal Services: $722,000
Regular Highways: $353,000
Health - Other: $353,000
Health - Other: $339,000
Correctional Institutions: $259,000
Parks and Recreation: $245,000
Natural Resources - Other: $225,000
Corrections - Other: $217,000
Natural Resources - Other: $182,000
Parks and Recreation: $178,000
Corrections - Other: $174,000
Public Welfare - Other: $142,000
Solid Waste Management: $133,000
Solid Waste Management: $122,000
Sewerage: $34,000
Miscellaneous Commercial Activities - Other: $22,000
Miscellaneous Commercial Activities - Other: $11,000
Housing and Community Development: $10,000
Sewerage: $1,000
- Federal Intergovernmental - Other: $14,000
Other: $13,000
- General - Interest on Debt: $57,000
Interest on Debt: $46,000
- Local Intergovernmental - Highways: $23,000
- Long Term Debt - Beginning Outstanding - Unspecified Public Purpose: $1,423,000
Outstanding Unspecified Public Purpose: $1,423,000
Outstanding Unspecified Public Purpose: $1,142,000
Beginning Outstanding - Unspecified Public Purpose: $1,142,000
- Miscellaneous - General Revenue - Other: $883,000
General Revenue - Other: $697,000
Interest Earnings: $282,000
Donations From Private Sources: $52,000
Donations From Private Sources: $41,000
Interest Earnings: $38,000
Sale of Property: $28,000
Sale of Property: $5,000
Fines and Forfeits: $4,000
Rents: $4,000
Fines and Forfeits: $4,000
- Other Capital Outlay - Regular Highways: $814,000
Regular Highways: $360,000
General - Other: $110,000
Police Protection: $107,000
Parks and Recreation: $57,000
Correctional Institutions: $46,000
Police Protection: $37,000
Parks and Recreation: $24,000
Correctional Institutions: $23,000
Corrections - Other: $22,000
Central Staff Services: $20,000
Financial Administration: $5,000
Health - Other: $4,000
Judicial and Legal Services: $4,000
Solid Waste Management: $3,000
Financial Administration: $2,000
Natural Resources - Other: $2,000
Central Staff Services: $1,000
General - Other: $1,000
Health - Other: $1,000
Natural Resources - Other: $1,000
Judicial and Legal Services: $1,000
- Other Funds - Cash and Securities: $12,191,000
Cash and Securities: $10,439,000
- State Intergovernmental - Other: $13,706,000
Other: $11,561,000
Highways: $4,052,000
General Local Government Support: $619,000
General Local Government Support: $519,000
Highways: $171,000
- Tax - Property: $3,995,000
Property: $3,587,000
Public Utilities Sales: $415,000
Public Utilities Sales: $392,000
Other Selective Sales: $118,000
Other: $116,000
Other Selective Sales: $75,000
Other License: $66,000
Other License: $59,000
Other: $52,000
- Total Salaries and Wages: $27,000
: $16,000
Franklin County government finances - Debt in 2020:
- Bond Funds - Cash and Securities: $1,047,000
Cash and Securities: $679,000
- Charges - Other: $1,095,000
Sewerage: $15,000
Sewerage: $1,000
- Construction - Regular Highways: $1,177,000
Regular Highways: $449,000
General - Other: $174,000
General - Other: $143,000
- Current Operations - Police Protection: $3,326,000
Police Protection: $3,273,000
Regular Highways: $2,565,000
General - Other: $2,344,000
Central Staff Services: $2,053,000
Central Staff Services: $1,971,000
General - Other: $994,000
Judicial and Legal Services: $805,000
Correctional Institutions: $787,000
Financial Administration: $780,000
Financial Administration: $758,000
Judicial and Legal Services: $722,000
Regular Highways: $353,000
Health - Other: $353,000
Health - Other: $339,000
Correctional Institutions: $259,000
Parks and Recreation: $245,000
Natural Resources - Other: $225,000
Corrections - Other: $217,000
Natural Resources - Other: $182,000
Parks and Recreation: $178,000
Corrections - Other: $174,000
Public Welfare - Other: $142,000
Solid Waste Management: $133,000
Solid Waste Management: $122,000
Sewerage: $34,000
Miscellaneous Commercial Activities - Other: $22,000
Miscellaneous Commercial Activities - Other: $11,000
Housing and Community Development: $10,000
Sewerage: $1,000
- Federal Intergovernmental - Other: $14,000
Other: $13,000
- General - Interest on Debt: $57,000
Interest on Debt: $46,000
- Local Intergovernmental - Highways: $23,000
- Long Term Debt - Beginning Outstanding - Unspecified Public Purpose: $1,423,000
Outstanding Unspecified Public Purpose: $1,423,000
Outstanding Unspecified Public Purpose: $1,142,000
Beginning Outstanding - Unspecified Public Purpose: $1,142,000
- Miscellaneous - General Revenue - Other: $883,000
General Revenue - Other: $697,000
Interest Earnings: $282,000
Donations From Private Sources: $52,000
Donations From Private Sources: $41,000
Interest Earnings: $38,000
Sale of Property: $28,000
Sale of Property: $5,000
Fines and Forfeits: $4,000
Rents: $4,000
Fines and Forfeits: $4,000
- Other Capital Outlay - Regular Highways: $814,000
Regular Highways: $360,000
General - Other: $110,000
Police Protection: $107,000
Parks and Recreation: $57,000
Correctional Institutions: $46,000
Police Protection: $37,000
Parks and Recreation: $24,000
Correctional Institutions: $23,000
Corrections - Other: $22,000
Central Staff Services: $20,000
Financial Administration: $5,000
Health - Other: $4,000
Judicial and Legal Services: $4,000
Solid Waste Management: $3,000
Financial Administration: $2,000
Natural Resources - Other: $2,000
Central Staff Services: $1,000
General - Other: $1,000
Health - Other: $1,000
Natural Resources - Other: $1,000
Judicial and Legal Services: $1,000
- Other Funds - Cash and Securities: $12,191,000
Cash and Securities: $10,439,000
- State Intergovernmental - Other: $13,706,000
Other: $11,561,000
Highways: $4,052,000
General Local Government Support: $619,000
General Local Government Support: $519,000
Highways: $171,000
- Tax - Property: $3,995,000
Property: $3,587,000
Public Utilities Sales: $415,000
Public Utilities Sales: $392,000
Other Selective Sales: $118,000
Other: $116,000
Other Selective Sales: $75,000
Other License: $66,000
Other License: $59,000
Other: $52,000
- Total Salaries and Wages: $27,000
: $16,000
Franklin County government finances - Cash and Securities in 2020:
- Bond Funds - Cash and Securities: $1,047,000
Cash and Securities: $679,000
- Charges - Other: $1,095,000
Sewerage: $15,000
Sewerage: $1,000
- Construction - Regular Highways: $1,177,000
Regular Highways: $449,000
General - Other: $174,000
General - Other: $143,000
- Current Operations - Police Protection: $3,326,000
Police Protection: $3,273,000
Regular Highways: $2,565,000
General - Other: $2,344,000
Central Staff Services: $2,053,000
Central Staff Services: $1,971,000
General - Other: $994,000
Judicial and Legal Services: $805,000
Correctional Institutions: $787,000
Financial Administration: $780,000
Financial Administration: $758,000
Judicial and Legal Services: $722,000
Regular Highways: $353,000
Health - Other: $353,000
Health - Other: $339,000
Correctional Institutions: $259,000
Parks and Recreation: $245,000
Natural Resources - Other: $225,000
Corrections - Other: $217,000
Natural Resources - Other: $182,000
Parks and Recreation: $178,000
Corrections - Other: $174,000
Public Welfare - Other: $142,000
Solid Waste Management: $133,000
Solid Waste Management: $122,000
Sewerage: $34,000
Miscellaneous Commercial Activities - Other: $22,000
Miscellaneous Commercial Activities - Other: $11,000
Housing and Community Development: $10,000
Sewerage: $1,000
- Federal Intergovernmental - Other: $14,000
Other: $13,000
- General - Interest on Debt: $57,000
Interest on Debt: $46,000
- Local Intergovernmental - Highways: $23,000
- Long Term Debt - Beginning Outstanding - Unspecified Public Purpose: $1,423,000
Outstanding Unspecified Public Purpose: $1,423,000
Outstanding Unspecified Public Purpose: $1,142,000
Beginning Outstanding - Unspecified Public Purpose: $1,142,000
- Miscellaneous - General Revenue - Other: $883,000
General Revenue - Other: $697,000
Interest Earnings: $282,000
Donations From Private Sources: $52,000
Donations From Private Sources: $41,000
Interest Earnings: $38,000
Sale of Property: $28,000
Sale of Property: $5,000
Fines and Forfeits: $4,000
Rents: $4,000
Fines and Forfeits: $4,000
- Other Capital Outlay - Regular Highways: $814,000
Regular Highways: $360,000
General - Other: $110,000
Police Protection: $107,000
Parks and Recreation: $57,000
Correctional Institutions: $46,000
Police Protection: $37,000
Parks and Recreation: $24,000
Correctional Institutions: $23,000
Corrections - Other: $22,000
Central Staff Services: $20,000
Financial Administration: $5,000
Health - Other: $4,000
Judicial and Legal Services: $4,000
Solid Waste Management: $3,000
Financial Administration: $2,000
Natural Resources - Other: $2,000
Central Staff Services: $1,000
General - Other: $1,000
Health - Other: $1,000
Natural Resources - Other: $1,000
Judicial and Legal Services: $1,000
- Other Funds - Cash and Securities: $12,191,000
Cash and Securities: $10,439,000
- State Intergovernmental - Other: $13,706,000
Other: $11,561,000
Highways: $4,052,000
General Local Government Support: $619,000
General Local Government Support: $519,000
Highways: $171,000
- Tax - Property: $3,995,000
Property: $3,587,000
Public Utilities Sales: $415,000
Public Utilities Sales: $392,000
Other Selective Sales: $118,000
Other: $116,000
Other Selective Sales: $75,000
Other License: $66,000
Other License: $59,000
Other: $52,000
- Total Salaries and Wages: $27,000
: $16,000
Supplemental Security Income (SSI) in 2006:
- Total number of recipients: 318
- Number of aged recipients: 22
- Number of blind and disabled recipients: 296
- Number of recipients under 18: 45
- Number of recipients between 18 and 64: 229
- Number of recipients older than 64: 44
- Number of recipients also receiving OASDI: 118
- Amount of payments (thousands of dollars): 146
| Most common first names in Franklin County, IN among deceased individuals | ||
| Name | Count | Lived (average) |
|---|---|---|
| Mary | 129 | 83.3 years |
| William | 105 | 75.5 years |
| John | 90 | 75.3 years |
| George | 66 | 79.5 years |
| Robert | 61 | 73.0 years |
| Charles | 61 | 75.5 years |
| James | 45 | 71.5 years |
| Joseph | 45 | 77.1 years |
| Henry | 41 | 79.2 years |
| Frank | 39 | 80.3 years |
| Most common last names in Franklin County, IN among deceased individuals | ||
| Last name | Count | Lived (average) |
|---|---|---|
| Smith | 51 | 79.2 years |
| Meyer | 34 | 80.6 years |
| Allen | 28 | 75.8 years |
| Miller | 22 | 71.1 years |
| Brown | 19 | 76.5 years |
| Hertel | 19 | 82.1 years |
| Jones | 18 | 76.9 years |
| Stenger | 18 | 84.3 years |
| Peters | 17 | 78.8 years |
| Rosenberger | 17 | 76.7 years |
| Businesses in Franklin County, IN | ||||
| Name | Count | Name | Count | |
|---|---|---|---|---|
| Advance Auto Parts | 1 | KFC | 1 | |
| Alco Stores | 1 | Kincaid | 1 | |
| Arby's | 2 | Kroger | 1 | |
| Blockbuster | 1 | MasterBrand Cabinets | 6 | |
| CVS | 2 | Maurices | 1 | |
| Circle K | 1 | McDonald's | 2 | |
| Comfort Inn | 1 | Nike | 1 | |
| Curves | 2 | Penske | 1 | |
| Dairy Queen | 1 | RadioShack | 2 | |
| Decora Cabinetry | 2 | Subway | 2 | |
| FedEx | 1 | Taco Bell | 1 | |
| Ford | 1 | U-Haul | 2 | |
| Goodwill | 3 | UPS | 3 | |
| H&R Block | 2 | Wendy's | 1 | |
| Hilton | 1 | YMCA | 1 | |