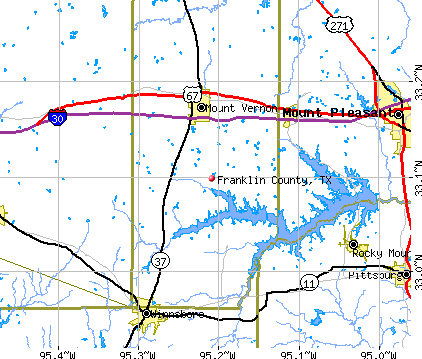
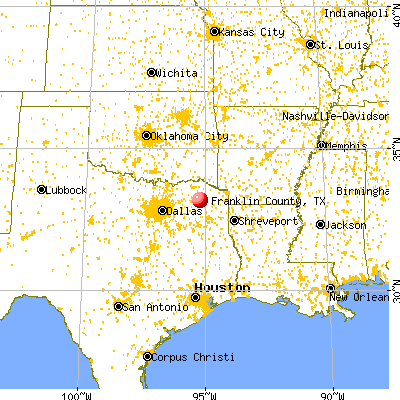
Franklin County, Texas (TX)
County owner-occupied free and clear houses and condos in 2010: 1,604
County owner-occupied houses and condos in 2000: 2,965
Renter-occupied apartments: 1,022 (it was 789 in 2000)
| % of renters here: | 21% |
| State: | 36% |
Land area: 286 sq. mi.
Water area: 9.1 sq. mi.
Population density: 38 people per square mile (low).
Industries providing employment: Educational, health and social services (22.9%), Manufacturing (15.8%).
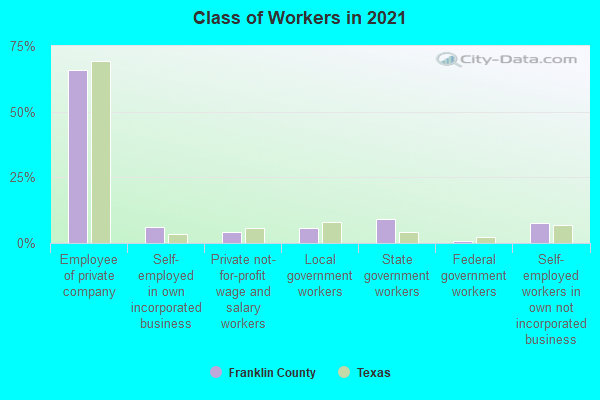
Type of workers:
- Private wage or salary: 76%
- Government: 16%
- Self-employed, not incorporated: 8%
- Unpaid family work: 0%
- OSM Map
- General Map
- Google Map
- MSN Map

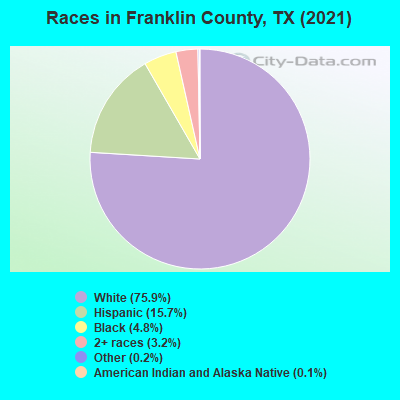
- 7,97475.5%White Non-Hispanic Alone
- 1,67815.9%Hispanic or Latino
- 4824.6%Black Non-Hispanic Alone
- 3713.5%Two or more races
- 300.3%Some other race alone
- 190.2%Asian alone
- 100.09%American Indian and Alaska Native alone
| Median resident age: | 43.4 years |
| Texas median age: | 35.6 years |
| Males: 5,599 | |
| Females: 5,126 |

 | New County Population Estimates from the Census Bureau for Jluy 1, 2016 posted this morning about 9 A. M. (13 replies) |
| How long can I get away with OH out-of-state plates? (37 replies) |
| Franklin County: | 2.0 people |
| Texas: | 3 people |
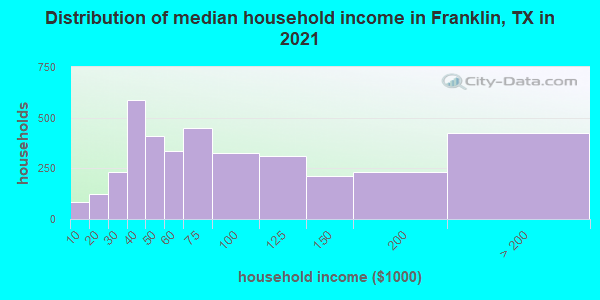
Estimated median household income in 2022: $67,216 ($31,955 in 1999)
| This county: | $67,216 |
| Texas: | $72,284 |
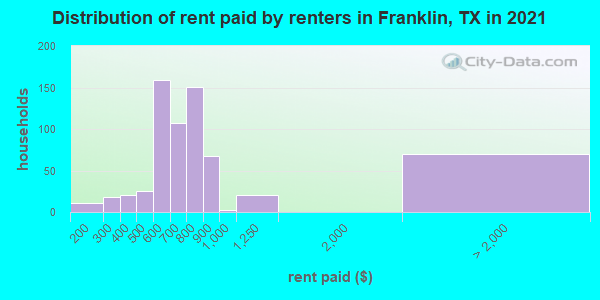
Median contract rent in 2022 for apartments: $706 (lower quartile is $545, upper quartile is $820)
| This county: | $706 |
| State: | $1117 |
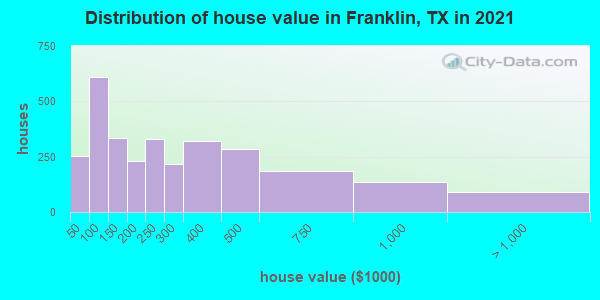
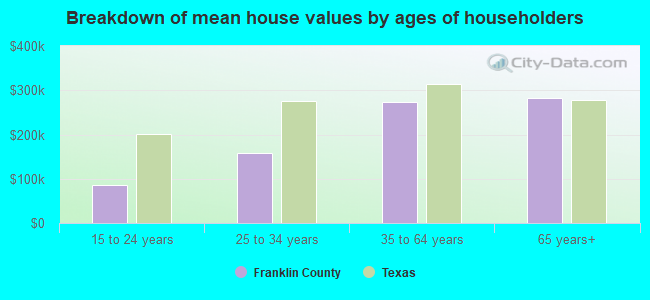
Estimated median house or condo value in 2022: $225,411 (it was $64,300 in 2000)
| Franklin: | $225,411 |
| Texas: | $275,400 |
Mean price in 2022:
Median monthly housing costs for homes and condos with a mortgage: $1,641Detached houses: $275,115
Here: $275,115 State: $369,058 Mobile homes: $130,187
Here: $130,187 State: $124,413 Occupied boats, RVs, vans, etc.: $48,919
Here: $48,919 State: $73,921
Median monthly housing costs for units without a mortgage: $579
Institutionalized population: 114
Crime in 2021 (reported by the sheriff's office or county police, not the county total):
- Murders: 0
- Rapes: 4
- Robberies: 0
- Assaults: 11
- Burglaries: 19
- Thefts: 22
- Auto thefts: 5
Crime in 2020 (reported by the sheriff's office or county police, not the county total):
- Murders: 0
- Rapes: 4
- Robberies: 1
- Assaults: 14
- Burglaries: 19
- Thefts: 25
- Auto thefts: 5
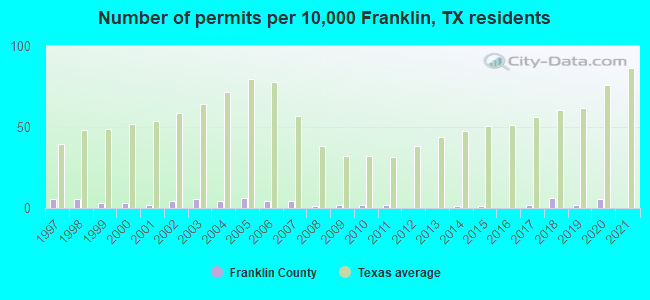
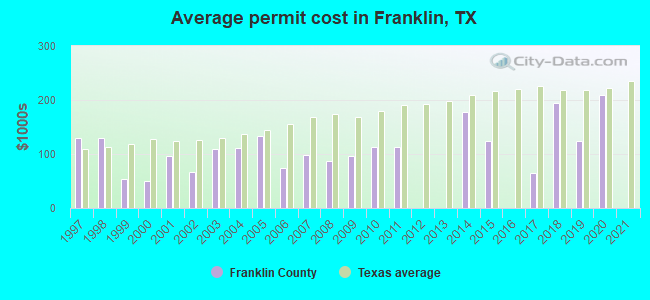
Single-family new house construction building permits:
- 2022: 0 buildings
- 2021: 0 buildings
- 2020: 5 buildings, average cost: $209,100
- 2019: 2 buildings, average cost: $125,000
- 2018: 6 buildings, average cost: $195,200
- 2017: 2 buildings, average cost: $65,000
- 2016: 0 buildings
- 2015: 1 building, cost: $125,000
- 2014: 1 building, cost: $177,500
- 2013: 0 buildings
- 2012: 0 buildings
- 2011: 2 buildings, average cost: $113,100
- 2010: 2 buildings, average cost: $113,100
- 2009: 2 buildings, average cost: $95,500
- 2008: 1 building, cost: $87,000
- 2007: 4 buildings, average cost: $98,500
- 2006: 4 buildings, average cost: $75,300
- 2005: 6 buildings, average cost: $132,500
- 2004: 4 buildings, average cost: $111,000
- 2003: 5 buildings, average cost: $109,400
- 2002: 4 buildings, average cost: $66,000
- 2001: 2 buildings, average cost: $96,000
- 2000: 3 buildings, average cost: $49,700
- 1999: 3 buildings, average cost: $54,300
- 1998: 5 buildings, average cost: $130,200
- 1997: 5 buildings, average cost: $130,200
Median real estate property taxes paid for housing units with mortgages in 2022: $2,605 (1.0%)
Median real estate property taxes paid for housing units with no mortgage in 2022: $1,649 (0.8%)
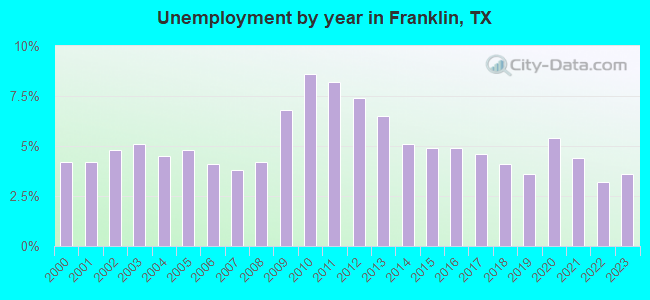
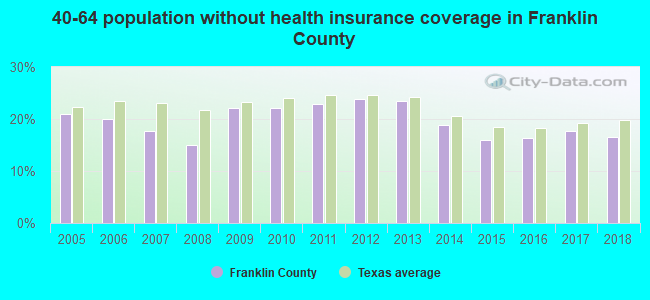
| Franklin County: | 8.6% |
| Texas: | 14.0% |
Median age of residents in 2022: 43.4 years old
(Males: 40.0 years old, Females: 48.1 years old)
(Median age for: White residents: 47.7 years old, Black residents: 35.3 years old, American Indian residents: 34.3 years old, Hispanic or Latino residents: 29.6 years old, Other race residents: 28.6 years old)
Fair market rent in 2006 for a 1-bedroom apartment in Franklin County is $416 a month.
Fair market rent for a 2-bedroom apartment is $502 a month.
Fair market rent for a 3-bedroom apartment is $615 a month.
Cities in this county include: Mount Vernon.
Notable locations in this county outside city limits:
Notable locations in Franklin County: Center Windmill (A), Darden Windmill (B), Dillberry Windmill (C), Draw Windmill (D), Dugout Windmill (E), East Windmill (F), Government Windmill (G), High Lonesome Windmill (H), House Trap Windmill (I), Lane Windmill (J), North Beall Windmill (K), Northeast Windmill (L), Northwest Windmill (M), Two B Ranch (N), Iron Windmill (O), Williams Ranch (P), West Windmill (Q), Tsa Mo Ga Memorial Museum (R). Display/hide their locations on the map
Neighboring counties: Otero County, New Mexico  , Cochran County , Tuscaloosa County, Alabama
  , Jones County , Lubbock County .
| Here: | 3.0% |
| Texas: | 3.5% |
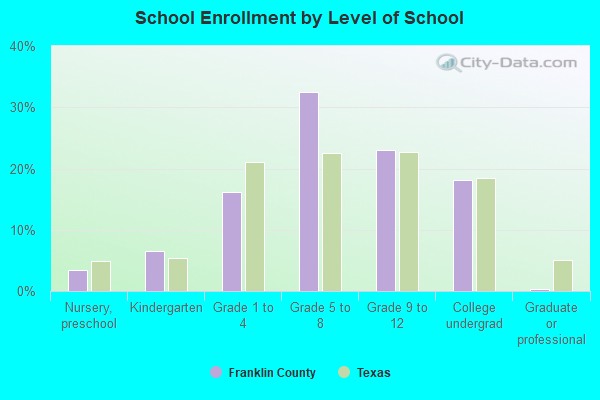
Current college students: 308
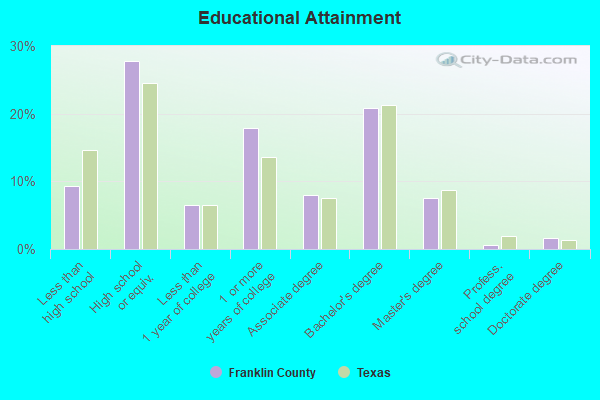
People 25 years of age or older with a high school degree or higher: 91.5%
People 25 years of age or older with a bachelor's degree or higher: 30.7%
Number of foreign born residents: 763 (44.9% naturalized citizens)
| Franklin County: | 7.1% |
| Whole state: | 17.2% |
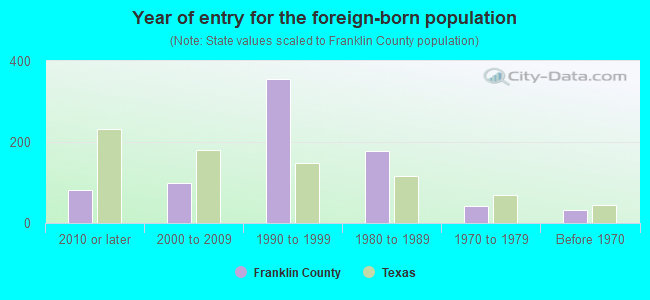
- Year of entry for the foreign-born population
- 1972010 or later
- 722000 to 2009
- 3021990 to 1999
- 1771980 to 1989
- 431970 to 1979
- 31Before 1970
Mean travel time to work (commute): minutes
Percentage of county residents living and working in this county: 99.5%
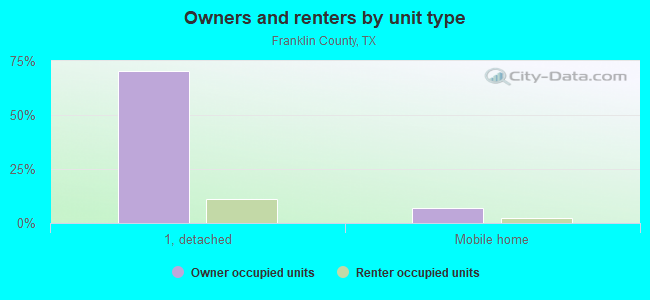
Housing units in structures:
- One, detached: 4,570
- One, attached: 64
- Two: 64
- 3 or 4: 22
- 5 to 9: 22
- 10 to 19: 9
- 20 to 49: 40
- 50 or more: 24
- Mobile homes: 476
- Boats, RVs, vans, etc.: 30
Housing units in Franklin County with a mortgage: 1,377 (35 second mortgage, 2 home equity loan, 13 both second mortgage and home equity loan)
Houses without a mortgage: 0
| Here: | 100.0% with mortgage |
| State: | 98.4% with mortgage |
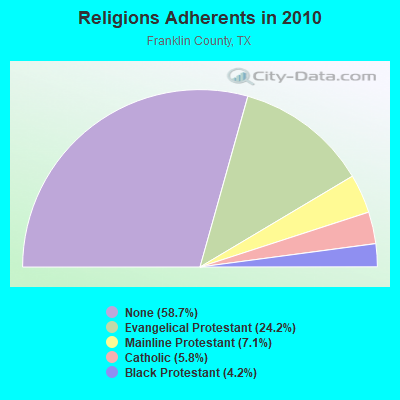
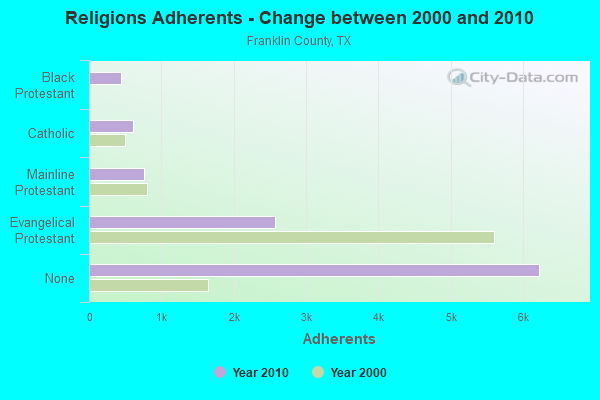
Religion statistics for Franklin County
| Religion | Adherents | Congregations |
|---|---|---|
| Evangelical Protestant | 2,568 | 18 |
| Mainline Protestant | 756 | 1 |
| Catholic | 611 | 1 |
| Black Protestant | 445 | 3 |
| Other | 1 | - |
| None | 6,224 | - |
Source: Clifford Grammich, Kirk Hadaway, Richard Houseal, Dale E.Jones, Alexei Krindatch, Richie Stanley and Richard H.Taylor. 2012. 2010 U.S.Religion Census: Religious Congregations & Membership Study. Association of Statisticians of American Religious Bodies. Jones, Dale E., et al. 2002. Congregations and Membership in the United States 2000. Nashville, TN: Glenmary Research Center.
Food Environment Statistics:
| Franklin County: | 0.90 / 10,000 pop. |
| State: | 1.47 / 10,000 pop. |
| This county: | 0.90 / 10,000 pop. |
| Texas: | 1.11 / 10,000 pop. |
| Franklin County: | 7.20 / 10,000 pop. |
| Texas: | 3.95 / 10,000 pop. |
| This county: | 4.50 / 10,000 pop. |
| State: | 6.13 / 10,000 pop. |
| Franklin County: | 9.5% |
| Texas: | 8.9% |
| Franklin County: | 26.2% |
| State: | 26.6% |
Agriculture in Franklin County:
Average size of farms: 241 acresAverage value of agricultural products sold per farm: $116,363
Average value of crops sold per acre for harvested cropland: $51.86
The value of nursery, greenhouse, floriculture, and sod as a percentage of the total market value of agricultural products sold: 0.25%
The value of livestock, poultry, and their products as a percentage of the total market value of agricultural products sold: 98.04%
Average total farm production expenses per farm: $81,176
Harvested cropland as a percentage of land in farms: 18.29%
Irrigated harvested cropland as a percentage of land in farms: 3.10%
Average market value of all machinery and equipment per farm: $37,010
The percentage of farms operated by a family or individual: 94.54%
Average age of principal farm operators: 56 years
Average number of cattle and calves per 100 acres of all land in farms: 30.37
Milk cows as a percentage of all cattle and calves: 16.75%
All wheat for grain: 1373 harvested acres
Land in orchards: 153 acres
Tornado activity:
Franklin County historical area-adjusted tornado activity is significantly below Texas state average. It is 2653948.1 times below overall U.S. average.Earthquake activity:
Franklin County-area historical earthquake activity is significantly above Texas state average. It is 463% greater than the overall U.S. average.On 11/6/2011 at 03:53:10, a magnitude 5.7 (5.7 MW, Depth: 3.2 mi, Class: Moderate, Intensity: VI - VII) earthquake occurred 190.4 miles away from Franklin County center
On 9/3/2016 at 12:02:44, a magnitude 5.8 (5.8 MW, Depth: 3.5 mi) earthquake occurred 250.0 miles away from the county center
On 5/17/2012 at 08:12:00, a magnitude 4.8 (4.8 MW, Depth: 3.1 mi, Class: Light, Intensity: IV - V) earthquake occurred 94.7 miles away from the county center
On 11/7/2016 at 01:44:24, a magnitude 5.0 (5.0 MW, Depth: 2.8 mi) earthquake occurred 219.7 miles away from the county center
On 9/6/1997 at 23:38:00, a magnitude 4.5 (4.5 LG, 4.2 LG, Depth: 3.1 mi) earthquake occurred 129.0 miles away from Franklin County center
On 11/8/2011 at 02:46:57, a magnitude 4.8 (4.8 MW, Depth: 3.1 mi) earthquake occurred 191.0 miles away from the county center
Magnitude types: regional Lg-wave magnitude (LG), moment magnitude (MW)
Most recent natural disasters:
- Texas Covid-19 Pandemic, Incident Period: January 20, 2020, FEMA Id: 4485, Natural disaster type: Other
- Texas Severe Storms And Flooding, Incident Period: September 10, 2018 - November 2, 2018, FEMA Id: 4416, Natural disaster type: Storm, Flood
- Texas Severe Winter Storms, Tornadoes, Straight-line Winds, and Flooding, Incident Period: December 26, 2016 to January 21, 2016, Major Disaster (Presidential) Declared DR-4255: February 09, 2016, FEMA Id: 4255, Natural disaster type: Winter Storm, Tornado, Flood, Wind
- Texas Hurricane Ike, Incident Period: September 07, 2008 to September 26, 2008, Emergency Declared EM-3294: September 10, 2008, FEMA Id: 3294, Natural disaster type: Hurricane
- Texas Wildfires, Incident Period: March 14, 2008 to September 01, 2008, Emergency Declared EM-3284: March 14, 2008, FEMA Id: 3284, Natural disaster type: Fire
- Texas Hurricane Rita, Incident Period: September 23, 2005 to October 14, 2005, Major Disaster (Presidential) Declared DR-1606: September 24, 2005, FEMA Id: 1606, Natural disaster type: Hurricane
- Texas Hurricane Rita, Incident Period: September 20, 2005 to October 14, 2005, Emergency Declared EM-3261: September 21, 2005, FEMA Id: 3261, Natural disaster type: Hurricane
- Texas Hurricane Katrina, Incident Period: August 29, 2005 to October 01, 2005, Emergency Declared EM-3216: September 02, 2005, FEMA Id: 3216, Natural disaster type: Hurricane
- Texas Loss of the Space Shuttle Columbia, Incident Period: February 01, 2003, Emergency Declared EM-3171: February 01, 2003, FEMA Id: 3171, Natural disaster type: Other
- Texas Severe Winter Storm, Incident Period: December 12, 2000 to January 15, 2001, Major Disaster (Presidential) Declared DR-1356: January 08, 2001, FEMA Id: 1356, Natural disaster type: Winter Storm
- 1 other natural disasters have been reported since 1953.
The number of natural disasters in Franklin County (11) is smaller than the US average (15).
Major Disasters (Presidential) Declared: 3
Emergencies Declared: 6
Causes of natural disasters: Hurricanes: 4, Fires: 2, Floods: 2, Winter Storms: 2, Storm: 1, Tornado: 1, Wind: 1, Other: 2 (Note: some incidents may be assigned to more than one category).

Means of transportation to work:
- Drove a car alone: 2,890 (65.4%)
- Carpooled: 544 (12.3%)
- Bus: 7 (0.2%)
- Light rail, streetcar or trolley: 15 (0.3%)
- Taxicab, motorcycle, or other means: 78 (1.8%)
- Walked: 63 (1.4%)
- Worked at home: 913 (20.7%)
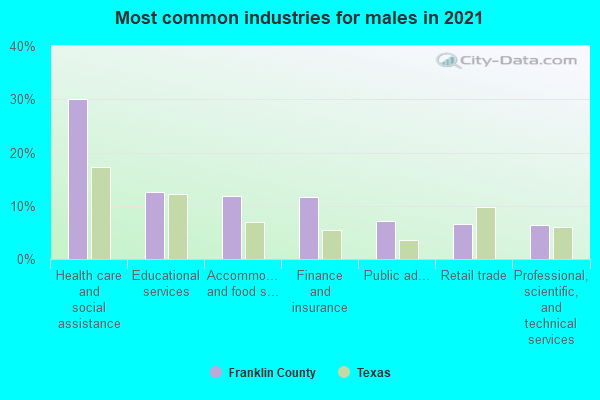
- Health care and social assistance (24%)
- Educational services (13%)
- Accommodation and food services (12%)
- Finance and insurance (11%)
- Professional, scientific, and technical services (10%)
- Public administration (9%)
- Manufacturing (7%)
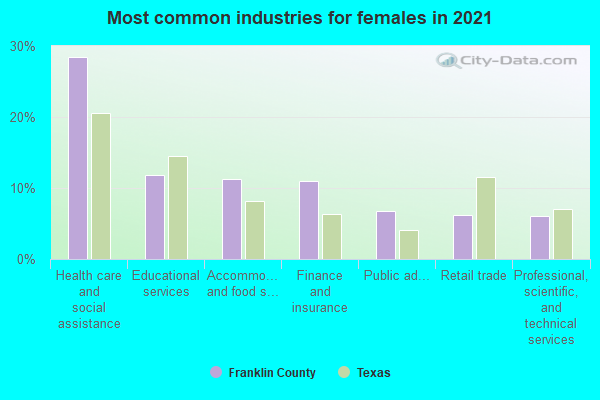
- Health care and social assistance (23%)
- Educational services (12%)
- Accommodation and food services (11%)
- Finance and insurance (10%)
- Professional, scientific, and technical services (9%)
- Public administration (8%)
- Manufacturing (7%)
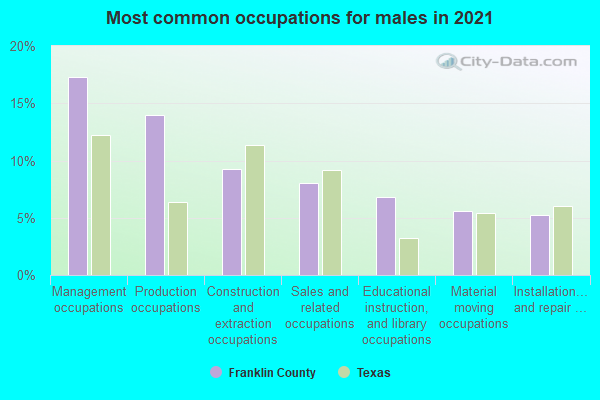
- Management occupations (21%)
- Production occupations (13%)
- Construction and extraction occupations (8%)
- Sales and related occupations (7%)
- Installation, maintenance, and repair occupations (7%)
- Educational instruction, and library occupations (7%)
- Material moving occupations (5%)
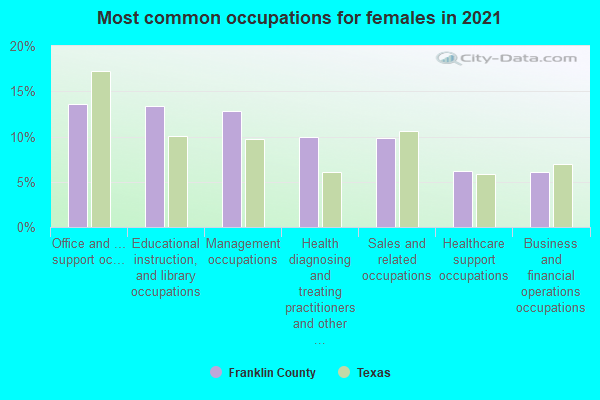
- Management occupations (15%)
- Office and administrative support occupations (13%)
- Educational instruction, and library occupations (13%)
- Sales and related occupations (8%)
- Business and financial operations occupations (7%)
- Health diagnosing and treating practitioners and other technical occupations (6%)
- Legal occupations (5%)
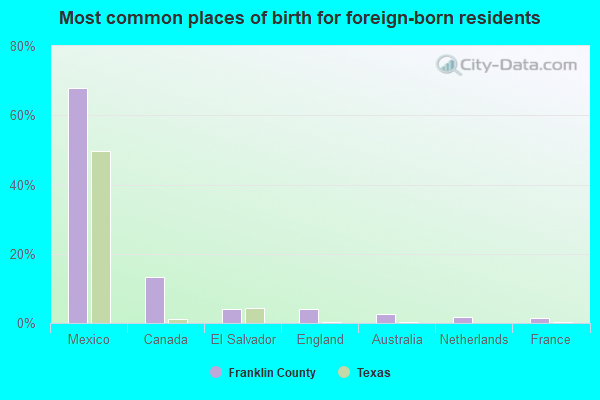
- Mexico (61%)
- Canada (15%)
- El Salvador (7%)
- England (4%)
- Kenya (4%)
- France (2%)
- Korea (2%)
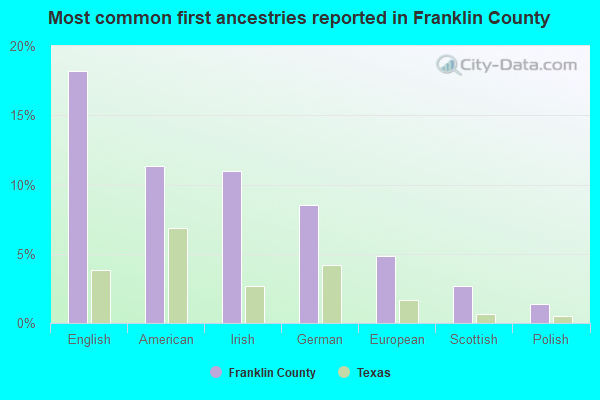
- English (24%)
- Irish (11%)
- American (10%)
- German (10%)
- European (5%)
- Scottish (2%)
- Polish (2%)
29 people in local jails and other municipal confinement facilities
People in group quarters in Franklin County, Texas in 2000:
- 124 people in nursing homes
- 37 people in local jails and other confinement facilities (including police lockups)
- 2 people in orthopedic wards and institutions for the physically handicapped
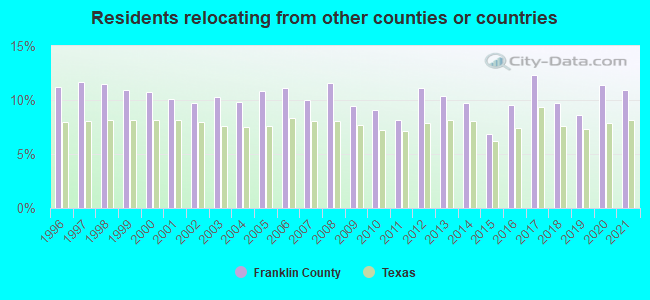
10.96% of this county's 2021 resident taxpayers lived in other counties in 2020 ($70,576 average adjusted gross income)
| Here: | 10.96% |
| Texas average: | 8.12% |
10 or fewer of this county's residents moved from foreign countries.
9.42% relocated from other counties in Texas ($59,985 average AGI)
1.54% relocated from other states ($10,591 average AGI)
Franklin County: 1.54% Texas average: 2.83%
Top counties from which taxpayers relocated into this county between 2020 and 2021:
| from Wood County, TX | |
| from Titus County, TX | |
| from Hopkins County, TX | |
| from Dallas County, TX | |
| from Collin County, TX |
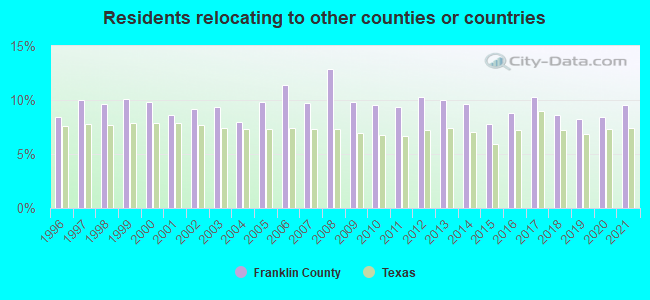
9.52% of this county's 2020 resident taxpayers moved to other counties in 2021 ($52,527 average adjusted gross income)
| Here: | 9.52% |
| Texas average: | 7.40% |
10 or fewer of this county's residents moved to foreign countries.
8.59% relocated to other counties in Texas ($47,458 average AGI)
0.93% relocated to other states ($5,069 average AGI)
Franklin County: 0.93% Texas average: 2.08%
Top counties to which taxpayers relocated from this county between 2020 and 2021:
| to Wood County, TX | |
| to Titus County, TX | |
| to Hopkins County, TX |
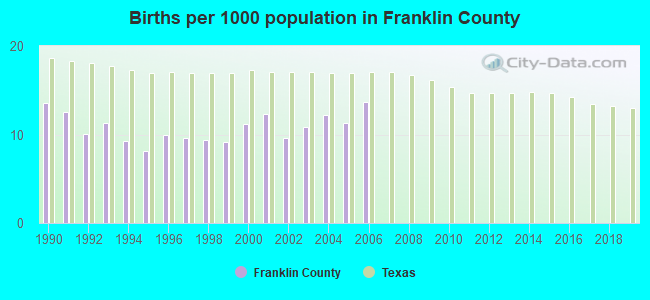
Births per 1000 population from 1990 to 1999: 10.3
Births per 1000 population from 2000 to 2006: 11.6
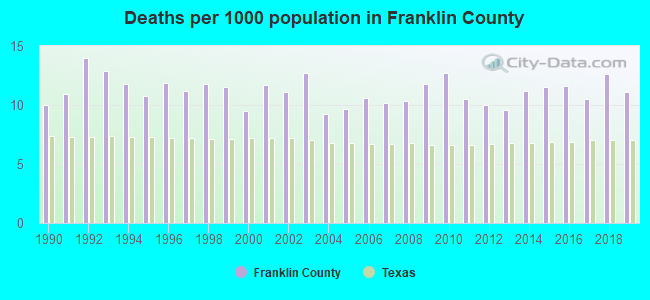
Deaths per 1000 population from 1990 to 1999: 11.7
Deaths per 1000 population from 2000 to 2009: 10.7
Deaths per 1000 population from 2010 to 2020: 11.5
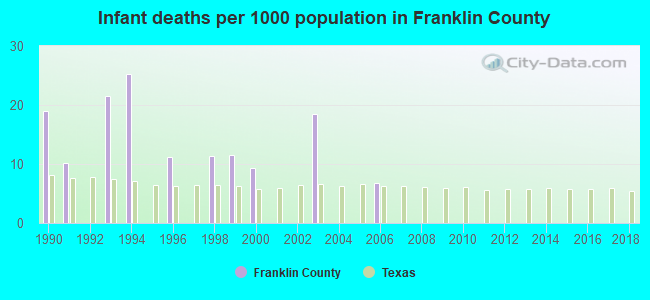
Infant deaths per 1000 live births from 1990 to 1999: 11.0
Infant deaths per 1000 live births from 2000 to 2006: 4.9
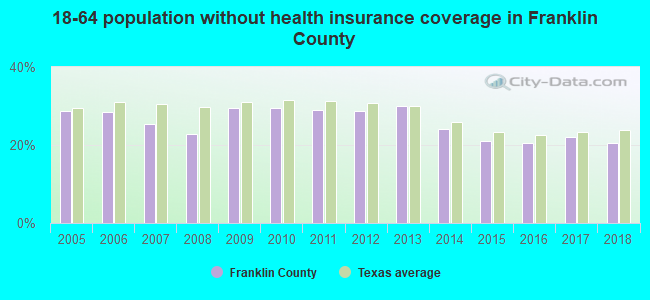
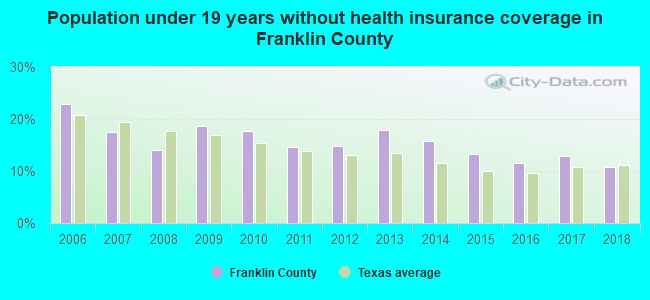
Persons under 19 years old without health insurance coverage in 2018: 10.8%
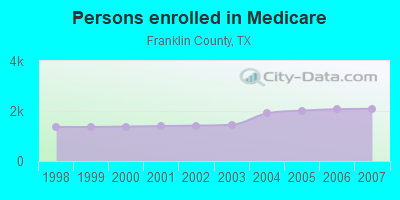
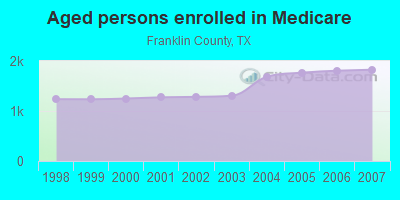
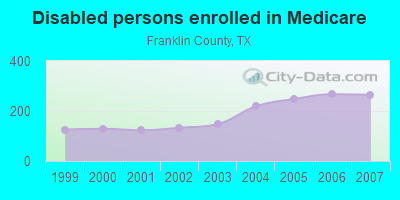
Persons enrolled in hospital insurance and/or supplemental medical insurance (Medicare) in July 1, 2007: 2,091 (1,826 aged, 265 disabled)
Children under 18 without health insurance coverage in 2007: 422 (16%)
Most common underlying causes of death in Franklin County, Texas in 1999 - 2019:
- Acute myocardial infarction, unspecified (295)
- Bronchus or lung, unspecified - Malignant neoplasms (80)
- Unspecified dementia (34)
- Chronic obstructive pulmonary disease, unspecified (31)
- Atherosclerotic heart disease (11)
- Stroke, not specified as haemorrhage or infarction (10)
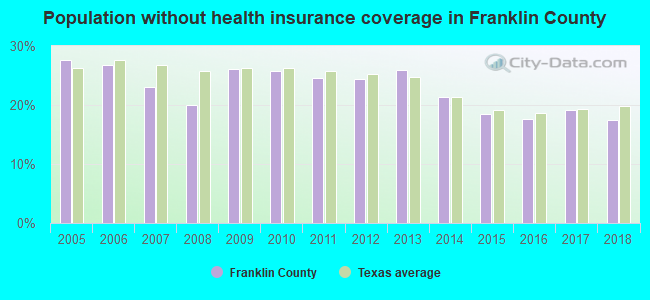
Population without health insurance coverage in 2000: 19%
Children under 18 without health insurance coverage in 2000: 19%
Short term general hospital admissions per 100,000 population in 2004: 8,236
Short term general hospital beds per 100,000 population in 2004: 298
Emergency room visits per 100,000 population in 2004: 29,436
General practice office based MDs per 100,000 population in 2005: 1,225
Medical specialist MDs per 100,000 population in 2005: 755
Total births per 100,000 population, July 2005 - July 2006 : 21
Total deaths per 100,000 population, July 2005 - July 2006: 88
Limited-service eating places per 100,000 population in 2005 : 10
Household type by relationship:
Households: 10,725- Male householders: 2,126 (531 living alone), Female householders: 1,869 (384 living alone)
2,146 spouses (2,146 opposite-sex spouses), 400 unmarried partners, (355 opposite-sex unmarried partners), 3,305 children (3,019 natural, 13 adopted, 272 stepchildren), 403 grandchildren, 44 brothers or sisters, 183 parents, 11 foster children, 106 other relatives, 84 non-relatives
- In group quarters: 99
Size of family households: 1,567 2-persons, 494 3-persons, 429 4-persons, 231 5-persons, 90 6-persons, 10 7-or-more-persons.
Size of nonfamily households: 916 1-person, 269 2-persons.
1,771 married couples with children.
243 single-parent households (39 men, 204 women).
87.5% of residents of Franklin speak English at home.
11.5% of residents speak Spanish at home (70% speak English very well, 11% speak English well, 14% speak English not well, 4% don't speak English at all).
1.0% of residents speak other Indo-European language at home (77% speak English very well, 23% speak English well).
0.2% of residents speak Asian or Pacific Island language at home (100% speak English very well).
In fiscal year 2004:
Federal Government expenditure: $53,727,000 ($5,337 per capita)
Department of Defense expenditure: $1,928,000
Federal direct payments to individuals for retirement and disability: $24,480,000
Federal other direct payments to individuals: $12,932,000
Federal direct payments not to individuals: $297,000
Federal grants: $7,566,000
Federal procurement contracts: $512,000 ($211,000 Department of Defense)
Federal salaries and wages: $7,940,000 ($0,000 Department of Defense)
Federal Government direct loans: $436,000
Federal guaranteed/insured loans: $2,644,000
Federal Government insurance: $358,000
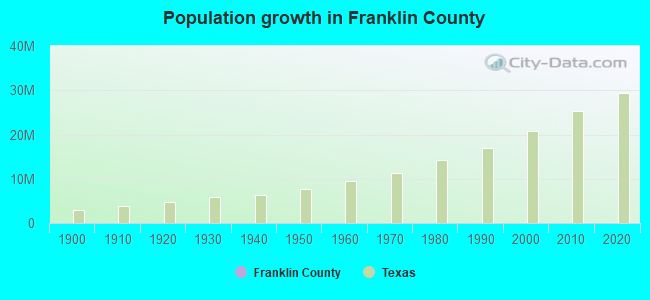
Population change from April 1, 2000 to July 1, 2005:
Births: 554| Here: | 54 per 1000 residents |
| State: | 85 per 1000 residents |
Deaths: 606
| Here: | 59 per 1000 residents |
| State: | 35 per 1000 residents |
Net international migration: +120
| Here: | +12 per 1000 residents |
| State: | +29 per 1000 residents |
Net internal migration: +686
| Here: | +67 per 1000 residents |
| State: | +10 per 1000 residents |
Total withdrawal of fresh water for public supply: 2.28 millions of gallons per day (1% from ground, 99% from surface)
| Here: | 5.8 |
| State: | 6.3 |
| Here: | 4.6 |
| State: | 4.0 |
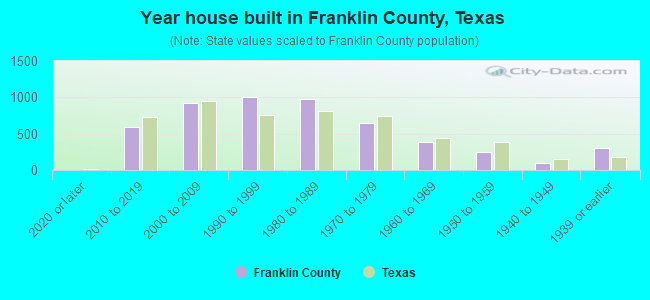
- Year house built in Franklin County, Texas
- 162020 or later
- 5772010 to 2019
- 8192000 to 2009
- 9651990 to 1999
- 8901980 to 1989
- 7581970 to 1979
- 3941960 to 1969
- 2491950 to 1959
- 991940 to 1949
- 3391939 or earlier
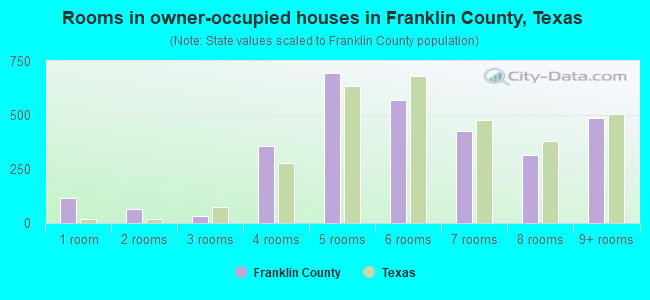
- Rooms in owner-occupied houses in Franklin County, Texas
- 561 room
- 982 rooms
- 353 rooms
- 4034 rooms
- 8115 rooms
- 6406 rooms
- 4197 rooms
- 3348 rooms
- 4169+ rooms
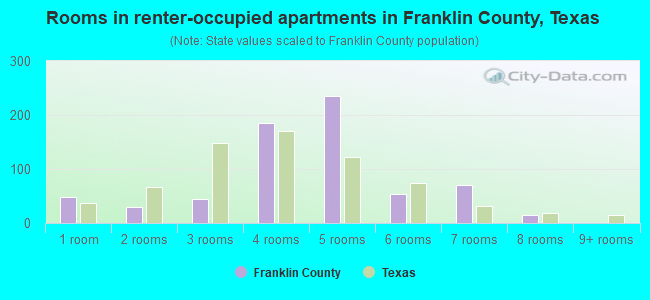
- Rooms in renter-occupied apartments in Franklin County, Texas
- 281 room
- 202 rooms
- 903 rooms
- 2104 rooms
- 2625 rooms
- 736 rooms
- 677 rooms
- 268 rooms
- 09+ rooms
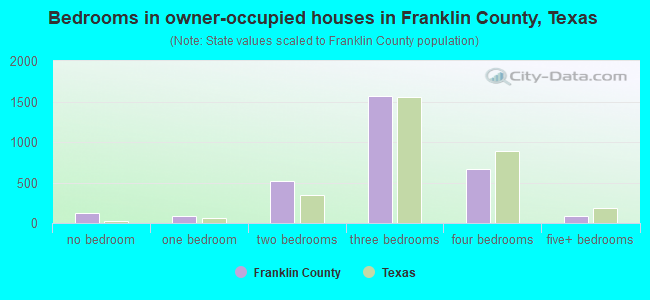
- Bedrooms in owner-occupied houses in Franklin County, Texas
- 62no bedroom
- 961 bedroom
- 5492 bedrooms
- 1,7273 bedrooms
- 6934 bedrooms
- 725+ bedrooms
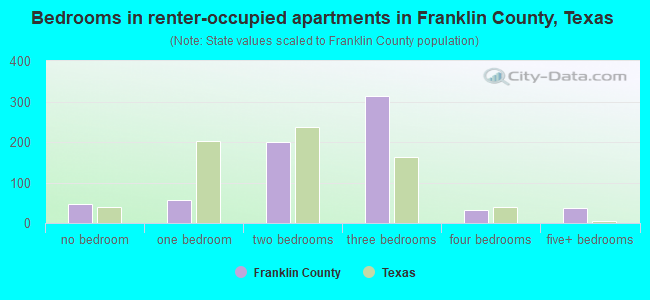
- Bedrooms in renter-occupied apartments in Franklin County, Texas
- 28no bedroom
- 961 bedroom
- 2382 bedrooms
- 3383 bedrooms
- 554 bedrooms
- 305+ bedrooms
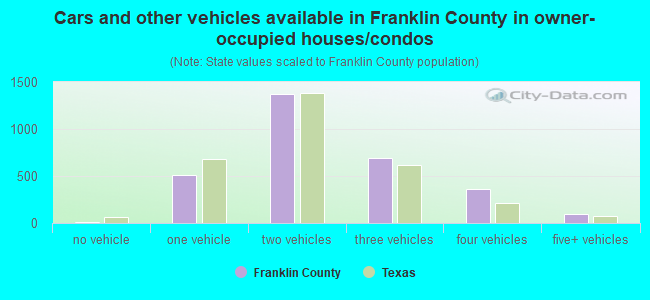
- Cars and other vehicles available in Franklin County in owner-occupied houses/condos
- 21no vehicle
- 6481 vehicle
- 1,3862 vehicles
- 6183 vehicles
- 4224 vehicles
- 995+ vehicles
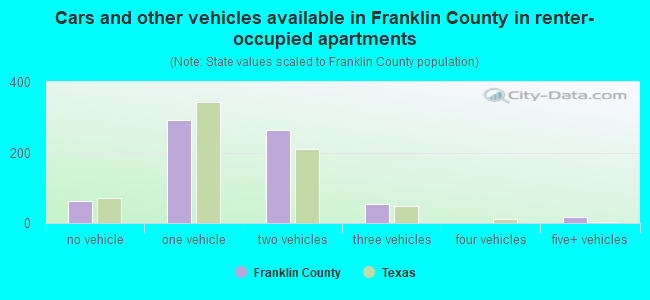
- Cars and other vehicles available in Franklin County in renter-occupied apartments
- 55no vehicle
- 4171 vehicle
- 2502 vehicles
- 473 vehicles
- 84 vehicles
- 185+ vehicles
87.5% of Franklin County residents lived in the same house 1 years ago.
Out of people who lived in different houses, 13% lived in this county.
Out of people who lived in different counties, 90% lived in Texas.
| Franklin County: | 87.5% |
| State average: | 85.7% |
Place of birth for U.S.-born residents:
- This state: 7,624
- Other state: 2,100
- Northeast: 408
- Midwest: 565
- South: 430
- West: 702

- 81.9%Electricity
- 12.0%Utility gas
- 5.5%Bottled, tank, or LP gas
- 0.7%Wood
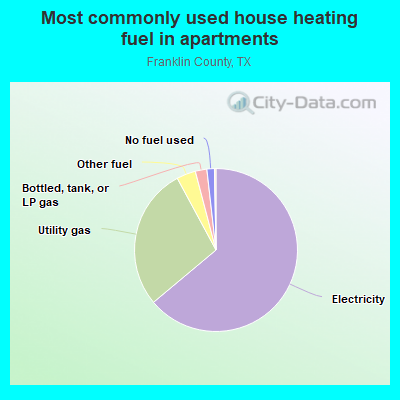
- 59.5%Electricity
- 33.6%Utility gas
- 3.1%Other fuel
- 2.3%Bottled, tank, or LP gas
- 1.6%No fuel used
Private vs. public school enrollment:
| Here: | 13.4% |
| Texas: | 8.8% |
| Here: | 1.9% |
| Texas: | 8.0% |
| Here: | 8.0% |
| Texas: | 16.2% |
Franklin County government finances - Expenditure in 2017:
- Bond Funds - Cash and Securities: $1,904,000
- Charges - Other: $877,000
Other: $391,000
Air Transportation: $8,000
Air Transportation: $7,000
- Construction - General Public Buildings: $1,815,000
Regular Highways: $304,000
Parks and Recreation: $252,000
Regular Highways: $85,000
Judicial and Legal Services: $45,000
- Current Operations - Regular Highways: $2,585,000
Regular Highways: $2,090,000
Police Protection: $1,366,000
Correctional Institutions: $974,000
Police Protection: $947,000
Financial Administration: $895,000
Correctional Institutions: $832,000
General - Other: $714,000
Financial Administration: $709,000
Judicial and Legal Services: $617,000
Judicial and Legal Services: $498,000
Central Staff Services: $420,000
Central Staff Services: $407,000
Libraries: $250,000
Corrections - Other: $217,000
General Public Buildings: $210,000
Libraries: $205,000
General Public Buildings: $199,000
Public Welfare, Vendor Payments for Medical Care: $134,000
General - Other: $88,000
Parks and Recreation: $54,000
Health - Other: $44,000
Local Fire Protection: $40,000
Public Welfare, Vendor Payments for Medical Care: $40,000
Health - Other: $39,000
Natural Resources - Other: $39,000
Air Transportation: $36,000
Parks and Recreation: $20,000
Natural Resources - Other: $15,000
Air Transportation: $11,000
- General - Interest on Debt: $44,000
Interest on Debt: $5,000
- Intergovernmental to Local - Other - General - Other: $241,000
- Long Term Debt - Beginning Outstanding - Unspecified Public Purpose: $938,000
Outstanding Unspecified Public Purpose: $681,000
Retired Unspecified Public Purpose: $257,000
Retired Unspecified Public Purpose: $167,000
Beginning Outstanding - Unspecified Public Purpose: $167,000
- Miscellaneous - Fines and Forfeits: $628,000
Fines and Forfeits: $471,000
Interest Earnings: $109,000
Donations From Private Sources: $104,000
Interest Earnings: $54,000
General Revenue - Other: $38,000
Donations From Private Sources: $17,000
General Revenue - Other: $12,000
- Other Capital Outlay - Police Protection: $114,000
Correctional Institutions: $71,000
Parks and Recreation: $69,000
General - Other: $54,000
- Other Funds - Cash and Securities: $7,136,000
Cash and Securities: $5,321,000
- Sinking Funds - Cash and Securities: $130,000
- State Intergovernmental - Other: $2,312,000
Other: $125,000
Highways: $48,000
Highways: $18,000
Public Welfare: $8,000
General Local Government Support: $6,000
General Local Government Support: $6,000
- Tax - Property: $6,086,000
Property: $5,936,000
Motor Vehicle License: $837,000
General Sales and Gross Receipts: $463,000
General Sales and Gross Receipts: $460,000
Motor Vehicle License: $444,000
Occupation and Business License - Other: $123,000
Other License: $77,000
Other Selective Sales: $55,000
Other Selective Sales: $28,000
- Total Salaries and Wages: $2,423,000
Franklin County government finances - Revenue in 2017:
- Bond Funds - Cash and Securities: $1,904,000
- Charges - Other: $877,000
Other: $391,000
Air Transportation: $8,000
Air Transportation: $7,000
- Construction - General Public Buildings: $1,815,000
Regular Highways: $304,000
Parks and Recreation: $252,000
Regular Highways: $85,000
Judicial and Legal Services: $45,000
- Current Operations - Regular Highways: $2,585,000
Regular Highways: $2,090,000
Police Protection: $1,366,000
Correctional Institutions: $974,000
Police Protection: $947,000
Financial Administration: $895,000
Correctional Institutions: $832,000
General - Other: $714,000
Financial Administration: $709,000
Judicial and Legal Services: $617,000
Judicial and Legal Services: $498,000
Central Staff Services: $420,000
Central Staff Services: $407,000
Libraries: $250,000
Corrections - Other: $217,000
General Public Buildings: $210,000
Libraries: $205,000
General Public Buildings: $199,000
Public Welfare, Vendor Payments for Medical Care: $134,000
General - Other: $88,000
Parks and Recreation: $54,000
Health - Other: $44,000
Local Fire Protection: $40,000
Public Welfare, Vendor Payments for Medical Care: $40,000
Health - Other: $39,000
Natural Resources - Other: $39,000
Air Transportation: $36,000
Parks and Recreation: $20,000
Natural Resources - Other: $15,000
Air Transportation: $11,000
- General - Interest on Debt: $44,000
Interest on Debt: $5,000
- Intergovernmental to Local - Other - General - Other: $241,000
- Long Term Debt - Beginning Outstanding - Unspecified Public Purpose: $938,000
Outstanding Unspecified Public Purpose: $681,000
Retired Unspecified Public Purpose: $257,000
Retired Unspecified Public Purpose: $167,000
Beginning Outstanding - Unspecified Public Purpose: $167,000
- Miscellaneous - Fines and Forfeits: $628,000
Fines and Forfeits: $471,000
Interest Earnings: $109,000
Donations From Private Sources: $104,000
Interest Earnings: $54,000
General Revenue - Other: $38,000
Donations From Private Sources: $17,000
General Revenue - Other: $12,000
- Other Capital Outlay - Police Protection: $114,000
Correctional Institutions: $71,000
Parks and Recreation: $69,000
General - Other: $54,000
- Other Funds - Cash and Securities: $7,136,000
Cash and Securities: $5,321,000
- Sinking Funds - Cash and Securities: $130,000
- State Intergovernmental - Other: $2,312,000
Other: $125,000
Highways: $48,000
Highways: $18,000
Public Welfare: $8,000
General Local Government Support: $6,000
General Local Government Support: $6,000
- Tax - Property: $6,086,000
Property: $5,936,000
Motor Vehicle License: $837,000
General Sales and Gross Receipts: $463,000
General Sales and Gross Receipts: $460,000
Motor Vehicle License: $444,000
Occupation and Business License - Other: $123,000
Other License: $77,000
Other Selective Sales: $55,000
Other Selective Sales: $28,000
- Total Salaries and Wages: $2,423,000
Franklin County government finances - Debt in 2017:
- Bond Funds - Cash and Securities: $1,904,000
- Charges - Other: $877,000
Other: $391,000
Air Transportation: $8,000
Air Transportation: $7,000
- Construction - General Public Buildings: $1,815,000
Regular Highways: $304,000
Parks and Recreation: $252,000
Regular Highways: $85,000
Judicial and Legal Services: $45,000
- Current Operations - Regular Highways: $2,585,000
Regular Highways: $2,090,000
Police Protection: $1,366,000
Correctional Institutions: $974,000
Police Protection: $947,000
Financial Administration: $895,000
Correctional Institutions: $832,000
General - Other: $714,000
Financial Administration: $709,000
Judicial and Legal Services: $617,000
Judicial and Legal Services: $498,000
Central Staff Services: $420,000
Central Staff Services: $407,000
Libraries: $250,000
Corrections - Other: $217,000
General Public Buildings: $210,000
Libraries: $205,000
General Public Buildings: $199,000
Public Welfare, Vendor Payments for Medical Care: $134,000
General - Other: $88,000
Parks and Recreation: $54,000
Health - Other: $44,000
Local Fire Protection: $40,000
Public Welfare, Vendor Payments for Medical Care: $40,000
Health - Other: $39,000
Natural Resources - Other: $39,000
Air Transportation: $36,000
Parks and Recreation: $20,000
Natural Resources - Other: $15,000
Air Transportation: $11,000
- General - Interest on Debt: $44,000
Interest on Debt: $5,000
- Intergovernmental to Local - Other - General - Other: $241,000
- Long Term Debt - Beginning Outstanding - Unspecified Public Purpose: $938,000
Outstanding Unspecified Public Purpose: $681,000
Retired Unspecified Public Purpose: $257,000
Retired Unspecified Public Purpose: $167,000
Beginning Outstanding - Unspecified Public Purpose: $167,000
- Miscellaneous - Fines and Forfeits: $628,000
Fines and Forfeits: $471,000
Interest Earnings: $109,000
Donations From Private Sources: $104,000
Interest Earnings: $54,000
General Revenue - Other: $38,000
Donations From Private Sources: $17,000
General Revenue - Other: $12,000
- Other Capital Outlay - Police Protection: $114,000
Correctional Institutions: $71,000
Parks and Recreation: $69,000
General - Other: $54,000
- Other Funds - Cash and Securities: $7,136,000
Cash and Securities: $5,321,000
- Sinking Funds - Cash and Securities: $130,000
- State Intergovernmental - Other: $2,312,000
Other: $125,000
Highways: $48,000
Highways: $18,000
Public Welfare: $8,000
General Local Government Support: $6,000
General Local Government Support: $6,000
- Tax - Property: $6,086,000
Property: $5,936,000
Motor Vehicle License: $837,000
General Sales and Gross Receipts: $463,000
General Sales and Gross Receipts: $460,000
Motor Vehicle License: $444,000
Occupation and Business License - Other: $123,000
Other License: $77,000
Other Selective Sales: $55,000
Other Selective Sales: $28,000
- Total Salaries and Wages: $2,423,000
Franklin County government finances - Cash and Securities in 2017:
- Bond Funds - Cash and Securities: $1,904,000
- Charges - Other: $877,000
Other: $391,000
Air Transportation: $8,000
Air Transportation: $7,000
- Construction - General Public Buildings: $1,815,000
Regular Highways: $304,000
Parks and Recreation: $252,000
Regular Highways: $85,000
Judicial and Legal Services: $45,000
- Current Operations - Regular Highways: $2,585,000
Regular Highways: $2,090,000
Police Protection: $1,366,000
Correctional Institutions: $974,000
Police Protection: $947,000
Financial Administration: $895,000
Correctional Institutions: $832,000
General - Other: $714,000
Financial Administration: $709,000
Judicial and Legal Services: $617,000
Judicial and Legal Services: $498,000
Central Staff Services: $420,000
Central Staff Services: $407,000
Libraries: $250,000
Corrections - Other: $217,000
General Public Buildings: $210,000
Libraries: $205,000
General Public Buildings: $199,000
Public Welfare, Vendor Payments for Medical Care: $134,000
General - Other: $88,000
Parks and Recreation: $54,000
Health - Other: $44,000
Local Fire Protection: $40,000
Public Welfare, Vendor Payments for Medical Care: $40,000
Health - Other: $39,000
Natural Resources - Other: $39,000
Air Transportation: $36,000
Parks and Recreation: $20,000
Natural Resources - Other: $15,000
Air Transportation: $11,000
- General - Interest on Debt: $44,000
Interest on Debt: $5,000
- Intergovernmental to Local - Other - General - Other: $241,000
- Long Term Debt - Beginning Outstanding - Unspecified Public Purpose: $938,000
Outstanding Unspecified Public Purpose: $681,000
Retired Unspecified Public Purpose: $257,000
Retired Unspecified Public Purpose: $167,000
Beginning Outstanding - Unspecified Public Purpose: $167,000
- Miscellaneous - Fines and Forfeits: $628,000
Fines and Forfeits: $471,000
Interest Earnings: $109,000
Donations From Private Sources: $104,000
Interest Earnings: $54,000
General Revenue - Other: $38,000
Donations From Private Sources: $17,000
General Revenue - Other: $12,000
- Other Capital Outlay - Police Protection: $114,000
Correctional Institutions: $71,000
Parks and Recreation: $69,000
General - Other: $54,000
- Other Funds - Cash and Securities: $7,136,000
Cash and Securities: $5,321,000
- Sinking Funds - Cash and Securities: $130,000
- State Intergovernmental - Other: $2,312,000
Other: $125,000
Highways: $48,000
Highways: $18,000
Public Welfare: $8,000
General Local Government Support: $6,000
General Local Government Support: $6,000
- Tax - Property: $6,086,000
Property: $5,936,000
Motor Vehicle License: $837,000
General Sales and Gross Receipts: $463,000
General Sales and Gross Receipts: $460,000
Motor Vehicle License: $444,000
Occupation and Business License - Other: $123,000
Other License: $77,000
Other Selective Sales: $55,000
Other Selective Sales: $28,000
- Total Salaries and Wages: $2,423,000
Supplemental Security Income (SSI) in 2006:
- Total number of recipients: 198
- Number of aged recipients: 35
- Number of blind and disabled recipients: 163
- Number of recipients under 18: 34
- Number of recipients between 18 and 64: 111
- Number of recipients older than 64: 53
- Number of recipients also receiving OASDI: 82
- Amount of payments (thousands of dollars): 76
| Most common first names in Franklin County, TX among deceased individuals | ||
| Name | Count | Lived (average) |
|---|---|---|
| Mary | 58 | 81.8 years |
| James | 45 | 76.1 years |
| John | 38 | 77.5 years |
| William | 37 | 78.2 years |
| Robert | 26 | 70.3 years |
| Joe | 23 | 75.1 years |
| Charles | 21 | 68.3 years |
| Ruby | 20 | 86.2 years |
| Willie | 18 | 83.6 years |
| Ruth | 17 | 78.2 years |
| Most common last names in Franklin County, TX among deceased individuals | ||
| Last name | Count | Lived (average) |
|---|---|---|
| Smith | 31 | 80.3 years |
| Davis | 21 | 82.1 years |
| Miller | 19 | 79.3 years |
| Lawrence | 18 | 79.8 years |
| Newsom | 17 | 82.0 years |
| White | 16 | 81.0 years |
| Jones | 16 | 79.6 years |
| Williams | 15 | 84.0 years |
| Evans | 15 | 64.1 years |
| Campbell | 14 | 80.9 years |
| Businesses in Franklin County, TX | ||||
| Name | Count | Name | Count | |
|---|---|---|---|---|
| Ace Hardware | 1 | Nike | 1 | |
| Alco Stores | 1 | SONIC Drive-In | 1 | |
| Burger King | 1 | Subway | 1 | |
| Dairy Queen | 1 | Super 8 | 1 | |
| FedEx | 1 | U-Haul | 1 | |
| H&R Block | 1 | UPS | 2 | |
Franklin County on our top lists:
- #93 on the list of "Top 101 counties with the lowest ground withdrawal of fresh water for public supply"