Grayson County, Kentucky (KY)
County owner-occupied free and clear houses and condos in 2010: 3,348
County owner-occupied houses and condos in 2000: 7,418
Renter-occupied apartments: 2,455 (it was 2,178 in 2000)
| % of renters here: | 23% |
| State: | 31% |
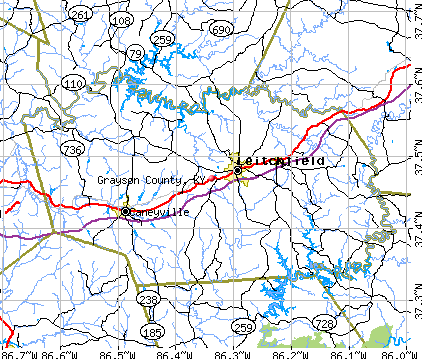
Land area: 504 sq. mi.
Water area: 7.2 sq. mi.
Population density: 53 people per square mile (average).
Industries providing employment: Educational, health and social services (22.8%), Manufacturing (21.9%).
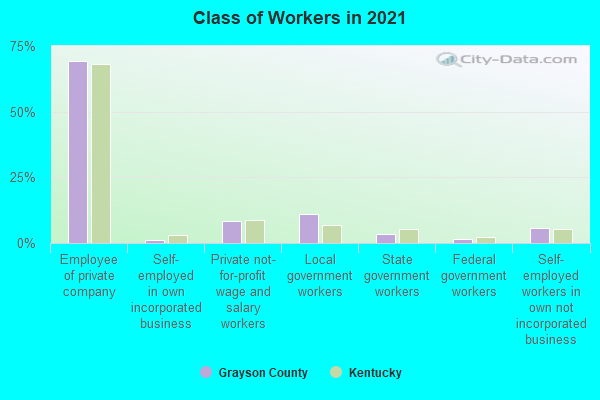
Type of workers:
- Private wage or salary: 77%
- Government: 16%
- Self-employed, not incorporated: 7%
- Unpaid family work: 0%
- OSM Map
- General Map
- Google Map
- MSN Map

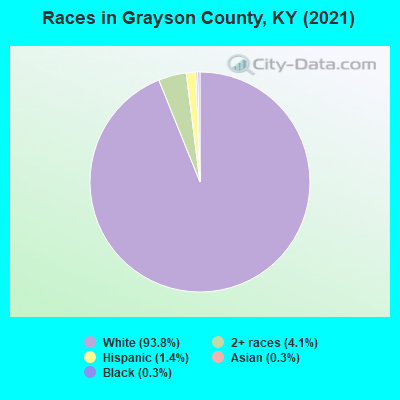
- 24,91894.1%White Non-Hispanic Alone
- 8783.3%Two or more races
- 4091.5%Hispanic or Latino
- 1300.5%Black Non-Hispanic Alone
- 790.3%Asian alone
- 600.2%Some other race alone
- 110.04%American Indian and Alaska Native alone
| Median resident age: | 40.3 years |
| Kentucky median age: | 39.4 years |
| Males: 13,172 | |
| Females: 13,348 |

 | How would you divide Kentucky geographicaly? (13 replies) |
| Southern Louisville suburbs (12 replies) |
| What is life like in Louisville??? (28 replies) |
| Kentucky obesity problem. What can be done? (45 replies) |
| Goofy Kentucky Town Names ... (98 replies) |
| Considering relocating to KY---Religion an issue? (127 replies) |
| Grayson County: | 2.0 people |
| Kentucky: | 2 people |
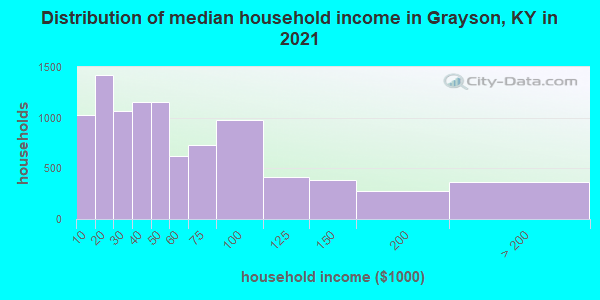
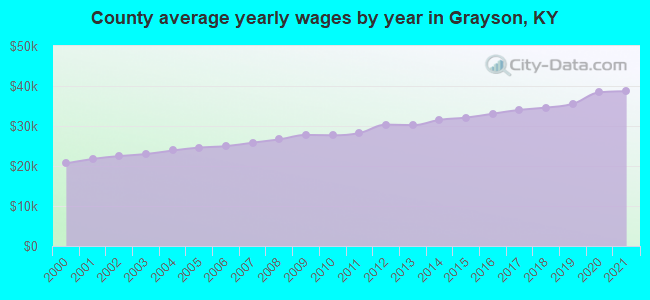
Estimated median household income in 2022: $46,366 ($27,639 in 1999)
| This county: | $46,366 |
| Kentucky: | $59,341 |
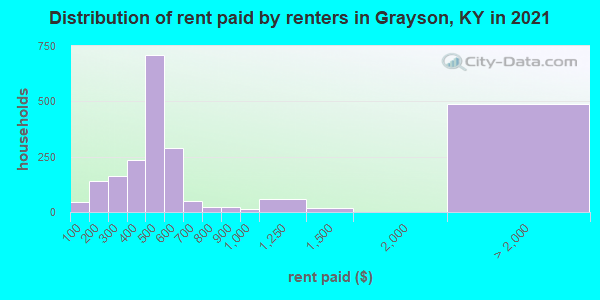
Median contract rent in 2022 for apartments: $483 (lower quartile is $363, upper quartile is $561)
| This county: | $483 |
| State: | $702 |
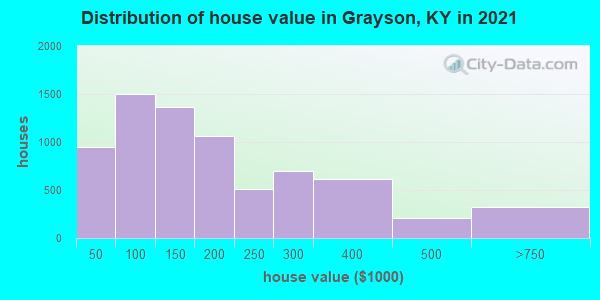
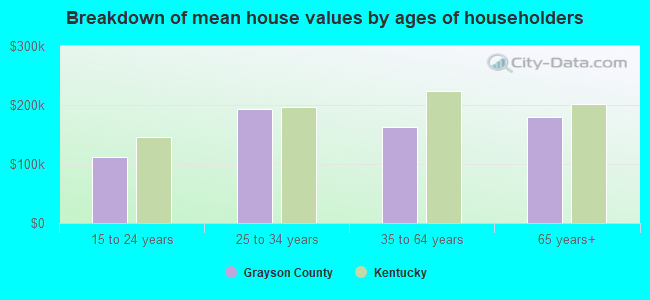
Estimated median house or condo value in 2022: $156,929 (it was $63,000 in 2000)
| Grayson: | $156,929 |
| Kentucky: | $196,300 |
Mean price in 2022:
Median monthly housing costs for homes and condos with a mortgage: $1,095Detached houses: $213,828
Here: $213,828 State: $256,452 Townhouses or other attached units: $160,800
Here: $160,800 State: $264,090 In 2-unit structures: $126,712
Here: $126,712 State: $211,203 Mobile homes: $63,683
Here: $63,683 State: $84,635
Median monthly housing costs for units without a mortgage: $391
Institutionalized population: 768
Crime in 2021 (reported by the sheriff's office or county police, not the county total):
- Murders: 0
- Rapes: 1
- Robberies: 1
- Assaults: 7
- Burglaries: 21
- Thefts: 40
- Auto thefts: 13
Crime in 2020 (reported by the sheriff's office or county police, not the county total):
- Murders: 0
- Rapes: 0
- Robberies: 1
- Assaults: 13
- Burglaries: 26
- Thefts: 46
- Auto thefts: 10
Single-family new house construction building permits:
- 2022: 1 building, cost: $225,000
- 2021: 6 buildings, average cost: $203,400
- 2020: 4 buildings, average cost: $209,100
- 2019: 1 building, cost: $100,000
- 2018: 8 buildings, average cost: $156,300
- 2017: 8 buildings, average cost: $168,100
- 2016: 3 buildings, average cost: $227,900
- 2015: 10 buildings, average cost: $195,200
- 2014: 1 building, cost: $85,000
- 2013: 7 buildings, average cost: $117,900
- 2012: 3 buildings, average cost: $149,700
- 2011: 3 buildings, average cost: $150,000
- 2010: 4 buildings, average cost: $118,000
- 2009: 19 buildings, average cost: $140,000
- 2008: 0 buildings
- 2007: 0 buildings
- 2006: 0 buildings
- 2005: 0 buildings
- 2004: 0 buildings
- 2003: 0 buildings
- 2002: 0 buildings
- 2001: 0 buildings
- 2000: 0 buildings
- 1999: 0 buildings
- 1998: 0 buildings
- 1997: 0 buildings


Median real estate property taxes paid for housing units with mortgages in 2022: $1,066 (0.6%)
Median real estate property taxes paid for housing units with no mortgage in 2022: $702 (0.5%)
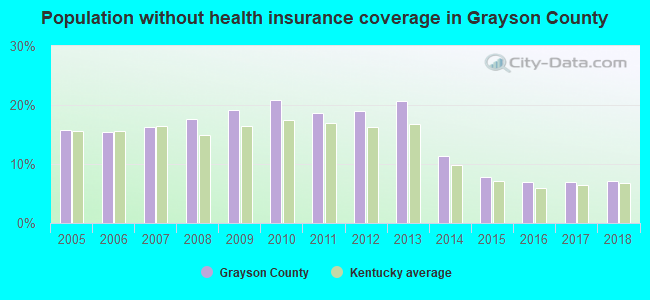
| Grayson County: | 21.5% |
| Kentucky: | 16.5% |
Median age of residents in 2022: 40.3 years old
(Males: 40.0 years old, Females: 41.3 years old)
(Median age for: White residents: 40.8 years old, Black residents: 34.6 years old, American Indian residents: 46.8 years old, Hispanic or Latino residents: 23.1 years old, Other race residents: 24.8 years old)
Fair market rent in 2006 for a 1-bedroom apartment in Grayson County is $358 a month.
Fair market rent for a 2-bedroom apartment is $429 a month.
Fair market rent for a 3-bedroom apartment is $559 a month.
Cities in this county include: Leitchfield, Millerstown, Short Creek, Clarkson, Caneyville.
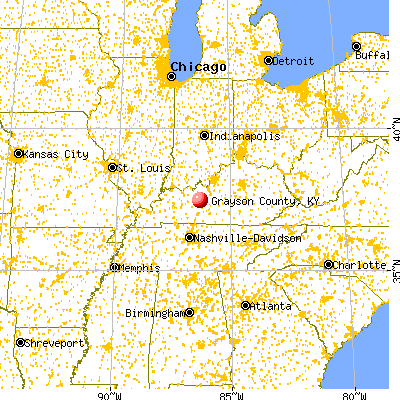
Neighboring counties: Cimarron County, Oklahoma  , Crittenden County , Putnam County, West Virginia
  , Louisa County, Virginia
  .
.
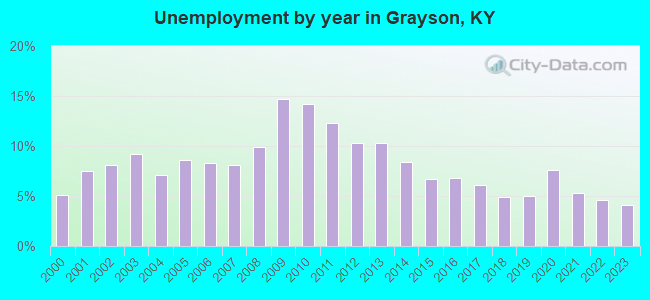
| Here: | 4.2% |
| Kentucky: | 3.8% |
Current college students: 684
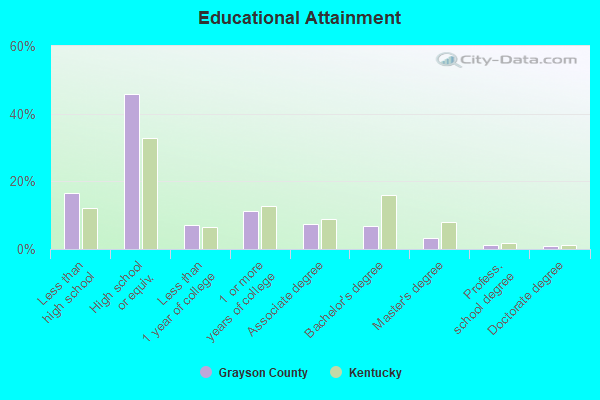
People 25 years of age or older with a high school degree or higher: 83.6%
People 25 years of age or older with a bachelor's degree or higher: 13.3%
Number of foreign born residents: 211 (38.1% naturalized citizens)
| Grayson County: | 0.8% |
| Whole state: | 4.0% |
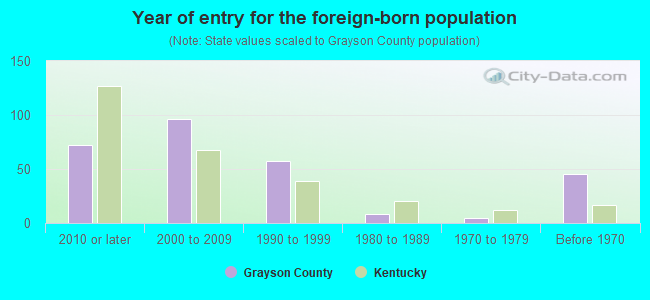
- Year of entry for the foreign-born population
- 222010 or later
- 942000 to 2009
- 361990 to 1999
- 81980 to 1989
- 51970 to 1979
- 45Before 1970
Mean travel time to work (commute): minutes
Percentage of county residents living and working in this county: 98.5%
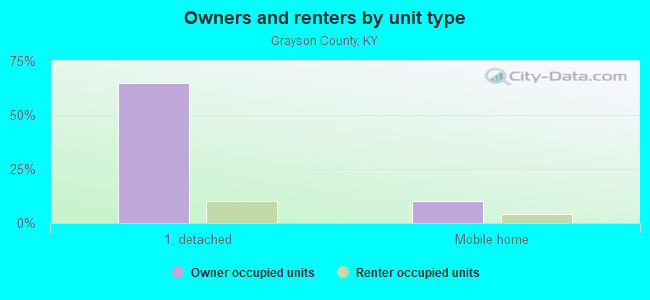
Housing units in structures:
- One, detached: 9,880
- One, attached: 139
- Two: 259
- 3 or 4: 326
- 5 to 9: 235
- 10 to 19: 68
- 20 or more: 162
- Mobile homes: 2,337
- Boats, RVs, vans, etc.: 18
Housing units in Grayson County with a mortgage: 3,461 (306 second mortgage, 0 home equity loan, 264 both second mortgage and home equity loan)
Houses without a mortgage: 98
| Here: | 3.0% with mortgage |
| State: | 96.8% with mortgage |
Religion statistics for Grayson County
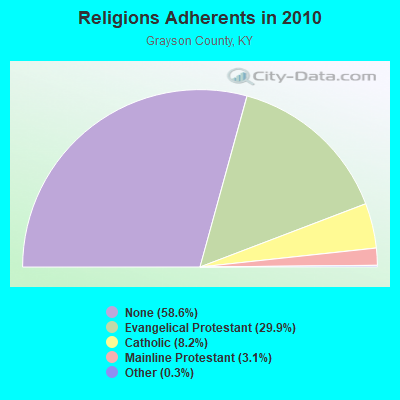
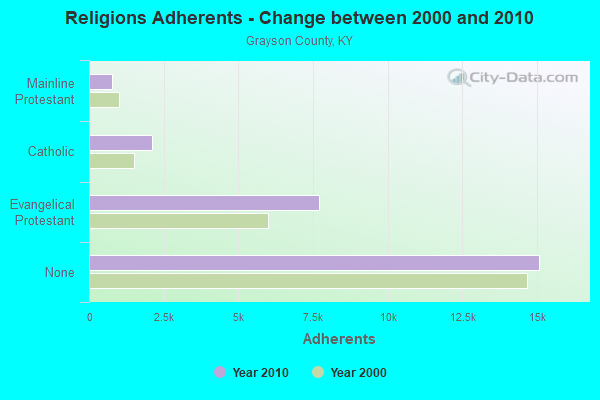
| Religion | Adherents | Congregations |
|---|---|---|
| Evangelical Protestant | 7,693 | 50 |
| Catholic | 2,100 | 6 |
| Mainline Protestant | 787 | 8 |
| Other | 77 | 1 |
| None | 15,089 | - |
Source: Clifford Grammich, Kirk Hadaway, Richard Houseal, Dale E.Jones, Alexei Krindatch, Richie Stanley and Richard H.Taylor. 2012. 2010 U.S.Religion Census: Religious Congregations & Membership Study. Association of Statisticians of American Religious Bodies. Jones, Dale E., et al. 2002. Congregations and Membership in the United States 2000. Nashville, TN: Glenmary Research Center.
Food Environment Statistics:
| Grayson County: | 3.56 / 10,000 pop. |
| State: | 2.19 / 10,000 pop. |
| Here: | 0.40 / 10,000 pop. |
| Kentucky: | 0.25 / 10,000 pop. |
| This county: | 1.98 / 10,000 pop. |
| Kentucky: | 0.74 / 10,000 pop. |
| Grayson County: | 7.11 / 10,000 pop. |
| Kentucky: | 4.36 / 10,000 pop. |
| This county: | 3.56 / 10,000 pop. |
| State: | 5.74 / 10,000 pop. |
| Grayson County: | 12.2% |
| Kentucky: | 11.0% |
| Grayson County: | 28.5% |
| State: | 30.0% |
| Here: | 15.1% |
| State: | 15.9% |
Agriculture in Grayson County:
Average size of farms: 141 acresAverage value of agricultural products sold per farm: $19,177
Average value of crops sold per acre for harvested cropland: $129.74
The value of nursery, greenhouse, floriculture, and sod as a percentage of the total market value of agricultural products sold: 1.27%
The value of livestock, poultry, and their products as a percentage of the total market value of agricultural products sold: 76.15%
Average total farm production expenses per farm: $18,961
Harvested cropland as a percentage of land in farms: 24.96%
Irrigated harvested cropland as a percentage of land in farms: 0.05%
Average market value of all machinery and equipment per farm: $28,726
The percentage of farms operated by a family or individual: 94.00%
Average age of principal farm operators: 55 years
Average number of cattle and calves per 100 acres of all land in farms: 16.92
Milk cows as a percentage of all cattle and calves: 5.51%
Corn for grain: 6349 harvested acres
All wheat for grain: 857 harvested acres
Soybeans for beans: 7625 harvested acres
Vegetables: 10 harvested acres
Land in orchards: 37 acres
Earthquake activity:
Grayson County-area historical earthquake activity is significantly above Kentucky state average. It is 158% greater than the overall U.S. average.On 4/18/2008 at 09:36:59, a magnitude 5.4 (5.1 MB, 4.8 MS, 5.4 MW, 5.2 MW, Class: Moderate, Intensity: VI - VII) earthquake occurred 108.4 miles away from Grayson County center
On 4/18/2008 at 09:36:59, a magnitude 5.2 (5.2 MW, Depth: 8.9 mi) earthquake occurred 108.4 miles away from the county center
On 6/18/2002 at 17:37:15, a magnitude 5.0 (4.3 MB, 4.6 MW, 5.0 LG) earthquake occurred 86.6 miles away from the county center
On 7/27/1980 at 18:52:21, a magnitude 5.2 (5.1 MB, 4.7 MS, 5.0 UK, 5.2 UK) earthquake occurred 140.5 miles away from the county center
On 6/10/1987 at 23:48:54, a magnitude 5.1 (4.9 MB, 4.4 MS, 4.6 MS, 5.1 LG) earthquake occurred 125.8 miles away from Grayson County center
On 4/18/2008 at 15:14:16, a magnitude 4.8 (4.5 MB, 4.8 MW, 4.6 MW, Class: Light, Intensity: IV - V) earthquake occurred 107.8 miles away from the county center
Magnitude types: regional Lg-wave magnitude (LG), body-wave magnitude (MB), surface-wave magnitude (MS), moment magnitude (MW)
Most recent natural disasters:
- Kentucky Covid-19 Pandemic, Incident Period: January 20, 2020, FEMA Id: 4497, Natural disaster type: Other
- Kentucky Severe Storms, Tornadoes, Straight-line Winds, and Flooding, Incident Period: February 29, 2012 to March 03, 2012, Major Disaster (Presidential) Declared DR-4057: March 06, 2012, FEMA Id: 4057, Natural disaster type: Storm, Tornado, Flood, Wind
- Kentucky Severe Storms, Tornadoes, and Flooding, Incident Period: April 12, 2011 to May 20, 2011, Major Disaster (Presidential) Declared DR-1976: May 04, 2011, FEMA Id: 1976, Natural disaster type: Storm, Tornado, Flood
- Kentucky Severe Storms, Flooding, Mudslides, and Tornadoes, Incident Period: May 01, 2010 to June 01, 2010, Major Disaster (Presidential) Declared DR-1912: May 11, 2010, FEMA Id: 1912, Natural disaster type: Storm, Tornado, Mudslide, Flood
- Kentucky Severe Storms, Tornadoes, Flooding, and Mudslides, Incident Period: May 03, 2009 to May 20, 2009, Major Disaster (Presidential) Declared DR-1841: May 29, 2009, FEMA Id: 1841, Natural disaster type: Storm, Tornado, Mudslide, Flood
- Kentucky Severe Winter Storm, Incident Period: January 27, 2009 to February 05, 2009, Emergency Declared EM-3302: January 28, 2009, FEMA Id: 3302, Natural disaster type: Winter Storm
- Kentucky Severe Winter Storm and Flooding, Incident Period: January 26, 2009 to February 13, 2009, Major Disaster (Presidential) Declared DR-1818: February 05, 2009, FEMA Id: 1818, Natural disaster type: Winter Storm, Flood
- Kentucky Severe Storms, Tornadoes, Straight-line Winds, and Flooding, Incident Period: February 05, 2008 to February 06, 2008, Major Disaster (Presidential) Declared DR-1746: February 21, 2008, FEMA Id: 1746, Natural disaster type: Storm, Tornado, Flood, Wind
- Kentucky Hurricane Katrina Evacuation, Incident Period: August 29, 2005 to October 01, 2005, Emergency Declared EM-3231: September 10, 2005, FEMA Id: 3231, Natural disaster type: Hurricane
- Kentucky Severe Winter Storm and Record Snow, Incident Period: December 21, 2004 to December 23, 2004, Major Disaster (Presidential) Declared DR-1578: February 08, 2005, FEMA Id: 1578, Natural disaster type: Winter Storm, Snow
- 10 other natural disasters have been reported since 1953.
The number of natural disasters in Grayson County (20) is greater than the US average (15).
Major Disasters (Presidential) Declared: 17
Emergencies Declared: 2
Causes of natural disasters: Floods: 12, Storms: 12, Tornadoes: 9, Winter Storms: 4, Mudslides: 3, Snows: 2, Winds: 2, Blizzard: 1, Freeze: 1, Hurricane: 1, Other: 1 (Note: some incidents may be assigned to more than one category).
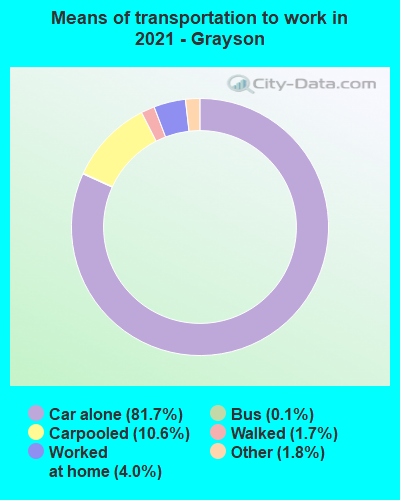
Means of transportation to work:
- Drove a car alone: 6,597 (76.6%)
- Carpooled: 1,089 (12.6%)
- Bus: 1 (0.0%)
- Ferryboat: 31 (0.4%)
- Taxicab, motorcycle, or other means: 51 (0.6%)
- Walked: 128 (1.5%)
- Worked at home: 714 (8.3%)
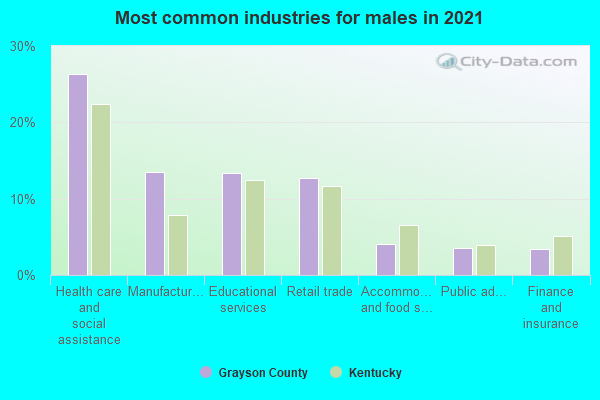
- Health care and social assistance (27%)
- Educational services (13%)
- Manufacturing (13%)
- Retail trade (12%)
- Accommodation and food services (5%)
- Finance and insurance (4%)
- Public administration (4%)

- Health care and social assistance (29%)
- Educational services (14%)
- Manufacturing (14%)
- Retail trade (13%)
- Accommodation and food services (5%)
- Finance and insurance (4%)
- Public administration (4%)
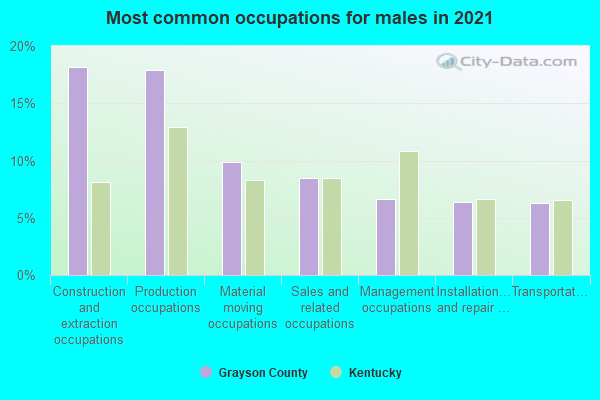
- Construction and extraction occupations (19%)
- Production occupations (16%)
- Material moving occupations (9%)
- Management occupations (8%)
- Sales and related occupations (7%)
- Installation, maintenance, and repair occupations (7%)
- Transportation occupations (7%)
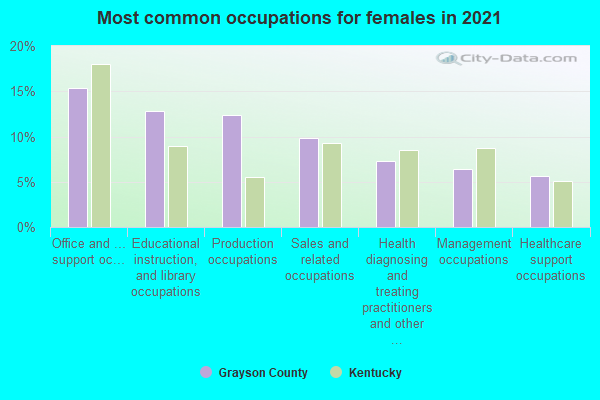
- Office and administrative support occupations (15%)
- Educational instruction, and library occupations (12%)
- Sales and related occupations (12%)
- Production occupations (11%)
- Health diagnosing and treating practitioners and other technical occupations (7%)
- Management occupations (7%)
- Healthcare support occupations (6%)
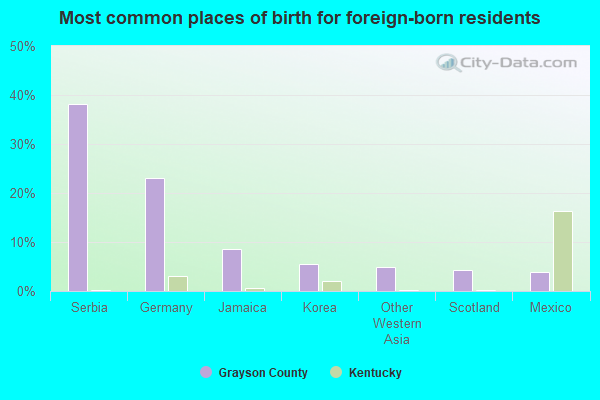
- Serbia (32%)
- Jamaica (21%)
- Germany (12%)
- Other Western Asia (11%)
- Korea (6%)
- Guatemala (6%)
- Haiti (3%)
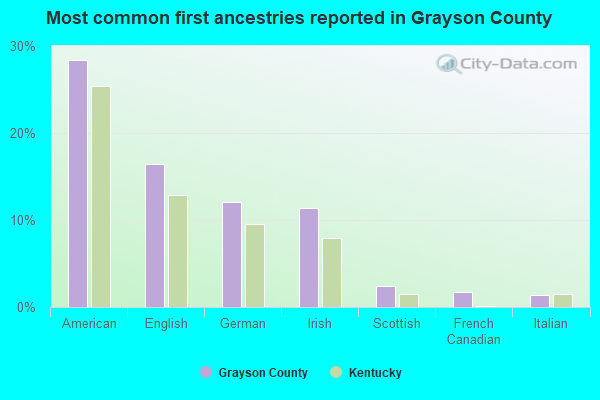
- American (33%)
- English (18%)
- Irish (11%)
- German (10%)
- Scottish (3%)
- Italian (2%)
- European (2%)
166 people in nursing facilities/skilled-nursing facilities
People in group quarters in Grayson County, Kentucky in 2000:
- 168 people in nursing homes
- 150 people in local jails and other confinement facilities (including police lockups)
- 4 people in other nonhousehold living situations
- 2 people in other noninstitutional group quarters
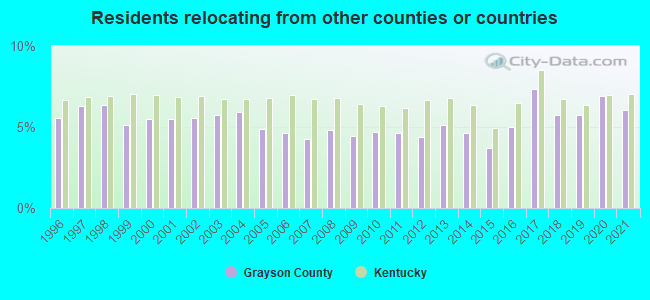
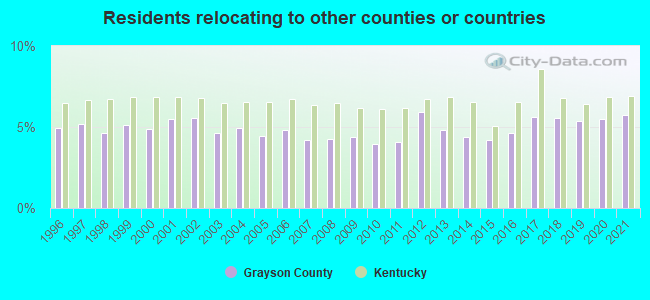
6.05% of this county's 2021 resident taxpayers lived in other counties in 2020 ($49,616 average adjusted gross income)
| Here: | 6.05% |
| Kentucky average: | 7.04% |
10 or fewer of this county's residents moved from foreign countries.
4.59% relocated from other counties in Kentucky ($34,609 average AGI)
1.46% relocated from other states ($15,007 average AGI)
Grayson County: 1.46% Kentucky average: 2.87%
Top counties from which taxpayers relocated into this county between 2020 and 2021:
| from Hardin County, KY | |
| from Jefferson County, KY | |
| from Breckinridge County, KY | |
| from Edmonson County, KY |
5.74% of this county's 2020 resident taxpayers moved to other counties in 2021 ($41,495 average adjusted gross income)
| Here: | 5.74% |
| Kentucky average: | 6.89% |
10 or fewer of this county's residents moved to foreign countries.
4.28% relocated to other counties in Kentucky ($28,623 average AGI)
1.47% relocated to other states ($12,872 average AGI)
Grayson County: 1.47% Kentucky average: 2.73%
Top counties to which taxpayers relocated from this county between 2020 and 2021:
| to Hardin County, KY | |
| to Breckinridge County, KY | |
| to Jefferson County, KY | |
| to Warren County, KY | |
| to Edmonson County, KY |
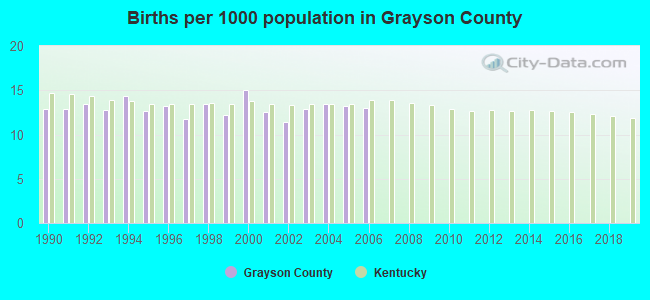
Births per 1000 population from 1990 to 1999: 13.0
Births per 1000 population from 2000 to 2006: 13.1
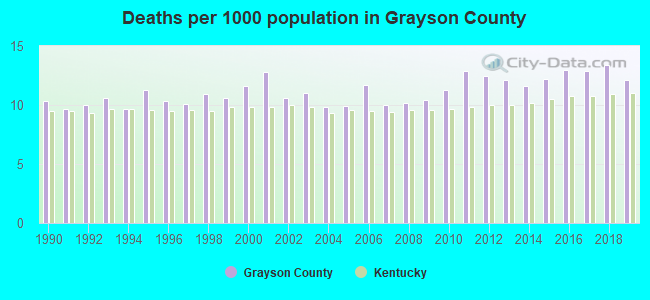
Deaths per 1000 population from 1990 to 1999: 10.4
Deaths per 1000 population from 2000 to 2009: 10.8
Deaths per 1000 population from 2010 to 2020: 12.6
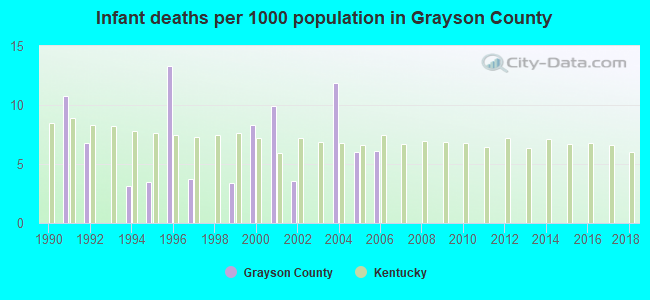
Infant deaths per 1000 live births from 1990 to 1999: 4.5
Infant deaths per 1000 live births from 2000 to 2006: 6.5
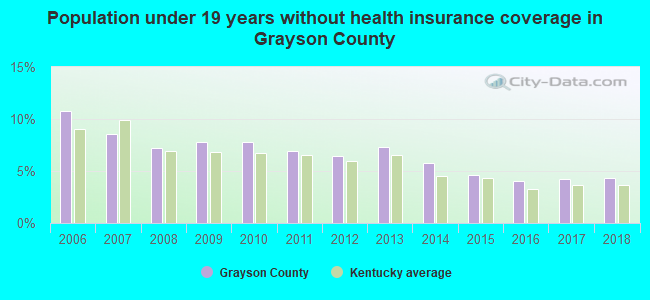
Persons under 19 years old without health insurance coverage in 2018: 4.3%
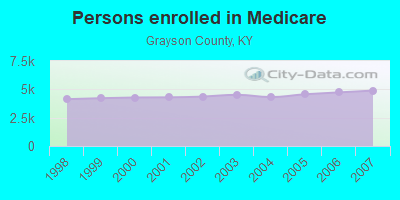
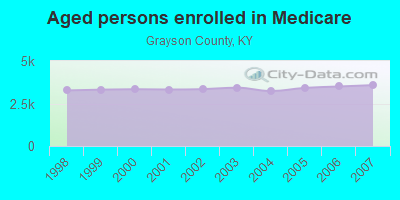
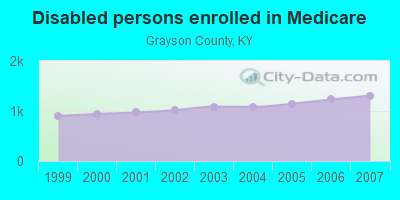
Persons enrolled in hospital insurance and/or supplemental medical insurance (Medicare) in July 1, 2007: 4,889 (3,580 aged, 1,309 disabled)
Children under 18 without health insurance coverage in 2007: 593 (10%)
Most common underlying causes of death in Grayson County, Kentucky in 1999 - 2019:
- Acute myocardial infarction, unspecified (656)
- Bronchus or lung, unspecified - Malignant neoplasms (477)
- Chronic obstructive pulmonary disease, unspecified (303)
- Atherosclerotic heart disease (187)
- Stroke, not specified as haemorrhage or infarction (141)
- Alzheimer disease, unspecified (80)
- Unspecified dementia (58)
- Congestive heart failure (49)
- Pneumonia, unspecified (46)
- Cardiac arrest, unspecified (45)
Population without health insurance coverage in 2000: 15%
Children under 18 without health insurance coverage in 2000: 10%
Short term general hospital admissions per 100,000 population in 2004: 10,338
Short term general hospital beds per 100,000 population in 2004: 300
Emergency room visits per 100,000 population in 2004: 79,119
General practice office based MDs per 100,000 population in 2005: 1,306
Medical specialist MDs per 100,000 population in 2005: 992
Total births per 100,000 population, July 2005 - July 2006 : 21
Total deaths per 100,000 population, July 2005 - July 2006: 52
Limited-service eating places per 100,000 population in 2005 : 12
Crimes per 100,000 population in 1996: 1
Suicides per 1,000,000 population from 2000 to 2006: 214.9. This is more than state average.
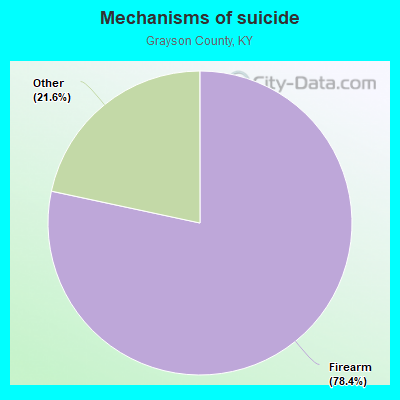
- Firearm - 168.4
- Other - 46.5
Household type by relationship:
Households: 26,520- Male householders: 4,842 (1,617 living alone), Female householders: 5,183 (1,597 living alone)
4,729 spouses (4,696 opposite-sex spouses), 638 unmarried partners, (610 opposite-sex unmarried partners), 7,767 children (6,930 natural, 168 adopted, 665 stepchildren), 1,089 grandchildren, 293 brothers or sisters, 195 parents, 79 foster children, 467 other relatives, 680 non-relatives
- In group quarters: 425
Size of family households: 3,134 2-persons, 1,427 3-persons, 998 4-persons, 484 5-persons, 256 6-persons, 37 7-or-more-persons.
Size of nonfamily households: 3,214 1-person, 423 2-persons, 54 3-persons, 14 4-persons.
3,458 married couples with children.
1,635 single-parent households (392 men, 1,243 women).
98.1% of residents of Grayson speak English at home.
1.0% of residents speak Spanish at home (29% speak English very well, 45% speak English well, 26% speak English not well).
0.7% of residents speak other Indo-European language at home (89% speak English very well, 11% speak English well).
0.1% of residents speak Asian or Pacific Island language at home (100% speak English very well).
0.1% of residents speak other language at home (100% speak English very well).
In fiscal year 2004:
Federal Government expenditure: $154,347,000 ($6,173 per capita)
Department of Defense expenditure: $4,312,000
Federal direct payments to individuals for retirement and disability: $68,822,000
Federal other direct payments to individuals: $32,439,000
Federal direct payments not to individuals: $1,869,000
Federal grants: $45,425,000
Federal procurement contracts: $1,031,000 ($35,000 Department of Defense)
Federal salaries and wages: $4,763,000 ($1,053,000 Department of Defense)
Federal Government direct loans: $955,000
Federal guaranteed/insured loans: $3,467,000
Federal Government insurance: $2,591,000
Population change from April 1, 2000 to July 1, 2005:
Births: 1,635| Here: | 65 per 1000 residents |
| State: | 69 per 1000 residents |
Deaths: 1,450
| Here: | 58 per 1000 residents |
| State: | 50 per 1000 residents |
Net international migration: +26
| Here: | +1 per 1000 residents |
| State: | +7 per 1000 residents |
Net internal migration: +958
| Here: | +38 per 1000 residents |
| State: | +8 per 1000 residents |
Total withdrawal of fresh water for public supply: 2.78 millions of gallons per day (all from surface)
| Here: | 6.4 |
| State: | 6.4 |
| Here: | 4.6 |
| State: | 4.4 |
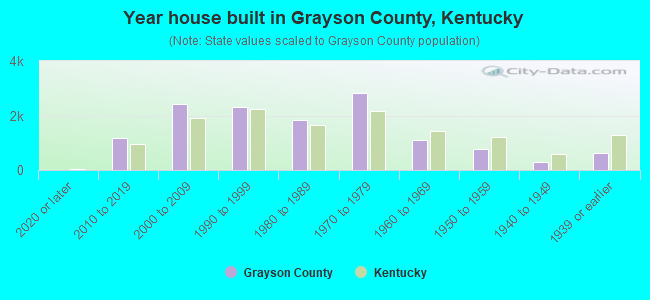
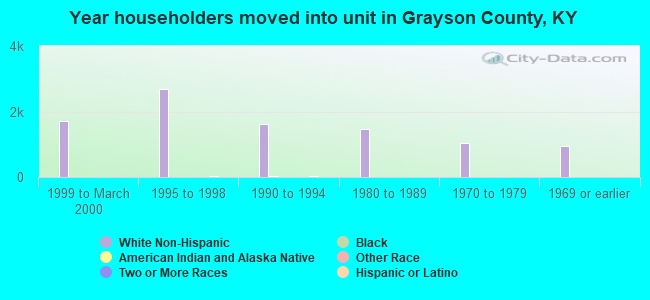
- Year house built in Grayson County, Kentucky
- 352020 or later
- 1,6352010 to 2019
- 2,5872000 to 2009
- 2,0621990 to 1999
- 1,7941980 to 1989
- 2,6591970 to 1979
- 1,2701960 to 1969
- 6411950 to 1959
- 2071940 to 1949
- 6181939 or earlier
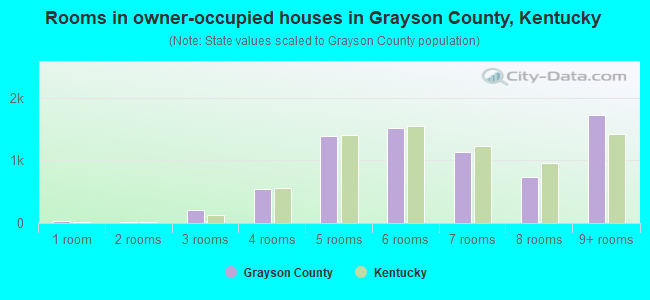
- Rooms in owner-occupied houses in Grayson County, Kentucky
- 451 room
- 172 rooms
- 3013 rooms
- 5614 rooms
- 1,4555 rooms
- 1,6706 rooms
- 1,1537 rooms
- 8588 rooms
- 1,7389+ rooms
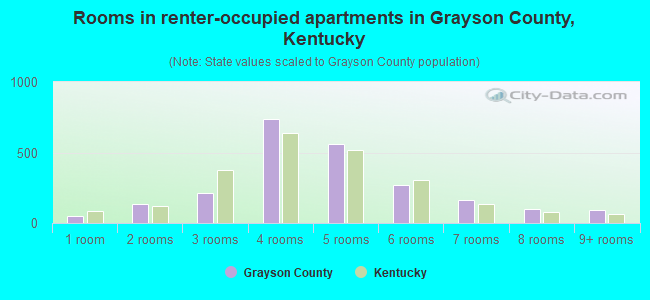
- Rooms in renter-occupied apartments in Grayson County, Kentucky
- 1211 room
- 1312 rooms
- 2173 rooms
- 6354 rooms
- 5965 rooms
- 3156 rooms
- 867 rooms
- 678 rooms
- 959+ rooms
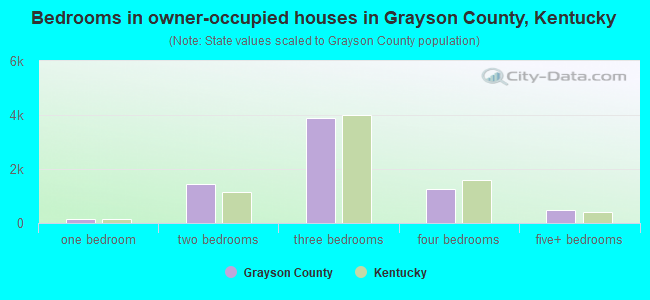
- Bedrooms in owner-occupied houses in Grayson County, Kentucky
- 44no bedroom
- 1641 bedroom
- 1,6302 bedrooms
- 4,1673 bedrooms
- 1,2824 bedrooms
- 4995+ bedrooms
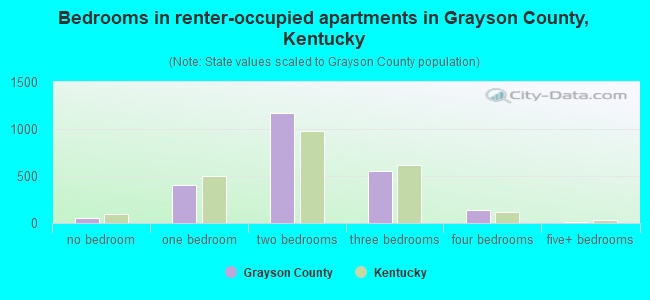
- Bedrooms in renter-occupied apartments in Grayson County, Kentucky
- 127no bedroom
- 3571 bedroom
- 1,0792 bedrooms
- 5793 bedrooms
- 954 bedrooms
- 215+ bedrooms
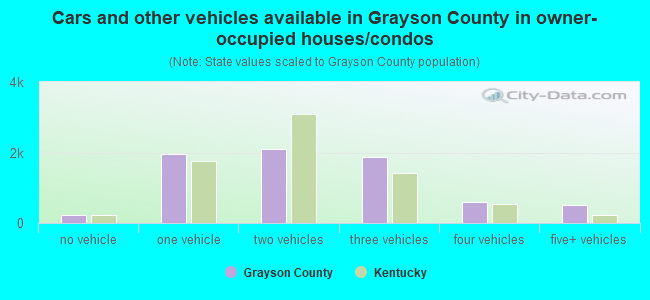
- Cars and other vehicles available in Grayson County in owner-occupied houses/condos
- 237no vehicle
- 2,0521 vehicle
- 2,4452 vehicles
- 1,8103 vehicles
- 7764 vehicles
- 4385+ vehicles
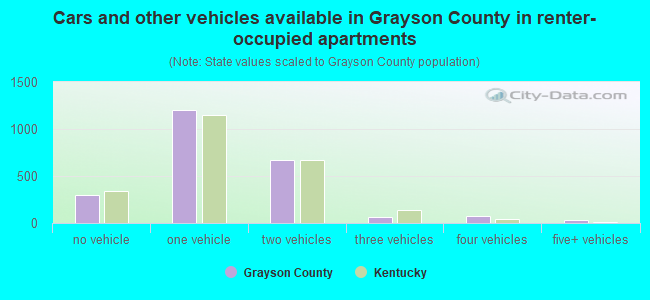
- Cars and other vehicles available in Grayson County in renter-occupied apartments
- 239no vehicle
- 1,2361 vehicle
- 6072 vehicles
- 1233 vehicles
- 554 vehicles
- 145+ vehicles
91.8% of Grayson County residents lived in the same house 1 years ago.
Out of people who lived in different houses, 35% lived in this county.
Out of people who lived in different counties, 64% lived in Kentucky.
| Grayson County: | 91.8% |
| State average: | 87.2% |
Place of birth for U.S.-born residents:
- This state: 21,884
- Other state: 4,214
- Northeast: 371
- Midwest: 1,761
- South: 1,718
- West: 359
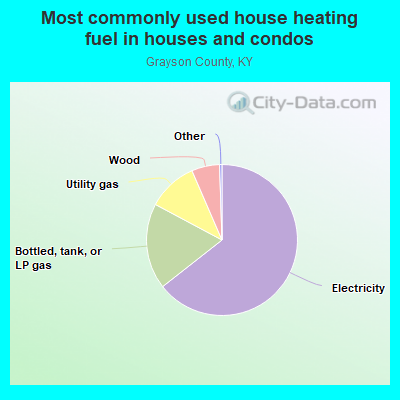
- 66.5%Electricity
- 16.8%Bottled, tank, or LP gas
- 10.3%Utility gas
- 5.5%Wood
- 0.4%Coal or coke
- 0.2%Other fuel
- 0.1%No fuel used
- 0.1%Fuel oil, kerosene, etc.
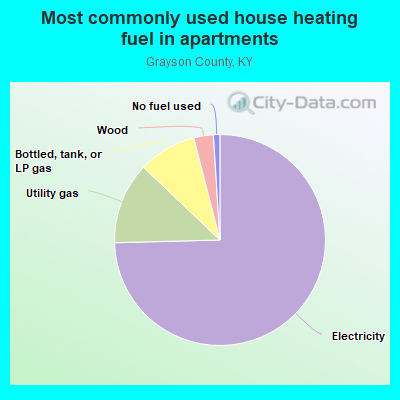
- 73.3%Electricity
- 11.9%Utility gas
- 7.2%Wood
- 7.0%Bottled, tank, or LP gas
- 0.6%No fuel used
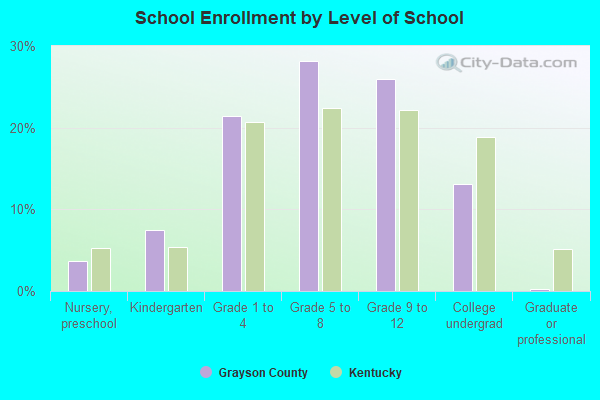
Private vs. public school enrollment:
| Here: | 10.7% |
| Kentucky: | 17.2% |
| Here: | 12.8% |
| Kentucky: | 15.2% |
| Here: | 12.1% |
| Kentucky: | 19.6% |
Grayson County government finances - Expenditure in 2018:
- Bond Funds - Cash and Securities: $446,000
- Charges - Hospital Public: $406,000
Other: $361,000
- Construction - Parks and Recreation: $56,000
- Current Operations - Correctional Institutions: $6,934,000
General - Other: $5,556,000
Regular Highways: $2,427,000
Health - Other: $1,389,000
General Public Buildings: $449,000
Central Staff Services: $258,000
Judicial and Legal Services: $219,000
Financial Administration: $175,000
Police Protection: $57,000
Natural Resources - Other: $50,000
Parks and Recreation: $20,000
Elementary and Secondary Education: $13,000
Solid Waste Management: $7,000
Protective Inspection and Regulation - Other: $2,000
Public Welfare - Other: $1,000
- Federal Intergovernmental - Other: $8,817,000
Health and Hospitals: $353,000
- General - Interest on Debt: $183,000
- Intergovernmental to Local - Other - General - Other: $1,000
- Local Intergovernmental - Health and Hospitals: $356,000
Highways: $14,000
Other: $7,000
- Long Term Debt - Outstanding Unspecified Public Purpose: $9,926,000
Beginning Outstanding - Unspecified Public Purpose: $9,926,000
Beginning Outstanding - Public Debt for Private Purpose: $1,160,000
Outstanding Nonguaranteed - Industrial Revenue: $995,000
Retired Nonguaranteed - Public Debt for Private Purpose: $165,000
- Miscellaneous - General Revenue - Other: $669,000
Rents: $34,000
Sale of Property: $30,000
Interest Earnings: $7,000
- Other Capital Outlay - Health - Other: $304,000
Correctional Institutions: $213,000
Regular Highways: $99,000
General - Other: $30,000
Central Staff Services: $19,000
General Public Building: $11,000
- Other Funds - Cash and Securities: $3,785,000
- Sinking Funds - Cash and Securities: $995,000
- State Intergovernmental - Other: $2,711,000
Highways: $1,683,000
Health and Hospitals: $271,000
General Local Government Support: $121,000
- Tax - Individual Income: $1,319,000
Property: $978,000
Public Utilities Sales: $536,000
Corporation License: $94,000
Documentary and Stock Transfer: $90,000
Other Selective Sales: $56,000
Other License: $1,000
- Total Salaries and Wages: $5,923,000
Grayson County government finances - Revenue in 2018:
- Bond Funds - Cash and Securities: $446,000
- Charges - Hospital Public: $406,000
Other: $361,000
- Construction - Parks and Recreation: $56,000
- Current Operations - Correctional Institutions: $6,934,000
General - Other: $5,556,000
Regular Highways: $2,427,000
Health - Other: $1,389,000
General Public Buildings: $449,000
Central Staff Services: $258,000
Judicial and Legal Services: $219,000
Financial Administration: $175,000
Police Protection: $57,000
Natural Resources - Other: $50,000
Parks and Recreation: $20,000
Elementary and Secondary Education: $13,000
Solid Waste Management: $7,000
Protective Inspection and Regulation - Other: $2,000
Public Welfare - Other: $1,000
- Federal Intergovernmental - Other: $8,817,000
Health and Hospitals: $353,000
- General - Interest on Debt: $183,000
- Intergovernmental to Local - Other - General - Other: $1,000
- Local Intergovernmental - Health and Hospitals: $356,000
Highways: $14,000
Other: $7,000
- Long Term Debt - Outstanding Unspecified Public Purpose: $9,926,000
Beginning Outstanding - Unspecified Public Purpose: $9,926,000
Beginning Outstanding - Public Debt for Private Purpose: $1,160,000
Outstanding Nonguaranteed - Industrial Revenue: $995,000
Retired Nonguaranteed - Public Debt for Private Purpose: $165,000
- Miscellaneous - General Revenue - Other: $669,000
Rents: $34,000
Sale of Property: $30,000
Interest Earnings: $7,000
- Other Capital Outlay - Health - Other: $304,000
Correctional Institutions: $213,000
Regular Highways: $99,000
General - Other: $30,000
Central Staff Services: $19,000
General Public Building: $11,000
- Other Funds - Cash and Securities: $3,785,000
- Sinking Funds - Cash and Securities: $995,000
- State Intergovernmental - Other: $2,711,000
Highways: $1,683,000
Health and Hospitals: $271,000
General Local Government Support: $121,000
- Tax - Individual Income: $1,319,000
Property: $978,000
Public Utilities Sales: $536,000
Corporation License: $94,000
Documentary and Stock Transfer: $90,000
Other Selective Sales: $56,000
Other License: $1,000
- Total Salaries and Wages: $5,923,000
Grayson County government finances - Debt in 2018:
- Bond Funds - Cash and Securities: $446,000
- Charges - Hospital Public: $406,000
Other: $361,000
- Construction - Parks and Recreation: $56,000
- Current Operations - Correctional Institutions: $6,934,000
General - Other: $5,556,000
Regular Highways: $2,427,000
Health - Other: $1,389,000
General Public Buildings: $449,000
Central Staff Services: $258,000
Judicial and Legal Services: $219,000
Financial Administration: $175,000
Police Protection: $57,000
Natural Resources - Other: $50,000
Parks and Recreation: $20,000
Elementary and Secondary Education: $13,000
Solid Waste Management: $7,000
Protective Inspection and Regulation - Other: $2,000
Public Welfare - Other: $1,000
- Federal Intergovernmental - Other: $8,817,000
Health and Hospitals: $353,000
- General - Interest on Debt: $183,000
- Intergovernmental to Local - Other - General - Other: $1,000
- Local Intergovernmental - Health and Hospitals: $356,000
Highways: $14,000
Other: $7,000
- Long Term Debt - Outstanding Unspecified Public Purpose: $9,926,000
Beginning Outstanding - Unspecified Public Purpose: $9,926,000
Beginning Outstanding - Public Debt for Private Purpose: $1,160,000
Outstanding Nonguaranteed - Industrial Revenue: $995,000
Retired Nonguaranteed - Public Debt for Private Purpose: $165,000
- Miscellaneous - General Revenue - Other: $669,000
Rents: $34,000
Sale of Property: $30,000
Interest Earnings: $7,000
- Other Capital Outlay - Health - Other: $304,000
Correctional Institutions: $213,000
Regular Highways: $99,000
General - Other: $30,000
Central Staff Services: $19,000
General Public Building: $11,000
- Other Funds - Cash and Securities: $3,785,000
- Sinking Funds - Cash and Securities: $995,000
- State Intergovernmental - Other: $2,711,000
Highways: $1,683,000
Health and Hospitals: $271,000
General Local Government Support: $121,000
- Tax - Individual Income: $1,319,000
Property: $978,000
Public Utilities Sales: $536,000
Corporation License: $94,000
Documentary and Stock Transfer: $90,000
Other Selective Sales: $56,000
Other License: $1,000
- Total Salaries and Wages: $5,923,000
Grayson County government finances - Cash and Securities in 2018:
- Bond Funds - Cash and Securities: $446,000
- Charges - Hospital Public: $406,000
Other: $361,000
- Construction - Parks and Recreation: $56,000
- Current Operations - Correctional Institutions: $6,934,000
General - Other: $5,556,000
Regular Highways: $2,427,000
Health - Other: $1,389,000
General Public Buildings: $449,000
Central Staff Services: $258,000
Judicial and Legal Services: $219,000
Financial Administration: $175,000
Police Protection: $57,000
Natural Resources - Other: $50,000
Parks and Recreation: $20,000
Elementary and Secondary Education: $13,000
Solid Waste Management: $7,000
Protective Inspection and Regulation - Other: $2,000
Public Welfare - Other: $1,000
- Federal Intergovernmental - Other: $8,817,000
Health and Hospitals: $353,000
- General - Interest on Debt: $183,000
- Intergovernmental to Local - Other - General - Other: $1,000
- Local Intergovernmental - Health and Hospitals: $356,000
Highways: $14,000
Other: $7,000
- Long Term Debt - Outstanding Unspecified Public Purpose: $9,926,000
Beginning Outstanding - Unspecified Public Purpose: $9,926,000
Beginning Outstanding - Public Debt for Private Purpose: $1,160,000
Outstanding Nonguaranteed - Industrial Revenue: $995,000
Retired Nonguaranteed - Public Debt for Private Purpose: $165,000
- Miscellaneous - General Revenue - Other: $669,000
Rents: $34,000
Sale of Property: $30,000
Interest Earnings: $7,000
- Other Capital Outlay - Health - Other: $304,000
Correctional Institutions: $213,000
Regular Highways: $99,000
General - Other: $30,000
Central Staff Services: $19,000
General Public Building: $11,000
- Other Funds - Cash and Securities: $3,785,000
- Sinking Funds - Cash and Securities: $995,000
- State Intergovernmental - Other: $2,711,000
Highways: $1,683,000
Health and Hospitals: $271,000
General Local Government Support: $121,000
- Tax - Individual Income: $1,319,000
Property: $978,000
Public Utilities Sales: $536,000
Corporation License: $94,000
Documentary and Stock Transfer: $90,000
Other Selective Sales: $56,000
Other License: $1,000
- Total Salaries and Wages: $5,923,000
Supplemental Security Income (SSI) in 2006:
- Total number of recipients: 1,343
- Number of aged recipients: 141
- Number of blind and disabled recipients: 1,202
- Number of recipients under 18: 163
- Number of recipients between 18 and 64: 881
- Number of recipients older than 64: 299
- Number of recipients also receiving OASDI: 568
- Amount of payments (thousands of dollars): 560
| Most common first names in Grayson County, KY among deceased individuals | ||
| Name | Count | Lived (average) |
|---|---|---|
| James | 178 | 69.0 years |
| Mary | 165 | 78.1 years |
| William | 148 | 73.8 years |
| Charles | 122 | 69.6 years |
| John | 104 | 76.1 years |
| Robert | 99 | 72.4 years |
| Ruby | 59 | 78.1 years |
| George | 55 | 76.8 years |
| Thomas | 45 | 72.6 years |
| Joseph | 45 | 73.6 years |
| Most common last names in Grayson County, KY among deceased individuals | ||
| Last name | Count | Lived (average) |
|---|---|---|
| Decker | 106 | 72.1 years |
| Woosley | 94 | 78.1 years |
| Miller | 90 | 74.5 years |
| Smith | 88 | 73.8 years |
| Embry | 80 | 75.6 years |
| Logsdon | 67 | 73.1 years |
| Williams | 65 | 77.6 years |
| Wilson | 64 | 77.1 years |
| Johnson | 63 | 75.0 years |
| Meredith | 62 | 77.3 years |
| Businesses in Grayson County, KY | ||||
| Name | Count | Name | Count | |
|---|---|---|---|---|
| AT&T | 1 | Nike | 1 | |
| Advance Auto Parts | 1 | Papa John's Pizza | 1 | |
| AutoZone | 1 | Pizza Hut | 1 | |
| Big O Tires | 1 | Rite Aid | 1 | |
| Dairy Queen | 1 | SONIC Drive-In | 1 | |
| FedEx | 1 | Subway | 1 | |
| H&R Block | 1 | U-Haul | 1 | |
| Hardee's | 1 | UPS | 1 | |
| KFC | 1 | Walmart | 1 | |
| Lane Furniture | 2 | Wendy's | 1 | |
| McDonald's | 2 | |||
Grayson County on our top lists:
- #84 on the list of "Top 101 counties with the lowest percentage of residents relocating to other counties in 2011"