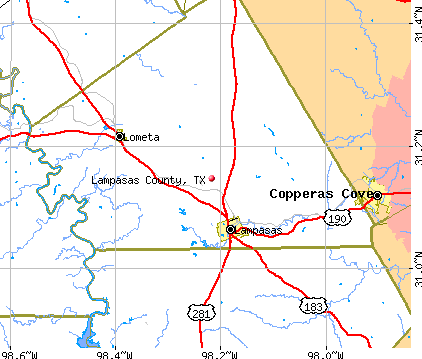
Lampasas County, Texas (TX)
County owner-occupied free and clear houses and condos in 2010: 2,387
County owner-occupied houses and condos in 2000: 4,851
Renter-occupied apartments: 1,914 (it was 1,703 in 2000)
| % of renters here: | 26% |
| State: | 36% |
Land area: 712 sq. mi.
Water area: 1.9 sq. mi.
Population density: 31 people per square mile (low).
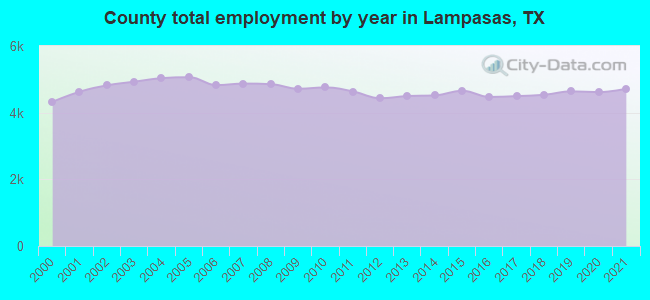
Industries providing employment: Educational, health and social services (18.4%), Retail trade (13.5%), Professional, scientific, management, administrative, and waste management services (11.8%), Arts, entertainment, recreation, accommodation and food services (11.4%), Construction (10.3%).
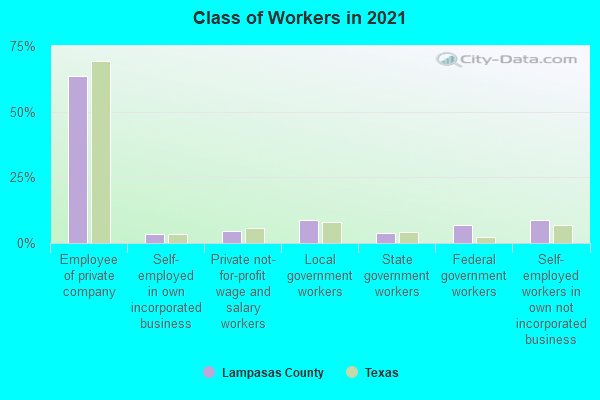
Type of workers:
- Private wage or salary: 70%
- Government: 21%
- Self-employed, not incorporated: 8%
- Unpaid family work: 0%
- OSM Map
- General Map
- Google Map
- MSN Map

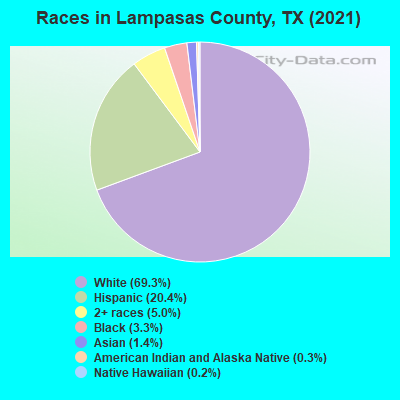
- 15,31069.0%White Non-Hispanic Alone
- 4,55320.5%Hispanic or Latino
- 1,0724.8%Two or more races
- 8884.0%Black Non-Hispanic Alone
- 2541.1%Asian alone
- 720.3%American Indian and Alaska Native alone
- 390.2%Some other race alone
| Median resident age: | 44.3 years |
| Texas median age: | 35.6 years |
| Males: 11,317 | |
| Females: 11,098 |

 | Looking to move to the country outside Austin, help? (27 replies) |
| Lampasas County Sheriff Abuse (1 reply) |
| Are Round Rock Police Out Of Control? (174 replies) |
| New County Population Estimates from the Census Bureau for Jluy 1, 2016 posted this morning about 9 A. M. (13 replies) |
| Water for Birds (17 replies) |
| Fun Friday Factoid (14 replies) |
| Lampasas County: | 2.0 people |
| Texas: | 3 people |
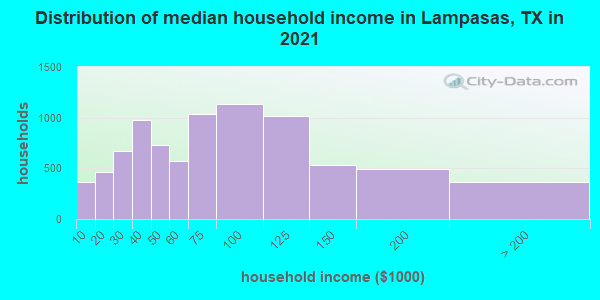
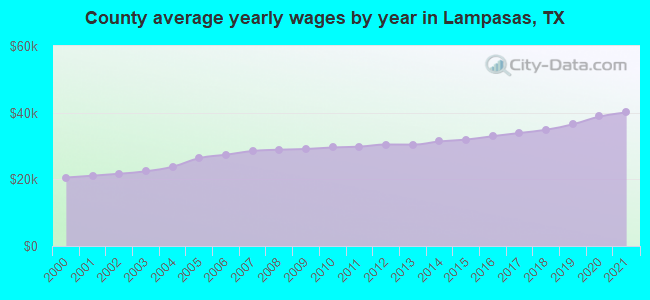
Estimated median household income in 2022: $72,515 ($36,176 in 1999)
| This county: | $72,515 |
| Texas: | $72,284 |
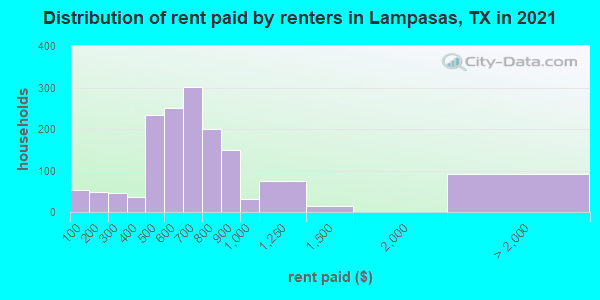
Median contract rent in 2022 for apartments: $663 (lower quartile is $507, upper quartile is $871)
| This county: | $663 |
| State: | $1117 |
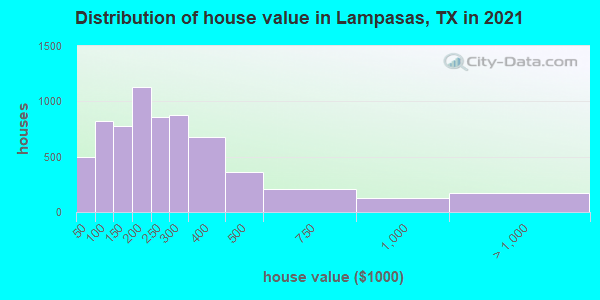
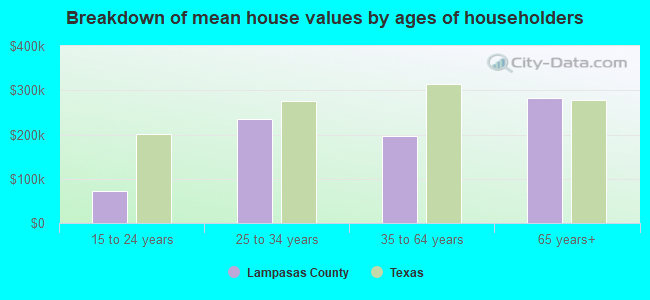
Estimated median house or condo value in 2022: $251,216 (it was $73,500 in 2000)
| Lampasas: | $251,216 |
| Texas: | $275,400 |
Median monthly housing costs for homes and condos with a mortgage: $1,576
Median monthly housing costs for units without a mortgage: $666
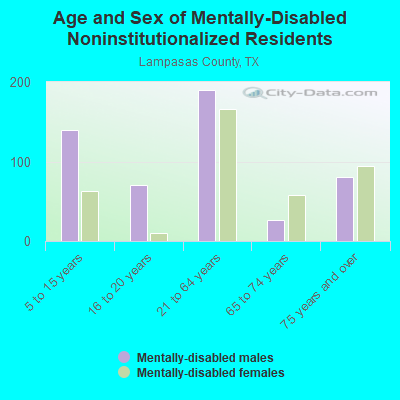
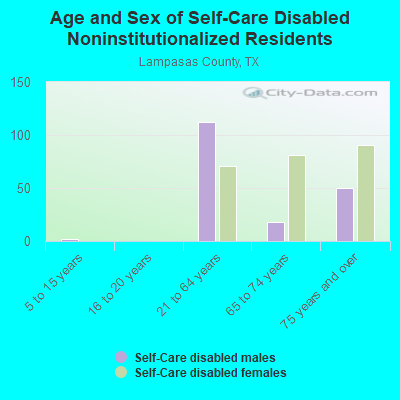
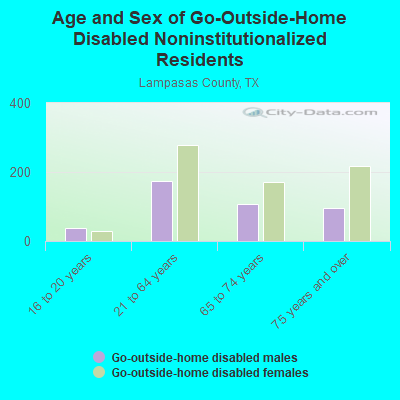
Institutionalized population: 207
Crime in 2021 (reported by the sheriff's office or county police, not the county total):
- Murders: 0
- Rapes: 1
- Robberies: 0
- Assaults: 17
- Burglaries: 16
- Thefts: 53
- Auto thefts: 12
Crime in 2020 (reported by the sheriff's office or county police, not the county total):
- Murders: 0
- Rapes: 1
- Robberies: 0
- Assaults: 11
- Burglaries: 42
- Thefts: 63
- Auto thefts: 9
Health of residents in Lampasas County based on CDC Behavioral Risk Factor Surveillance System Survey Questionnaires from 2013 to 2021:
General health status score of residents in this county from 1 (poor) to 5 (excellent) is 3.4. This is about average.73.3% of residents exercised in the past month. This is about average.
46.0% of residents smoked 100+ cigarettes in their lives. This is about average.
47.2% of adult residents drank alcohol in the past 30 days. This is less than average.
Average weight of males is 204 pounds. This is more than average.
Average weight of females is 174 pounds. This is more than average.
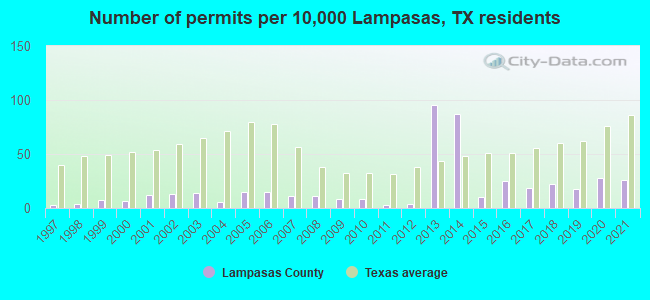
Single-family new house construction building permits:
- 2022: 36 buildings, average cost: $255,000
- 2021: 46 buildings, average cost: $273,200
- 2020: 49 buildings, average cost: $141,500
- 2019: 32 buildings, average cost: $157,500
- 2018: 40 buildings, average cost: $155,400
- 2017: 33 buildings, average cost: $149,400
- 2016: 45 buildings, average cost: $135,000
- 2015: 18 buildings, average cost: $98,600
- 2014: 155 buildings, average cost: $13,300
- 2013: 170 buildings, average cost: $9,900
- 2012: 6 buildings, average cost: $115,000
- 2011: 5 buildings, average cost: $115,000
- 2010: 14 buildings, average cost: $145,000
- 2009: 15 buildings, average cost: $143,500
- 2008: 19 buildings, average cost: $143,500
- 2007: 20 buildings, average cost: $127,600
- 2006: 27 buildings, average cost: $127,600
- 2005: 27 buildings, average cost: $127,600
- 2004: 10 buildings, average cost: $137,000
- 2003: 25 buildings, average cost: $111,100
- 2002: 23 buildings, average cost: $111,100
- 2001: 21 buildings, average cost: $111,100
- 2000: 12 buildings, average cost: $32,700
- 1999: 13 buildings, average cost: $32,700
- 1998: 6 buildings, average cost: $84,500
- 1997: 5 buildings, average cost: $80,000

Median real estate property taxes paid for housing units with mortgages in 2022: $3,193 (1.2%)
Median real estate property taxes paid for housing units with no mortgage in 2022: $2,592 (1.1%)
| Lampasas County: | 9.5% |
| Texas: | 14.0% |
Median age of residents in 2022: 44.3 years old
(Males: 43.8 years old, Females: 45.3 years old)
(Median age for: White residents: 47.4 years old, Black residents: 51.1 years old, American Indian residents: 50.2 years old, Asian residents: 53.1 years old, Hispanic or Latino residents: 34.6 years old, Other race residents: 40.1 years old)
Fair market rent in 2006 for a 1-bedroom apartment in Lampasas County is $401 a month.
Fair market rent for a 2-bedroom apartment is $484 a month.
Fair market rent for a 3-bedroom apartment is $706 a month.
Cities in this county include: Lampasas, Adamsville, Kempner, Lometa.
Neighboring counties: Escambia County, Alabama  , Dougherty County, Georgia , Crockett County
  , Glynn County, Georgia , Falls County , Reagan County .
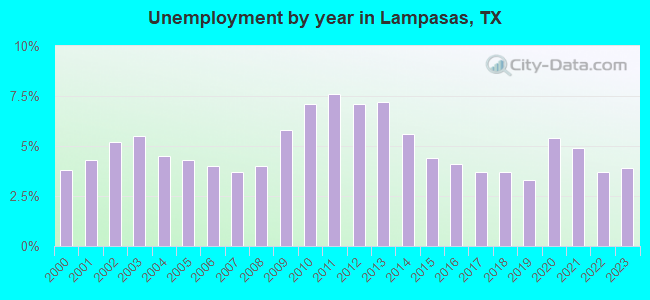
| Here: | 3.2% |
| Texas: | 3.5% |
Current college students: 605
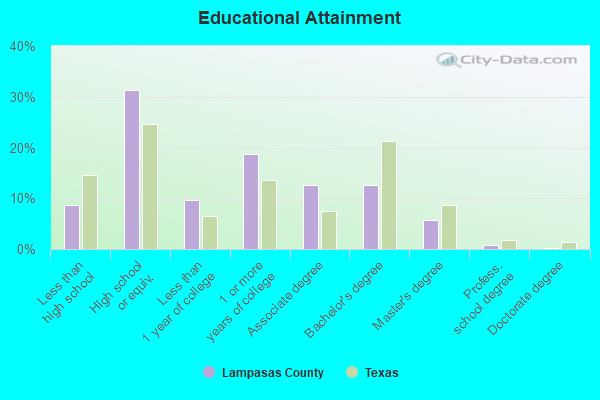
People 25 years of age or older with a high school degree or higher: 90.3%
People 25 years of age or older with a bachelor's degree or higher: 20.2%
Number of foreign born residents: 1,180 (54.7% naturalized citizens)
| Lampasas County: | 5.3% |
| Whole state: | 17.2% |
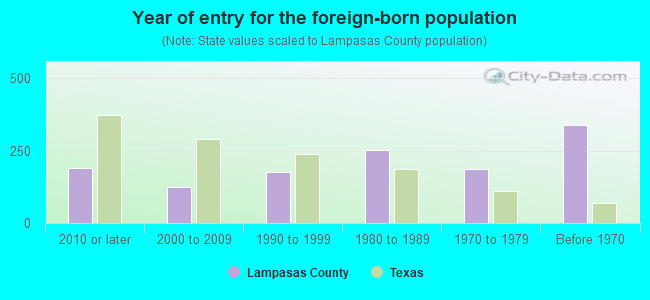
- Year of entry for the foreign-born population
- 1992010 or later
- 1962000 to 2009
- 1441990 to 1999
- 2531980 to 1989
- 1871970 to 1979
- 338Before 1970
Mean travel time to work (commute): minutes
Percentage of county residents living and working in this county: 98.7%
Housing units in structures:
- One, detached: 7,542
- One, attached: 37
- Two: 260
- 3 or 4: 223
- 5 to 9: 223
- 10 to 19: 16
- 20 to 49: 97
- 50 or more: 49
- Mobile homes: 1,513
- Boats, RVs, vans, etc.: 65
Housing units in Lampasas County with a mortgage: 3,696 (86 second mortgage, 0 home equity loan, 93 both second mortgage and home equity loan)
Houses without a mortgage: 221
| Here: | 1.3% with mortgage |
| State: | 98.4% with mortgage |
Religion statistics for Lampasas County
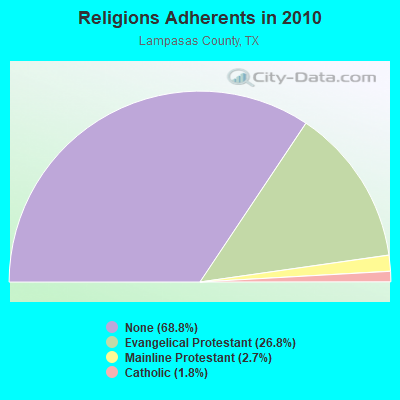
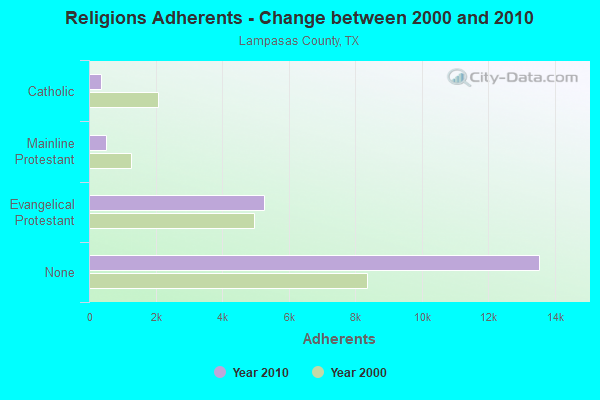
| Religion | Adherents | Congregations |
|---|---|---|
| Evangelical Protestant | 5,267 | 31 |
| Mainline Protestant | 522 | 6 |
| Catholic | 346 | 1 |
| Other | 6 | 1 |
| None | 13,536 | - |
Source: Clifford Grammich, Kirk Hadaway, Richard Houseal, Dale E.Jones, Alexei Krindatch, Richie Stanley and Richard H.Taylor. 2012. 2010 U.S.Religion Census: Religious Congregations & Membership Study. Association of Statisticians of American Religious Bodies. Jones, Dale E., et al. 2002. Congregations and Membership in the United States 2000. Nashville, TN: Glenmary Research Center.
Food Environment Statistics:
| Lampasas County: | 0.48 / 10,000 pop. |
| State: | 1.47 / 10,000 pop. |
| Lampasas County: | 3.83 / 10,000 pop. |
| Texas: | 3.95 / 10,000 pop. |
| This county: | 7.19 / 10,000 pop. |
| State: | 6.13 / 10,000 pop. |
| Lampasas County: | 8.7% |
| Texas: | 8.9% |
| Lampasas County: | 26.2% |
| State: | 26.6% |
| Here: | 11.6% |
| State: | 15.7% |
Agriculture in Lampasas County:
Average size of farms: 479 acresAverage value of agricultural products sold per farm: $15,534
Average value of crops sold per acre for harvested cropland: $65.19
The value of livestock, poultry, and their products as a percentage of the total market value of agricultural products sold: 89.89%
Average total farm production expenses per farm: $23,350
Harvested cropland as a percentage of land in farms: 5.03%
Irrigated harvested cropland as a percentage of land in farms: 2.07%
Average market value of all machinery and equipment per farm: $26,179
The percentage of farms operated by a family or individual: 93.73%
Average age of principal farm operators: 59 years
Average number of cattle and calves per 100 acres of all land in farms: 8.99
Milk cows as a percentage of all cattle and calves: 0.94%
All wheat for grain: 1746 harvested acres
Vegetables: 49 harvested acres
Land in orchards: 1,501 acres
Earthquake activity:
Lampasas County-area historical earthquake activity is significantly above Texas state average. It is 289% greater than the overall U.S. average.On 6/16/1978 at 11:46:54, a magnitude 5.3 (4.4 MB, 4.6 UK, 5.3 ML, Class: Moderate, Intensity: VI - VII) earthquake occurred 198.2 miles away from Lampasas County center
On 4/14/1995 at 00:32:56, a magnitude 5.7 (5.6 MB, 5.7 MS, 5.7 MW, Depth: 11.1 mi) earthquake occurred 312.0 miles away from the county center
On 11/6/2011 at 03:53:10, a magnitude 5.7 (5.7 MW, Depth: 3.2 mi) earthquake occurred 314.8 miles away from the county center
On 10/20/2011 at 12:24:41, a magnitude 4.8 (4.8 MW, Depth: 3.1 mi, Class: Light, Intensity: IV - V) earthquake occurred 157.9 miles away from the county center
On 9/3/2016 at 12:02:44, a magnitude 5.8 (5.8 MW, Depth: 3.5 mi) earthquake occurred 372.6 miles away from Lampasas County center
On 5/17/2012 at 08:12:00, a magnitude 4.8 (4.8 MW, Depth: 3.1 mi) earthquake occurred 233.2 miles away from the county center
Magnitude types: body-wave magnitude (MB), local magnitude (ML), surface-wave magnitude (MS), moment magnitude (MW)
Most recent natural disasters:
- Texas Covid-19 Pandemic, Incident Period: January 20, 2020, FEMA Id: 4485, Natural disaster type: Other
- Texas Wildfires, Incident Period: March 14, 2008 to September 01, 2008, Emergency Declared EM-3284: March 14, 2008, FEMA Id: 3284, Natural disaster type: Fire
- Texas Severe Storms, Tornadoes, and Flooding, Incident Period: June 16, 2007 to August 03, 2007, Major Disaster (Presidential) Declared DR-1709: June 29, 2007, FEMA Id: 1709, Natural disaster type: Storm, Tornado, Flood
- Texas Hurricane Rita, Incident Period: September 23, 2005 to October 14, 2005, Major Disaster (Presidential) Declared DR-1606: September 24, 2005, FEMA Id: 1606, Natural disaster type: Hurricane
- Texas Hurricane Rita, Incident Period: September 20, 2005 to October 14, 2005, Emergency Declared EM-3261: September 21, 2005, FEMA Id: 3261, Natural disaster type: Hurricane
- Texas Hurricane Katrina, Incident Period: August 29, 2005 to October 01, 2005, Emergency Declared EM-3216: September 02, 2005, FEMA Id: 3216, Natural disaster type: Hurricane
- Texas Mesquite Creek Fire, Incident Period: September 06, 2000 to September 08, 2000, Fire Management Assistance Declared: September 07, 2000, FEMA Id: 2333, Natural disaster type: Fire
- Texas Topeka Fire, Incident Period: August 26, 1999 to August 29, 1999, Fire Management Assistance Declared: August 26, 1999, FEMA Id: 2272, Natural disaster type: Fire
- Texas Extreme Fire Hazards, Incident Period: August 01, 1999 to December 10, 1999, Emergency Declared EM-3142: September 01, 1999, FEMA Id: 3142, Natural disaster type: Fire
- Texas Extreme Fire Hazard, Incident Period: August 30, 1993 to November 15, 1993, Emergency Declared EM-3113: September 10, 1993, FEMA Id: 3113, Natural disaster type: Fire
- 1 other natural disasters have been reported since 1953.
The number of natural disasters in Lampasas County (11) is smaller than the US average (15).
Major Disasters (Presidential) Declared: 3
Emergencies Declared: 5
Causes of natural disasters: Fires: 5, Hurricanes: 3, Storms: 2, Flood: 1, Tornado: 1, Other: 1 (Note: some incidents may be assigned to more than one category).
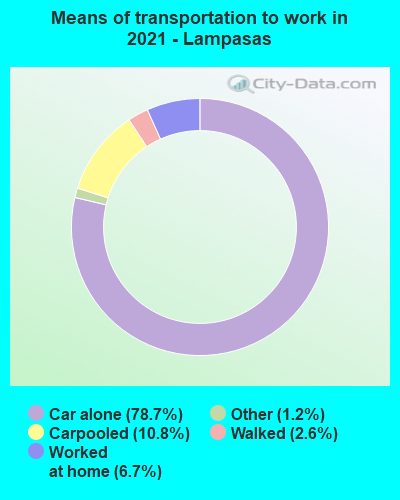
Means of transportation to work:
- Drove a car alone: 4,639 (73.6%)
- Carpooled: 622 (9.9%)
- Taxicab, motorcycle, or other means: 166 (2.6%)
- Walked: 116 (1.8%)
- Worked at home: 721 (11.4%)
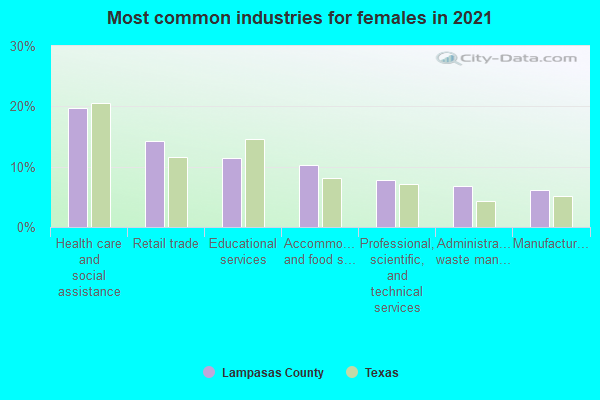
- Health care and social assistance (14%)
- Accommodation and food services (12%)
- Educational services (11%)
- Retail trade (10%)
- Professional, scientific, and technical services (7%)
- Administrative and support and waste management services (6%)
- Manufacturing (5%)
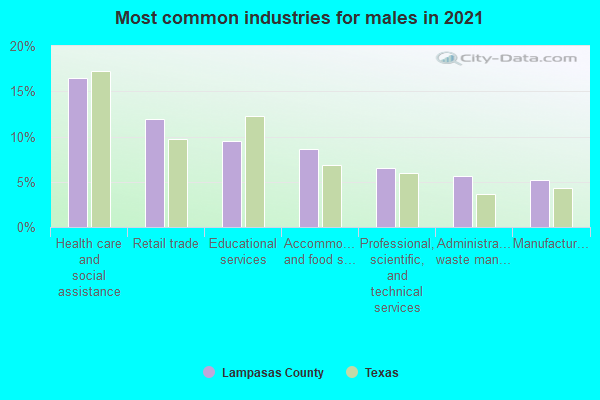
- Health care and social assistance (17%)
- Accommodation and food services (14%)
- Educational services (14%)
- Retail trade (12%)
- Professional, scientific, and technical services (8%)
- Administrative and support and waste management services (8%)
- Manufacturing (6%)
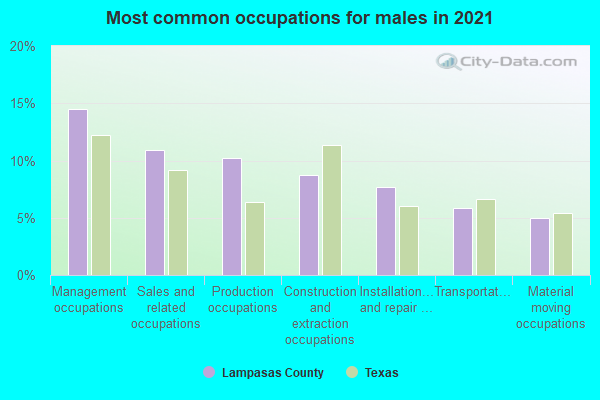
- Management occupations (15%)
- Sales and related occupations (10%)
- Production occupations (10%)
- Installation, maintenance, and repair occupations (9%)
- Construction and extraction occupations (9%)
- Computer and mathematical occupations (6%)
- Food preparation and serving related occupations (5%)
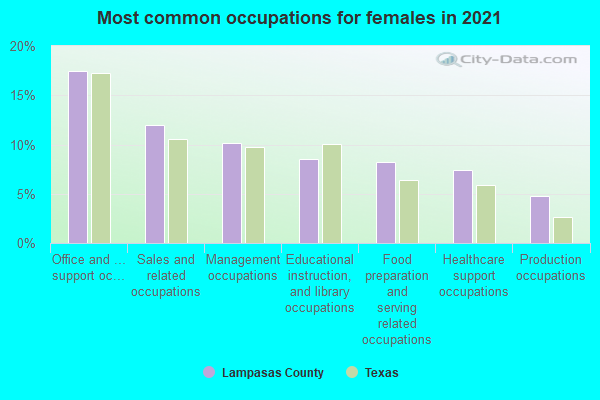
- Office and administrative support occupations (20%)
- Food preparation and serving related occupations (12%)
- Educational instruction, and library occupations (11%)
- Sales and related occupations (10%)
- Management occupations (8%)
- Healthcare support occupations (5%)
- Health technologists and technicians (5%)
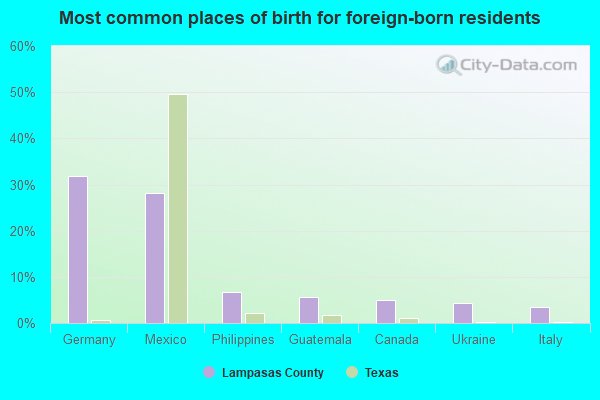
- Mexico (29%)
- Germany (27%)
- Guatemala (6%)
- Ukraine (5%)
- Canada (5%)
- Philippines (3%)
- France (3%)
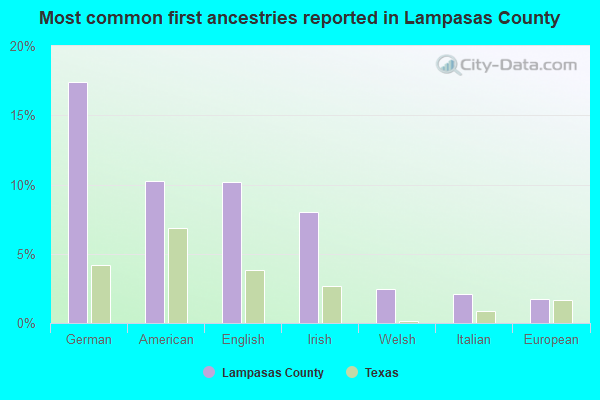
- German (16%)
- English (11%)
- American (10%)
- Irish (6%)
- European (3%)
- Italian (2%)
- Welsh (2%)

People in group quarters in Lampasas County, Texas in 2010:
- 153 people in nursing facilities/skilled-nursing facilities
- 28 people in residential treatment centers for juveniles (non-correctional)
- 26 people in local jails and other municipal confinement facilities
- 15 people in workers' group living quarters and job corps centers
People in group quarters in Lampasas County, Texas in 2000:
- 231 people in nursing homes
- 45 people in other noninstitutional group quarters
- 35 people in local jails and other confinement facilities (including police lockups)
- 25 people in homes for abused, dependent, and neglected children
- 20 people in other workers' dormitories
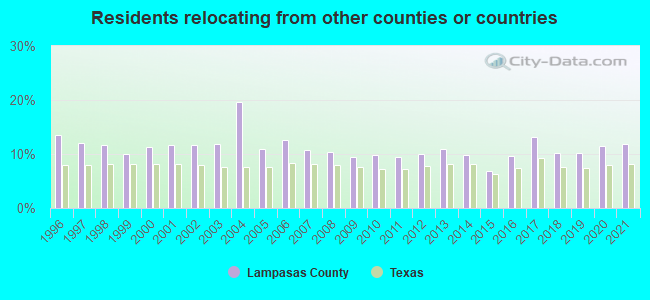
11.82% of this county's 2021 resident taxpayers lived in other counties in 2020 ($60,053 average adjusted gross income)
| Here: | 11.82% |
| Texas average: | 8.12% |
10 or fewer of this county's residents moved from foreign countries.
9.62% relocated from other counties in Texas ($49,523 average AGI)
2.21% relocated from other states ($10,529 average AGI)
Lampasas County: 2.21% Texas average: 2.83%
Top counties from which taxpayers relocated into this county between 2020 and 2021:
| from Coryell County, TX | |
| from Bell County, TX | |
| from Williamson County, TX | |
| from Travis County, TX | |
| from Burnet County, TX | |
| from Harris County, TX |
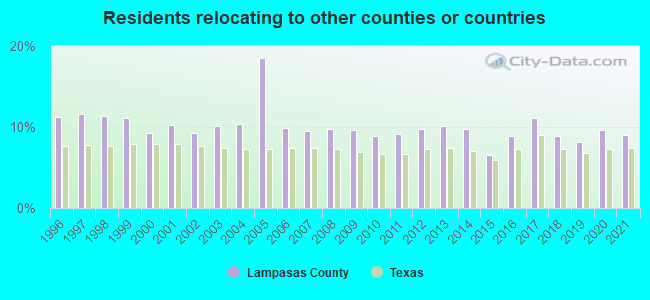
9.07% of this county's 2020 resident taxpayers moved to other counties in 2021 ($45,596 average adjusted gross income)
| Here: | 9.07% |
| Texas average: | 7.40% |
10 or fewer of this county's residents moved to foreign countries.
6.97% relocated to other counties in Texas ($34,918 average AGI)
2.10% relocated to other states ($10,678 average AGI)
Lampasas County: 2.10% Texas average: 2.08%
Top counties to which taxpayers relocated from this county between 2020 and 2021:
| to Coryell County, TX | |
| to Bell County, TX | |
| to Burnet County, TX | |
| to Williamson County, TX | |
| to Travis County, TX |
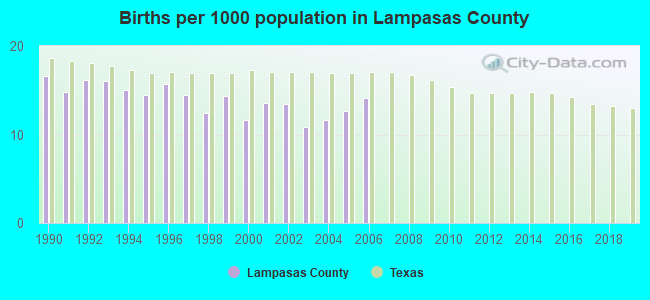
Births per 1000 population from 1990 to 1999: 15.0
Births per 1000 population from 2000 to 2006: 12.6
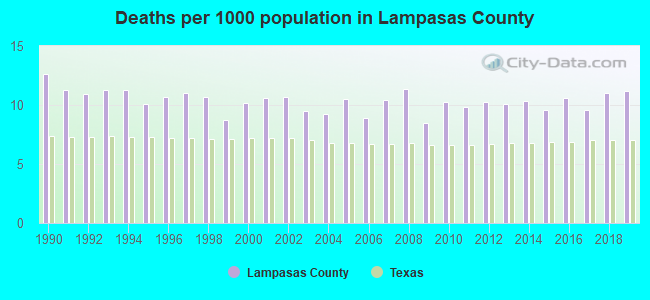
Deaths per 1000 population from 1990 to 1999: 10.9
Deaths per 1000 population from 2000 to 2009: 10.0
Deaths per 1000 population from 2010 to 2020: 10.5
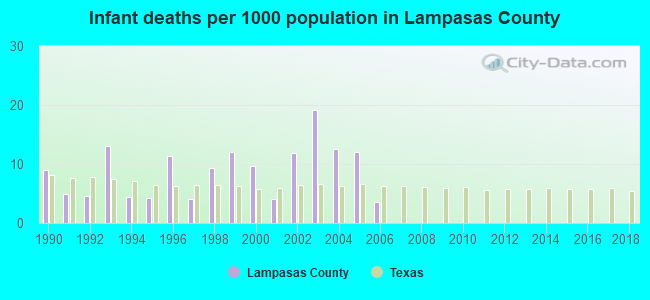
Infant deaths per 1000 live births from 1990 to 1999: 7.7
Infant deaths per 1000 live births from 2000 to 2006: 10.4
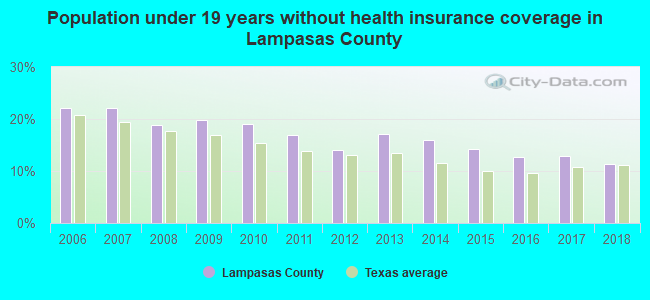
Persons under 19 years old without health insurance coverage in 2018: 11.3%
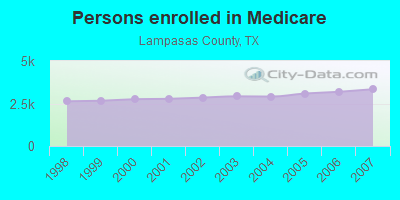
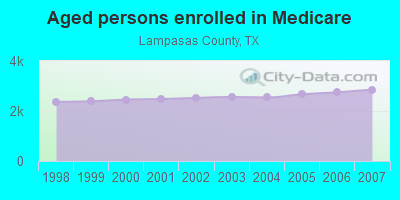
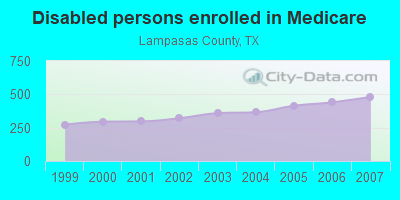
Persons enrolled in hospital insurance and/or supplemental medical insurance (Medicare) in July 1, 2007: 3,338 (2,857 aged, 481 disabled)
Children under 18 without health insurance coverage in 2007: 1,088 (21%)
Most common underlying causes of death in Lampasas County, Texas in 1999 - 2019:
- Bronchus or lung, unspecified - Malignant neoplasms (310)
- Acute myocardial infarction, unspecified (212)
- Atherosclerotic heart disease (206)
- Chronic obstructive pulmonary disease, unspecified (100)
- Alzheimer disease, unspecified (72)
- Congestive heart failure (24)
- Unspecified dementia (20)
- Other ill-defined and unspecified causes of mortality (19)
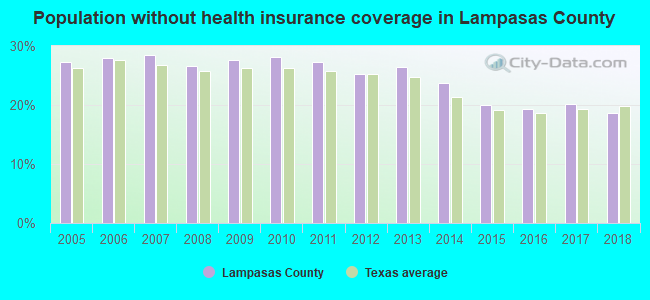
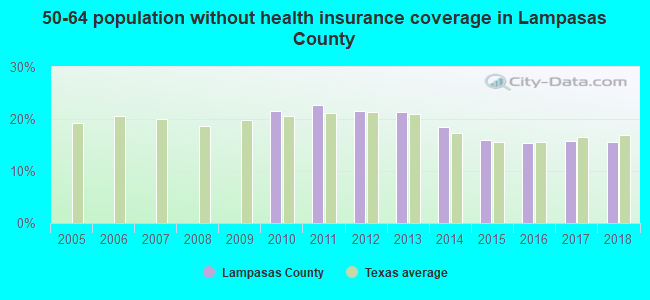
Population without health insurance coverage in 2000: 17%
Children under 18 without health insurance coverage in 2000: 16%
Short term general hospital admissions per 100,000 population in 2004: 5,208
Short term general hospital beds per 100,000 population in 2004: 121
Emergency room visits per 100,000 population in 2004: 30,790
General practice office based MDs per 100,000 population in 2005: 1,241
Medical specialist MDs per 100,000 population in 2005: 951
Dentists per 100,000 population in 1998: 15
Total births per 100,000 population, July 2005 - July 2006 : 17
Total deaths per 100,000 population, July 2005 - July 2006: 71
Limited-service eating places per 100,000 population in 2005 : 10
Household type by relationship:
Households: 22,415- Male householders: 4,424 (923 living alone), Female householders: 3,958 (961 living alone)
4,815 spouses (4,767 opposite-sex spouses), 516 unmarried partners, (516 opposite-sex unmarried partners), 6,159 children (5,539 natural, 156 adopted, 465 stepchildren), 817 grandchildren, 242 brothers or sisters, 232 parents, 2 foster children, 629 other relatives, 400 non-relatives
- In group quarters: 262
Size of family households: 2,723 2-persons, 1,483 3-persons, 931 4-persons, 654 5-persons, 122 6-persons, 99 7-or-more-persons.
Size of nonfamily households: 1,884 1-person, 483 2-persons, 11 3-persons.
2,956 married couples with children.
1,015 single-parent households (193 men, 822 women).
89.4% of residents of Lampasas speak English at home.
7.8% of residents speak Spanish at home (71% speak English very well, 19% speak English well, 6% speak English not well, 4% don't speak English at all).
2.5% of residents speak other Indo-European language at home (95% speak English very well, 5% speak English well).
0.7% of residents speak Asian or Pacific Island language at home (47% speak English very well, 31% speak English well, 22% speak English not well).
In fiscal year 2004:
Federal Government expenditure: $121,428,000 ($5,861 per capita)
Department of Defense expenditure: $22,777,000
Federal direct payments to individuals for retirement and disability: $78,680,000
Federal other direct payments to individuals: $25,952,000
Federal direct payments not to individuals: $154,000
Federal grants: $13,404,000
Federal procurement contracts: $619,000 ($22,000 Department of Defense)
Federal salaries and wages: $2,619,000 ($0,000 Department of Defense)
Federal Government direct loans: $239,000
Federal guaranteed/insured loans: $18,512,000
Federal Government insurance: $3,040,000
Population change from April 1, 2000 to July 1, 2005:
Births: 1,156| Here: | 59 per 1000 residents |
| State: | 85 per 1000 residents |
Deaths: 971
| Here: | 49 per 1000 residents |
| State: | 35 per 1000 residents |
Net international migration: +177
| Here: | +9 per 1000 residents |
| State: | +29 per 1000 residents |
Net internal migration: +1,580
| Here: | +80 per 1000 residents |
| State: | +10 per 1000 residents |
Total withdrawal of fresh water for public supply: 0.01 millions of gallons per day (all from ground)
| Here: | 6.3 |
| State: | 6.3 |
| Here: | 4.4 |
| State: | 4.0 |
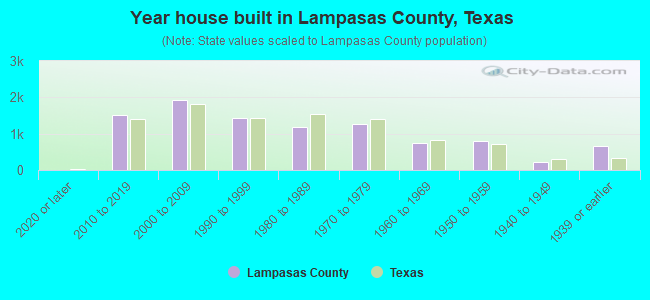
- Year house built in Lampasas County, Texas
- 952020 or later
- 1,4462010 to 2019
- 2,0882000 to 2009
- 1,2651990 to 1999
- 1,1641980 to 1989
- 1,2621970 to 1979
- 7531960 to 1969
- 7951950 to 1959
- 2311940 to 1949
- 6971939 or earlier
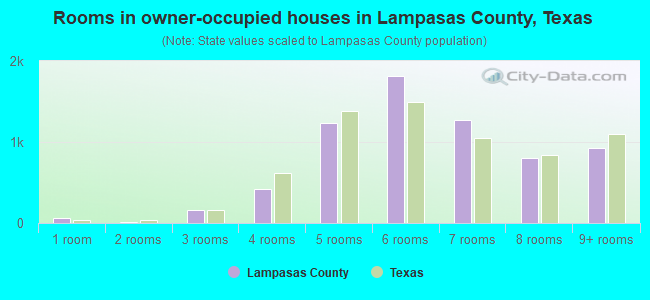
- Rooms in owner-occupied houses in Lampasas County, Texas
- 801 room
- 192 rooms
- 1083 rooms
- 4294 rooms
- 1,4125 rooms
- 1,5856 rooms
- 1,2227 rooms
- 8458 rooms
- 1,0439+ rooms
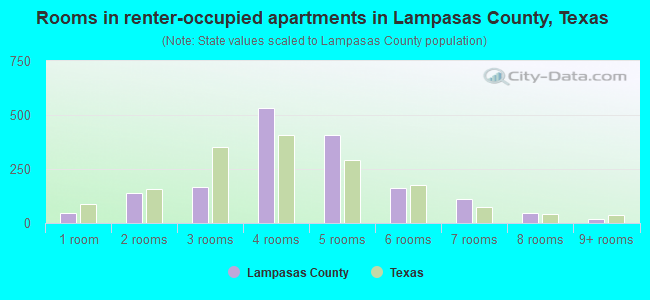
- Rooms in renter-occupied apartments in Lampasas County, Texas
- 381 room
- 992 rooms
- 2443 rooms
- 4404 rooms
- 3295 rooms
- 2096 rooms
- 1367 rooms
- 898 rooms
- 249+ rooms
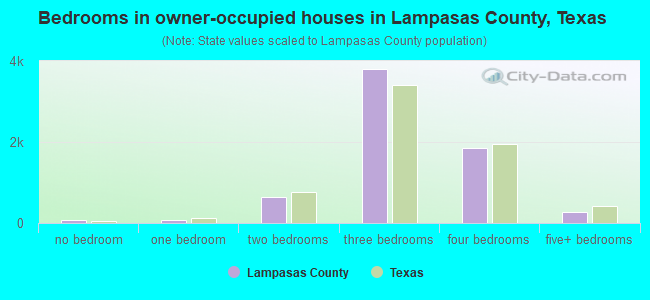
- Bedrooms in owner-occupied houses in Lampasas County, Texas
- 89no bedroom
- 551 bedroom
- 5962 bedrooms
- 3,9013 bedrooms
- 1,7134 bedrooms
- 4085+ bedrooms
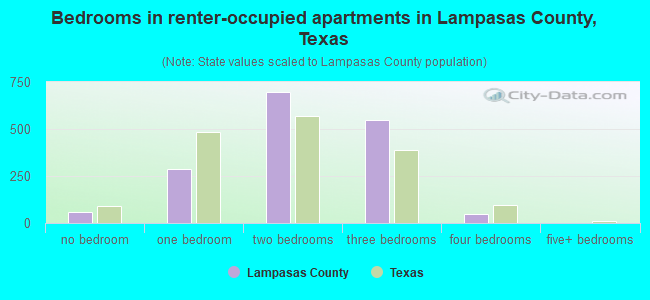
- Bedrooms in renter-occupied apartments in Lampasas County, Texas
- 39no bedroom
- 2851 bedroom
- 6842 bedrooms
- 4683 bedrooms
- 1374 bedrooms
- 05+ bedrooms
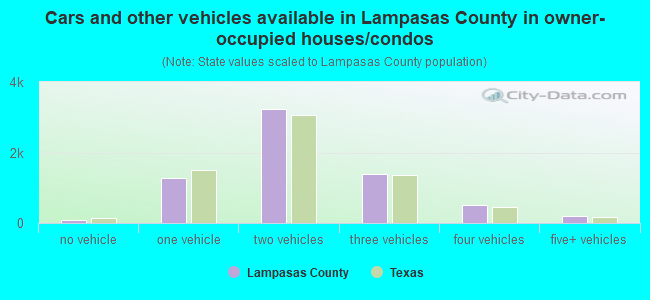
- Cars and other vehicles available in Lampasas County in owner-occupied houses/condos
- 80no vehicle
- 1,1991 vehicle
- 3,0752 vehicles
- 1,4983 vehicles
- 6224 vehicles
- 2675+ vehicles
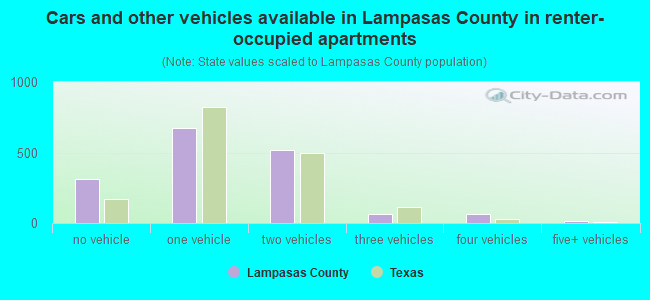
- Cars and other vehicles available in Lampasas County in renter-occupied apartments
- 301no vehicle
- 6881 vehicle
- 4842 vehicles
- 603 vehicles
- 1004 vehicles
- 05+ vehicles
91.3% of Lampasas County residents lived in the same house 1 years ago.
Out of people who lived in different houses, 24% lived in this county.
Out of people who lived in different counties, 75% lived in Texas.
| Lampasas County: | 91.3% |
| State average: | 85.7% |
Place of birth for U.S.-born residents:
- This state: 12,800
- Other state: 7,708
- Northeast: 928
- Midwest: 1,807
- South: 2,713
- West: 2,266
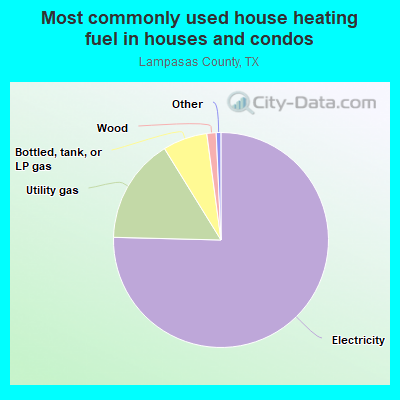
- 75.3%Electricity
- 13.9%Utility gas
- 8.2%Bottled, tank, or LP gas
- 1.4%Wood
- 0.6%Fuel oil, kerosene, etc.
- 0.2%No fuel used
- 0.2%Solar energy
- 0.1%Other fuel
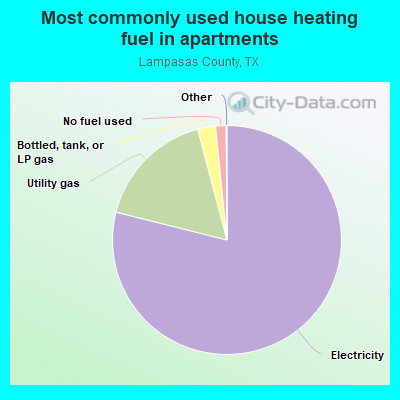
- 81.1%Electricity
- 16.8%Utility gas
- 1.1%Bottled, tank, or LP gas
- 1.0%No fuel used
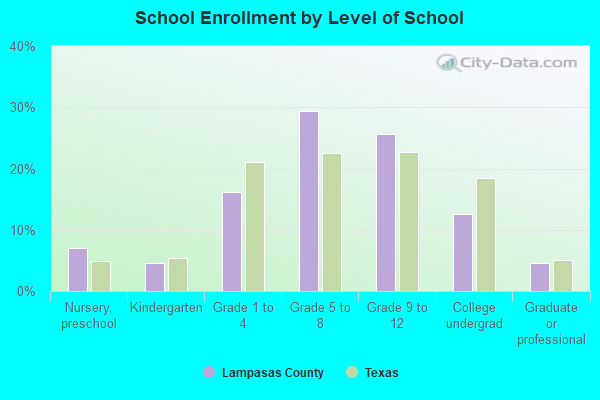
Private vs. public school enrollment:
| Here: | 6.2% |
| Texas: | 8.8% |
| Here: | 5.0% |
| Texas: | 8.0% |
| Here: | 17.8% |
| Texas: | 16.2% |

Lampasas County government finances - Expenditure in 2020:
- Charges - Other: $719,000
Other: $98,000
- Construction - General Public Buildings: $96,000
- Current Operations - Police Protection: $4,193,000
Central Staff Services: $2,995,000
Police Protection: $2,066,000
Regular Highways: $2,015,000
Regular Highways: $1,639,000
Correctional Institutions: $1,383,000
Financial Administration: $1,188,000
Central Staff Services: $1,052,000
Financial Administration: $872,000
Judicial and Legal Services: $852,000
Corrections - Other: $851,000
Judicial and Legal Services: $770,000
Local Fire Protection: $357,000
General - Other: $270,000
General Public Buildings: $268,000
Public Welfare, Vendor Payments for Medical Care: $194,000
Natural Resources - Other: $179,000
Local Fire Protection: $179,000
General - Other: $175,000
Public Welfare, Vendor Payments for Medical Care: $69,000
Public Welfare - Other: $28,000
Natural Resources - Other: $12,000
- General - Interest on Debt: $866,000
Interest on Debt: $237,000
- Intergovernmental to Local - Other - Correctional Institutions: $157,000
Other - General - Other: $61,000
- Local Intergovernmental - Other: $235,000
Other: $75,000
- Long Term Debt - Beginning Outstanding - Unspecified Public Purpose: $19,320,000
Outstanding Unspecified Public Purpose: $18,655,000
Outstanding Unspecified Public Purpose: $6,685,000
Beginning Outstanding - Unspecified Public Purpose: $6,685,000
Retired Unspecified Public Purpose: $665,000
- Miscellaneous - Fines and Forfeits: $255,000
Fines and Forfeits: $43,000
General Revenue - Other: $32,000
Interest Earnings: $31,000
General Revenue - Other: $16,000
Sale of Property: $15,000
Interest Earnings: $9,000
Donations From Private Sources: $8,000
- Other Capital Outlay - Police Protection: $624,000
Regular Highways: $231,000
Police Protection: $162,000
Local Fire Protection: $57,000
Correctional Institutions: $22,000
Judicial and Legal Services: $8,000
- Other Funds - Cash and Securities: $5,196,000
Cash and Securities: $1,129,000
- State Intergovernmental - Other: $205,000
General Local Government Support: $33,000
Highways: $23,000
- Tax - Property: $8,089,000
Property: $7,984,000
General Sales and Gross Receipts: $1,165,000
Motor Vehicle License: $931,000
Other License: $715,000
Motor Vehicle License: $662,000
Other License: $424,000
Other Selective Sales: $124,000
Alcoholic Beverage License: $23,000
Alcoholic Beverage License: $2,000
- Total Salaries and Wages: $3,376,000
: $3,042,000
Lampasas County government finances - Revenue in 2020:
- Charges - Other: $719,000
Other: $98,000
- Construction - General Public Buildings: $96,000
- Current Operations - Police Protection: $4,193,000
Central Staff Services: $2,995,000
Police Protection: $2,066,000
Regular Highways: $2,015,000
Regular Highways: $1,639,000
Correctional Institutions: $1,383,000
Financial Administration: $1,188,000
Central Staff Services: $1,052,000
Financial Administration: $872,000
Judicial and Legal Services: $852,000
Corrections - Other: $851,000
Judicial and Legal Services: $770,000
Local Fire Protection: $357,000
General - Other: $270,000
General Public Buildings: $268,000
Public Welfare, Vendor Payments for Medical Care: $194,000
Natural Resources - Other: $179,000
Local Fire Protection: $179,000
General - Other: $175,000
Public Welfare, Vendor Payments for Medical Care: $69,000
Public Welfare - Other: $28,000
Natural Resources - Other: $12,000
- General - Interest on Debt: $866,000
Interest on Debt: $237,000
- Intergovernmental to Local - Other - Correctional Institutions: $157,000
Other - General - Other: $61,000
- Local Intergovernmental - Other: $235,000
Other: $75,000
- Long Term Debt - Beginning Outstanding - Unspecified Public Purpose: $19,320,000
Outstanding Unspecified Public Purpose: $18,655,000
Outstanding Unspecified Public Purpose: $6,685,000
Beginning Outstanding - Unspecified Public Purpose: $6,685,000
Retired Unspecified Public Purpose: $665,000
- Miscellaneous - Fines and Forfeits: $255,000
Fines and Forfeits: $43,000
General Revenue - Other: $32,000
Interest Earnings: $31,000
General Revenue - Other: $16,000
Sale of Property: $15,000
Interest Earnings: $9,000
Donations From Private Sources: $8,000
- Other Capital Outlay - Police Protection: $624,000
Regular Highways: $231,000
Police Protection: $162,000
Local Fire Protection: $57,000
Correctional Institutions: $22,000
Judicial and Legal Services: $8,000
- Other Funds - Cash and Securities: $5,196,000
Cash and Securities: $1,129,000
- State Intergovernmental - Other: $205,000
General Local Government Support: $33,000
Highways: $23,000
- Tax - Property: $8,089,000
Property: $7,984,000
General Sales and Gross Receipts: $1,165,000
Motor Vehicle License: $931,000
Other License: $715,000
Motor Vehicle License: $662,000
Other License: $424,000
Other Selective Sales: $124,000
Alcoholic Beverage License: $23,000
Alcoholic Beverage License: $2,000
- Total Salaries and Wages: $3,376,000
: $3,042,000
Lampasas County government finances - Debt in 2020:
- Charges - Other: $719,000
Other: $98,000
- Construction - General Public Buildings: $96,000
- Current Operations - Police Protection: $4,193,000
Central Staff Services: $2,995,000
Police Protection: $2,066,000
Regular Highways: $2,015,000
Regular Highways: $1,639,000
Correctional Institutions: $1,383,000
Financial Administration: $1,188,000
Central Staff Services: $1,052,000
Financial Administration: $872,000
Judicial and Legal Services: $852,000
Corrections - Other: $851,000
Judicial and Legal Services: $770,000
Local Fire Protection: $357,000
General - Other: $270,000
General Public Buildings: $268,000
Public Welfare, Vendor Payments for Medical Care: $194,000
Natural Resources - Other: $179,000
Local Fire Protection: $179,000
General - Other: $175,000
Public Welfare, Vendor Payments for Medical Care: $69,000
Public Welfare - Other: $28,000
Natural Resources - Other: $12,000
- General - Interest on Debt: $866,000
Interest on Debt: $237,000
- Intergovernmental to Local - Other - Correctional Institutions: $157,000
Other - General - Other: $61,000
- Local Intergovernmental - Other: $235,000
Other: $75,000
- Long Term Debt - Beginning Outstanding - Unspecified Public Purpose: $19,320,000
Outstanding Unspecified Public Purpose: $18,655,000
Outstanding Unspecified Public Purpose: $6,685,000
Beginning Outstanding - Unspecified Public Purpose: $6,685,000
Retired Unspecified Public Purpose: $665,000
- Miscellaneous - Fines and Forfeits: $255,000
Fines and Forfeits: $43,000
General Revenue - Other: $32,000
Interest Earnings: $31,000
General Revenue - Other: $16,000
Sale of Property: $15,000
Interest Earnings: $9,000
Donations From Private Sources: $8,000
- Other Capital Outlay - Police Protection: $624,000
Regular Highways: $231,000
Police Protection: $162,000
Local Fire Protection: $57,000
Correctional Institutions: $22,000
Judicial and Legal Services: $8,000
- Other Funds - Cash and Securities: $5,196,000
Cash and Securities: $1,129,000
- State Intergovernmental - Other: $205,000
General Local Government Support: $33,000
Highways: $23,000
- Tax - Property: $8,089,000
Property: $7,984,000
General Sales and Gross Receipts: $1,165,000
Motor Vehicle License: $931,000
Other License: $715,000
Motor Vehicle License: $662,000
Other License: $424,000
Other Selective Sales: $124,000
Alcoholic Beverage License: $23,000
Alcoholic Beverage License: $2,000
- Total Salaries and Wages: $3,376,000
: $3,042,000
Lampasas County government finances - Cash and Securities in 2020:
- Charges - Other: $719,000
Other: $98,000
- Construction - General Public Buildings: $96,000
- Current Operations - Police Protection: $4,193,000
Central Staff Services: $2,995,000
Police Protection: $2,066,000
Regular Highways: $2,015,000
Regular Highways: $1,639,000
Correctional Institutions: $1,383,000
Financial Administration: $1,188,000
Central Staff Services: $1,052,000
Financial Administration: $872,000
Judicial and Legal Services: $852,000
Corrections - Other: $851,000
Judicial and Legal Services: $770,000
Local Fire Protection: $357,000
General - Other: $270,000
General Public Buildings: $268,000
Public Welfare, Vendor Payments for Medical Care: $194,000
Natural Resources - Other: $179,000
Local Fire Protection: $179,000
General - Other: $175,000
Public Welfare, Vendor Payments for Medical Care: $69,000
Public Welfare - Other: $28,000
Natural Resources - Other: $12,000
- General - Interest on Debt: $866,000
Interest on Debt: $237,000
- Intergovernmental to Local - Other - Correctional Institutions: $157,000
Other - General - Other: $61,000
- Local Intergovernmental - Other: $235,000
Other: $75,000
- Long Term Debt - Beginning Outstanding - Unspecified Public Purpose: $19,320,000
Outstanding Unspecified Public Purpose: $18,655,000
Outstanding Unspecified Public Purpose: $6,685,000
Beginning Outstanding - Unspecified Public Purpose: $6,685,000
Retired Unspecified Public Purpose: $665,000
- Miscellaneous - Fines and Forfeits: $255,000
Fines and Forfeits: $43,000
General Revenue - Other: $32,000
Interest Earnings: $31,000
General Revenue - Other: $16,000
Sale of Property: $15,000
Interest Earnings: $9,000
Donations From Private Sources: $8,000
- Other Capital Outlay - Police Protection: $624,000
Regular Highways: $231,000
Police Protection: $162,000
Local Fire Protection: $57,000
Correctional Institutions: $22,000
Judicial and Legal Services: $8,000
- Other Funds - Cash and Securities: $5,196,000
Cash and Securities: $1,129,000
- State Intergovernmental - Other: $205,000
General Local Government Support: $33,000
Highways: $23,000
- Tax - Property: $8,089,000
Property: $7,984,000
General Sales and Gross Receipts: $1,165,000
Motor Vehicle License: $931,000
Other License: $715,000
Motor Vehicle License: $662,000
Other License: $424,000
Other Selective Sales: $124,000
Alcoholic Beverage License: $23,000
Alcoholic Beverage License: $2,000
- Total Salaries and Wages: $3,376,000
: $3,042,000
Supplemental Security Income (SSI) in 2006:
- Total number of recipients: 422
- Number of aged recipients: 61
- Number of blind and disabled recipients: 361
- Number of recipients under 18: 73
- Number of recipients between 18 and 64: 248
- Number of recipients older than 64: 101
- Number of recipients also receiving OASDI: 177
- Amount of payments (thousands of dollars): 161
| Most common first names in Lampasas County, TX among deceased individuals | ||
| Name | Count | Lived (average) |
|---|---|---|
| John | 119 | 76.2 years |
| William | 119 | 75.2 years |
| Mary | 105 | 82.3 years |
| James | 104 | 73.7 years |
| Robert | 83 | 73.6 years |
| Charles | 55 | 71.5 years |
| Joe | 43 | 77.3 years |
| George | 42 | 75.2 years |
| Thomas | 41 | 72.4 years |
| Willie | 35 | 79.2 years |
| Most common last names in Lampasas County, TX among deceased individuals | ||
| Last name | Count | Lived (average) |
|---|---|---|
| Smith | 96 | 78.5 years |
| Jones | 58 | 78.3 years |
| Brown | 43 | 78.9 years |
| Martin | 34 | 80.4 years |
| Williams | 33 | 75.8 years |
| Davis | 32 | 78.5 years |
| Johnson | 29 | 73.6 years |
| Cox | 27 | 75.1 years |
| Moore | 25 | 77.4 years |
| Roberts | 24 | 73.8 years |
| Businesses in Lampasas County, TX | ||||
| Name | Count | Name | Count | |
|---|---|---|---|---|
| AT&T | 2 | McDonald's | 1 | |
| Ace Hardware | 1 | Nike | 1 | |
| AutoZone | 1 | Pizza Hut | 1 | |
| Chevrolet | 1 | SONIC Drive-In | 1 | |
| Curves | 1 | Subway | 1 | |
| Dairy Queen | 1 | T-Mobile | 1 | |
| FedEx | 3 | Taco Bell | 1 | |
| Ford | 1 | U-Haul | 2 | |
| H&R Block | 1 | UPS | 2 | |
| Holiday Inn | 1 | Walmart | 1 | |
| Little Caesars Pizza | 1 | |||
Lampasas County on our top lists:
- #10 on the list of "Top 101 counties with the lowest total withdrawal of fresh water for public supply"
- #33 on the list of "Top 101 counties with the lowest ground withdrawal of fresh water for public supply"