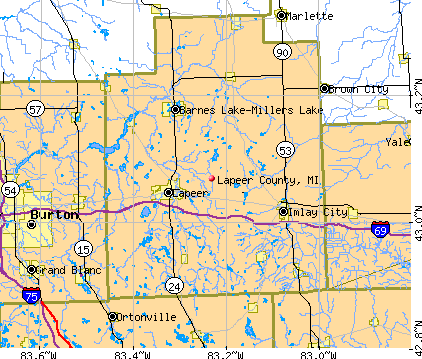
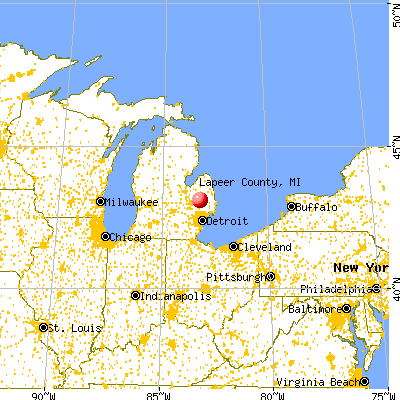
Lapeer County, Michigan (MI)
County owner-occupied free and clear houses and condos in 2010: 7,757
County owner-occupied houses and condos in 2000: 26,132
Renter-occupied apartments: 5,395 (it was 4,597 in 2000)
| % of renters here: | 15% |
| State: | 28% |
Land area: 654 sq. mi.
Water area: 8.9 sq. mi.
Population density: 136 people per square mile (average).
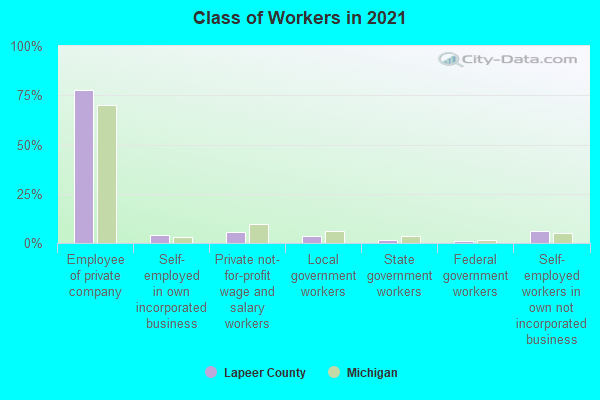
Industries providing employment: Manufacturing (24.0%), Educational, health and social services (18.6%), Construction (11.0%), Retail trade (10.6%).
Type of workers:
- Private wage or salary: 84%
- Government: 9%
- Self-employed, not incorporated: 7%
- Unpaid family work: 0%
- OSM Map
- General Map
- Google Map
- MSN Map

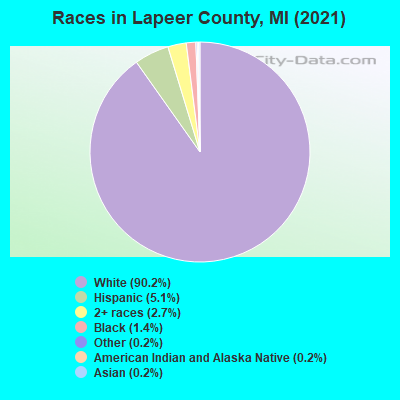
- 78,96588.9%White Non-Hispanic Alone
- 4,6385.2%Hispanic or Latino
- 3,5914.0%Two or more races
- 6200.7%Some other race alone
- 5700.6%Black Non-Hispanic Alone
- 3350.4%Asian alone
- 610.07%American Indian and Alaska Native alone
| Median resident age: | 44.6 years |
| Michigan median age: | 40.3 years |
| Males: 45,949 | |
| Females: 42,831 |

 | Needing information on Dryden, Lapeer and Almont areas. (0 replies) |
| Forbes just named GR #1 place to invest in house (50 replies) |
| Why is Lapeer so run down? Any chance Lapeer-Metamora see a housing boom? (17 replies) |
| Saginaw and Flint - why less white flight then Detroit? (34 replies) |
| Campsite right on a lake? (15 replies) |
| Considering a move to Lapeer... (15 replies) |
| Lapeer County: | 2.0 people |
| Michigan: | 2 people |
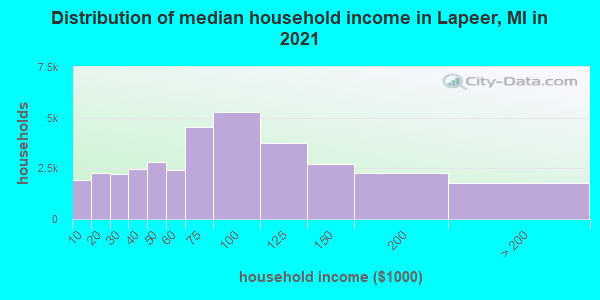
Estimated median household income in 2022: $71,551 ($51,717 in 1999)
| This county: | $71,551 |
| Michigan: | $66,986 |
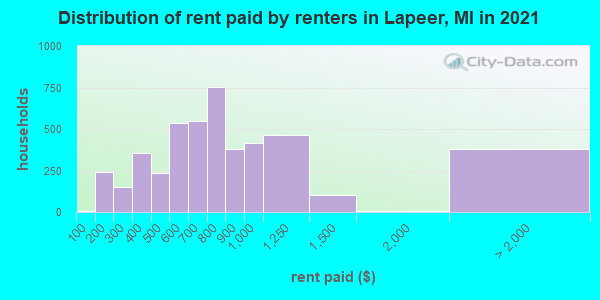
Median contract rent in 2022 for apartments: $808 (lower quartile is $606, upper quartile is $1,082)
| This county: | $808 |
| State: | $865 |
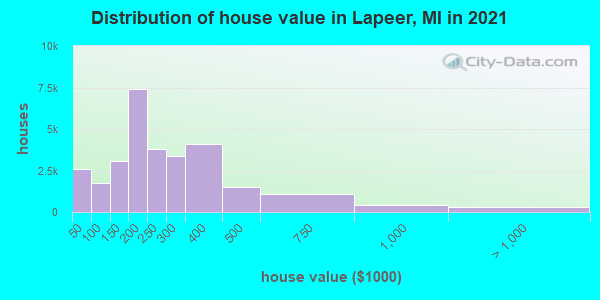
Estimated median house or condo value in 2022: $237,900 (it was $139,400 in 2000)
| Lapeer: | $237,900 |
| Michigan: | $224,400 |
Median monthly housing costs for homes and condos with a mortgage: $1,429
Median monthly housing costs for units without a mortgage: $518
Institutionalized population: 1,356
Crime in 2021 (reported by the sheriff's office or county police, not the county total):
- Murders: 0
- Rapes: 27
- Robberies: 0
- Assaults: 27
- Burglaries: 37
- Thefts: 100
- Auto thefts: 15
Crime in 2020 (reported by the sheriff's office or county police, not the county total):
- Murders: 0
- Rapes: 21
- Robberies: 0
- Assaults: 36
- Burglaries: 57
- Thefts: 91
- Auto thefts: 18
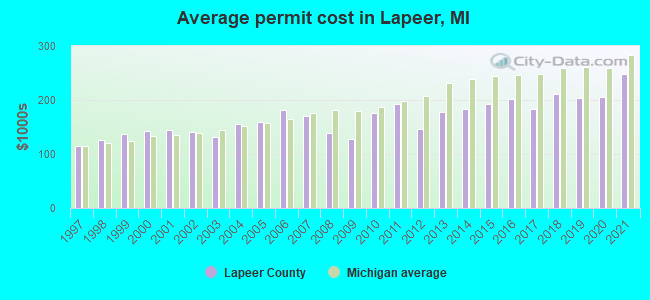
Single-family new house construction building permits:
- 2022: 198 buildings, average cost: $279,300
- 2021: 248 buildings, average cost: $249,100
- 2020: 198 buildings, average cost: $204,700
- 2019: 156 buildings, average cost: $203,000
- 2018: 149 buildings, average cost: $211,900
- 2017: 157 buildings, average cost: $183,900
- 2016: 139 buildings, average cost: $201,700
- 2015: 115 buildings, average cost: $191,500
- 2014: 116 buildings, average cost: $184,200
- 2013: 92 buildings, average cost: $177,900
- 2012: 29 buildings, average cost: $146,900
- 2011: 34 buildings, average cost: $192,500
- 2010: 22 buildings, average cost: $176,200
- 2009: 32 buildings, average cost: $126,500
- 2008: 53 buildings, average cost: $138,800
- 2007: 99 buildings, average cost: $170,000
- 2006: 222 buildings, average cost: $181,400
- 2005: 502 buildings, average cost: $158,800
- 2004: 569 buildings, average cost: $155,400
- 2003: 489 buildings, average cost: $131,500
- 2002: 493 buildings, average cost: $141,400
- 2001: 461 buildings, average cost: $143,800
- 2000: 566 buildings, average cost: $143,200
- 1999: 575 buildings, average cost: $137,300
- 1998: 603 buildings, average cost: $125,600
- 1997: 556 buildings, average cost: $114,000

Median real estate property taxes paid for housing units with mortgages in 2022: $2,124 (0.9%)
Median real estate property taxes paid for housing units with no mortgage in 2022: $1,883 (0.8%)
| Lapeer County: | 10.6% |
| Michigan: | 13.4% |
Median age of residents in 2022: 44.6 years old
(Males: 43.0 years old, Females: 46.5 years old)
(Median age for: White residents: 46.7 years old, Black residents: 38.5 years old, Asian residents: 44.0 years old, Hispanic or Latino residents: 30.5 years old, Other race residents: 36.1 years old)
Area name: Detroit-Warren-Livonia, MI HUD Metro FMR Area
Fair market rent in 2006 for a 1-bedroom apartment in Lapeer County is $644 a month.
Fair market rent for a 2-bedroom apartment is $770 a month.
Fair market rent for a 3-bedroom apartment is $921 a month.
Cities in this county include: Lapeer, Imlay City, Almont, Barnes Lake-Millers Lake, North Branch, Attica, Dryden, Columbiaville, Metamora, Otter Lake.
Neighboring counties: Dodge County, Wisconsin  , Platte County, Wyoming , Gratiot County , Kewaunee County, Wisconsin
  , Henry County, Illinois
  , Seneca County, New York
  , Tioga County, Pennsylvania
  , Thurston County, Nebraska .
| Here: | 4.2% |
| Michigan: | 3.5% |
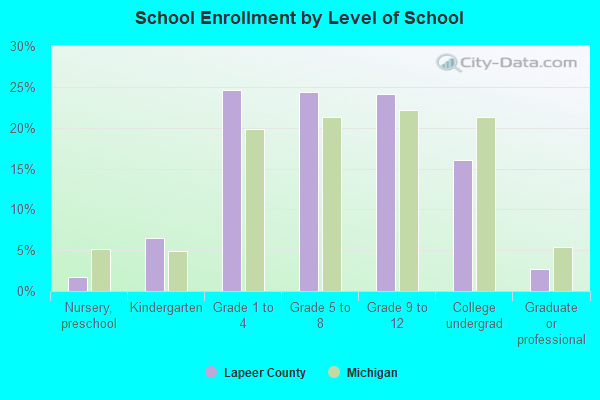
Current college students: 3,526
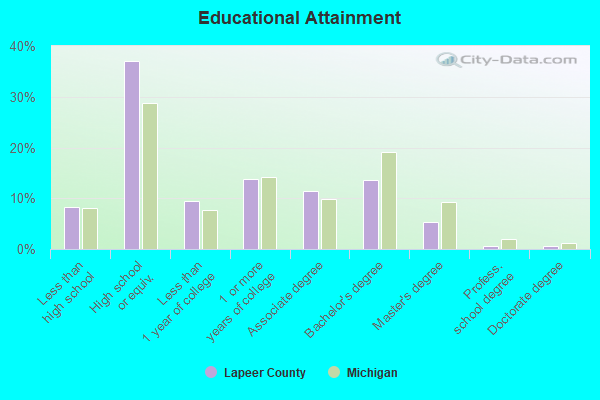
People 25 years of age or older with a high school degree or higher: 93.9%
People 25 years of age or older with a bachelor's degree or higher: 20.5%
Number of foreign born residents: 1,247 (45.0% naturalized citizens)
| Lapeer County: | 1.4% |
| Whole state: | 6.9% |
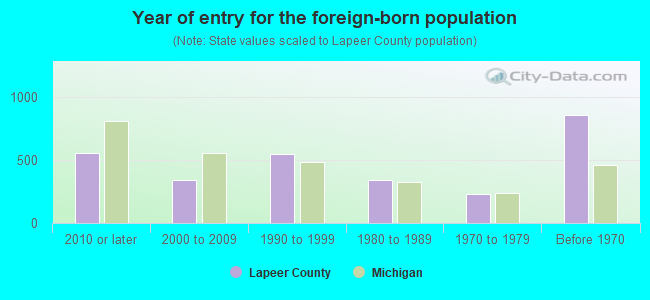
- Year of entry for the foreign-born population
- 6982010 or later
- 3402000 to 2009
- 4861990 to 1999
- 3381980 to 1989
- 2291970 to 1979
- 857Before 1970
Mean travel time to work (commute): minutes
Percentage of county residents living and working in this county: 99.3%
Housing units in structures:
- One, detached: 31,009
- One, attached: 485
- Two: 527
- 3 or 4: 735
- 5 to 9: 461
- 10 to 19: 624
- 20 to 49: 175
- 50 or more: 118
- Mobile homes: 2,962
- Boats, RVs, vans, etc.: 89
Housing units in Lapeer County with a mortgage: 18,722 (1,562 second mortgage, 16 home equity loan, 1,329 both second mortgage and home equity loan)
Houses without a mortgage: 380
| Here: | 4.5% with mortgage |
| State: | 96.7% with mortgage |
Religion statistics for Lapeer County
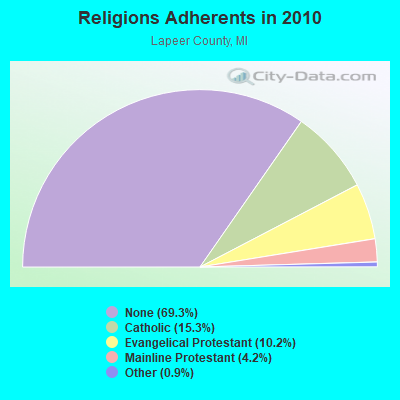
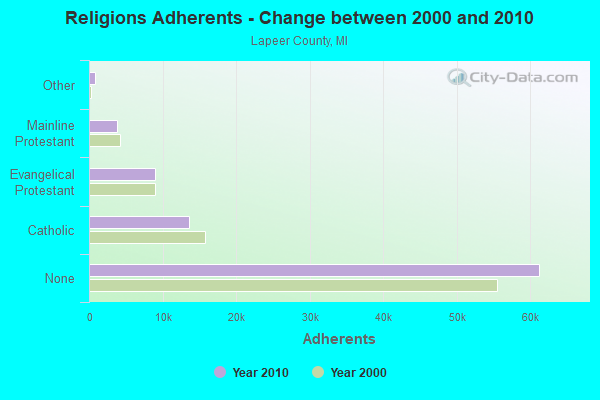
| Religion | Adherents | Congregations |
|---|---|---|
| Catholic | 13,538 | 5 |
| Evangelical Protestant | 8,972 | 49 |
| Mainline Protestant | 3,741 | 19 |
| Other | 839 | 6 |
| None | 61,229 | - |
Source: Clifford Grammich, Kirk Hadaway, Richard Houseal, Dale E.Jones, Alexei Krindatch, Richie Stanley and Richard H.Taylor. 2012. 2010 U.S.Religion Census: Religious Congregations & Membership Study. Association of Statisticians of American Religious Bodies. Jones, Dale E., et al. 2002. Congregations and Membership in the United States 2000. Nashville, TN: Glenmary Research Center.
Food Environment Statistics:
| Lapeer County: | 1.64 / 10,000 pop. |
| State: | 2.34 / 10,000 pop. |
| Here: | 0.11 / 10,000 pop. |
| Michigan: | 0.18 / 10,000 pop. |
| This county: | 1.74 / 10,000 pop. |
| Michigan: | 1.52 / 10,000 pop. |
| Lapeer County: | 2.83 / 10,000 pop. |
| Michigan: | 2.99 / 10,000 pop. |
| This county: | 5.12 / 10,000 pop. |
| State: | 6.80 / 10,000 pop. |
| Lapeer County: | 9.1% |
| Michigan: | 9.7% |
| Lapeer County: | 30.1% |
| State: | 29.7% |
| Here: | 15.3% |
| State: | 13.4% |
Agriculture in Lapeer County:
Average size of farms: 159 acresAverage value of agricultural products sold per farm: $42,641
Average value of crops sold per acre for harvested cropland: $254.39
The value of nursery, greenhouse, floriculture, and sod as a percentage of the total market value of agricultural products sold: 11.17%
The value of livestock, poultry, and their products as a percentage of the total market value of agricultural products sold: 34.18%
Average total farm production expenses per farm: $42,176
Harvested cropland as a percentage of land in farms: 69.20%
Irrigated harvested cropland as a percentage of land in farms: 1.40%
Average market value of all machinery and equipment per farm: $73,619
The percentage of farms operated by a family or individual: 90.65%
Average age of principal farm operators: 54 years
Average number of cattle and calves per 100 acres of all land in farms: 9.65
Milk cows as a percentage of all cattle and calves: 24.08%
Corn for grain: 31798 harvested acres
All wheat for grain: 6422 harvested acres
Soybeans for beans: 52242 harvested acres
Vegetables: 3,210 harvested acres
Land in orchards: 609 acres
Earthquake activity:
Lapeer County-area historical earthquake activity is significantly above Michigan state average. It is 54% smaller than the overall U.S. average.On 9/25/1998 at 19:52:52, a magnitude 5.2 (4.8 MB, 4.3 MS, 5.2 LG, 4.5 MW, Depth: 3.1 mi, Class: Moderate, Intensity: VI - VII) earthquake occurred 181.6 miles away from Lapeer County center
On 1/31/1986 at 16:46:43, a magnitude 5.0 (5.0 MB) earthquake occurred 146.7 miles away from the county center
On 5/2/2015 at 16:23:07, a magnitude 4.2 (4.2 MW, Depth: 2.8 mi, Class: Light, Intensity: IV - V) earthquake occurred 125.6 miles away from the county center
On 7/12/1986 at 08:19:37, a magnitude 4.5 (4.5 MB) earthquake occurred 184.6 miles away from the county center
On 7/27/1980 at 18:52:21, a magnitude 5.2 (5.1 MB, 4.7 MS, 5.0 UK, 5.2 UK) earthquake occurred 338.4 miles away from Lapeer County center
On 6/10/2019 at 14:50:45, a magnitude 4.0 (4.0 MB, Depth: 1.2 mi) earthquake occurred 132.1 miles away from the county center
Magnitude types: regional Lg-wave magnitude (LG), body-wave magnitude (MB), surface-wave magnitude (MS), moment magnitude (MW)
Most recent natural disasters:
- Michigan Covid-19 Pandemic, Incident Period: January 20, 2020, FEMA Id: 4494, Natural disaster type: Other
- Michigan Hurricane Katrina Evacuation, Incident Period: August 29, 2005 to October 01, 2005, Emergency Declared EM-3225: September 07, 2005, FEMA Id: 3225, Natural disaster type: Hurricane
- Michigan Power Outage, Incident Period: August 14, 2003 to August 17, 2003, Emergency Declared EM-3189: September 23, 2003, FEMA Id: 3189, Natural disaster type: Power Outage
- Michigan Severe Winter Storm, Incident Period: December 11, 2000 to December 31, 2000, Emergency Declared EM-3160: January 10, 2001, FEMA Id: 3160, Natural disaster type: Winter Storm
- Michigan Flooding, Incident Period: June 21, 1996 to July 01, 1996, Major Disaster (Presidential) Declared DR-1128: July 23, 1996, FEMA Id: 1128, Natural disaster type: Flood
- Michigan SEVERE STORMS, FLOODING, Incident Period: September 10, 1986 to October 10, 1986, Major Disaster (Presidential) Declared DR-774: September 18, 1986, FEMA Id: 774, Natural disaster type: Storm, Flood
- Michigan SEVERE STORMS AND FLOODING, Incident Period: September 05, 1985 to September 28, 1985, Major Disaster (Presidential) Declared DR-744: September 18, 1985, FEMA Id: 744, Natural disaster type: Storm, Flood
- Michigan Blizzards and Snowstorms, Incident Period: January 27, 1978, Emergency Declared EM-3057: January 27, 1978, FEMA Id: 3057, Natural disaster type: Snowstorm, Blizzard
- Michigan Severe Storms, Tornadoes, Icing, Flooding, Incident Period: March 19, 1976, Major Disaster (Presidential) Declared DR-495: March 19, 1976, FEMA Id: 495, Natural disaster type: Storm, Tornado, Flood
- Michigan Severe Storms, High Winds, Flooding, Incident Period: April 26, 1975, Major Disaster (Presidential) Declared DR-465: April 26, 1975, FEMA Id: 465, Natural disaster type: Storm, Flood, Wind
The number of natural disasters in Lapeer County (10) is smaller than the US average (15).
Major Disasters (Presidential) Declared: 5
Emergencies Declared: 4
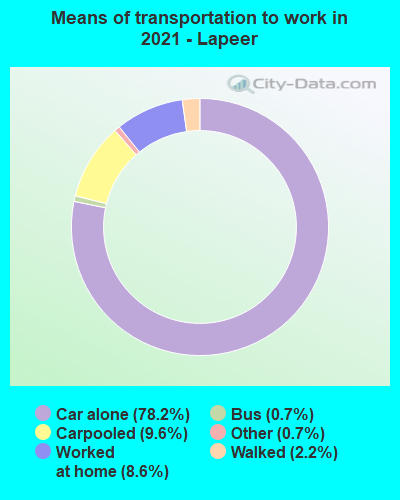
Means of transportation to work:
- Drove a car alone: 19,805 (72.9%)
- Carpooled: 2,634 (9.7%)
- Bus: 112 (0.4%)
- Taxicab, motorcycle, or other means: 309 (1.1%)
- Bicycle: 23 (0.1%)
- Walked: 404 (1.5%)
- Worked at home: 3,968 (14.6%)

- Health care and social assistance (19%)
- Retail trade (11%)
- Educational services (10%)
- Manufacturing (7%)
- Other services, except public administration (5%)
- Accommodation and food services (5%)
- Public administration (5%)
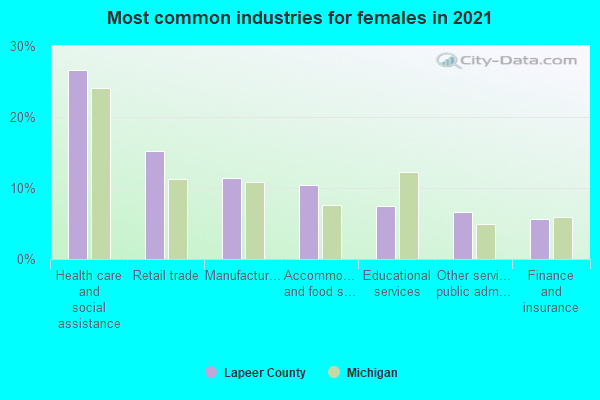
- Health care and social assistance (23%)
- Retail trade (14%)
- Educational services (12%)
- Manufacturing (9%)
- Other services, except public administration (6%)
- Accommodation and food services (6%)
- Public administration (5%)
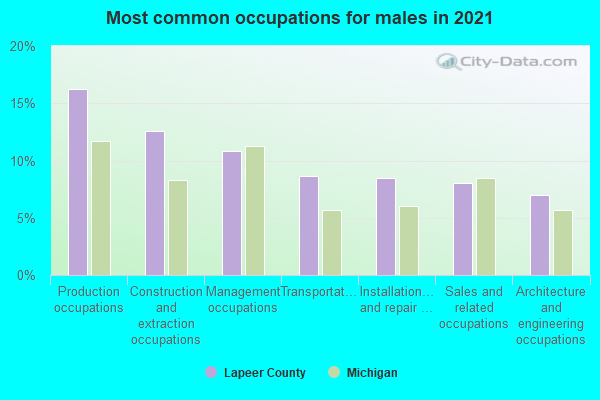
- Production occupations (12%)
- Construction and extraction occupations (12%)
- Architecture and engineering occupations (10%)
- Installation, maintenance, and repair occupations (10%)
- Management occupations (8%)
- Sales and related occupations (8%)
- Transportation occupations (8%)
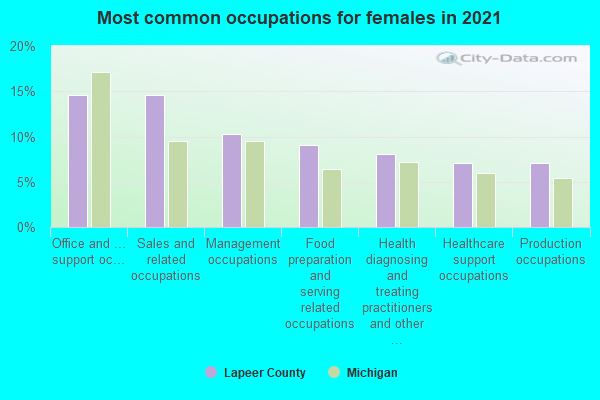
- Office and administrative support occupations (17%)
- Management occupations (10%)
- Educational instruction, and library occupations (9%)
- Sales and related occupations (9%)
- Food preparation and serving related occupations (8%)
- Healthcare support occupations (7%)
- Health diagnosing and treating practitioners and other technical occupations (5%)
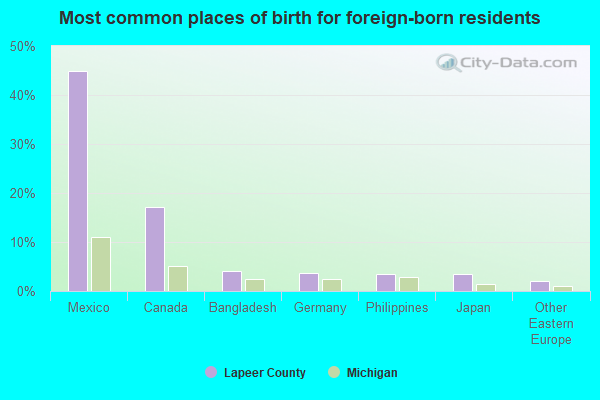
- Mexico (46%)
- Canada (15%)
- Philippines (4%)
- Germany (3%)
- Guatemala (3%)
- Japan (3%)
- Bangladesh (3%)
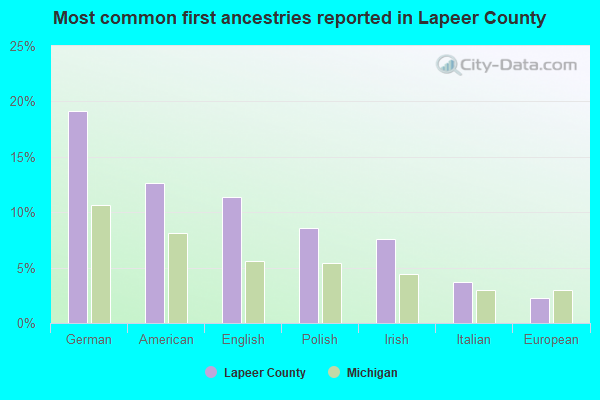
- German (19%)
- American (14%)
- English (12%)
- Irish (8%)
- Polish (8%)
- Italian (4%)
- Scottish (2%)
People in group quarters in Lapeer County, Michigan in 2010:
- 952 people in state prisons
- 289 people in nursing facilities/skilled-nursing facilities
- 251 people in group homes intended for adults
- 110 people in local jails and other municipal confinement facilities
- 72 people in workers' group living quarters and job corps centers
- 20 people in other noninstitutional facilities
- 10 people in emergency and transitional shelters (with sleeping facilities) for people experiencing homelessness
- 7 people in residential treatment centers for adults
- 5 people in mental (psychiatric) hospitals and psychiatric units in other hospitals
People in group quarters in Lapeer County, Michigan in 2000:
- 966 people in state prisons
- 291 people in other group homes
- 247 people in nursing homes
- 114 people in local jails and other confinement facilities (including police lockups)
- 94 people in other noninstitutional group quarters
- 52 people in homes for the mentally retarded
- 48 people in agriculture workers' dormitories on farms
- 35 people in homes or halfway houses for drug/alcohol abuse
- 21 people in homes for the mentally ill
6.58% of this county's 2021 resident taxpayers lived in other counties in 2020 ($59,446 average adjusted gross income)
| Here: | 6.58% |
| Michigan average: | 5.83% |
10 or fewer of this county's residents moved from foreign countries.
5.55% relocated from other counties in Michigan ($50,196 average AGI)
1.03% relocated from other states ($9,250 average AGI)
Lapeer County: 1.03% Michigan average: 1.78%
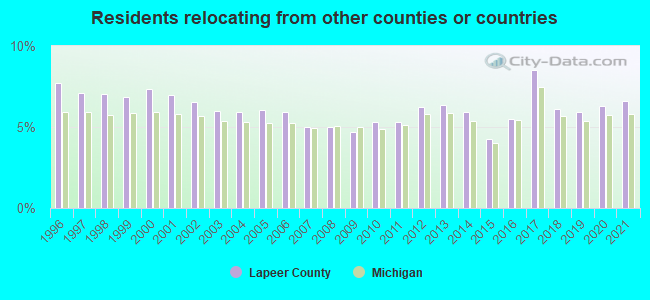
Top counties from which taxpayers relocated into this county between 2020 and 2021:
| from Oakland County, MI | |
| from Macomb County, MI | |
| from Genesee County, MI | |
| from St. Clair County, MI | |
| from Wayne County, MI | |
| from Tuscola County, MI | |
| from Sanilac County, MI |
6.26% of this county's 2020 resident taxpayers moved to other counties in 2021 ($53,398 average adjusted gross income)
| Here: | 6.26% |
| Michigan average: | 5.95% |
10 or fewer of this county's residents moved to foreign countries.
5.16% relocated to other counties in Michigan ($42,304 average AGI)
1.10% relocated to other states ($11,093 average AGI)
Lapeer County: 1.10% Michigan average: 1.91%
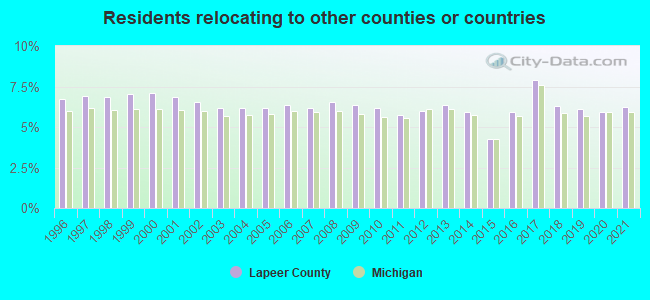
Top counties to which taxpayers relocated from this county between 2020 and 2021:
| to Genesee County, MI | |
| to Oakland County, MI | |
| to Macomb County, MI | |
| to Tuscola County, MI | |
| to St. Clair County, MI | |
| to Sanilac County, MI | |
| to Wayne County, MI |
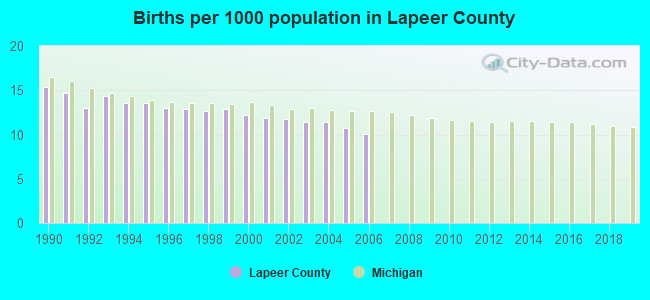
Births per 1000 population from 1990 to 1999: 13.6
Births per 1000 population from 2000 to 2006: 11.4
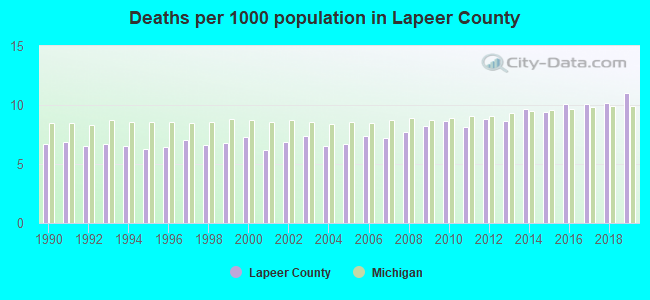
Deaths per 1000 population from 1990 to 1999: 6.6
Deaths per 1000 population from 2000 to 2009: 7.2
Deaths per 1000 population from 2010 to 2020: 9.7
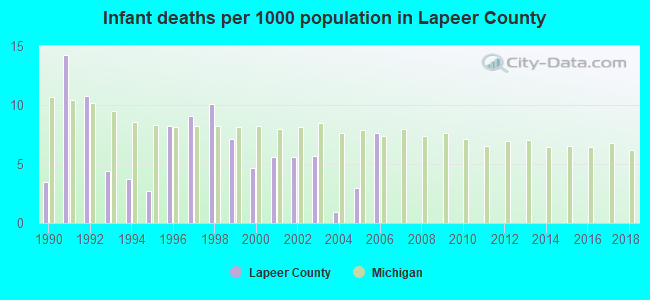
Infant deaths per 1000 live births from 1990 to 1999: 7.4
Infant deaths per 1000 live births from 2000 to 2006: 4.7
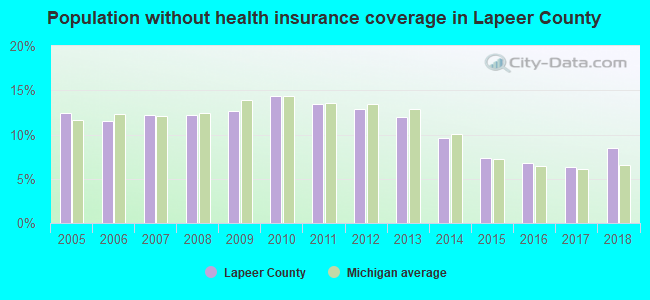
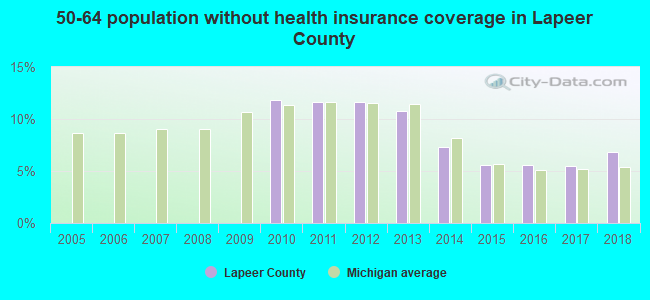
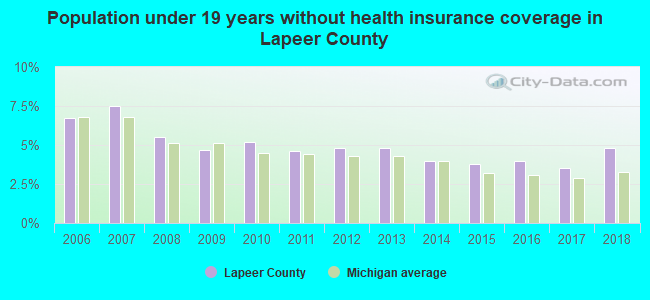
Persons under 19 years old without health insurance coverage in 2018: 4.8%
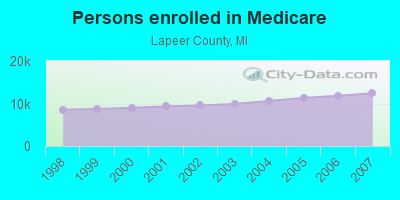
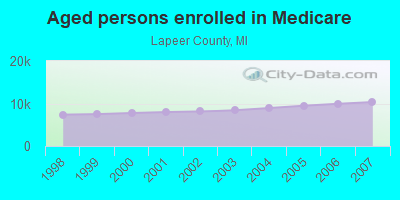
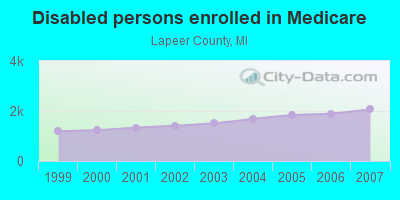
Persons enrolled in hospital insurance and/or supplemental medical insurance (Medicare) in July 1, 2007: 12,410 (10,338 aged, 2,072 disabled)
Children under 18 without health insurance coverage in 2007: 921 (4%)
Most common underlying causes of death in Lapeer County, Michigan in 1999 - 2019:
- Atherosclerotic heart disease (1,550)
- Bronchus or lung, unspecified - Malignant neoplasms (1,056)
- Acute myocardial infarction, unspecified (841)
- Congestive heart failure (705)
- Chronic obstructive pulmonary disease, unspecified (636)
- Stroke, not specified as haemorrhage or infarction (422)
- Alzheimer disease, unspecified (356)
- Unspecified dementia (290)
- Pneumonia, unspecified (273)
- Colon, unspecified - Malignant neoplasms (267)
Population without health insurance coverage in 2000: 10%
Children under 18 without health insurance coverage in 2000: 7%
Short term general hospital admissions per 100,000 population in 2004: 6,849
Short term general hospital beds per 100,000 population in 2004: 157
Emergency room visits per 100,000 population in 2004: 26,122
General practice office based MDs per 100,000 population in 2005: 1,153
Medical specialist MDs per 100,000 population in 2005: 681
Dentists per 100,000 population in 1998: 4
Total births per 100,000 population, July 2005 - July 2006 : 29
Total deaths per 100,000 population, July 2005 - July 2006: 56
Limited-service eating places per 100,000 population in 2005 : 9
Beer, wine & liquor stores per 100,000 population in 2005: 1
Suicides per 1,000,000 population from 2000 to 2006: 102.5. This is less than state average.
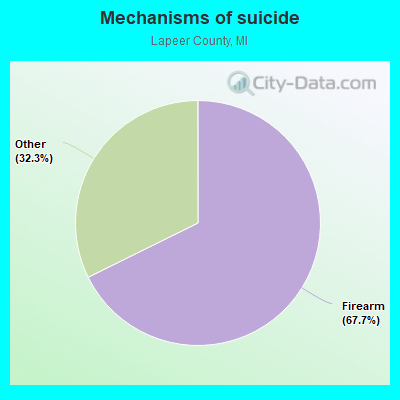
- Firearm - 69.4
- Other - 33.1
Household type by relationship:
Households: 88,780- Male householders: 17,595 (4,032 living alone), Female householders: 17,664 (3,818 living alone)
19,704 spouses (19,558 opposite-sex spouses), 2,234 unmarried partners, (2,222 opposite-sex unmarried partners), 24,341 children (22,720 natural, 339 adopted, 1,282 stepchildren), 2,257 grandchildren, 544 brothers or sisters, 679 parents, 15 foster children, 1,206 other relatives, 1,199 non-relatives
- In group quarters: 1,342
Size of family households: 12,130 2-persons, 5,504 3-persons, 5,028 4-persons, 2,084 5-persons, 728 6-persons, 400 7-or-more-persons.
Size of nonfamily households: 7,850 1-person, 1,467 2-persons, 51 3-persons, 17 4-persons.
11,138 married couples with children.
4,779 single-parent households (1,418 men, 3,361 women).
95.1% of residents of Lapeer speak English at home.
3.5% of residents speak Spanish at home (48% speak English very well, 21% speak English well, 13% speak English not well, 18% don't speak English at all).
1.0% of residents speak other Indo-European language at home (91% speak English very well, 6% speak English well, 2% speak English not well).
0.3% of residents speak Asian or Pacific Island language at home (62% speak English very well, 26% speak English well, 12% speak English not well).
0.1% of residents speak other language at home (52% speak English very well, 33% speak English well, 16% speak English not well).
In fiscal year 2004:
Federal Government expenditure: $298,009,000 ($3,221 per capita)
Department of Defense expenditure: $3,903,000
Federal direct payments to individuals for retirement and disability: $158,675,000
Federal other direct payments to individuals: $65,199,000
Federal direct payments not to individuals: $4,664,000
Federal grants: $55,465,000
Federal procurement contracts: $3,540,000 ($972,000 Department of Defense)
Federal salaries and wages: $10,466,000 ($439,000 Department of Defense)
Federal Government direct loans: $1,648,000
Federal guaranteed/insured loans: $45,584,000
Federal Government insurance: $20,165,000
Population change from April 1, 2000 to July 1, 2005:
Births: 5,526| Here: | 59 per 1000 residents |
| State: | 68 per 1000 residents |
Deaths: 3,359
| Here: | 36 per 1000 residents |
| State: | 45 per 1000 residents |
Net international migration: +227
| Here: | +2 per 1000 residents |
| State: | +12 per 1000 residents |
Net internal migration: +3,195
| Here: | |
| State: |
Total withdrawal of fresh water for public supply: 0.45 millions of gallons per day (all from ground)
| Here: | 6.4 |
| State: | 6.5 |
| Here: | 4.7 |
| State: | 4.3 |
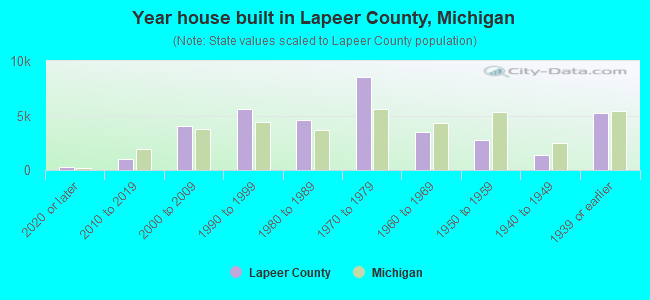
- Year house built in Lapeer County, Michigan
- 3752020 or later
- 1,8542010 to 2019
- 4,7772000 to 2009
- 6,4731990 to 1999
- 4,0111980 to 1989
- 6,3031970 to 1979
- 3,1211960 to 1969
- 2,9791950 to 1959
- 1,0391940 to 1949
- 6,2531939 or earlier
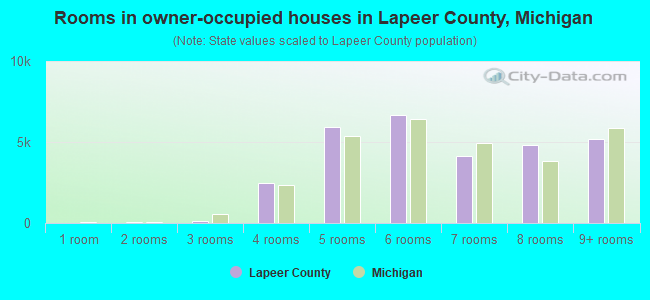
- Rooms in owner-occupied houses in Lapeer County, Michigan
- 781 room
- 1912 rooms
- 6153 rooms
- 1,7474 rooms
- 6,6655 rooms
- 6,2756 rooms
- 6,1747 rooms
- 2,9438 rooms
- 5,6649+ rooms
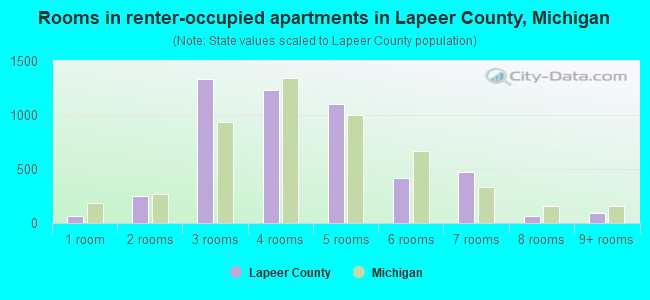
- Rooms in renter-occupied apartments in Lapeer County, Michigan
- 01 room
- 452 rooms
- 7073 rooms
- 1,4134 rooms
- 1,2955 rooms
- 6406 rooms
- 3567 rooms
- 1648 rooms
- 2879+ rooms
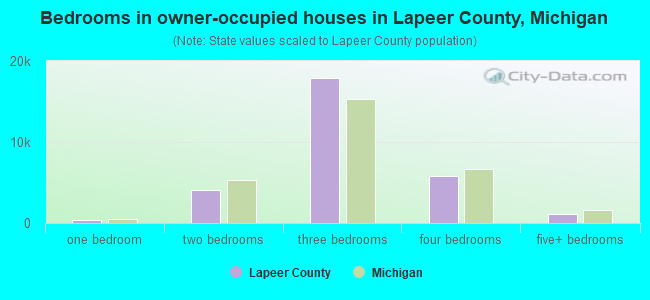
- Bedrooms in owner-occupied houses in Lapeer County, Michigan
- 78no bedroom
- 5641 bedroom
- 3,3542 bedrooms
- 19,9773 bedrooms
- 4,8834 bedrooms
- 1,4965+ bedrooms
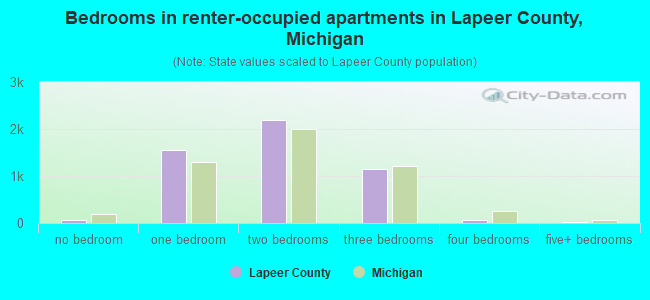
- Bedrooms in renter-occupied apartments in Lapeer County, Michigan
- 0no bedroom
- 1,0671 bedroom
- 2,1762 bedrooms
- 1,0873 bedrooms
- 4034 bedrooms
- 1745+ bedrooms
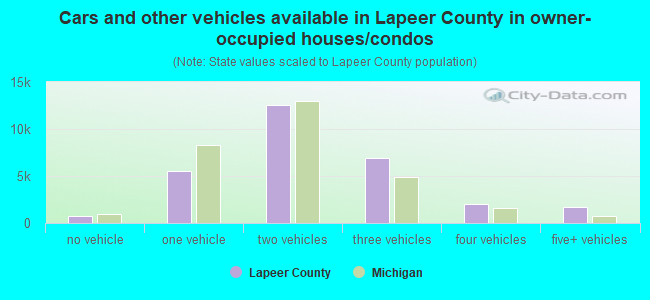
- Cars and other vehicles available in Lapeer County in owner-occupied houses/condos
- 1,126no vehicle
- 7,2261 vehicle
- 11,7872 vehicles
- 6,4173 vehicles
- 1,9124 vehicles
- 1,8845+ vehicles
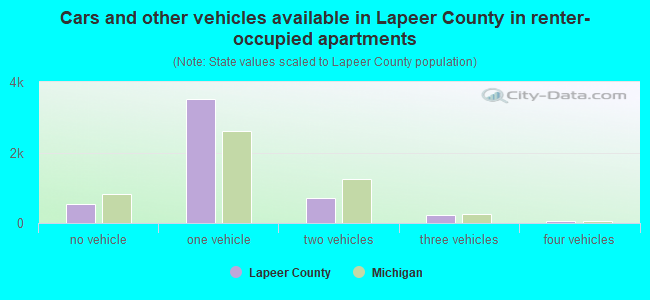
- Cars and other vehicles available in Lapeer County in renter-occupied apartments
- 754no vehicle
- 2,8091 vehicle
- 1,2232 vehicles
- 373 vehicles
- 04 vehicles
- 845+ vehicles
90.1% of Lapeer County residents lived in the same house 1 years ago.
Out of people who lived in different houses, 28% lived in this county.
Out of people who lived in different counties, 71% lived in Michigan.
| Lapeer County: | 90.1% |
| State average: | 88.4% |
Place of birth for U.S.-born residents:
- This state: 76,031
- Other state: 10,838
- Northeast: 1,304
- Midwest: 4,012
- South: 3,365
- West: 2,157
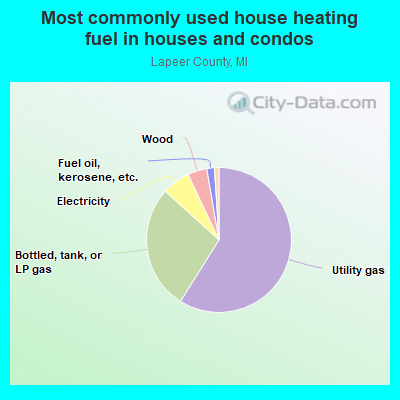
- 59.4%Utility gas
- 26.4%Bottled, tank, or LP gas
- 6.7%Electricity
- 3.4%Wood
- 2.0%Fuel oil, kerosene, etc.
- 1.6%No fuel used
- 0.4%Other fuel
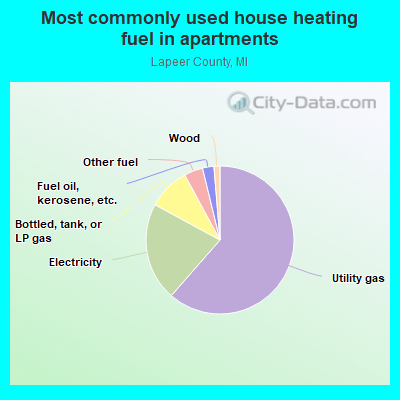
- 55.3%Utility gas
- 23.1%Electricity
- 8.3%Bottled, tank, or LP gas
- 5.6%Fuel oil, kerosene, etc.
- 3.0%No fuel used
- 2.5%Wood
- 2.2%Other fuel
Private vs. public school enrollment:
| Here: | 10.0% |
| Michigan: | 12.4% |
| Here: | 17.9% |
| Michigan: | 9.8% |
| Here: | 25.4% |
| Michigan: | 14.9% |
Lapeer County government finances - Expenditure in 2020:
- Charges - Other: $39,820,000
Other: $37,369,000
Regular Highways: $2,421,000
Regular Highways: $1,915,000
Parks and Recreation: $141,000
Parks and Recreation: $113,000
- Current Operations - Public Welfare Institutions: $29,837,000
Public Welfare Institutions: $26,966,000
Health - Other: $25,147,000
Health - Other: $22,964,000
Regular Highways: $13,519,000
Regular Highways: $9,958,000
General - Other: $9,843,000
General - Other: $7,135,000
Judicial and Legal Services: $6,633,000
Judicial and Legal Services: $6,224,000
Police Protection: $5,315,000
Police Protection: $5,139,000
Correctional Institutions: $3,506,000
Correctional Institutions: $3,228,000
Central Staff Services: $1,453,000
Public Welfare - Other: $1,407,000
Financial Administration: $1,368,000
Central Staff Services: $1,322,000
Financial Administration: $1,289,000
Public Welfare - Other: $1,266,000
General Public Buildings: $1,093,000
General Public Buildings: $908,000
Housing and Community Development: $423,000
Parks and Recreation: $418,000
Parks and Recreation: $343,000
Housing and Community Development: $40,000
Corrections - Other: $33,000
Corrections - Other: $29,000
- Federal Intergovernmental - Other: $2,453,000
Other: $1,506,000
Health and Hospitals: $1,233,000
Health and Hospitals: $1,182,000
Housing and Community Development: $412,000
- General - Interest on Debt: $388,000
Interest on Debt: $159,000
- Local Intergovernmental - Highways: $4,179,000
Highways: $2,379,000
Other: $30,000
- Long Term Debt - Beginning Outstanding - Unspecified Public Purpose: $11,755,000
Outstanding Unspecified Public Purpose: $11,540,000
Beginning Outstanding - Unspecified Public Purpose: $9,150,000
Outstanding Unspecified Public Purpose: $7,688,000
Retired Unspecified Public Purpose: $3,134,000
Issue, Unspecified Public Purpose: $2,918,000
Retired Unspecified Public Purpose: $2,350,000
Issue, Unspecified Public Purpose: $888,000
- Miscellaneous - General Revenue - Other: $3,730,000
General Revenue - Other: $3,572,000
Interest Earnings: $1,325,000
Interest Earnings: $877,000
Fines and Forfeits: $505,000
Fines and Forfeits: $449,000
Rents: $250,000
Rents: $246,000
Donations From Private Sources: $44,000
Donations From Private Sources: $21,000
Sale of Property: $3,000
- Other Capital Outlay - General - Other: $2,879,000
General - Other: $278,000
Parks and Recreation: $29,000
Police Protection: $20,000
Police Protection: $19,000
Judicial and Legal Services: $18,000
Health - Other: $10,000
- Other Funds - Cash and Securities: $52,536,000
Cash and Securities: $52,267,000
- State Intergovernmental - Health and Hospitals: $21,489,000
Health and Hospitals: $19,103,000
Highways: $13,137,000
Highways: $10,558,000
Other: $2,222,000
Other: $2,156,000
General Local Government Support: $1,723,000
General Local Government Support: $1,693,000
Public Welfare: $602,000
Public Welfare: $543,000
- Tax - Property: $15,220,000
Property: $13,995,000
Other License: $693,000
Other License: $626,000
Occupation and Business License - Other: $169,000
Occupation and Business License - Other: $137,000
- Total Salaries and Wages: $35,467,000
: $32,412,000
- Water Utilities - Interest on Debt: $104,000
Interest on Debt: $41,000
Lapeer County government finances - Revenue in 2020:
- Charges - Other: $39,820,000
Other: $37,369,000
Regular Highways: $2,421,000
Regular Highways: $1,915,000
Parks and Recreation: $141,000
Parks and Recreation: $113,000
- Current Operations - Public Welfare Institutions: $29,837,000
Public Welfare Institutions: $26,966,000
Health - Other: $25,147,000
Health - Other: $22,964,000
Regular Highways: $13,519,000
Regular Highways: $9,958,000
General - Other: $9,843,000
General - Other: $7,135,000
Judicial and Legal Services: $6,633,000
Judicial and Legal Services: $6,224,000
Police Protection: $5,315,000
Police Protection: $5,139,000
Correctional Institutions: $3,506,000
Correctional Institutions: $3,228,000
Central Staff Services: $1,453,000
Public Welfare - Other: $1,407,000
Financial Administration: $1,368,000
Central Staff Services: $1,322,000
Financial Administration: $1,289,000
Public Welfare - Other: $1,266,000
General Public Buildings: $1,093,000
General Public Buildings: $908,000
Housing and Community Development: $423,000
Parks and Recreation: $418,000
Parks and Recreation: $343,000
Housing and Community Development: $40,000
Corrections - Other: $33,000
Corrections - Other: $29,000
- Federal Intergovernmental - Other: $2,453,000
Other: $1,506,000
Health and Hospitals: $1,233,000
Health and Hospitals: $1,182,000
Housing and Community Development: $412,000
- General - Interest on Debt: $388,000
Interest on Debt: $159,000
- Local Intergovernmental - Highways: $4,179,000
Highways: $2,379,000
Other: $30,000
- Long Term Debt - Beginning Outstanding - Unspecified Public Purpose: $11,755,000
Outstanding Unspecified Public Purpose: $11,540,000
Beginning Outstanding - Unspecified Public Purpose: $9,150,000
Outstanding Unspecified Public Purpose: $7,688,000
Retired Unspecified Public Purpose: $3,134,000
Issue, Unspecified Public Purpose: $2,918,000
Retired Unspecified Public Purpose: $2,350,000
Issue, Unspecified Public Purpose: $888,000
- Miscellaneous - General Revenue - Other: $3,730,000
General Revenue - Other: $3,572,000
Interest Earnings: $1,325,000
Interest Earnings: $877,000
Fines and Forfeits: $505,000
Fines and Forfeits: $449,000
Rents: $250,000
Rents: $246,000
Donations From Private Sources: $44,000
Donations From Private Sources: $21,000
Sale of Property: $3,000
- Other Capital Outlay - General - Other: $2,879,000
General - Other: $278,000
Parks and Recreation: $29,000
Police Protection: $20,000
Police Protection: $19,000
Judicial and Legal Services: $18,000
Health - Other: $10,000
- Other Funds - Cash and Securities: $52,536,000
Cash and Securities: $52,267,000
- State Intergovernmental - Health and Hospitals: $21,489,000
Health and Hospitals: $19,103,000
Highways: $13,137,000
Highways: $10,558,000
Other: $2,222,000
Other: $2,156,000
General Local Government Support: $1,723,000
General Local Government Support: $1,693,000
Public Welfare: $602,000
Public Welfare: $543,000
- Tax - Property: $15,220,000
Property: $13,995,000
Other License: $693,000
Other License: $626,000
Occupation and Business License - Other: $169,000
Occupation and Business License - Other: $137,000
- Total Salaries and Wages: $35,467,000
: $32,412,000
- Water Utilities - Interest on Debt: $104,000
Interest on Debt: $41,000
Lapeer County government finances - Debt in 2020:
- Charges - Other: $39,820,000
Other: $37,369,000
Regular Highways: $2,421,000
Regular Highways: $1,915,000
Parks and Recreation: $141,000
Parks and Recreation: $113,000
- Current Operations - Public Welfare Institutions: $29,837,000
Public Welfare Institutions: $26,966,000
Health - Other: $25,147,000
Health - Other: $22,964,000
Regular Highways: $13,519,000
Regular Highways: $9,958,000
General - Other: $9,843,000
General - Other: $7,135,000
Judicial and Legal Services: $6,633,000
Judicial and Legal Services: $6,224,000
Police Protection: $5,315,000
Police Protection: $5,139,000
Correctional Institutions: $3,506,000
Correctional Institutions: $3,228,000
Central Staff Services: $1,453,000
Public Welfare - Other: $1,407,000
Financial Administration: $1,368,000
Central Staff Services: $1,322,000
Financial Administration: $1,289,000
Public Welfare - Other: $1,266,000
General Public Buildings: $1,093,000
General Public Buildings: $908,000
Housing and Community Development: $423,000
Parks and Recreation: $418,000
Parks and Recreation: $343,000
Housing and Community Development: $40,000
Corrections - Other: $33,000
Corrections - Other: $29,000
- Federal Intergovernmental - Other: $2,453,000
Other: $1,506,000
Health and Hospitals: $1,233,000
Health and Hospitals: $1,182,000
Housing and Community Development: $412,000
- General - Interest on Debt: $388,000
Interest on Debt: $159,000
- Local Intergovernmental - Highways: $4,179,000
Highways: $2,379,000
Other: $30,000
- Long Term Debt - Beginning Outstanding - Unspecified Public Purpose: $11,755,000
Outstanding Unspecified Public Purpose: $11,540,000
Beginning Outstanding - Unspecified Public Purpose: $9,150,000
Outstanding Unspecified Public Purpose: $7,688,000
Retired Unspecified Public Purpose: $3,134,000
Issue, Unspecified Public Purpose: $2,918,000
Retired Unspecified Public Purpose: $2,350,000
Issue, Unspecified Public Purpose: $888,000
- Miscellaneous - General Revenue - Other: $3,730,000
General Revenue - Other: $3,572,000
Interest Earnings: $1,325,000
Interest Earnings: $877,000
Fines and Forfeits: $505,000
Fines and Forfeits: $449,000
Rents: $250,000
Rents: $246,000
Donations From Private Sources: $44,000
Donations From Private Sources: $21,000
Sale of Property: $3,000
- Other Capital Outlay - General - Other: $2,879,000
General - Other: $278,000
Parks and Recreation: $29,000
Police Protection: $20,000
Police Protection: $19,000
Judicial and Legal Services: $18,000
Health - Other: $10,000
- Other Funds - Cash and Securities: $52,536,000
Cash and Securities: $52,267,000
- State Intergovernmental - Health and Hospitals: $21,489,000
Health and Hospitals: $19,103,000
Highways: $13,137,000
Highways: $10,558,000
Other: $2,222,000
Other: $2,156,000
General Local Government Support: $1,723,000
General Local Government Support: $1,693,000
Public Welfare: $602,000
Public Welfare: $543,000
- Tax - Property: $15,220,000
Property: $13,995,000
Other License: $693,000
Other License: $626,000
Occupation and Business License - Other: $169,000
Occupation and Business License - Other: $137,000
- Total Salaries and Wages: $35,467,000
: $32,412,000
- Water Utilities - Interest on Debt: $104,000
Interest on Debt: $41,000
Lapeer County government finances - Cash and Securities in 2020:
- Charges - Other: $39,820,000
Other: $37,369,000
Regular Highways: $2,421,000
Regular Highways: $1,915,000
Parks and Recreation: $141,000
Parks and Recreation: $113,000
- Current Operations - Public Welfare Institutions: $29,837,000
Public Welfare Institutions: $26,966,000
Health - Other: $25,147,000
Health - Other: $22,964,000
Regular Highways: $13,519,000
Regular Highways: $9,958,000
General - Other: $9,843,000
General - Other: $7,135,000
Judicial and Legal Services: $6,633,000
Judicial and Legal Services: $6,224,000
Police Protection: $5,315,000
Police Protection: $5,139,000
Correctional Institutions: $3,506,000
Correctional Institutions: $3,228,000
Central Staff Services: $1,453,000
Public Welfare - Other: $1,407,000
Financial Administration: $1,368,000
Central Staff Services: $1,322,000
Financial Administration: $1,289,000
Public Welfare - Other: $1,266,000
General Public Buildings: $1,093,000
General Public Buildings: $908,000
Housing and Community Development: $423,000
Parks and Recreation: $418,000
Parks and Recreation: $343,000
Housing and Community Development: $40,000
Corrections - Other: $33,000
Corrections - Other: $29,000
- Federal Intergovernmental - Other: $2,453,000
Other: $1,506,000
Health and Hospitals: $1,233,000
Health and Hospitals: $1,182,000
Housing and Community Development: $412,000
- General - Interest on Debt: $388,000
Interest on Debt: $159,000
- Local Intergovernmental - Highways: $4,179,000
Highways: $2,379,000
Other: $30,000
- Long Term Debt - Beginning Outstanding - Unspecified Public Purpose: $11,755,000
Outstanding Unspecified Public Purpose: $11,540,000
Beginning Outstanding - Unspecified Public Purpose: $9,150,000
Outstanding Unspecified Public Purpose: $7,688,000
Retired Unspecified Public Purpose: $3,134,000
Issue, Unspecified Public Purpose: $2,918,000
Retired Unspecified Public Purpose: $2,350,000
Issue, Unspecified Public Purpose: $888,000
- Miscellaneous - General Revenue - Other: $3,730,000
General Revenue - Other: $3,572,000
Interest Earnings: $1,325,000
Interest Earnings: $877,000
Fines and Forfeits: $505,000
Fines and Forfeits: $449,000
Rents: $250,000
Rents: $246,000
Donations From Private Sources: $44,000
Donations From Private Sources: $21,000
Sale of Property: $3,000
- Other Capital Outlay - General - Other: $2,879,000
General - Other: $278,000
Parks and Recreation: $29,000
Police Protection: $20,000
Police Protection: $19,000
Judicial and Legal Services: $18,000
Health - Other: $10,000
- Other Funds - Cash and Securities: $52,536,000
Cash and Securities: $52,267,000
- State Intergovernmental - Health and Hospitals: $21,489,000
Health and Hospitals: $19,103,000
Highways: $13,137,000
Highways: $10,558,000
Other: $2,222,000
Other: $2,156,000
General Local Government Support: $1,723,000
General Local Government Support: $1,693,000
Public Welfare: $602,000
Public Welfare: $543,000
- Tax - Property: $15,220,000
Property: $13,995,000
Other License: $693,000
Other License: $626,000
Occupation and Business License - Other: $169,000
Occupation and Business License - Other: $137,000
- Total Salaries and Wages: $35,467,000
: $32,412,000
- Water Utilities - Interest on Debt: $104,000
Interest on Debt: $41,000
Supplemental Security Income (SSI) in 2006:
- Total number of recipients: 945
- Number of aged recipients: 65
- Number of blind and disabled recipients: 880
- Number of recipients under 18: 134
- Number of recipients between 18 and 64: 644
- Number of recipients older than 64: 167
- Number of recipients also receiving OASDI: 357
- Amount of payments (thousands of dollars): 432
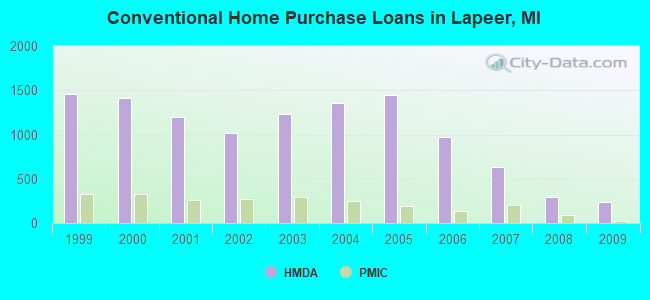
| Home Mortgage Disclosure Act Aggregated Statistics For Year 2009 (Based on 24 full tracts) | ||||||||||||||
| A) FHA, FSA/RHS & VA Home Purchase Loans | B) Conventional Home Purchase Loans | C) Refinancings | D) Home Improvement Loans | E) Loans on Dwellings For 5+ Families | F) Non-occupant Loans on < 5 Family Dwellings (A B C & D) | G) Loans On Manufactured Home Dwelling (A B C & D) | ||||||||
|---|---|---|---|---|---|---|---|---|---|---|---|---|---|---|
| Number | Average Value | Number | Average Value | Number | Average Value | Number | Average Value | Number | Average Value | Number | Average Value | Number | Average Value | |
| LOANS ORIGINATED | 313 | $107,185 | 235 | $101,013 | 1,425 | $142,701 | 67 | $68,701 | 2 | $163,000 | 135 | $86,726 | 76 | $71,987 |
| APPLICATIONS APPROVED, NOT ACCEPTED | 13 | $105,692 | 17 | $98,353 | 159 | $161,849 | 12 | $42,917 | 0 | $0 | 11 | $105,455 | 6 | $68,500 |
| APPLICATIONS DENIED | 115 | $99,148 | 60 | $74,417 | 634 | $158,405 | 75 | $55,907 | 0 | $0 | 35 | $88,686 | 51 | $52,863 |
| APPLICATIONS WITHDRAWN | 65 | $96,415 | 22 | $105,455 | 281 | $157,865 | 10 | $150,400 | 0 | $0 | 13 | $107,000 | 12 | $79,667 |
| FILES CLOSED FOR INCOMPLETENESS | 13 | $110,000 | 13 | $92,154 | 74 | $157,095 | 2 | $261,000 | 0 | $0 | 4 | $164,500 | 2 | $46,000 |
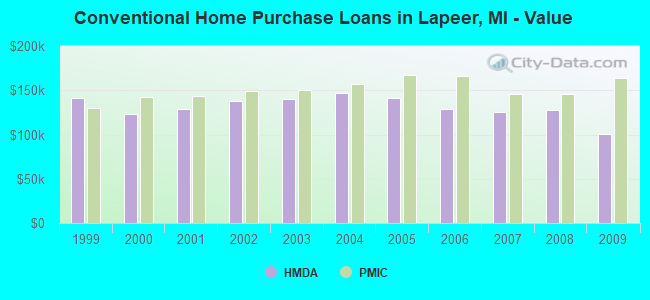
| Private Mortgage Insurance Companies Aggregated Statistics For Year 2009 (Based on 22 full tracts) | ||||||||
| A) Conventional Home Purchase Loans | B) Refinancings | C) Non-occupant Loans on < 5 Family Dwellings (A & B) | D) Loans On Manufactured Home Dwelling (A & B) | |||||
|---|---|---|---|---|---|---|---|---|
| Number | Average Value | Number | Average Value | Number | Average Value | Number | Average Value | |
| LOANS ORIGINATED | 17 | $163,529 | 20 | $160,400 | 2 | $88,000 | 1 | $44,000 |
| APPLICATIONS APPROVED, NOT ACCEPTED | 9 | $222,222 | 18 | $187,167 | 3 | $120,667 | 0 | $0 |
| APPLICATIONS DENIED | 5 | $158,800 | 15 | $168,267 | 0 | $0 | 1 | $53,000 |
| APPLICATIONS WITHDRAWN | 1 | $234,000 | 2 | $197,000 | 0 | $0 | 0 | $0 |
| FILES CLOSED FOR INCOMPLETENESS | 2 | $133,000 | 1 | $115,000 | 1 | $160,000 | 0 | $0 |
| Most common first names in Lapeer County, MI among deceased individuals | ||
| Name | Count | Lived (average) |
|---|---|---|
| John | 367 | 74.9 years |
| William | 331 | 74.0 years |
| Mary | 328 | 78.8 years |
| Robert | 271 | 70.4 years |
| Charles | 223 | 74.3 years |
| James | 222 | 69.5 years |
| George | 206 | 77.4 years |
| Helen | 158 | 79.5 years |
| Joseph | 150 | 74.1 years |
| Donald | 148 | 72.0 years |
| Most common last names in Lapeer County, MI among deceased individuals | ||
| Last name | Count | Lived (average) |
|---|---|---|
| Smith | 229 | 74.1 years |
| Johnson | 90 | 74.2 years |
| Miller | 88 | 75.5 years |
| Brown | 66 | 78.7 years |
| Davis | 59 | 72.6 years |
| Walker | 54 | 72.8 years |
| Thompson | 54 | 74.0 years |
| Williams | 52 | 76.4 years |
| Clark | 51 | 74.6 years |
| Jones | 50 | 72.1 years |
| Businesses in Lapeer County, MI | ||||
| Name | Count | Name | Count | |
|---|---|---|---|---|
| AT&T | 1 | Lane Furniture | 2 | |
| Advance Auto Parts | 1 | Little Caesars Pizza | 2 | |
| Applebee's | 1 | MasterBrand Cabinets | 7 | |
| Arby's | 1 | Maurices | 1 | |
| AutoZone | 2 | McDonald's | 6 | |
| Best Western | 1 | Meijer | 1 | |
| Blockbuster | 1 | New Balance | 1 | |
| Burger King | 2 | Nike | 6 | |
| Chevrolet | 1 | Office Depot | 1 | |
| Curves | 3 | Payless | 1 | |
| Dairy Queen | 2 | Penske | 1 | |
| Days Inn | 1 | RadioShack | 2 | |
| Famous Footwear | 1 | Rite Aid | 5 | |
| Fashion Bug | 2 | Rue21 | 1 | |
| FedEx | 4 | Sears | 1 | |
| Ford | 2 | Sprint Nextel | 2 | |
| GNC | 3 | Starbucks | 1 | |
| GameStop | 1 | Subway | 4 | |
| Goodwill | 1 | Super 8 | 1 | |
| H&R Block | 4 | T-Mobile | 1 | |
| Holiday Inn | 1 | Taco Bell | 2 | |
| Home Depot | 1 | Tim Hortons | 2 | |
| Jimmy John's | 6 | U-Haul | 6 | |
| KFC | 1 | UPS | 12 | |
| Kmart | 1 | Walgreens | 1 | |
| Kohl's | 1 | Walmart | 1 | |
| Kroger | 2 | Wendy's | 2 | |
Lapeer County on our top lists:
- #3 on the list of "Top 101 counties with the largest increase in the number of deaths per 1000 residents 2000-2006 to 2007-2013 (pop. 50,000+)"
- #8 on the list of "Top 101 counties with the lowest total withdrawal of fresh water for public supply (pop. 50,000+)"