Milam County, Texas (TX)
County owner-occupied free and clear houses and condos in 2010: 3,757
County owner-occupied houses and condos in 2000: 6,717
Renter-occupied apartments: 2,660 (it was 2,482 in 2000)
| % of renters here: | 27% |
| State: | 36% |
Land area: 1017 sq. mi.
Water area: 5.0 sq. mi.
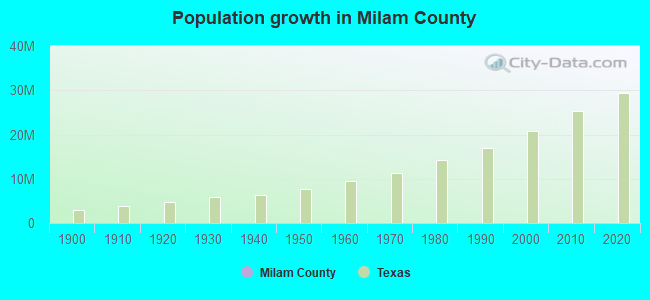
Population density: 25 people per square mile (low).
Industries providing employment: Educational, health and social services (24.0%), Retail trade (14.9%), Construction (12.9%).
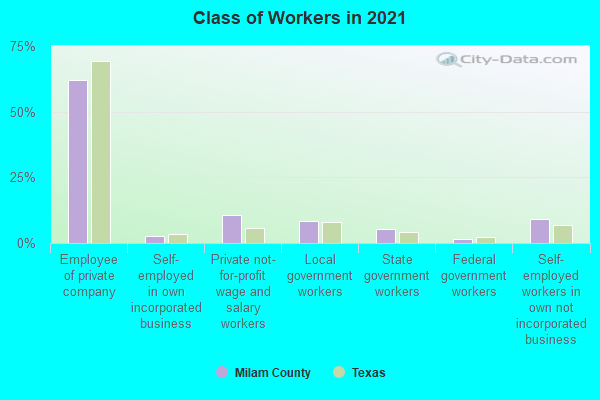
Type of workers:
- Private wage or salary: 75%
- Government: 16%
- Self-employed, not incorporated: 8%
- Unpaid family work: 1%
- OSM Map
- General Map
- Google Map
- MSN Map

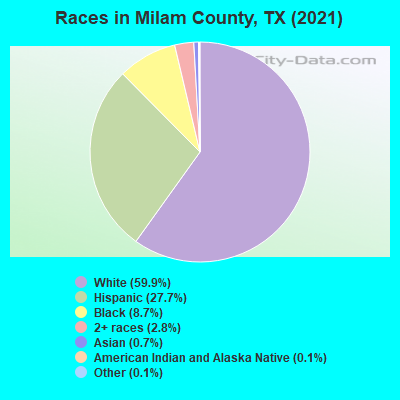
- 15,20059.7%White Non-Hispanic Alone
- 7,07527.8%Hispanic or Latino
- 2,3469.2%Black Non-Hispanic Alone
- 6762.7%Two or more races
- 960.4%Asian alone
- 340.1%American Indian and Alaska Native alone
- 210.08%Some other race alone
| Median resident age: | 42.0 years |
| Texas median age: | 35.6 years |
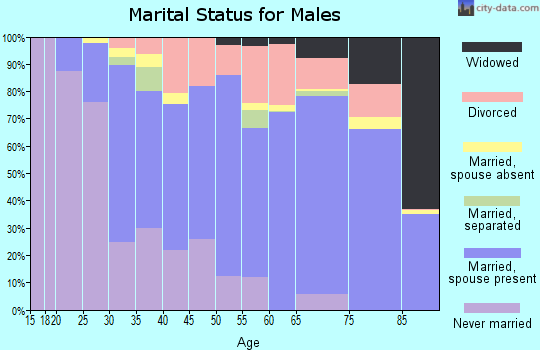
| Males: 12,693 | |
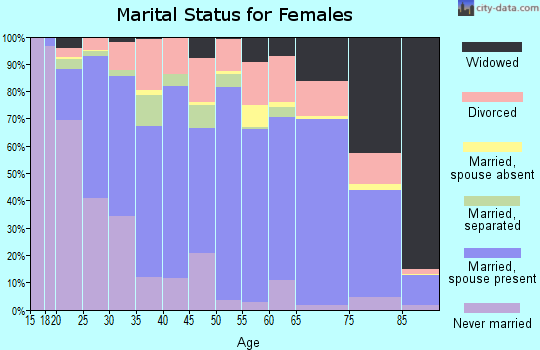
| Females: 13,061 |


| Milam County: | 2.0 people |
| Texas: | 3 people |
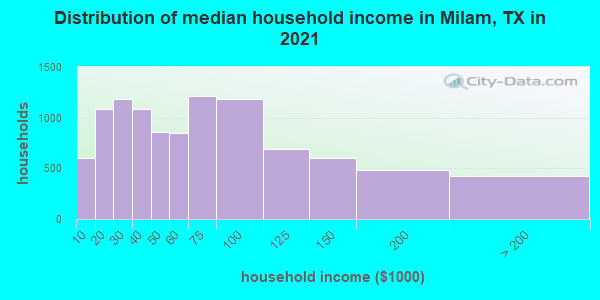
Estimated median household income in 2022: $56,399 ($33,186 in 1999)
| This county: | $56,399 |
| Texas: | $72,284 |
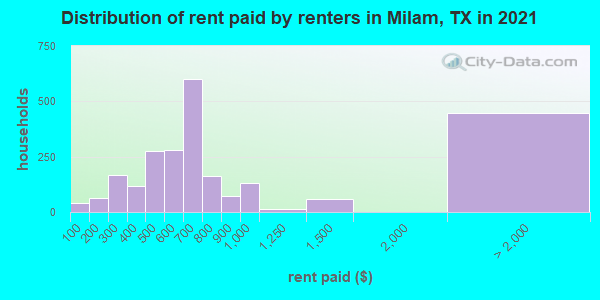
Median contract rent in 2022 for apartments: $672 (lower quartile is $494, upper quartile is $802)
| This county: | $672 |
| State: | $1117 |
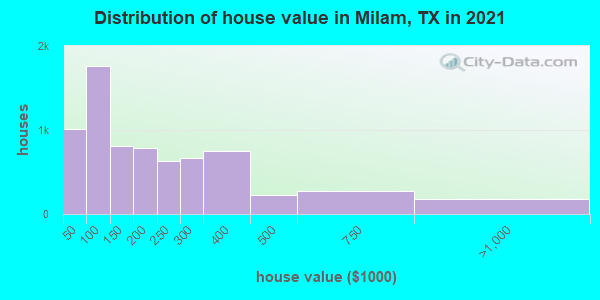
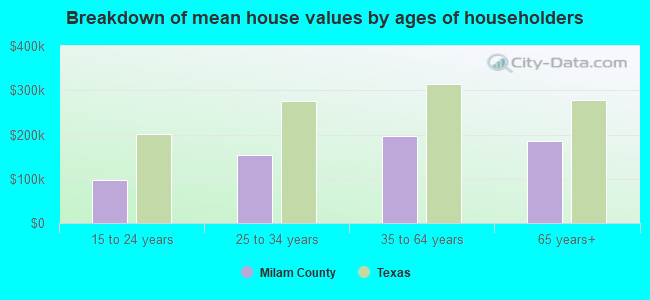
Estimated median house or condo value in 2022: $173,109 (it was $53,600 in 2000)
| Milam: | $173,109 |
| Texas: | $275,400 |
Mean price in 2022:
Median monthly housing costs for homes and condos with a mortgage: $1,365Detached houses: $243,915
Here: $243,915 State: $369,058 Townhouses or other attached units: $322,162
Here: $322,162 State: $327,631 Mobile homes: $134,751
Here: $134,751 State: $124,413 Occupied boats, RVs, vans, etc.: $26,568
Here: $26,568 State: $73,921
Median monthly housing costs for units without a mortgage: $478
Institutionalized population: 405
Crime in 2021 (reported by the sheriff's office or county police, not the county total):
- Murders: 1
- Rapes: 1
- Robberies: 1
- Assaults: 18
- Burglaries: 10
- Thefts: 28
- Auto thefts: 4
Crime in 2020 (reported by the sheriff's office or county police, not the county total):
- Murders: 0
- Rapes: 1
- Robberies: 1
- Assaults: 7
- Burglaries: 12
- Thefts: 44
- Auto thefts: 3
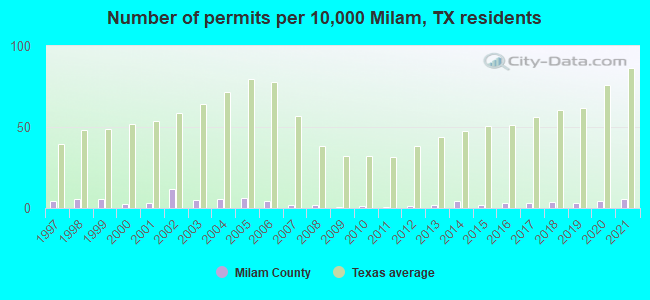
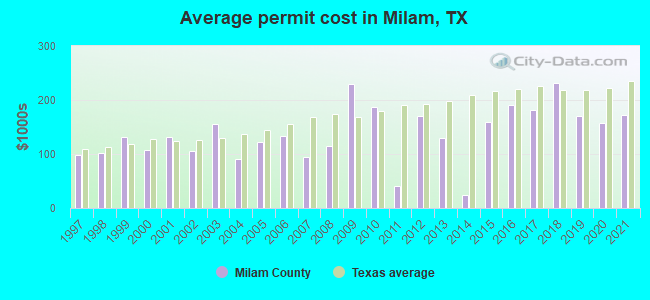
Single-family new house construction building permits:
- 2022: 36 buildings, average cost: $310,900
- 2021: 13 buildings, average cost: $171,700
- 2020: 11 buildings, average cost: $158,200
- 2019: 8 buildings, average cost: $171,300
- 2018: 9 buildings, average cost: $232,000
- 2017: 8 buildings, average cost: $180,900
- 2016: 7 buildings, average cost: $191,100
- 2015: 4 buildings, average cost: $160,200
- 2014: 10 buildings, average cost: $23,800
- 2013: 4 buildings, average cost: $129,700
- 2012: 3 buildings, average cost: $170,000
- 2011: 1 building, cost: $40,000
- 2010: 3 buildings, average cost: $187,000
- 2009: 2 buildings, average cost: $230,000
- 2008: 5 buildings, average cost: $114,000
- 2007: 5 buildings, average cost: $93,700
- 2006: 11 buildings, average cost: $134,000
- 2005: 15 buildings, average cost: $122,100
- 2004: 13 buildings, average cost: $90,100
- 2003: 12 buildings, average cost: $154,900
- 2002: 28 buildings, average cost: $105,700
- 2001: 7 buildings, average cost: $130,700
- 2000: 6 buildings, average cost: $108,300
- 1999: 13 buildings, average cost: $130,600
- 1998: 14 buildings, average cost: $101,300
- 1997: 10 buildings, average cost: $98,000
Median real estate property taxes paid for housing units with mortgages in 2022: $2,220 (1.0%)
Median real estate property taxes paid for housing units with no mortgage in 2022: $1,409 (1.0%)
| Milam County: | 14.3% |
| Texas: | 14.0% |
Median age of residents in 2022: 42.0 years old
(Males: 40.7 years old, Females: 43.2 years old)
(Median age for: White residents: 50.0 years old, Black residents: 28.9 years old, American Indian residents: 54.2 years old, Asian residents: 52.4 years old, Hispanic or Latino residents: 27.8 years old, Other race residents: 38.9 years old)
Fair market rent in 2006 for a 1-bedroom apartment in Milam County is $389 a month.
Fair market rent for a 2-bedroom apartment is $484 a month.
Fair market rent for a 3-bedroom apartment is $626 a month.
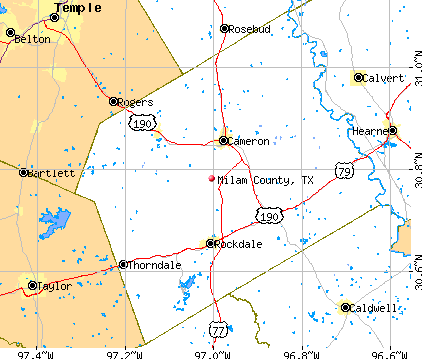
Cities in this county include: Cameron, Rockdale, Gause-Milano, Davilla, Thorndale, Burlington, Milano, Buckholts.
Notable locations in this county outside city limits:
Notable locations in Milam County: Carpenter Goat Windmill (A), Carpenter Windmill (B), Catclaw Windmill (C), Cherry Canyon Ranch (D), Company Windmill (E), Cowan Homestead (F), Cowden Ranch (G), Cracker Jack Windmill (H), Deer Camp (I), Dowman Windmill (J), Garden Windmill (K), Gearhart Ranch (L), Geronimo Windmills (M), Goat Mountain Windmill (N), Gomez Windmill (O), H O Canyon Windmill (P), Hereford Windmill (Q), High Lonesome Windmill (R), High Park Windmill (S), House Log Windmill (T). Display/hide their locations on the map
Cemetery: Pioneer Cemetery (1). Display/hide its location on the map
Lakes and reservoirs: Pine Peak Lake (A), T and P Lake (B), Blue Hole (C), Prude Tank (D), Pinto Bean Tank (E), Phillips Tank (F), Twomile Tank (G), Saint Augustine Tank (H). Display/hide their locations on the map
Streams, rivers, and creeks: Barillos Creek (A), Tally Slough (B), Cienega Creek (C), Chihuahua Creek (D), Cherry Creek (E), Lone Tree Creek (F), Right Hand Creek (G), Red Slough (H), Olds Creek (I). Display/hide their locations on the map
Park in Milam County: Davis Mountains State Park (1). Display/hide its location on the map
Neighboring counties: Brantley County, Georgia  , Jefferson County, Florida , Culberson County
  , El Paso County , Loving County , Montgomery County
  .
.
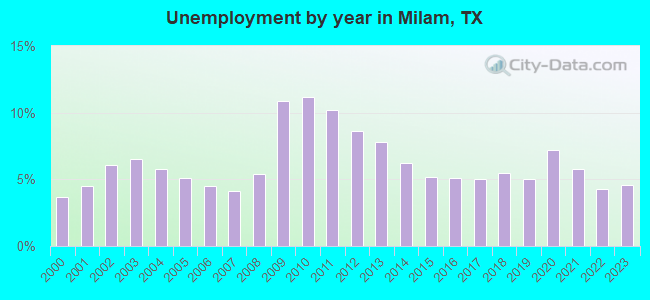
| Here: | 4.0% |
| Texas: | 3.5% |
Current college students: 647
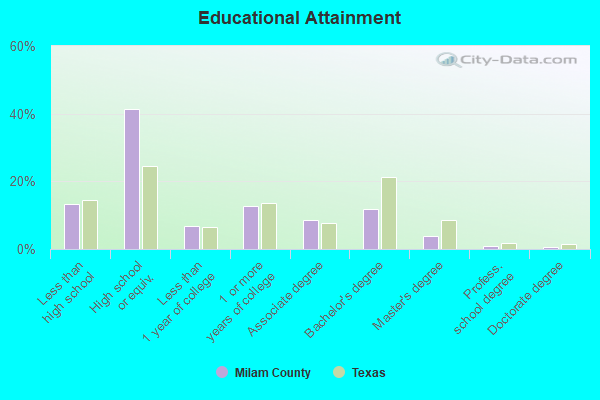
People 25 years of age or older with a high school degree or higher: 85.8%
People 25 years of age or older with a bachelor's degree or higher: 18.2%
Number of foreign born residents: 1,400 (43.2% naturalized citizens)
| Milam County: | 5.4% |
| Whole state: | 17.2% |
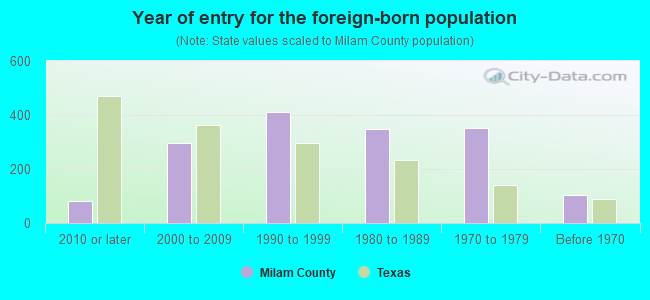
- Year of entry for the foreign-born population
- 2172010 or later
- 2842000 to 2009
- 4671990 to 1999
- 3501980 to 1989
- 3521970 to 1979
- 102Before 1970
Mean travel time to work (commute): minutes
Percentage of county residents living and working in this county: 99.2%
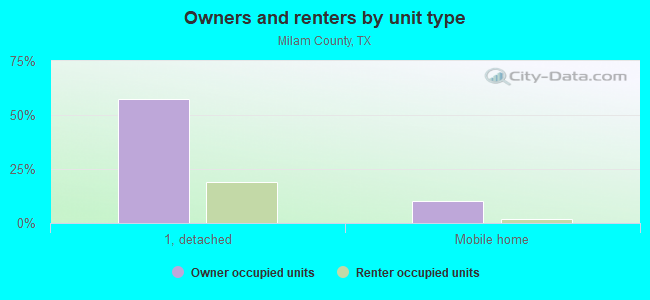
Housing units in structures:
- One, detached: 9,379
- One, attached: 38
- Two: 181
- 3 or 4: 253
- 5 to 9: 62
- 10 to 19: 89
- 20 to 49: 12
- 50 or more: 105
- Mobile homes: 1,760
- Boats, RVs, vans, etc.: 51
Housing units in Milam County with a mortgage: 2,930 (149 second mortgage, 24 home equity loan, 114 both second mortgage and home equity loan)
Houses without a mortgage: 39
| Here: | 4.9% with mortgage |
| State: | 98.4% with mortgage |
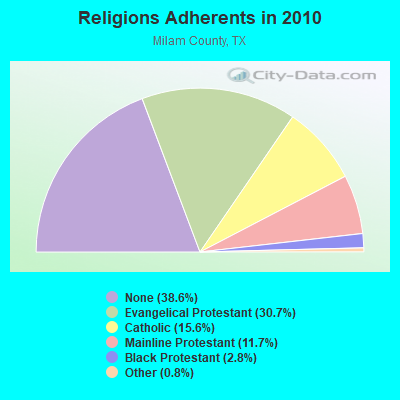
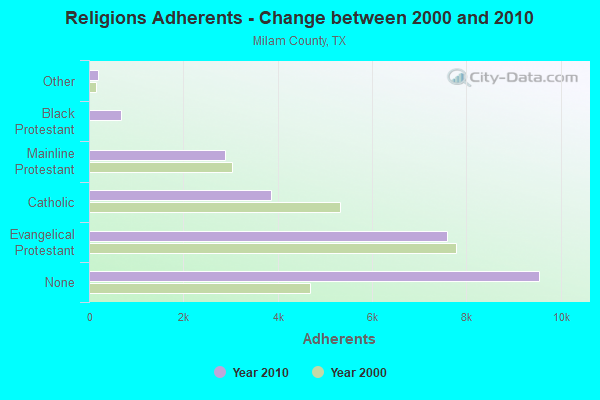
Religion statistics for Milam County
| Religion | Adherents | Congregations |
|---|---|---|
| Evangelical Protestant | 7,592 | 55 |
| Catholic | 3,853 | 4 |
| Mainline Protestant | 2,888 | 21 |
| Black Protestant | 686 | 5 |
| Other | 187 | 2 |
| None | 9,551 | - |
Source: Clifford Grammich, Kirk Hadaway, Richard Houseal, Dale E.Jones, Alexei Krindatch, Richie Stanley and Richard H.Taylor. 2012. 2010 U.S.Religion Census: Religious Congregations & Membership Study. Association of Statisticians of American Religious Bodies. Jones, Dale E., et al. 2002. Congregations and Membership in the United States 2000. Nashville, TN: Glenmary Research Center.
Food Environment Statistics:
| Milam County: | 2.42 / 10,000 pop. |
| State: | 1.47 / 10,000 pop. |
| This county: | 1.21 / 10,000 pop. |
| Texas: | 1.11 / 10,000 pop. |
| Milam County: | 4.44 / 10,000 pop. |
| Texas: | 3.95 / 10,000 pop. |
| This county: | 4.85 / 10,000 pop. |
| State: | 6.13 / 10,000 pop. |
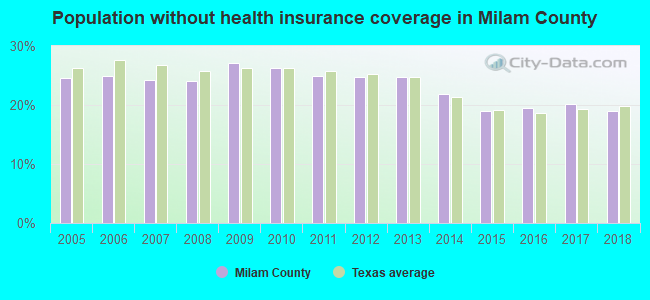
| Milam County: | 11.0% |
| Texas: | 8.9% |
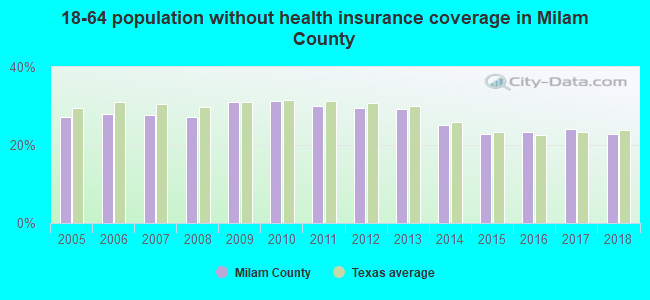
| Milam County: | 28.0% |
| State: | 26.6% |
| Here: | 18.7% |
| State: | 15.7% |
Agriculture in Milam County:
Average size of farms: 290 acresAverage value of agricultural products sold per farm: $36,338
Average value of crops sold per acre for harvested cropland: $138.15
The value of nursery, greenhouse, floriculture, and sod as a percentage of the total market value of agricultural products sold: 2.17%
The value of livestock, poultry, and their products as a percentage of the total market value of agricultural products sold: 75.60%
Average total farm production expenses per farm: $34,909
Harvested cropland as a percentage of land in farms: 22.16%
Irrigated harvested cropland as a percentage of land in farms: 1.95%
Average market value of all machinery and equipment per farm: $34,531
The percentage of farms operated by a family or individual: 94.48%
Average age of principal farm operators: 57 years
Average number of cattle and calves per 100 acres of all land in farms: 19.74
Milk cows as a percentage of all cattle and calves: 0.06%
Corn for grain: 57326 harvested acres
All wheat for grain: 3008 harvested acres
Upland cotton: 5482 harvested acres
Vegetables: 104 harvested acres
Land in orchards: 2,475 acres
Tornado activity:
Milam County historical area-adjusted tornado activity is significantly below Texas state average. It is 50591499.3 times below overall U.S. average.Earthquake activity:
Milam County-area historical earthquake activity is significantly above Texas state average. It is 16% smaller than the overall U.S. average.On 10/20/2011 at 12:24:41, a magnitude 4.8 (4.8 MW, Depth: 3.1 mi, Class: Light, Intensity: IV - V) earthquake occurred 147.3 miles away from Milam County center
On 6/16/1978 at 11:46:54, a magnitude 5.3 (4.4 MB, 4.6 UK, 5.3 ML, Class: Moderate, Intensity: VI - VII) earthquake occurred 270.1 miles away from the county center
On 5/17/2012 at 08:12:00, a magnitude 4.8 (4.8 MW, Depth: 3.1 mi) earthquake occurred 174.8 miles away from the county center
On 4/14/1995 at 00:32:56, a magnitude 5.7 (5.6 MB, 5.7 MS, 5.7 MW, Depth: 11.1 mi) earthquake occurred 380.5 miles away from the county center
On 4/9/1993 at 12:29:19, a magnitude 4.3 (4.1 MB, 4.3 LG, Depth: 3.1 mi) earthquake occurred 151.8 miles away from Milam County center
On 9/2/2013 at 23:51:15, a magnitude 4.3 (4.3 MW, Depth: 2.9 mi) earthquake occurred 171.2 miles away from the county center
Magnitude types: regional Lg-wave magnitude (LG), body-wave magnitude (MB), local magnitude (ML), surface-wave magnitude (MS), moment magnitude (MW)
Most recent natural disasters:
- Texas Covid-19 Pandemic, Incident Period: January 20, 2020, FEMA Id: 4485, Natural disaster type: Other
- Texas Hurricane Harvey, Incident Period: August 23, 2017 - September 15, 2017, FEMA Id: 4332, Natural disaster type: Hurricane
- Texas Severe Storms and Flooding, Incident Period: April 17, 2016 to April 30, 2016, Major Disaster (Presidential) Declared DR-4269: April 25, 2016, FEMA Id: 4269, Natural disaster type: Storm, Flood
- Texas Severe Storms, Tornadoes, Straight-line Winds, and Flooding, Incident Period: May 04, 2015 to June 23, 2015, Major Disaster (Presidential) Declared DR-4223: May 29, 2015, FEMA Id: 4223, Natural disaster type: Storm, Tornado, Flood, Wind
- Texas Hurricane Ike, Incident Period: September 07, 2008 to October 02, 2008, Major Disaster (Presidential) Declared DR-1791: September 13, 2008, FEMA Id: 1791, Natural disaster type: Hurricane
- Texas Wildfires, Incident Period: March 14, 2008 to September 01, 2008, Emergency Declared EM-3284: March 14, 2008, FEMA Id: 3284, Natural disaster type: Fire
- Texas Severe Storms, Tornadoes, and Flooding, Incident Period: June 16, 2007 to August 03, 2007, Major Disaster (Presidential) Declared DR-1709: June 29, 2007, FEMA Id: 1709, Natural disaster type: Storm, Tornado, Flood
- Texas Hurricane Rita, Incident Period: September 23, 2005 to October 14, 2005, Major Disaster (Presidential) Declared DR-1606: September 24, 2005, FEMA Id: 1606, Natural disaster type: Hurricane
- Texas Hurricane Rita, Incident Period: September 20, 2005 to October 14, 2005, Emergency Declared EM-3261: September 21, 2005, FEMA Id: 3261, Natural disaster type: Hurricane
- Texas Hurricane Katrina, Incident Period: August 29, 2005 to October 01, 2005, Emergency Declared EM-3216: September 02, 2005, FEMA Id: 3216, Natural disaster type: Hurricane
- 5 other natural disasters have been reported since 1953.
The number of natural disasters in Milam County (15) is near the US average (15).
Major Disasters (Presidential) Declared: 6
Emergencies Declared: 6
Causes of natural disasters: Hurricanes: 5, Fires: 4, Storms: 4, Floods: 3, Tornadoes: 2, Wind: 1, Other: 2 (Note: some incidents may be assigned to more than one category).
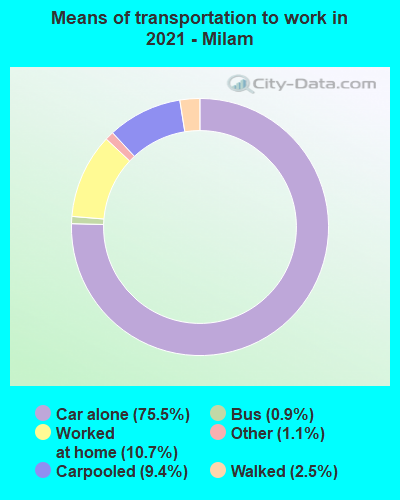
Means of transportation to work:
- Drove a car alone: 5,069 (72.6%)
- Carpooled: 511 (7.3%)
- Taxicab, motorcycle, or other means: 167 (2.4%)
- Walked: 228 (3.3%)
- Worked at home: 1,023 (14.6%)
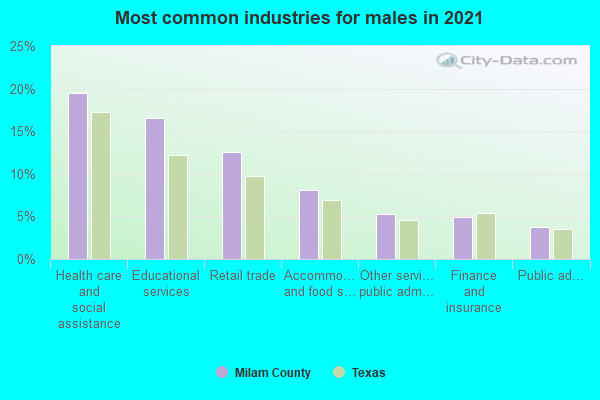
- Health care and social assistance (21%)
- Educational services (16%)
- Retail trade (13%)
- Other services, except public administration (7%)
- Accommodation and food services (6%)
- Finance and insurance (3%)
- Public administration (3%)

- Health care and social assistance (25%)
- Educational services (19%)
- Retail trade (15%)
- Other services, except public administration (8%)
- Accommodation and food services (7%)
- Finance and insurance (4%)
- Public administration (4%)
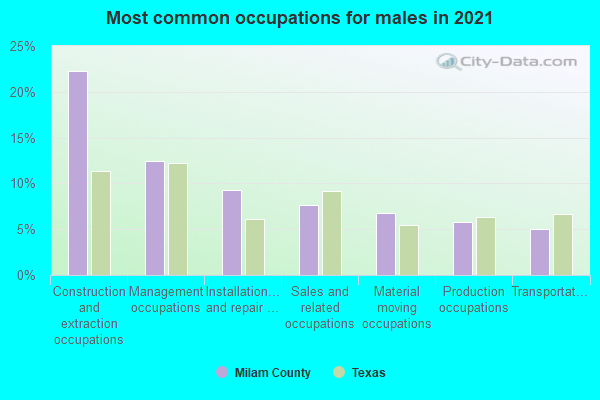
- Construction and extraction occupations (22%)
- Management occupations (12%)
- Installation, maintenance, and repair occupations (9%)
- Sales and related occupations (8%)
- Production occupations (8%)
- Material moving occupations (6%)
- Architecture and engineering occupations (5%)
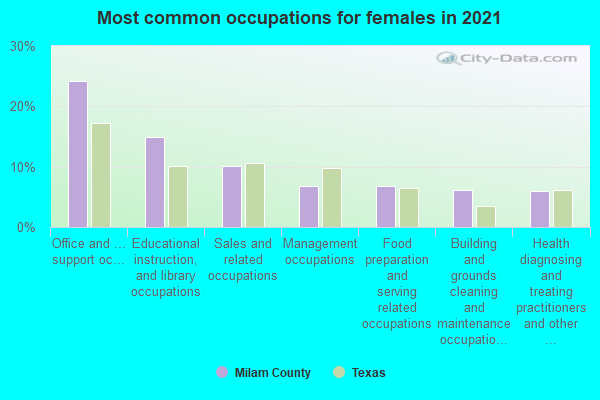
- Office and administrative support occupations (25%)
- Educational instruction, and library occupations (15%)
- Sales and related occupations (10%)
- Food preparation and serving related occupations (7%)
- Health diagnosing and treating practitioners and other technical occupations (6%)
- Management occupations (6%)
- Healthcare support occupations (5%)
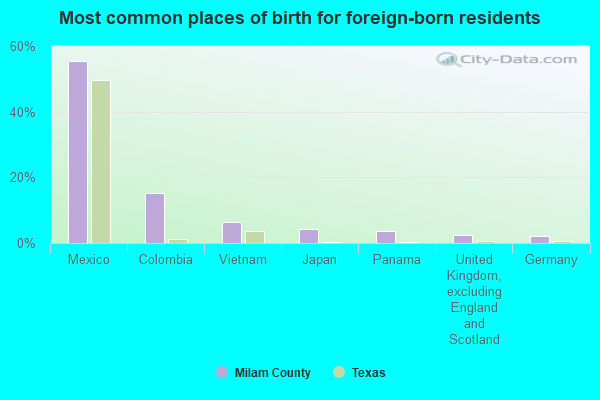
- Mexico (66%)
- Colombia (12%)
- Vietnam (3%)
- Guatemala (3%)
- Panama (3%)
- Malaysia (2%)
- United Kingdom, excluding England and Scotland (2%)
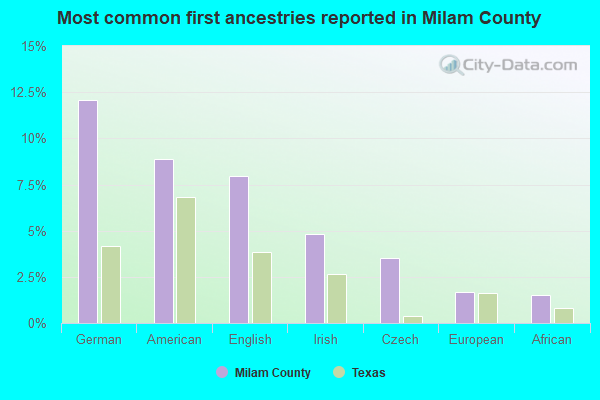
- American (12%)
- German (12%)
- English (9%)
- Irish (5%)
- Czech (3%)
- European (2%)
- African (2%)
People in group quarters in Milam County, Texas in 2010:
- 225 people in nursing facilities/skilled-nursing facilities
- 86 people in local jails and other municipal confinement facilities
- 59 people in correctional facilities intended for juveniles
- 35 people in residential treatment centers for juveniles (non-correctional)
People in group quarters in Milam County, Texas in 2000:
- 326 people in nursing homes
- 57 people in unknown juvenile institutions
- 44 people in local jails and other confinement facilities (including police lockups)
- 4 people in hospitals/wards and hospices for chronically ill
- 4 people in other hospitals or wards for chronically ill
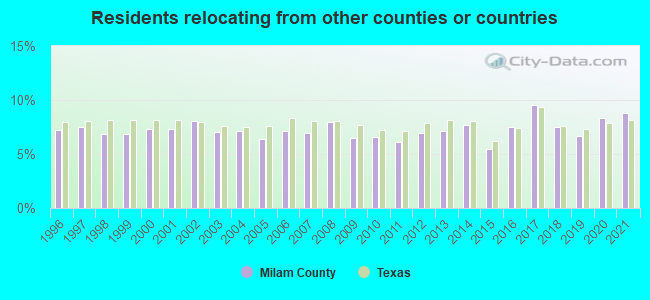
8.81% of this county's 2021 resident taxpayers lived in other counties in 2020 ($67,505 average adjusted gross income)
| Here: | 8.81% |
| Texas average: | 8.12% |
10 or fewer of this county's residents moved from foreign countries.
7.68% relocated from other counties in Texas ($59,484 average AGI)
1.13% relocated from other states ($8,021 average AGI)
Milam County: 1.13% Texas average: 2.83%
Top counties from which taxpayers relocated into this county between 2020 and 2021:
| from Williamson County, TX | |
| from Travis County, TX | |
| from Bell County, TX | |
| from Harris County, TX | |
| from Brazos County, TX |
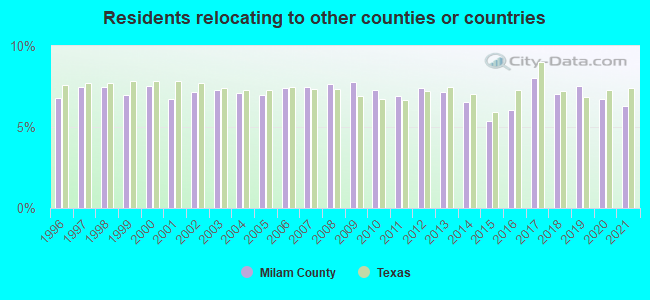
6.32% of this county's 2020 resident taxpayers moved to other counties in 2021 ($51,937 average adjusted gross income)
| Here: | 6.32% |
| Texas average: | 7.40% |
10 or fewer of this county's residents moved to foreign countries.
5.62% relocated to other counties in Texas ($43,266 average AGI)
0.70% relocated to other states ($8,669 average AGI)
Milam County: 0.70% Texas average: 2.08%
Top counties to which taxpayers relocated from this county between 2020 and 2021:
| to Bell County, TX | |
| to Williamson County, TX | |
| to Travis County, TX | |
| to Brazos County, TX |
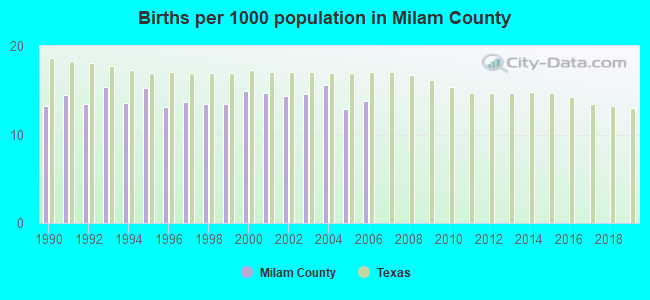
Births per 1000 population from 1990 to 1999: 13.9
Births per 1000 population from 2000 to 2006: 14.4
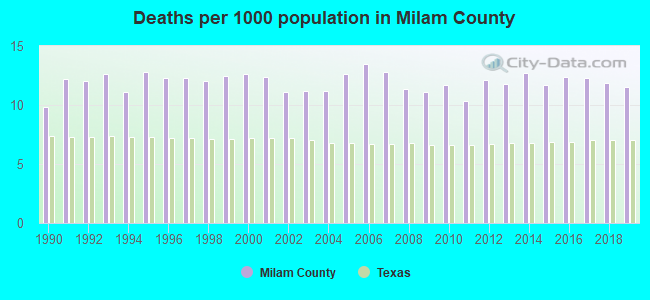
Deaths per 1000 population from 1990 to 1999: 12.0
Deaths per 1000 population from 2000 to 2009: 12.0
Deaths per 1000 population from 2010 to 2020: 11.9
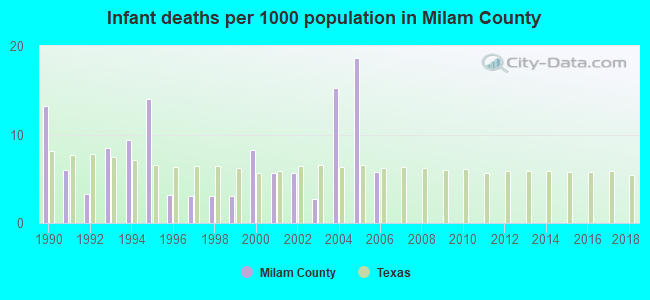
Infant deaths per 1000 live births from 1990 to 1999: 6.7
Infant deaths per 1000 live births from 2000 to 2006: 8.8
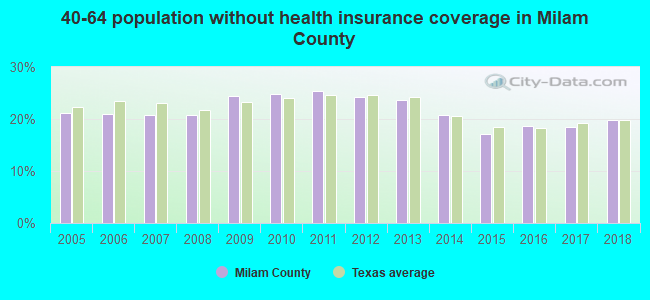
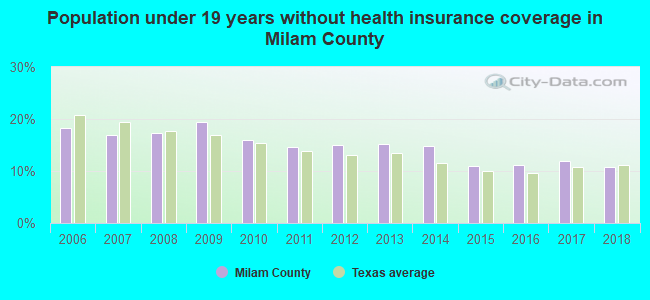
Persons under 19 years old without health insurance coverage in 2018: 10.8%
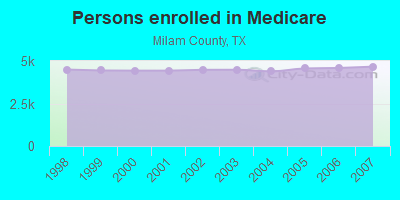
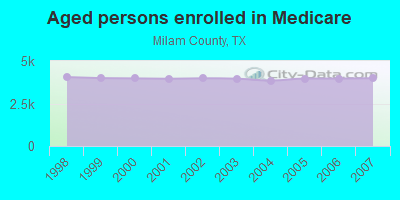
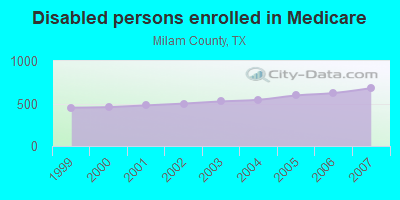
Persons enrolled in hospital insurance and/or supplemental medical insurance (Medicare) in July 1, 2007: 4,668 (3,987 aged, 681 disabled)
Children under 18 without health insurance coverage in 2007: 1,040 (16%)
Most common underlying causes of death in Milam County, Texas in 1999 - 2019:
- Acute myocardial infarction, unspecified (364)
- Bronchus or lung, unspecified - Malignant neoplasms (351)
- Atherosclerotic heart disease (272)
- Alzheimer disease, unspecified (245)
- Chronic obstructive pulmonary disease, unspecified (176)
- Stroke, not specified as haemorrhage or infarction (108)
- Other ill-defined and unspecified causes of mortality (98)
- Atherosclerotic cardiovascular disease, so described (78)
- Unspecified dementia (76)
- Congestive heart failure (65)
Population without health insurance coverage in 2000: 19%
Children under 18 without health insurance coverage in 2000: 19%
Short term general hospital admissions per 100,000 population in 2004: 7,550
Short term general hospital beds per 100,000 population in 2004: 234
Emergency room visits per 100,000 population in 2004: 39,938
General practice office based MDs per 100,000 population in 2005: 1,649
Medical specialist MDs per 100,000 population in 2005: 1,207
Dentists per 100,000 population in 1998: 4
Total births per 100,000 population, July 2005 - July 2006 : 21
Total deaths per 100,000 population, July 2005 - July 2006: 55
Limited-service eating places per 100,000 population in 2005 : 8
Suicides per 1,000,000 population from 2000 to 2006: 121.4. This is more than state average.
Household type by relationship:
Households: 25,754- Male householders: 5,217 (1,683 living alone), Female householders: 5,105 (1,393 living alone)
5,060 spouses (5,008 opposite-sex spouses), 578 unmarried partners, (547 opposite-sex unmarried partners), 7,421 children (6,955 natural, 182 adopted, 283 stepchildren), 1,079 grandchildren, 175 brothers or sisters, 176 parents, 17 foster children, 315 other relatives, 225 non-relatives
- In group quarters: 510
Size of family households: 3,368 2-persons, 1,312 3-persons, 1,088 4-persons, 611 5-persons, 260 6-persons, 150 7-or-more-persons.
Size of nonfamily households: 3,078 1-person, 405 2-persons, 70 3-persons.
3,861 married couples with children.
1,095 single-parent households (307 men, 788 women).
83.2% of residents of Milam speak English at home.
16.3% of residents speak Spanish at home (56% speak English very well, 23% speak English well, 13% speak English not well, 8% don't speak English at all).
0.3% of residents speak other Indo-European language at home (90% speak English very well, 10% speak English well).
0.4% of residents speak Asian or Pacific Island language at home (71% speak English very well, 29% speak English not well).
0.1% of residents speak other language at home (100% speak English very well).
In fiscal year 2004:
Federal Government expenditure: $148,803,000 ($5,904 per capita)
Department of Defense expenditure: $3,303,000
Federal direct payments to individuals for retirement and disability: $66,464,000
Federal other direct payments to individuals: $29,291,000
Federal direct payments not to individuals: $6,622,000
Federal grants: $42,004,000
Federal procurement contracts: $1,118,000 ($281,000 Department of Defense)
Federal salaries and wages: $3,304,000 ($0,000 Department of Defense)
Federal Government direct loans: $1,086,000
Federal guaranteed/insured loans: $6,631,000
Federal Government insurance: $12,479,000
Population change from April 1, 2000 to July 1, 2005:
Births: 1,916| Here: | 76 per 1000 residents |
| State: | 85 per 1000 residents |
Deaths: 1,496
| Here: | 59 per 1000 residents |
| State: | 35 per 1000 residents |
Net international migration: +159
| Here: | +6 per 1000 residents |
| State: | +29 per 1000 residents |
Net internal migration: +574
| Here: | +23 per 1000 residents |
| State: | +10 per 1000 residents |
Total withdrawal of fresh water for public supply: 2.95 millions of gallons per day (94% from ground, 6% from surface)
| Here: | 5.9 |
| State: | 6.3 |
| Here: | 4.5 |
| State: | 4.0 |
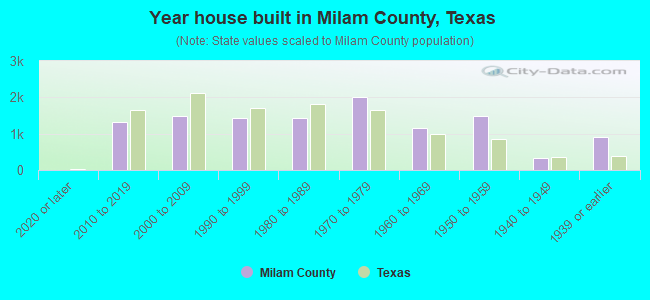
- Year house built in Milam County, Texas
- 312020 or later
- 1,4932010 to 2019
- 1,7762000 to 2009
- 1,0151990 to 1999
- 1,4431980 to 1989
- 2,1031970 to 1979
- 9261960 to 1969
- 1,5481950 to 1959
- 3151940 to 1949
- 9211939 or earlier
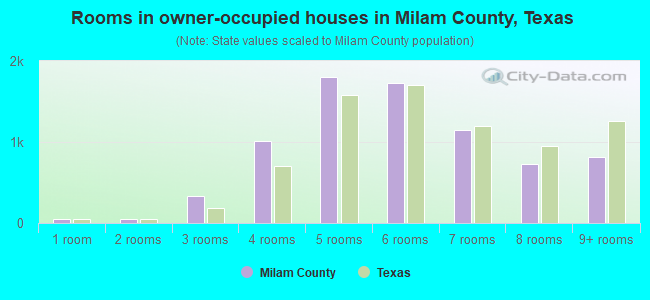
- Rooms in owner-occupied houses in Milam County, Texas
- 1551 room
- 762 rooms
- 3363 rooms
- 9574 rooms
- 1,7115 rooms
- 1,9176 rooms
- 1,2557 rooms
- 8248 rooms
- 6759+ rooms
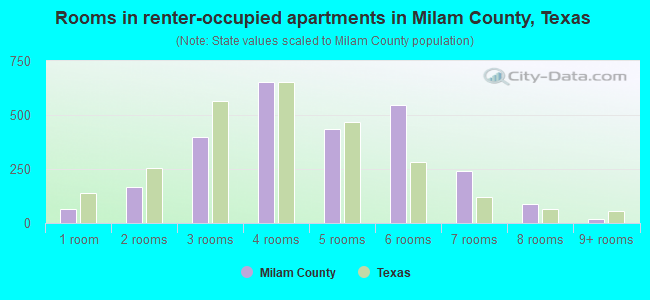
- Rooms in renter-occupied apartments in Milam County, Texas
- 731 room
- 982 rooms
- 3523 rooms
- 6444 rooms
- 3235 rooms
- 6366 rooms
- 2037 rooms
- 468 rooms
- 229+ rooms
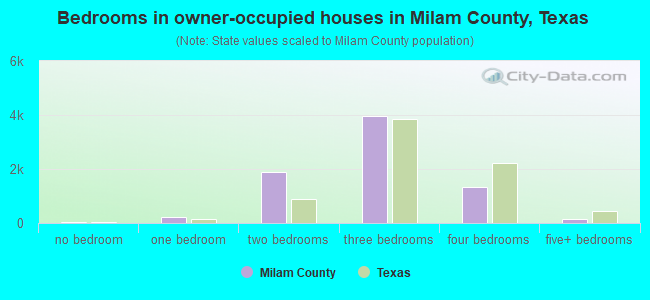
- Bedrooms in owner-occupied houses in Milam County, Texas
- 172no bedroom
- 2351 bedroom
- 1,7802 bedrooms
- 4,1903 bedrooms
- 1,3544 bedrooms
- 1265+ bedrooms
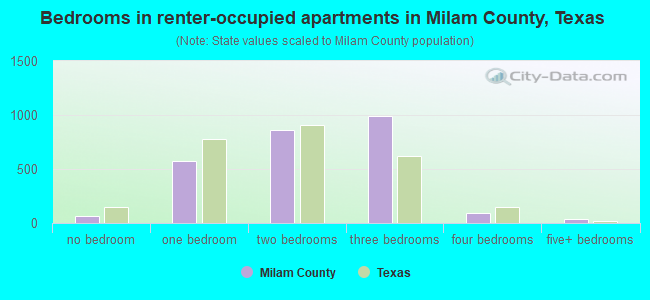
- Bedrooms in renter-occupied apartments in Milam County, Texas
- 72no bedroom
- 3841 bedroom
- 8342 bedrooms
- 9893 bedrooms
- 1364 bedrooms
- 05+ bedrooms
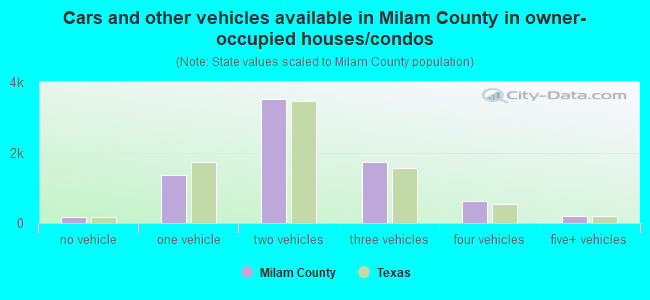
- Cars and other vehicles available in Milam County in owner-occupied houses/condos
- 210no vehicle
- 1,5381 vehicle
- 3,6342 vehicles
- 1,6923 vehicles
- 5574 vehicles
- 2445+ vehicles
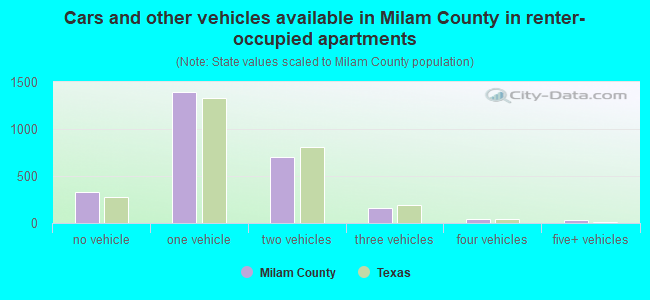
- Cars and other vehicles available in Milam County in renter-occupied apartments
- 222no vehicle
- 1,4001 vehicle
- 6292 vehicles
- 1263 vehicles
- 444 vehicles
- 355+ vehicles
89.7% of Milam County residents lived in the same house 1 years ago.
Out of people who lived in different houses, 25% lived in this county.
Out of people who lived in different counties, 71% lived in Texas.
| Milam County: | 89.7% |
| State average: | 85.7% |
Place of birth for U.S.-born residents:
- This state: 19,594
- Other state: 4,268
- Northeast: 628
- Midwest: 846
- South: 1,299
- West: 1,512
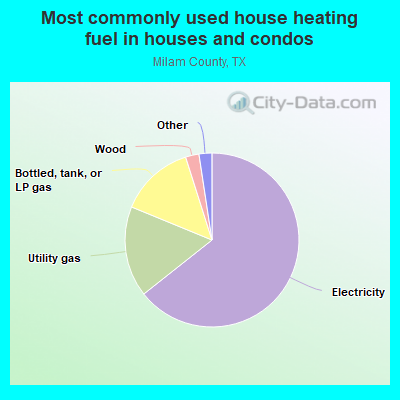
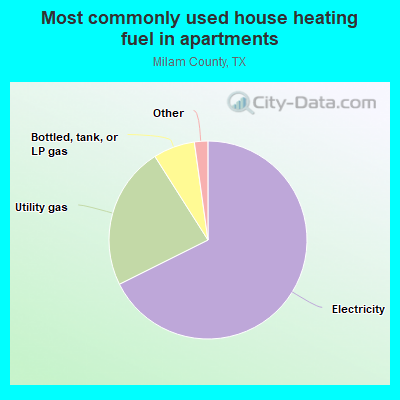
- 61.6%Electricity
- 18.9%Utility gas
- 14.0%Bottled, tank, or LP gas
- 2.5%Wood
- 1.3%Other fuel
- 0.9%Fuel oil, kerosene, etc.
- 0.7%No fuel used
- 70.2%Electricity
- 19.1%Utility gas
- 5.5%Bottled, tank, or LP gas
- 2.6%Other fuel
- 1.7%No fuel used
- 0.5%Fuel oil, kerosene, etc.
- 0.4%Wood
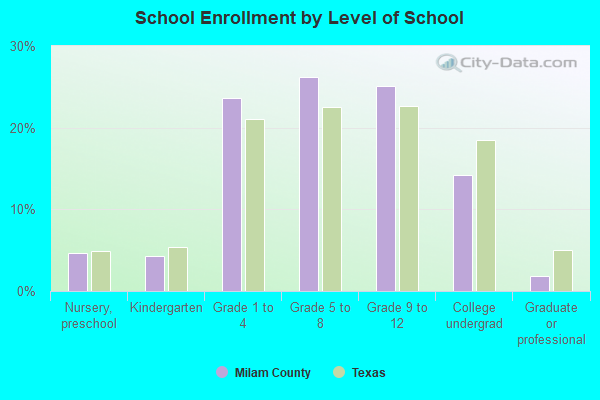
Private vs. public school enrollment:
| Here: | 9.8% |
| Texas: | 8.8% |
| Here: | 7.4% |
| Texas: | 8.0% |
| Here: | 26.1% |
| Texas: | 16.2% |
Milam County government finances - Expenditure in 2017:
- Bond Funds - Cash and Securities: $32,000
- Charges - Other: $1,562,000
Air Transportation: $1,088,000
Solid Waste Management: $754,000
Other: $1,000
- Construction - Air Transportation: $713,000
- Current Operations - Regular Highways: $5,459,000
Correctional Institutions: $3,465,000
Judicial and Legal Services: $2,332,000
Judicial and Legal Services: $2,230,000
Police Protection: $1,991,000
General - Other: $1,600,000
Police Protection: $1,558,000
Corrections - Other: $1,328,000
Regular Highways: $1,214,000
Correctional Institutions: $1,197,000
General - Other: $1,122,000
Financial Administration: $1,054,000
Central Staff Services: $1,044,000
Solid Waste Management: $784,000
Public Welfare, Vendor Payments for Medical Care: $584,000
Air Transportation: $541,000
General Public Buildings: $527,000
Health - Other: $515,000
Central Staff Services: $450,000
Corrections - Other: $203,000
Natural Resources - Other: $135,000
Local Fire Protection: $123,000
Parks and Recreation: $59,000
Natural Resources - Other: $42,000
Financial Administration: $33,000
Parks and Recreation: $31,000
Public Welfare - Other: $19,000
Libraries: $11,000
Health - Other: $9,000
- General - Interest on Debt: $290,000
Interest on Debt: $42,000
- Long Term Debt - Beginning Outstanding - Unspecified Public Purpose: $6,383,000
Outstanding Unspecified Public Purpose: $5,934,000
Beginning Outstanding - Unspecified Public Purpose: $831,000
Outstanding Unspecified Public Purpose: $620,000
Retired Unspecified Public Purpose: $449,000
Retired Unspecified Public Purpose: $211,000
- Miscellaneous - Fines and Forfeits: $1,463,000
General Revenue - Other: $303,000
Interest Earnings: $132,000
General Revenue - Other: $105,000
Interest Earnings: $89,000
Sale of Property: $72,000
Fines and Forfeits: $32,000
Donations From Private Sources: $22,000
Sale of Property: $3,000
- Other Capital Outlay - Solid Waste Management: $163,000
Police Protection: $123,000
Regular Highways: $111,000
General - Other: $77,000
Correctional Institutions: $35,000
General - Other: $31,000
Regular Highways: $24,000
- Other Funds - Cash and Securities: $9,591,000
Cash and Securities: $8,236,000
- Sinking Funds - Cash and Securities: $742,000
Cash and Securities: $93,000
- State Intergovernmental - Other: $1,070,000
Other: $737,000
General Local Government Support: $131,000
General Local Government Support: $128,000
Highways: $98,000
Highways: $50,000
Health and Hospitals: $44,000
- Tax - Property: $13,411,000
Property: $5,202,000
General Sales and Gross Receipts: $1,984,000
General Sales and Gross Receipts: $1,391,000
Motor Vehicle License: $986,000
Other Selective Sales: $35,000
- Total Salaries and Wages: $6,311,000
: $355,000
Milam County government finances - Revenue in 2017:
- Bond Funds - Cash and Securities: $32,000
- Charges - Other: $1,562,000
Air Transportation: $1,088,000
Solid Waste Management: $754,000
Other: $1,000
- Construction - Air Transportation: $713,000
- Current Operations - Regular Highways: $5,459,000
Correctional Institutions: $3,465,000
Judicial and Legal Services: $2,332,000
Judicial and Legal Services: $2,230,000
Police Protection: $1,991,000
General - Other: $1,600,000
Police Protection: $1,558,000
Corrections - Other: $1,328,000
Regular Highways: $1,214,000
Correctional Institutions: $1,197,000
General - Other: $1,122,000
Financial Administration: $1,054,000
Central Staff Services: $1,044,000
Solid Waste Management: $784,000
Public Welfare, Vendor Payments for Medical Care: $584,000
Air Transportation: $541,000
General Public Buildings: $527,000
Health - Other: $515,000
Central Staff Services: $450,000
Corrections - Other: $203,000
Natural Resources - Other: $135,000
Local Fire Protection: $123,000
Parks and Recreation: $59,000
Natural Resources - Other: $42,000
Financial Administration: $33,000
Parks and Recreation: $31,000
Public Welfare - Other: $19,000
Libraries: $11,000
Health - Other: $9,000
- General - Interest on Debt: $290,000
Interest on Debt: $42,000
- Long Term Debt - Beginning Outstanding - Unspecified Public Purpose: $6,383,000
Outstanding Unspecified Public Purpose: $5,934,000
Beginning Outstanding - Unspecified Public Purpose: $831,000
Outstanding Unspecified Public Purpose: $620,000
Retired Unspecified Public Purpose: $449,000
Retired Unspecified Public Purpose: $211,000
- Miscellaneous - Fines and Forfeits: $1,463,000
General Revenue - Other: $303,000
Interest Earnings: $132,000
General Revenue - Other: $105,000
Interest Earnings: $89,000
Sale of Property: $72,000
Fines and Forfeits: $32,000
Donations From Private Sources: $22,000
Sale of Property: $3,000
- Other Capital Outlay - Solid Waste Management: $163,000
Police Protection: $123,000
Regular Highways: $111,000
General - Other: $77,000
Correctional Institutions: $35,000
General - Other: $31,000
Regular Highways: $24,000
- Other Funds - Cash and Securities: $9,591,000
Cash and Securities: $8,236,000
- Sinking Funds - Cash and Securities: $742,000
Cash and Securities: $93,000
- State Intergovernmental - Other: $1,070,000
Other: $737,000
General Local Government Support: $131,000
General Local Government Support: $128,000
Highways: $98,000
Highways: $50,000
Health and Hospitals: $44,000
- Tax - Property: $13,411,000
Property: $5,202,000
General Sales and Gross Receipts: $1,984,000
General Sales and Gross Receipts: $1,391,000
Motor Vehicle License: $986,000
Other Selective Sales: $35,000
- Total Salaries and Wages: $6,311,000
: $355,000
Milam County government finances - Debt in 2017:
- Bond Funds - Cash and Securities: $32,000
- Charges - Other: $1,562,000
Air Transportation: $1,088,000
Solid Waste Management: $754,000
Other: $1,000
- Construction - Air Transportation: $713,000
- Current Operations - Regular Highways: $5,459,000
Correctional Institutions: $3,465,000
Judicial and Legal Services: $2,332,000
Judicial and Legal Services: $2,230,000
Police Protection: $1,991,000
General - Other: $1,600,000
Police Protection: $1,558,000
Corrections - Other: $1,328,000
Regular Highways: $1,214,000
Correctional Institutions: $1,197,000
General - Other: $1,122,000
Financial Administration: $1,054,000
Central Staff Services: $1,044,000
Solid Waste Management: $784,000
Public Welfare, Vendor Payments for Medical Care: $584,000
Air Transportation: $541,000
General Public Buildings: $527,000
Health - Other: $515,000
Central Staff Services: $450,000
Corrections - Other: $203,000
Natural Resources - Other: $135,000
Local Fire Protection: $123,000
Parks and Recreation: $59,000
Natural Resources - Other: $42,000
Financial Administration: $33,000
Parks and Recreation: $31,000
Public Welfare - Other: $19,000
Libraries: $11,000
Health - Other: $9,000
- General - Interest on Debt: $290,000
Interest on Debt: $42,000
- Long Term Debt - Beginning Outstanding - Unspecified Public Purpose: $6,383,000
Outstanding Unspecified Public Purpose: $5,934,000
Beginning Outstanding - Unspecified Public Purpose: $831,000
Outstanding Unspecified Public Purpose: $620,000
Retired Unspecified Public Purpose: $449,000
Retired Unspecified Public Purpose: $211,000
- Miscellaneous - Fines and Forfeits: $1,463,000
General Revenue - Other: $303,000
Interest Earnings: $132,000
General Revenue - Other: $105,000
Interest Earnings: $89,000
Sale of Property: $72,000
Fines and Forfeits: $32,000
Donations From Private Sources: $22,000
Sale of Property: $3,000
- Other Capital Outlay - Solid Waste Management: $163,000
Police Protection: $123,000
Regular Highways: $111,000
General - Other: $77,000
Correctional Institutions: $35,000
General - Other: $31,000
Regular Highways: $24,000
- Other Funds - Cash and Securities: $9,591,000
Cash and Securities: $8,236,000
- Sinking Funds - Cash and Securities: $742,000
Cash and Securities: $93,000
- State Intergovernmental - Other: $1,070,000
Other: $737,000
General Local Government Support: $131,000
General Local Government Support: $128,000
Highways: $98,000
Highways: $50,000
Health and Hospitals: $44,000
- Tax - Property: $13,411,000
Property: $5,202,000
General Sales and Gross Receipts: $1,984,000
General Sales and Gross Receipts: $1,391,000
Motor Vehicle License: $986,000
Other Selective Sales: $35,000
- Total Salaries and Wages: $6,311,000
: $355,000
Milam County government finances - Cash and Securities in 2017:
- Bond Funds - Cash and Securities: $32,000
- Charges - Other: $1,562,000
Air Transportation: $1,088,000
Solid Waste Management: $754,000
Other: $1,000
- Construction - Air Transportation: $713,000
- Current Operations - Regular Highways: $5,459,000
Correctional Institutions: $3,465,000
Judicial and Legal Services: $2,332,000
Judicial and Legal Services: $2,230,000
Police Protection: $1,991,000
General - Other: $1,600,000
Police Protection: $1,558,000
Corrections - Other: $1,328,000
Regular Highways: $1,214,000
Correctional Institutions: $1,197,000
General - Other: $1,122,000
Financial Administration: $1,054,000
Central Staff Services: $1,044,000
Solid Waste Management: $784,000
Public Welfare, Vendor Payments for Medical Care: $584,000
Air Transportation: $541,000
General Public Buildings: $527,000
Health - Other: $515,000
Central Staff Services: $450,000
Corrections - Other: $203,000
Natural Resources - Other: $135,000
Local Fire Protection: $123,000
Parks and Recreation: $59,000
Natural Resources - Other: $42,000
Financial Administration: $33,000
Parks and Recreation: $31,000
Public Welfare - Other: $19,000
Libraries: $11,000
Health - Other: $9,000
- General - Interest on Debt: $290,000
Interest on Debt: $42,000
- Long Term Debt - Beginning Outstanding - Unspecified Public Purpose: $6,383,000
Outstanding Unspecified Public Purpose: $5,934,000
Beginning Outstanding - Unspecified Public Purpose: $831,000
Outstanding Unspecified Public Purpose: $620,000
Retired Unspecified Public Purpose: $449,000
Retired Unspecified Public Purpose: $211,000
- Miscellaneous - Fines and Forfeits: $1,463,000
General Revenue - Other: $303,000
Interest Earnings: $132,000
General Revenue - Other: $105,000
Interest Earnings: $89,000
Sale of Property: $72,000
Fines and Forfeits: $32,000
Donations From Private Sources: $22,000
Sale of Property: $3,000
- Other Capital Outlay - Solid Waste Management: $163,000
Police Protection: $123,000
Regular Highways: $111,000
General - Other: $77,000
Correctional Institutions: $35,000
General - Other: $31,000
Regular Highways: $24,000
- Other Funds - Cash and Securities: $9,591,000
Cash and Securities: $8,236,000
- Sinking Funds - Cash and Securities: $742,000
Cash and Securities: $93,000
- State Intergovernmental - Other: $1,070,000
Other: $737,000
General Local Government Support: $131,000
General Local Government Support: $128,000
Highways: $98,000
Highways: $50,000
Health and Hospitals: $44,000
- Tax - Property: $13,411,000
Property: $5,202,000
General Sales and Gross Receipts: $1,984,000
General Sales and Gross Receipts: $1,391,000
Motor Vehicle License: $986,000
Other Selective Sales: $35,000
- Total Salaries and Wages: $6,311,000
: $355,000
Supplemental Security Income (SSI) in 2006:
- Total number of recipients: 713
- Number of aged recipients: 151
- Number of blind and disabled recipients: 562
- Number of recipients under 18: 104
- Number of recipients between 18 and 64: 371
- Number of recipients older than 64: 238
- Number of recipients also receiving OASDI: 324
- Amount of payments (thousands of dollars): 289
| Most common first names in Milam County, TX among deceased individuals | ||
| Name | Count | Lived (average) |
|---|---|---|
| John | 221 | 77.5 years |
| Mary | 184 | 80.2 years |
| William | 182 | 76.0 years |
| James | 153 | 72.5 years |
| Willie | 120 | 78.7 years |
| Annie | 106 | 83.7 years |
| Robert | 102 | 73.4 years |
| Joe | 98 | 76.9 years |
| Frank | 98 | 79.6 years |
| Henry | 76 | 76.3 years |
| Most common last names in Milam County, TX among deceased individuals | ||
| Last name | Count | Lived (average) |
|---|---|---|
| Smith | 99 | 75.3 years |
| Williams | 98 | 78.7 years |
| Johnson | 66 | 78.9 years |
| Jones | 52 | 74.6 years |
| Brown | 48 | 73.8 years |
| Davis | 45 | 74.9 years |
| Miller | 41 | 75.3 years |
| Morgan | 40 | 78.2 years |
| Wilson | 35 | 80.3 years |
| Moore | 33 | 75.5 years |
| Businesses in Milam County, TX | ||||
| Name | Count | Name | Count | |
|---|---|---|---|---|
| Best Western | 1 | McDonald's | 1 | |
| CVS | 1 | Nike | 1 | |
| Chevrolet | 1 | Pizza Hut | 2 | |
| Dairy Queen | 1 | RadioShack | 1 | |
| Days Inn | 1 | SONIC Drive-In | 2 | |
| FedEx | 3 | Subway | 2 | |
| Ford | 1 | True Value | 1 | |
| H&R Block | 2 | U-Haul | 1 | |
| Jimmy Jazz | 1 | UPS | 2 | |
| La-Z-Boy | 2 | Walmart | 1 | |