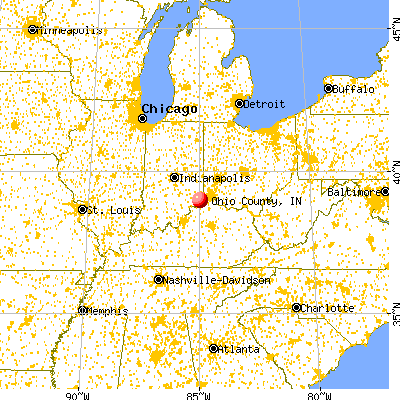
Ohio County, Indiana (IN)
County owner-occupied free and clear houses and condos in 2010: 547
County owner-occupied houses and condos in 2000: 1,709
Renter-occupied apartments: 611 (it was 492 in 2000)
| % of renters here: | 22% |
| State: | 30% |
Land area: 87 sq. mi.
Water area: 0.7 sq. mi.
Population density: 69 people per square mile (average).
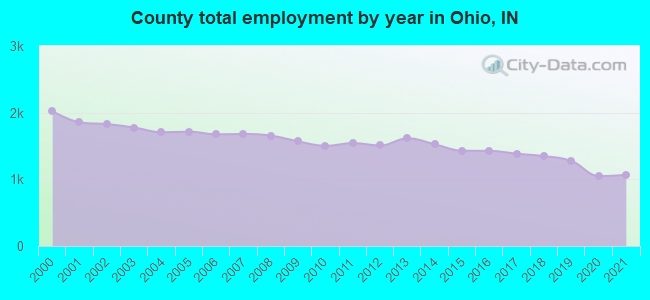
Industries providing employment: Educational, health and social services (24.1%), Manufacturing (20.4%), Construction (12.0%).
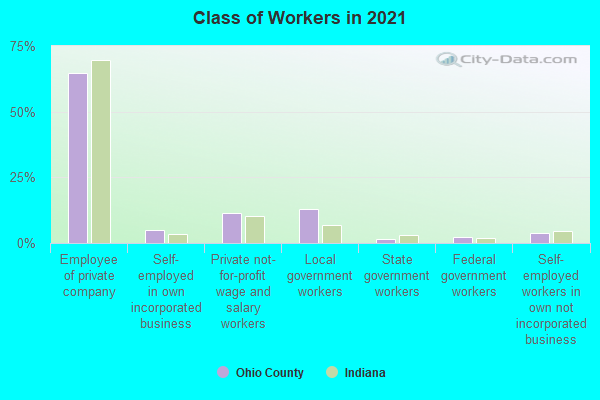
Type of workers:
- Private wage or salary: 80%
- Government: 15%
- Self-employed, not incorporated: 4%
- Unpaid family work: 0%
- OSM Map
- General Map
- Google Map
- MSN Map


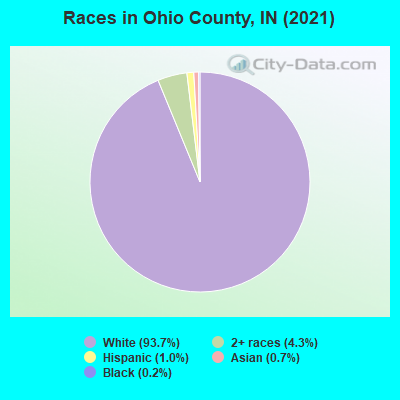
- 5,61293.6%White Non-Hispanic Alone
- 3085.1%Two or more races
- 290.5%American Indian and Alaska Native alone
- 260.4%Asian alone
- 170.3%Black Non-Hispanic Alone
- 40.07%Some other race alone
| Median resident age: | 47.4 years |
| Indiana median age: | 38.2 years |
| Males: 2,981 | |
| Females: 3,035 |

| Ohio County: | 2.0 people |
| Indiana: | 3 people |
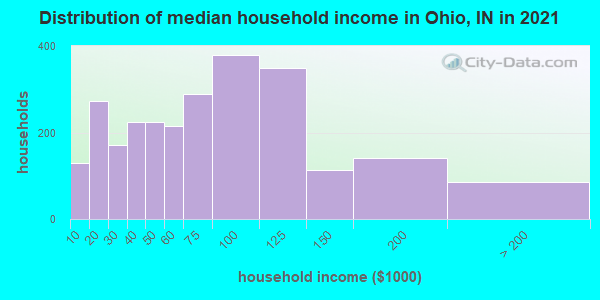
Estimated median household income in 2022: $65,949 ($41,348 in 1999)
| This county: | $65,949 |
| Indiana: | $66,785 |
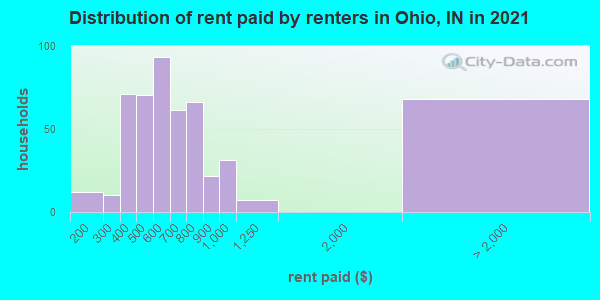
Median contract rent in 2022 for apartments: $638 (lower quartile is $501, upper quartile is $802)
| This county: | $638 |
| State: | $780 |
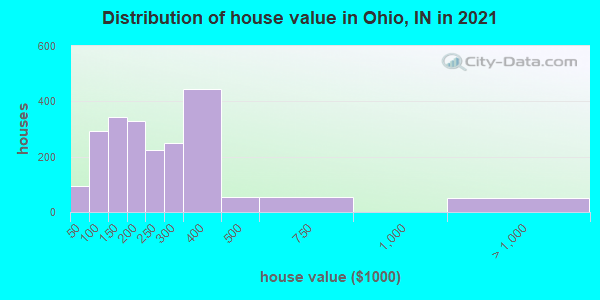
Estimated median house or condo value in 2022: $215,520 (it was $106,500 in 2000)
| Ohio: | $215,520 |
| Indiana: | $208,700 |
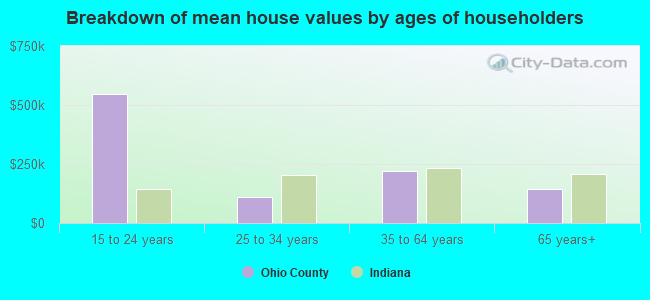
Mean price in 2022:
Median monthly housing costs for homes and condos with a mortgage: $1,336Detached houses: $249,541
Here: $249,541 State: $257,916 Townhouses or other attached units: $87,007
Here: $87,007 State: $224,114 Mobile homes: $72,325
Here: $72,325 State: $67,116
Median monthly housing costs for units without a mortgage: $516
Institutionalized population: 52
Health of residents in Ohio County based on CDC Behavioral Risk Factor Surveillance System Survey Questionnaires from 2013 to 2021:
General health status score of residents in this county from 1 (poor) to 5 (excellent) is 3.4. This is about average.71.1% of residents exercised in the past month. This is about average.
44.4% of residents smoked 100+ cigarettes in their lives. This is about average.
51.4% of adult residents drank alcohol in the past 30 days. This is less than average.
67.6% of residents visited a dentist within the past year. This is about average.
Average weight of males is 202 pounds. This is more than average.
Average weight of females is 167 pounds. This is more than average.
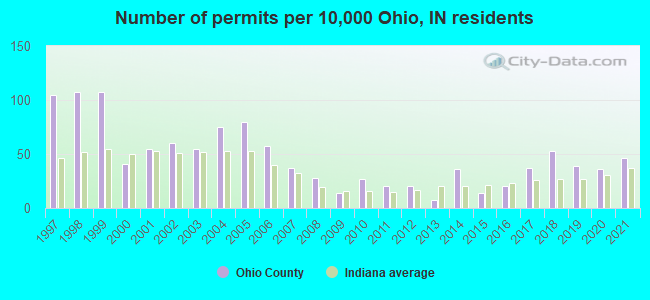
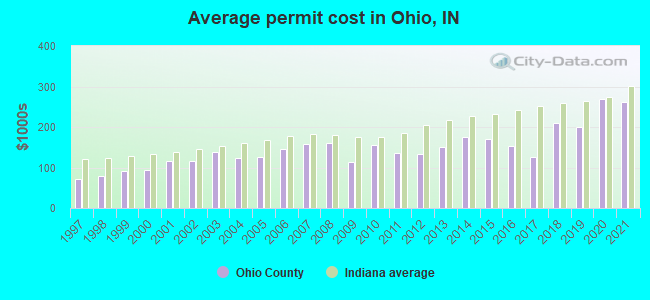
Single-family new house construction building permits:
- 2022: 13 buildings, average cost: $305,500
- 2021: 26 buildings, average cost: $262,300
- 2020: 20 buildings, average cost: $270,000
- 2019: 22 buildings, average cost: $198,900
- 2018: 30 buildings, average cost: $211,300
- 2017: 21 buildings, average cost: $127,000
- 2016: 11 buildings, average cost: $152,900
- 2015: 8 buildings, average cost: $171,400
- 2014: 20 buildings, average cost: $176,200
- 2013: 4 buildings, average cost: $149,600
- 2012: 11 buildings, average cost: $133,600
- 2011: 11 buildings, average cost: $134,700
- 2010: 15 buildings, average cost: $154,800
- 2009: 8 buildings, average cost: $114,400
- 2008: 16 buildings, average cost: $160,100
- 2007: 21 buildings, average cost: $156,900
- 2006: 32 buildings, average cost: $146,200
- 2005: 45 buildings, average cost: $124,700
- 2004: 42 buildings, average cost: $122,900
- 2003: 31 buildings, average cost: $138,700
- 2002: 34 buildings, average cost: $115,900
- 2001: 31 buildings, average cost: $116,700
- 2000: 23 buildings, average cost: $93,600
- 1999: 60 buildings, average cost: $91,600
- 1998: 60 buildings, average cost: $77,500
- 1997: 59 buildings, average cost: $71,700
Median real estate property taxes paid for housing units with mortgages in 2022: $1,256 (0.6%)
Median real estate property taxes paid for housing units with no mortgage in 2022: $1,020 (0.5%)
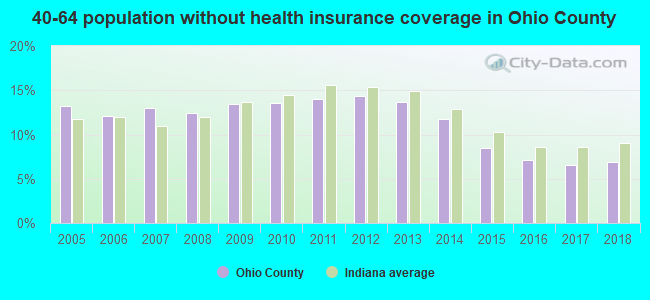
| Ohio County: | 10.2% |
| Indiana: | 12.6% |
Median age of residents in 2022: 47.4 years old
(Males: 47.1 years old, Females: 47.6 years old)
Area name: Cincinnati-Middleton, OH-KY-IN HUD Metro FMR Area
Fair market rent in 2006 for a 1-bedroom apartment in Ohio County is $506 a month.
Fair market rent for a 2-bedroom apartment is $655 a month.
Fair market rent for a 3-bedroom apartment is $877 a month.
Cities in this county include: Rising Sun, Aberdeen.
Neighboring counties: Clark County  , Jackson County, Ohio
  , Orange County
  , Kenton County, Kentucky , Warren County, Virginia .
| Here: | 2.8% |
| Indiana: | 2.8% |
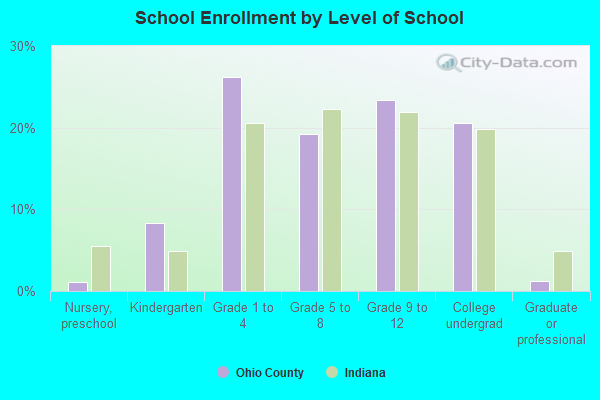
Current college students: 169
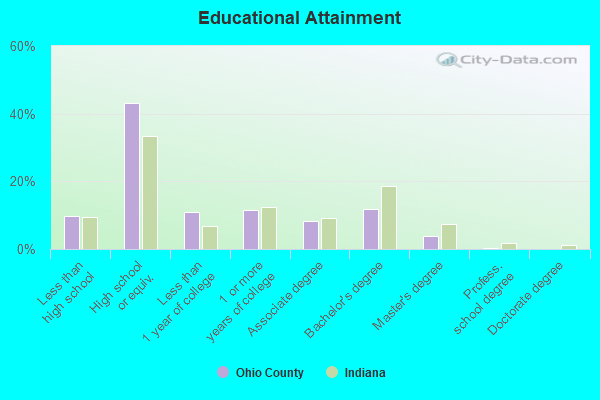
People 25 years of age or older with a high school degree or higher: 92.7%
People 25 years of age or older with a bachelor's degree or higher: 15.7%
Number of foreign born residents: 40 (36.1% naturalized citizens)
| Ohio County: | 0.7% |
| Whole state: | 6.1% |
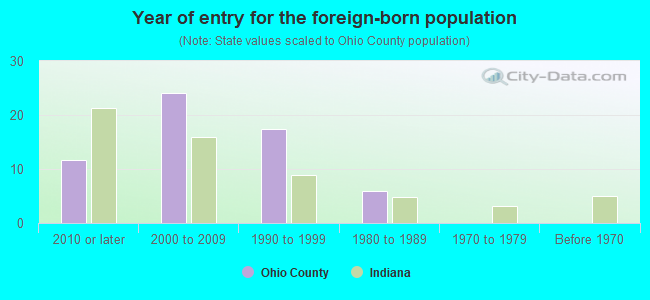
- Year of entry for the foreign-born population
- 142010 or later
- 272000 to 2009
- 01990 to 1999
- 61980 to 1989
- 01970 to 1979
- 0Before 1970
Mean travel time to work (commute): ! minutes
Percentage of county residents living and working in this county: 62.7%
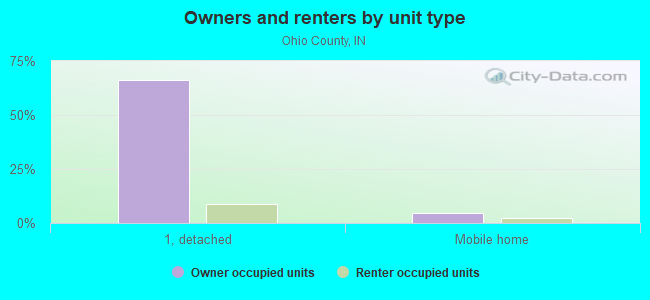
Housing units in structures:
- One, detached: 2,096
- One, attached: 60
- Two: 77
- 3 or 4: 70
- 5 to 9: 35
- 10 to 19: 58
- 20 to 49: 75
- 50 or more: 7
- Mobile homes: 286
Housing units in Ohio County with a mortgage: 1,244 (161 second mortgage, 0 home equity loan, 130 both second mortgage and home equity loan)
Houses without a mortgage: 74
| Here: | 1.3% with mortgage |
| State: | 96.6% with mortgage |
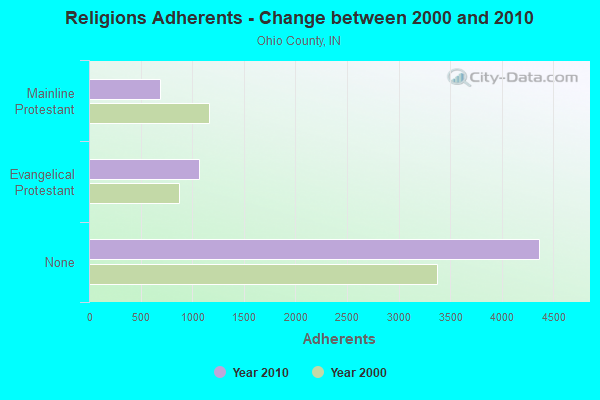
Religion statistics for Ohio County
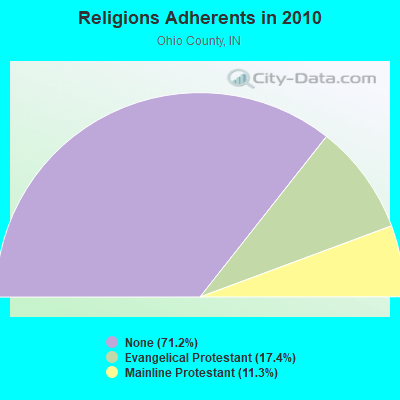
| Religion | Adherents | Congregations |
|---|---|---|
| Evangelical Protestant | 1,068 | 6 |
| Mainline Protestant | 692 | 5 |
| Other | 2 | - |
| None | 4,366 | - |
Source: Clifford Grammich, Kirk Hadaway, Richard Houseal, Dale E.Jones, Alexei Krindatch, Richie Stanley and Richard H.Taylor. 2012. 2010 U.S.Religion Census: Religious Congregations & Membership Study. Association of Statisticians of American Religious Bodies. Jones, Dale E., et al. 2002. Congregations and Membership in the United States 2000. Nashville, TN: Glenmary Research Center.
Food Environment Statistics:
| Ohio County: | 5.21 / 10,000 pop. |
| Indiana: | 3.57 / 10,000 pop. |
| This county: | 10.42 / 10,000 pop. |
| State: | 6.78 / 10,000 pop. |
| Ohio County: | 9.4% |
| Indiana: | 9.2% |
| Ohio County: | 28.3% |
| State: | 29.0% |
Agriculture in Ohio County:
Average size of farms: 112 acresAverage value of agricultural products sold per farm: $11,044
Average value of crops sold per acre for harvested cropland: $210.36
The value of livestock, poultry, and their products as a percentage of the total market value of agricultural products sold: 17.78%
Average total farm production expenses per farm: $13,237
Harvested cropland as a percentage of land in farms: 38.49%
Irrigated harvested cropland as a percentage of land in farms: 6.60%
Average market value of all machinery and equipment per farm: $27,369
The percentage of farms operated by a family or individual: 93.43%
Average age of principal farm operators: 55 years
Average number of cattle and calves per 100 acres of all land in farms: 9.17
Milk cows as a percentage of all cattle and calves: 0.14%
Corn for grain: 1441 harvested acres
Soybeans for beans: 3546 harvested acres
Vegetables: 13 harvested acres
Earthquake activity:
Ohio County-area historical earthquake activity is significantly above Indiana state average. It is 66% greater than the overall U.S. average.On 7/27/1980 at 18:52:21, a magnitude 5.2 (5.1 MB, 4.7 MS, 5.0 UK, 5.2 UK, Class: Moderate, Intensity: VI - VII) earthquake occurred 74.5 miles away from Ohio County center
On 4/18/2008 at 09:36:59, a magnitude 5.4 (5.1 MB, 4.8 MS, 5.4 MW, 5.2 MW) earthquake occurred 162.7 miles away from the county center
On 4/18/2008 at 09:36:59, a magnitude 5.2 (5.2 MW, Depth: 8.9 mi) earthquake occurred 162.7 miles away from the county center
On 6/10/1987 at 23:48:54, a magnitude 5.1 (4.9 MB, 4.4 MS, 4.6 MS, 5.1 LG) earthquake occurred 158.8 miles away from the county center
On 9/7/1988 at 02:28:09, a magnitude 4.6 (4.5 MB, 4.6 LG, Class: Light, Intensity: IV - V) earthquake occurred 80.0 miles away from Ohio County center
On 6/18/2002 at 17:37:15, a magnitude 5.0 (4.3 MB, 4.6 MW, 5.0 LG) earthquake occurred 167.5 miles away from the county center
Magnitude types: regional Lg-wave magnitude (LG), body-wave magnitude (MB), surface-wave magnitude (MS), moment magnitude (MW)
Most recent natural disasters:
- Indiana Covid-19 Pandemic, Incident Period: January 31, 2020, FEMA Id: 4515, Natural disaster type: Other
- Indiana Severe Storms And Flooding, Incident Period: February 14, 2018 - March 4, 2018, FEMA Id: 4363, Natural disaster type: Storm, Flood
- Indiana Severe Storms, Tornadoes, Straight-Line Winds, and Flooding, Incident Period: April 19, 2011 to June 06, 2011, Major Disaster (Presidential) Declared DR-1997: June 23, 2011, FEMA Id: 1997, Natural disaster type: Storm, Tornado, Flood, Wind
- Indiana Severe Winter Storm, Incident Period: January 26, 2009 to January 28, 2009, Major Disaster (Presidential) Declared DR-1828: March 05, 2009, FEMA Id: 1828, Natural disaster type: Winter Storm
- Indiana Severe Storms and Flooding, Incident Period: September 12, 2008 to October 06, 2008, Major Disaster (Presidential) Declared DR-1795: September 23, 2008, FEMA Id: 1795, Natural disaster type: Storm, Flood
- Indiana Severe Storms and Flooding, Incident Period: May 30, 2008 to June 27, 2008, Major Disaster (Presidential) Declared DR-1766: June 08, 2008, FEMA Id: 1766, Natural disaster type: Storm, Flood
- Indiana Hurricane Katrina Evacuation, Incident Period: August 29, 2005 to October 01, 2005, Emergency Declared EM-3238: September 10, 2005, FEMA Id: 3238, Natural disaster type: Hurricane
- Indiana Snow, Incident Period: December 21, 2004 to December 23, 2004, Emergency Declared EM-3197: January 11, 2005, FEMA Id: 3197, Natural disaster type: Snow
- Indiana Severe Storms, Tornadoes, and Flooding, Incident Period: May 25, 2004 to June 25, 2004, Major Disaster (Presidential) Declared DR-1520: June 03, 2004, FEMA Id: 1520, Natural disaster type: Storm, Tornado, Flood
- Indiana Severe Storms, Tornadoes and Flooding, Incident Period: April 28, 2002 to June 07, 2002, Major Disaster (Presidential) Declared DR-1418: June 13, 2002, FEMA Id: 1418, Natural disaster type: Storm, Tornado, Flood
- 7 other natural disasters have been reported since 1953.
The number of natural disasters in Ohio County (17) is near the US average (15).
Major Disasters (Presidential) Declared: 13
Emergencies Declared: 2
Causes of natural disasters: Floods: 11, Storms: 9, Tornadoes: 6, Blizzard: 1, Hurricane: 1, Snow: 1, Wind: 1, Winter Storm: 1, Other: 1 (Note: some incidents may be assigned to more than one category).
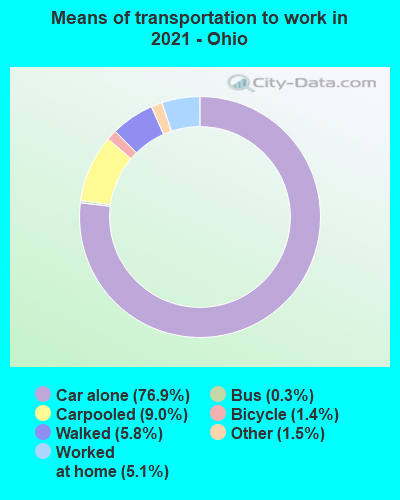
Means of transportation to work:
- Drove a car alone: 1,064 (75.6%)
- Carpooled: 97 (6.9%)
- Bicycle: 15 (1.1%)
- Walked: 50 (3.6%)
- Worked at home: 182 (12.9%)
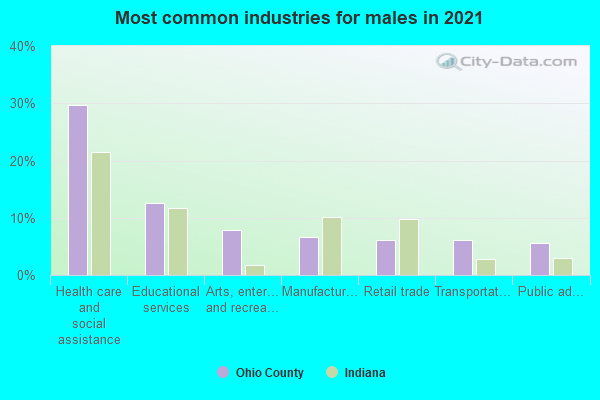
- Health care and social assistance (32%)
- Educational services (10%)
- Public administration (8%)
- Manufacturing (6%)
- Retail trade (5%)
- Arts, entertainment, and recreation (4%)
- Administrative and support and waste management services (4%)
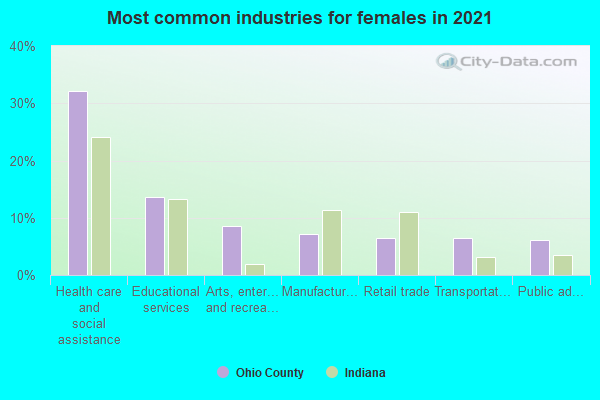
- Health care and social assistance (37%)
- Educational services (12%)
- Public administration (9%)
- Manufacturing (6%)
- Retail trade (6%)
- Arts, entertainment, and recreation (5%)
- Administrative and support and waste management services (5%)
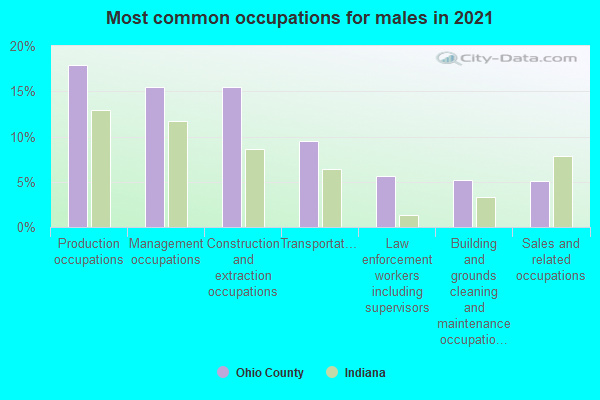
- Management occupations (17%)
- Production occupations (16%)
- Construction and extraction occupations (15%)
- Installation, maintenance, and repair occupations (7%)
- Material moving occupations (7%)
- Transportation occupations (5%)
- Sales and related occupations (5%)
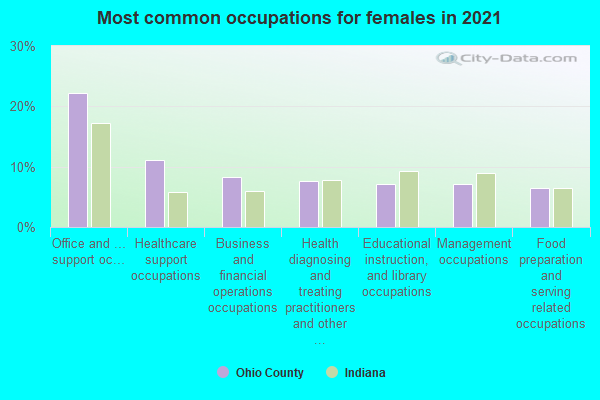
- Office and administrative support occupations (19%)
- Healthcare support occupations (9%)
- Educational instruction, and library occupations (9%)
- Business and financial operations occupations (8%)
- Production occupations (8%)
- Health diagnosing and treating practitioners and other technical occupations (8%)
- Management occupations (7%)
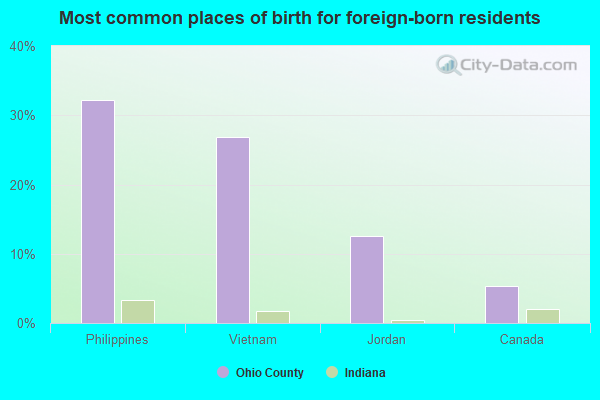
- Japan (42%)
- Jordan (15%)
- Vietnam (8%)
- Canada (8%)
- Ireland (0%)
- Norway (0%)
- Sweden (0%)
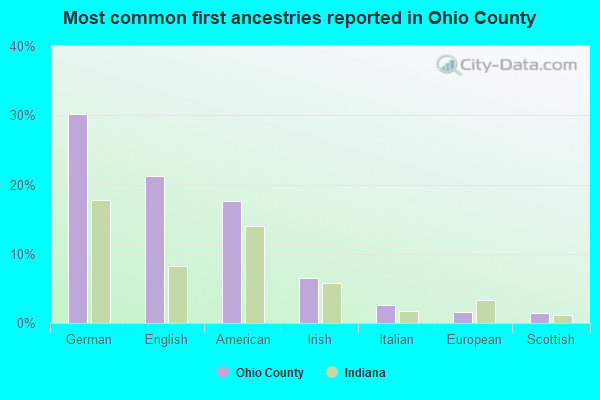
- German (26%)
- English (25%)
- American (16%)
- Irish (7%)
- Italian (3%)
- Scottish (2%)
- Scotch-Irish (2%)
46 people in nursing homes
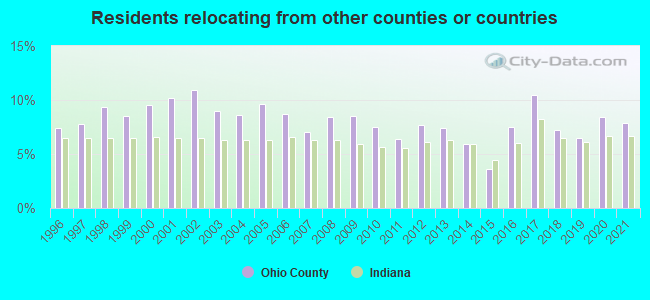
7.85% of this county's 2021 resident taxpayers lived in other counties in 2020 ($58,583 average adjusted gross income)
| Here: | 7.85% |
| Indiana average: | 6.66% |
10 or fewer of this county's residents moved from foreign countries.
5.50% relocated from other counties in Indiana ($36,176 average AGI)
2.35% relocated from other states ($22,406 average AGI)
Ohio County: 2.35% Indiana average: 2.58%
Top counties from which taxpayers relocated into this county between 2020 and 2021:
| from Dearborn County, IN | |
| from Hamilton County, OH | |
| from Switzerland County, IN |
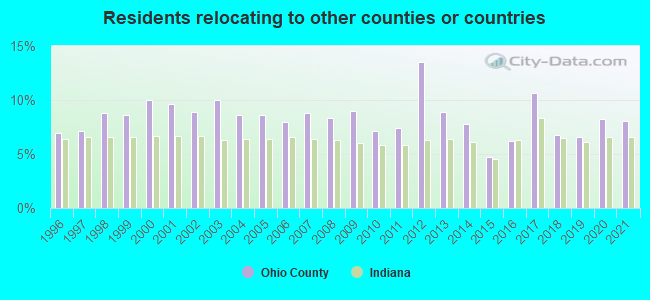
8.04% of this county's 2020 resident taxpayers moved to other counties in 2021 ($43,964 average adjusted gross income)
| Here: | 8.04% |
| Indiana average: | 6.55% |
10 or fewer of this county's residents moved to foreign countries.
5.15% relocated to other counties in Indiana ($26,958 average AGI)
2.89% relocated to other states ($17,005 average AGI)
Ohio County: 2.89% Indiana average: 2.46%
Top counties to which taxpayers relocated from this county between 2020 and 2021:
| to Dearborn County, IN | |
| to Switzerland County, IN |
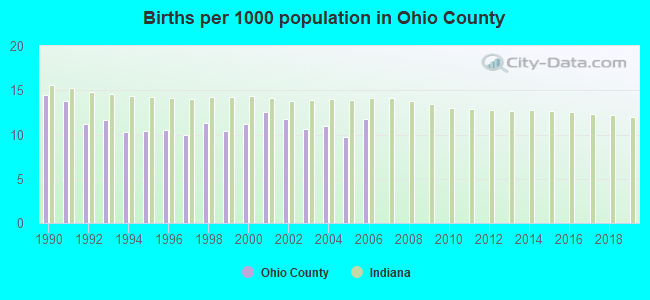
Births per 1000 population from 1990 to 1999: 11.4
Births per 1000 population from 2000 to 2006: 11.2
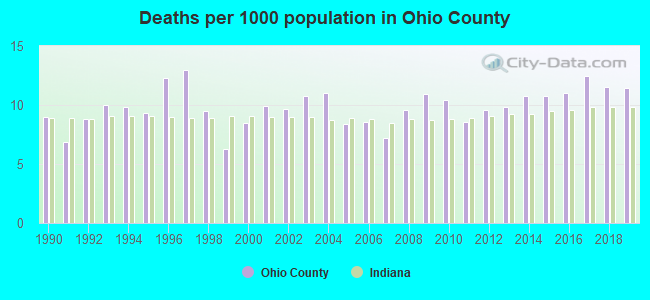
Deaths per 1000 population from 1990 to 1999: 9.5
Deaths per 1000 population from 2000 to 2009: 9.5
Deaths per 1000 population from 2010 to 2020: 10.9
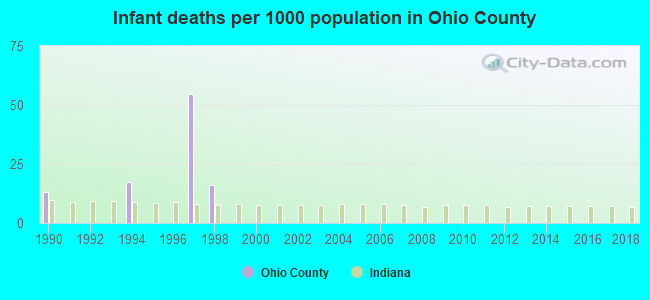
Infant deaths per 1000 live births from 1990 to 1999: 10.1
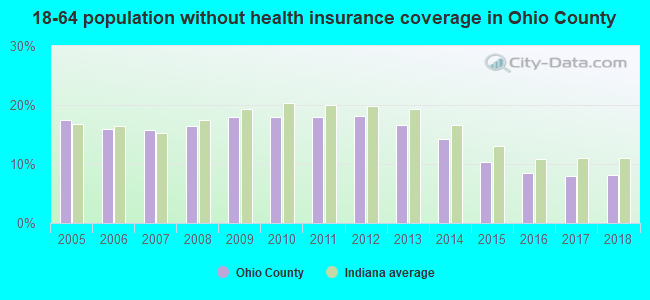
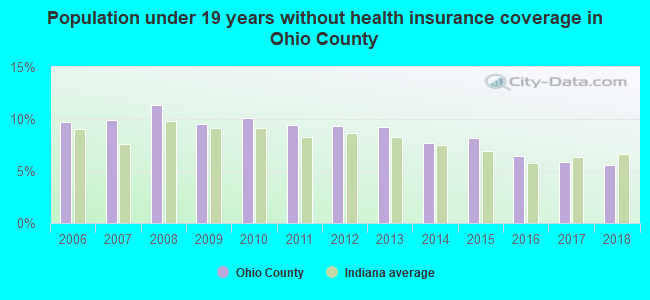
Persons under 19 years old without health insurance coverage in 2018: 5.6%
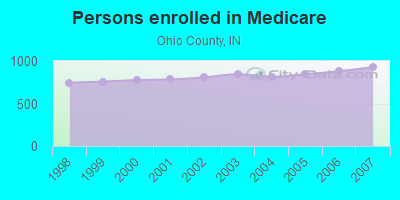
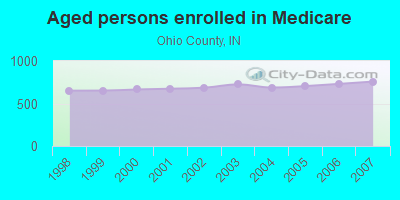
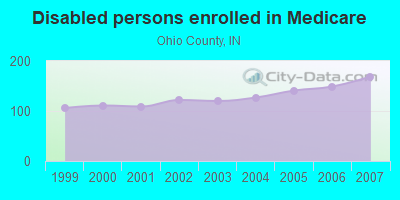
Persons enrolled in hospital insurance and/or supplemental medical insurance (Medicare) in July 1, 2007: 927 (758 aged, 169 disabled)
Children under 18 without health insurance coverage in 2007: 125 (9%)
Most common underlying causes of death in Ohio County, Indiana in 1999 - 2019:
- Bronchus or lung, unspecified - Malignant neoplasms (12)
- Unspecified dementia (11)
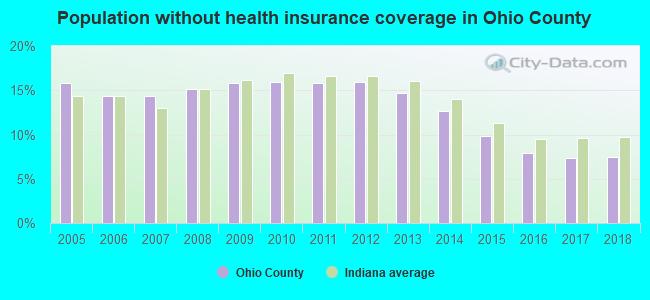
Population without health insurance coverage in 2000: 9%
Children under 18 without health insurance coverage in 2000: 9%
Medical specialist MDs per 100,000 population in 2005: 1,141
Dentists per 100,000 population in 1998: 17
Total births per 100,000 population, July 2005 - July 2006 : 18
Total deaths per 100,000 population, July 2005 - July 2006: 34
Household type by relationship:
Households: 6,016- Male householders: 1,272 (352 living alone), Female householders: 1,350 (390 living alone)
1,299 spouses (1,299 opposite-sex spouses), 206 unmarried partners, (206 opposite-sex unmarried partners), 1,512 children (1,336 natural, 42 adopted, 134 stepchildren), 120 grandchildren, 35 brothers or sisters, 64 parents, 0 foster children, 75 other relatives, 50 non-relatives
- In group quarters: 55
Size of family households: 974 2-persons, 293 3-persons, 331 4-persons, 127 5-persons, 34 6-persons, 19 7-or-more-persons.
Size of nonfamily households: 742 1-person, 94 2-persons, 2 3-persons.
702 married couples with children.
394 single-parent households (149 men, 245 women).
98.4% of residents of Ohio speak English at home.
0.1% of residents speak Spanish at home (100% speak English very well).
0.5% of residents speak other Indo-European language at home (100% speak English very well).
0.3% of residents speak Asian or Pacific Island language at home (100% speak English well).
0.2% of residents speak other language at home (100% speak English very well).
In fiscal year 2004:
Federal Government expenditure: $23,548,000 ($4,026 per capita)
Department of Defense expenditure: $614,000
Federal direct payments to individuals for retirement and disability: $12,437,000
Federal other direct payments to individuals: $5,452,000
Federal direct payments not to individuals: $249,000
Federal grants: $4,212,000
Federal procurement contracts: $256,000 ($0,000 Department of Defense)
Federal salaries and wages: $943,000 ($0,000 Department of Defense)
Federal Government direct loans: $70,000
Federal guaranteed/insured loans: $1,249,000
Federal Government insurance: $5,028,000
Population change from April 1, 2000 to July 1, 2005:
Births: 336| Here: | 57 per 1000 residents |
| State: | 72 per 1000 residents |
Deaths: 281
| Here: | 48 per 1000 residents |
| State: | 47 per 1000 residents |
Net international migration: -4
| Here: | |
| State: |
Net internal migration: +211
| Here: | |
| State: |
Total withdrawal of fresh water for public supply: 0.79 millions of gallons per day (all from ground)
| Here: | 6.3 |
| State: | 6.6 |
| Here: | 5.2 |
| State: | 4.3 |
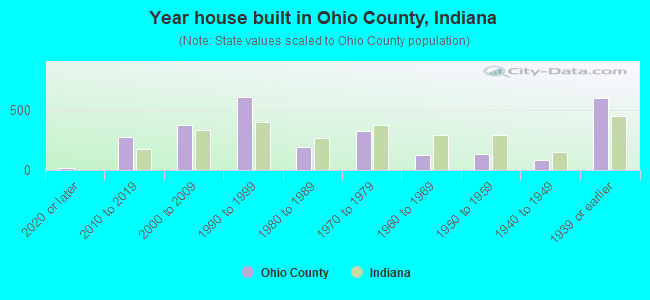
- Year house built in Ohio County, Indiana
- 262020 or later
- 2842010 to 2019
- 4162000 to 2009
- 4911990 to 1999
- 2041980 to 1989
- 3951970 to 1979
- 1561960 to 1969
- 1711950 to 1959
- 751940 to 1949
- 5451939 or earlier
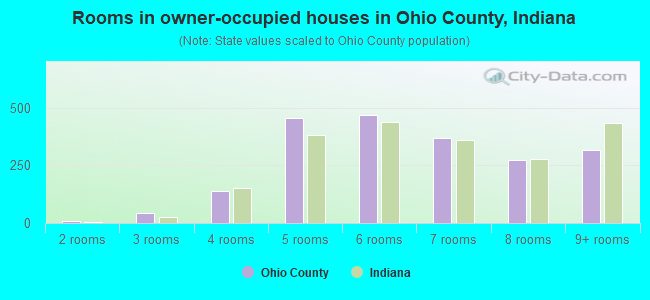
- Rooms in owner-occupied houses in Ohio County, Indiana
- 01 room
- 312 rooms
- 403 rooms
- 1404 rooms
- 4485 rooms
- 4786 rooms
- 2887 rooms
- 2898 rooms
- 3359+ rooms
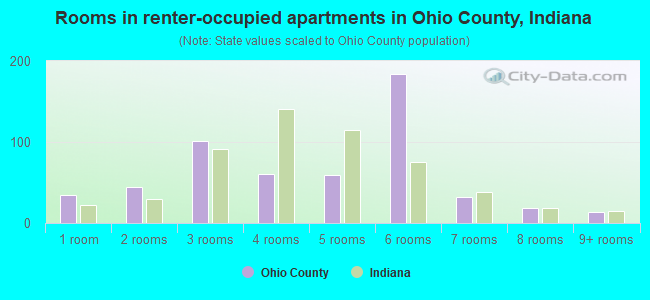
- Rooms in renter-occupied apartments in Ohio County, Indiana
- 71 room
- 402 rooms
- 1013 rooms
- 694 rooms
- 915 rooms
- 2006 rooms
- 187 rooms
- 448 rooms
- 169+ rooms
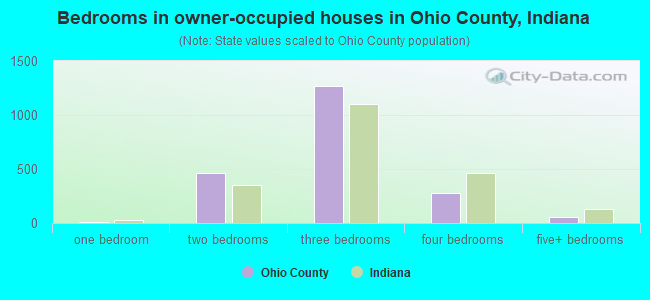
- Bedrooms in owner-occupied houses in Ohio County, Indiana
- 0no bedroom
- 451 bedroom
- 3902 bedrooms
- 1,2733 bedrooms
- 3064 bedrooms
- 355+ bedrooms
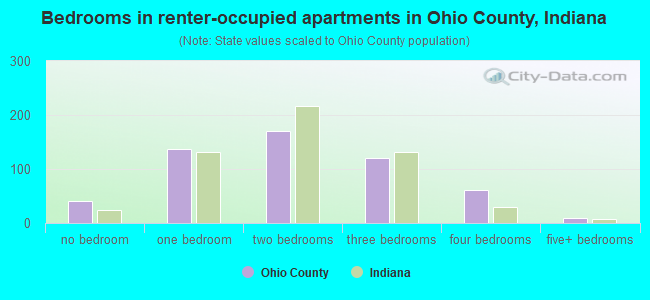
- Bedrooms in renter-occupied apartments in Ohio County, Indiana
- 22no bedroom
- 1061 bedroom
- 2062 bedrooms
- 1933 bedrooms
- 434 bedrooms
- 65+ bedrooms
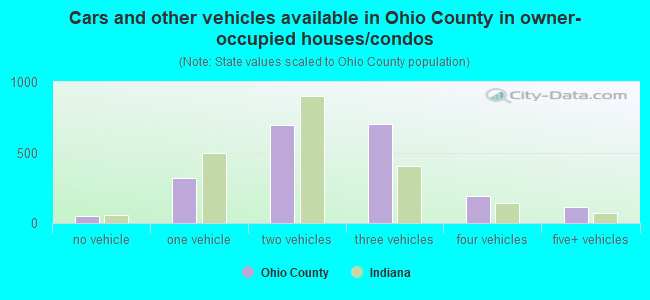
- Cars and other vehicles available in Ohio County in owner-occupied houses/condos
- 51no vehicle
- 3661 vehicle
- 6352 vehicles
- 6883 vehicles
- 1624 vehicles
- 1305+ vehicles
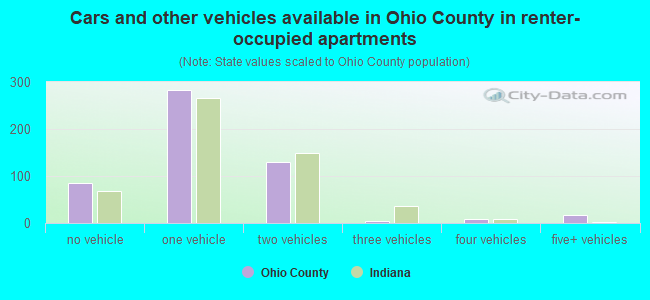
- Cars and other vehicles available in Ohio County in renter-occupied apartments
- 82no vehicle
- 3321 vehicle
- 1322 vehicles
- 173 vehicles
- 74 vehicles
- 125+ vehicles
94.3% of Ohio County residents lived in the same house 1 years ago.
Out of people who lived in different houses, 24% lived in this county.
Out of people who lived in different counties, 92% lived in Indiana.
| Ohio County: | 94.3% |
| State average: | 87.1% |
Place of birth for U.S.-born residents:
- This state: 3,542
- Other state: 2,393
- Northeast: 100
- Midwest: 1,587
- South: 642
- West: 54
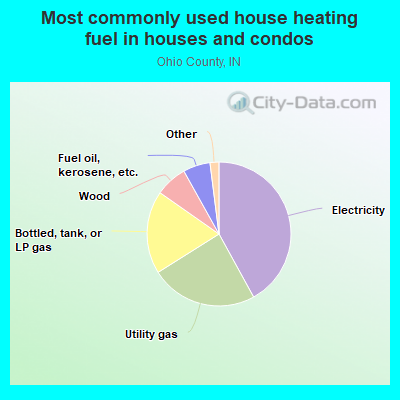
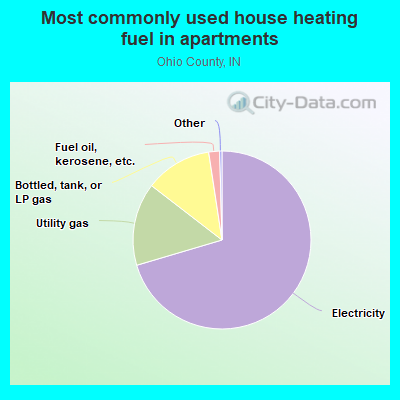
- 42.5%Electricity
- 23.7%Utility gas
- 21.0%Bottled, tank, or LP gas
- 7.2%Wood
- 4.0%Fuel oil, kerosene, etc.
- 0.7%Other fuel
- 0.6%No fuel used
- 0.3%Coal or coke
- 64.6%Electricity
- 17.0%Utility gas
- 16.1%Bottled, tank, or LP gas
- 2.3%Fuel oil, kerosene, etc.
Private vs. public school enrollment:
| Here: | 1.2% |
| Indiana: | 14.9% |
| Here: | 4.3% |
| Indiana: | 11.4% |
| Here: | 10.5% |
| Indiana: | 22.3% |
Ohio County government finances - Expenditure in 2017:
- Bond Funds - Cash and Securities: $372,000
Cash and Securities: $342,000
- Charges - Other: $551,000
Other: $162,000
Parks and Recreation: $20,000
Sea and Inland Port Facilities: $13,000
- Construction - Regular Highways: $120,000
General - Other: $71,000
- Current Operations - General - Other: $3,356,000
Regular Highways: $1,184,000
General - Other: $1,096,000
Central Staff Services: $891,000
Regular Highways: $661,000
Central Staff Services: $498,000
Judicial and Legal Services: $476,000
Police Protection: $466,000
Financial Administration: $450,000
Police Protection: $387,000
Judicial and Legal Services: $379,000
Financial Administration: $348,000
Health - Other: $200,000
Health - Other: $148,000
Natural Resources - Other: $95,000
Correctional Institutions: $68,000
Protective Inspection and Regulation - Other: $39,000
Sea and Inland Port Facilities: $23,000
Sea and Inland Port Facilities: $19,000
Corrections - Other: $2,000
- Federal Intergovernmental - Other: $49,000
- Intergovernmental to Local - Other - General - Other: $2,000
- Local Intergovernmental - Highways: $108,000
Highways: $64,000
Other: $5,000
- Miscellaneous - Fines and Forfeits: $482,000
Interest Earnings: $195,000
General Revenue - Other: $185,000
General Revenue - Other: $116,000
Fines and Forfeits: $84,000
Interest Earnings: $51,000
Sale of Property: $33,000
Rents: $12,000
Donations From Private Sources: $10,000
Donations From Private Sources: $5,000
Sale of Property: $5,000
- Other Capital Outlay - General - Other: $238,000
Regular Highways: $162,000
Police Protection: $33,000
General - Other: $14,000
Health - Other: $9,000
Judicial and Legal Services: $4,000
Health - Other: $3,000
Protective Inspection and Regulation - Other: $1,000
Financial Administration: $1,000
- Other Funds - Cash and Securities: $20,115,000
Cash and Securities: $13,123,000
- State Intergovernmental - General Local Government Support: $3,049,000
Other: $2,446,000
Highways: $1,592,000
General Local Government Support: $913,000
Highways: $628,000
Other: $148,000
Health and Hospitals: $69,000
- Tax - Property: $1,279,000
Property: $1,111,000
Individual Income: $1,028,000
Other Selective Sales: $51,000
Other License: $19,000
Other License: $15,000
Public Utilities Sales: $8,000
Documentary and Stock Transfer: $1,000
Public Utilities Sales: $1,000
- Total Salaries and Wages: $3,340,000
: $6,000
Ohio County government finances - Revenue in 2017:
- Bond Funds - Cash and Securities: $372,000
Cash and Securities: $342,000
- Charges - Other: $551,000
Other: $162,000
Parks and Recreation: $20,000
Sea and Inland Port Facilities: $13,000
- Construction - Regular Highways: $120,000
General - Other: $71,000
- Current Operations - General - Other: $3,356,000
Regular Highways: $1,184,000
General - Other: $1,096,000
Central Staff Services: $891,000
Regular Highways: $661,000
Central Staff Services: $498,000
Judicial and Legal Services: $476,000
Police Protection: $466,000
Financial Administration: $450,000
Police Protection: $387,000
Judicial and Legal Services: $379,000
Financial Administration: $348,000
Health - Other: $200,000
Health - Other: $148,000
Natural Resources - Other: $95,000
Correctional Institutions: $68,000
Protective Inspection and Regulation - Other: $39,000
Sea and Inland Port Facilities: $23,000
Sea and Inland Port Facilities: $19,000
Corrections - Other: $2,000
- Federal Intergovernmental - Other: $49,000
- Intergovernmental to Local - Other - General - Other: $2,000
- Local Intergovernmental - Highways: $108,000
Highways: $64,000
Other: $5,000
- Miscellaneous - Fines and Forfeits: $482,000
Interest Earnings: $195,000
General Revenue - Other: $185,000
General Revenue - Other: $116,000
Fines and Forfeits: $84,000
Interest Earnings: $51,000
Sale of Property: $33,000
Rents: $12,000
Donations From Private Sources: $10,000
Donations From Private Sources: $5,000
Sale of Property: $5,000
- Other Capital Outlay - General - Other: $238,000
Regular Highways: $162,000
Police Protection: $33,000
General - Other: $14,000
Health - Other: $9,000
Judicial and Legal Services: $4,000
Health - Other: $3,000
Protective Inspection and Regulation - Other: $1,000
Financial Administration: $1,000
- Other Funds - Cash and Securities: $20,115,000
Cash and Securities: $13,123,000
- State Intergovernmental - General Local Government Support: $3,049,000
Other: $2,446,000
Highways: $1,592,000
General Local Government Support: $913,000
Highways: $628,000
Other: $148,000
Health and Hospitals: $69,000
- Tax - Property: $1,279,000
Property: $1,111,000
Individual Income: $1,028,000
Other Selective Sales: $51,000
Other License: $19,000
Other License: $15,000
Public Utilities Sales: $8,000
Documentary and Stock Transfer: $1,000
Public Utilities Sales: $1,000
- Total Salaries and Wages: $3,340,000
: $6,000
Ohio County government finances - Debt in 2017:
- Bond Funds - Cash and Securities: $372,000
Cash and Securities: $342,000
- Charges - Other: $551,000
Other: $162,000
Parks and Recreation: $20,000
Sea and Inland Port Facilities: $13,000
- Construction - Regular Highways: $120,000
General - Other: $71,000
- Current Operations - General - Other: $3,356,000
Regular Highways: $1,184,000
General - Other: $1,096,000
Central Staff Services: $891,000
Regular Highways: $661,000
Central Staff Services: $498,000
Judicial and Legal Services: $476,000
Police Protection: $466,000
Financial Administration: $450,000
Police Protection: $387,000
Judicial and Legal Services: $379,000
Financial Administration: $348,000
Health - Other: $200,000
Health - Other: $148,000
Natural Resources - Other: $95,000
Correctional Institutions: $68,000
Protective Inspection and Regulation - Other: $39,000
Sea and Inland Port Facilities: $23,000
Sea and Inland Port Facilities: $19,000
Corrections - Other: $2,000
- Federal Intergovernmental - Other: $49,000
- Intergovernmental to Local - Other - General - Other: $2,000
- Local Intergovernmental - Highways: $108,000
Highways: $64,000
Other: $5,000
- Miscellaneous - Fines and Forfeits: $482,000
Interest Earnings: $195,000
General Revenue - Other: $185,000
General Revenue - Other: $116,000
Fines and Forfeits: $84,000
Interest Earnings: $51,000
Sale of Property: $33,000
Rents: $12,000
Donations From Private Sources: $10,000
Donations From Private Sources: $5,000
Sale of Property: $5,000
- Other Capital Outlay - General - Other: $238,000
Regular Highways: $162,000
Police Protection: $33,000
General - Other: $14,000
Health - Other: $9,000
Judicial and Legal Services: $4,000
Health - Other: $3,000
Protective Inspection and Regulation - Other: $1,000
Financial Administration: $1,000
- Other Funds - Cash and Securities: $20,115,000
Cash and Securities: $13,123,000
- State Intergovernmental - General Local Government Support: $3,049,000
Other: $2,446,000
Highways: $1,592,000
General Local Government Support: $913,000
Highways: $628,000
Other: $148,000
Health and Hospitals: $69,000
- Tax - Property: $1,279,000
Property: $1,111,000
Individual Income: $1,028,000
Other Selective Sales: $51,000
Other License: $19,000
Other License: $15,000
Public Utilities Sales: $8,000
Documentary and Stock Transfer: $1,000
Public Utilities Sales: $1,000
- Total Salaries and Wages: $3,340,000
: $6,000
Ohio County government finances - Cash and Securities in 2017:
- Bond Funds - Cash and Securities: $372,000
Cash and Securities: $342,000
- Charges - Other: $551,000
Other: $162,000
Parks and Recreation: $20,000
Sea and Inland Port Facilities: $13,000
- Construction - Regular Highways: $120,000
General - Other: $71,000
- Current Operations - General - Other: $3,356,000
Regular Highways: $1,184,000
General - Other: $1,096,000
Central Staff Services: $891,000
Regular Highways: $661,000
Central Staff Services: $498,000
Judicial and Legal Services: $476,000
Police Protection: $466,000
Financial Administration: $450,000
Police Protection: $387,000
Judicial and Legal Services: $379,000
Financial Administration: $348,000
Health - Other: $200,000
Health - Other: $148,000
Natural Resources - Other: $95,000
Correctional Institutions: $68,000
Protective Inspection and Regulation - Other: $39,000
Sea and Inland Port Facilities: $23,000
Sea and Inland Port Facilities: $19,000
Corrections - Other: $2,000
- Federal Intergovernmental - Other: $49,000
- Intergovernmental to Local - Other - General - Other: $2,000
- Local Intergovernmental - Highways: $108,000
Highways: $64,000
Other: $5,000
- Miscellaneous - Fines and Forfeits: $482,000
Interest Earnings: $195,000
General Revenue - Other: $185,000
General Revenue - Other: $116,000
Fines and Forfeits: $84,000
Interest Earnings: $51,000
Sale of Property: $33,000
Rents: $12,000
Donations From Private Sources: $10,000
Donations From Private Sources: $5,000
Sale of Property: $5,000
- Other Capital Outlay - General - Other: $238,000
Regular Highways: $162,000
Police Protection: $33,000
General - Other: $14,000
Health - Other: $9,000
Judicial and Legal Services: $4,000
Health - Other: $3,000
Protective Inspection and Regulation - Other: $1,000
Financial Administration: $1,000
- Other Funds - Cash and Securities: $20,115,000
Cash and Securities: $13,123,000
- State Intergovernmental - General Local Government Support: $3,049,000
Other: $2,446,000
Highways: $1,592,000
General Local Government Support: $913,000
Highways: $628,000
Other: $148,000
Health and Hospitals: $69,000
- Tax - Property: $1,279,000
Property: $1,111,000
Individual Income: $1,028,000
Other Selective Sales: $51,000
Other License: $19,000
Other License: $15,000
Public Utilities Sales: $8,000
Documentary and Stock Transfer: $1,000
Public Utilities Sales: $1,000
- Total Salaries and Wages: $3,340,000
: $6,000
Supplemental Security Income (SSI) in 2006:
- Total number of recipients: 60
- Number of aged recipients: 5
- Number of blind and disabled recipients: 55
- Number of recipients under 18: 11
- Number of recipients between 18 and 64: 38
- Number of recipients older than 64: 11
- Number of recipients also receiving OASDI: 23
- Amount of payments (thousands of dollars): 25
| Most common first names in Ohio County, IN among deceased individuals | ||
| Name | Count | Lived (average) |
|---|---|---|
| William | 41 | 77.8 years |
| Mary | 39 | 80.9 years |
| Robert | 39 | 71.3 years |
| John | 37 | 79.3 years |
| James | 34 | 74.3 years |
| Charles | 28 | 76.1 years |
| Ruth | 19 | 77.4 years |
| Helen | 17 | 80.8 years |
| George | 17 | 76.2 years |
| Elizabeth | 16 | 84.4 years |
| Most common last names in Ohio County, IN among deceased individuals | ||
| Last name | Count | Lived (average) |
|---|---|---|
| Smith | 24 | 78.0 years |
| Brown | 20 | 76.0 years |
| Siekman | 17 | 80.2 years |
| Thies | 17 | 74.5 years |
| Stegemiller | 16 | 76.6 years |
| Turner | 14 | 77.1 years |
| Bailey | 13 | 80.6 years |
| Gregory | 12 | 76.0 years |
| Bovard | 11 | 71.4 years |
| Kittle | 11 | 73.5 years |
| Businesses in Ohio County, IN | ||||
| Name | Count | Name | Count | |
|---|---|---|---|---|
| Applebee's | 1 | H&R Block | 1 | |
| Burger King | 2 | Hilton | 1 | |
| CVS | 1 | Holiday Inn | 1 | |
| Chevrolet | 1 | Jones New York | 1 | |
| Cricket Wireless | 1 | Red Robin | 1 | |
| Curves | 1 | Starbucks | 1 | |
| Dairy Queen | 1 | Subway | 5 | |
| FedEx | 1 | U-Haul | 2 | |
| Ford | 1 | UPS | 6 | |