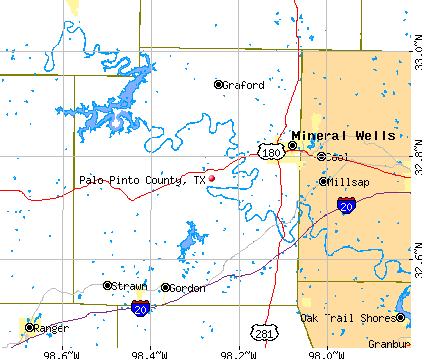
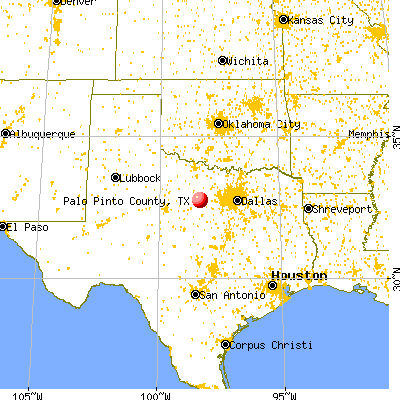
Palo Pinto County, Texas (TX)
County owner-occupied free and clear houses and condos in 2010: 4,046
County owner-occupied houses and condos in 2000: 7,620
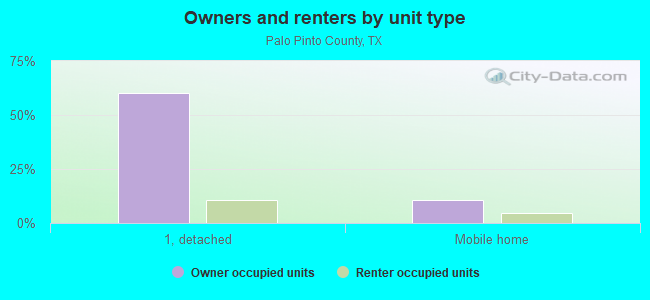
Renter-occupied apartments: 3,207 (it was 2,974 in 2000)
| % of renters here: | 28% |
| State: | 36% |
Land area: 953 sq. mi.
Water area: 32.6 sq. mi.
Population density: 31 people per square mile (low).
Industries providing employment: Educational, health and social services (18.5%), Construction (12.4%), Retail trade (11.2%), Manufacturing (10.6%).
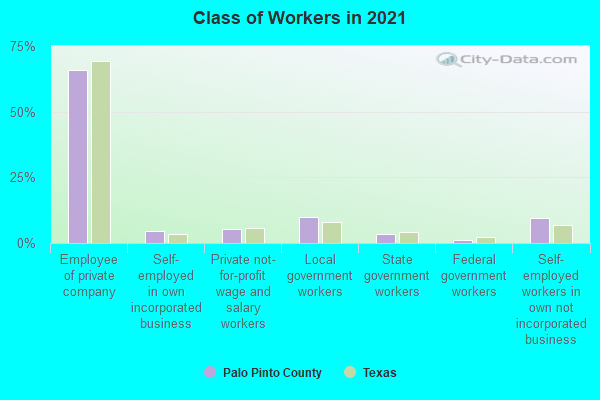
Type of workers:
- Private wage or salary: 75%
- Government: 15%
- Self-employed, not incorporated: 9%
- Unpaid family work: 1%
- OSM Map
- General Map
- Google Map
- MSN Map

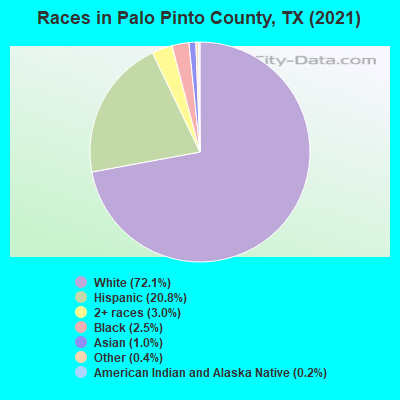
- 20,80271.9%White Non-Hispanic Alone
- 6,05420.9%Hispanic or Latino
- 7872.7%Two or more races
- 7582.6%Black Non-Hispanic Alone
- 3081.1%Asian alone
- 1620.6%Some other race alone
- 640.2%American Indian and Alaska Native alone
| Median resident age: | 41.8 years |
| Texas median age: | 35.6 years |
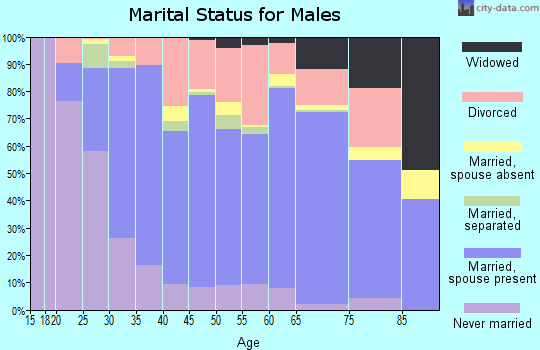
| Males: 14,430 | |
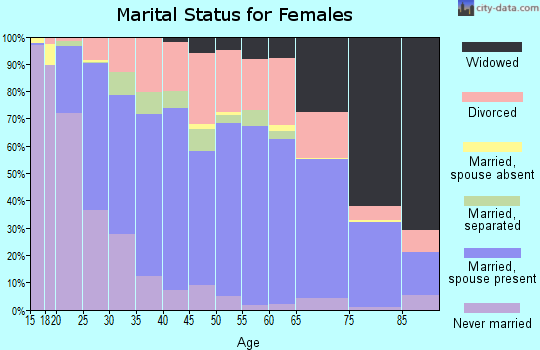
| Females: 14,907 |

 | When will Sherman/Denison Be In DFW Metro? (66 replies) |
| Why are Texans moving to Montana and other northern states? (54 replies) |
| ranch sale flyers in mail (9 replies) |
| Should I move from Michigan to Texas? (44 replies) |
| New County Population Estimates from the Census Bureau for Jluy 1, 2016 posted this morning about 9 A. M. (13 replies) |
| Pros and cons to living in Texas (181 replies) |
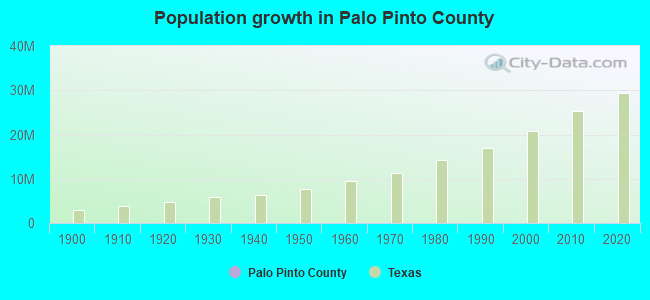
| Palo Pinto County: | 2.0 people |
| Texas: | 3 people |
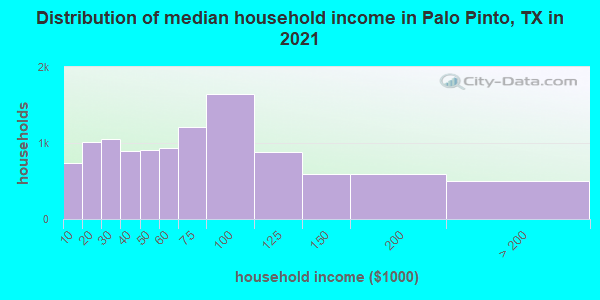
Estimated median household income in 2022: $64,571 ($31,203 in 1999)
| This county: | $64,571 |
| Texas: | $72,284 |
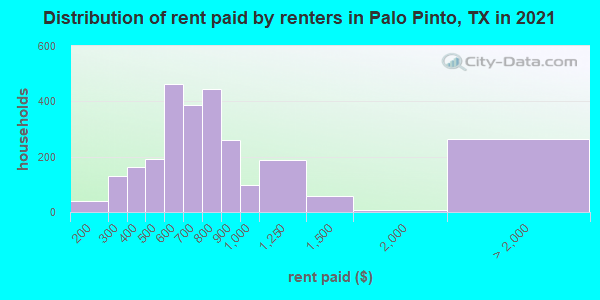
Median contract rent in 2022 for apartments: $762 (lower quartile is $597, upper quartile is $960)
| This county: | $762 |
| State: | $1117 |
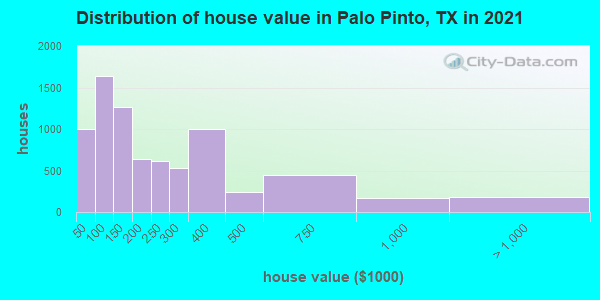
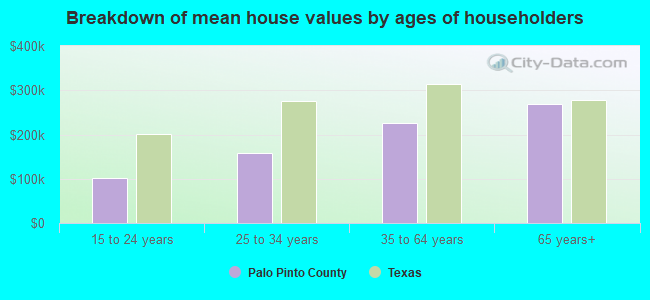
Estimated median house or condo value in 2022: $175,307 (it was $46,900 in 2000)
| Palo Pinto: | $175,307 |
| Texas: | $275,400 |
Median monthly housing costs for homes and condos with a mortgage: $1,618
Median monthly housing costs for units without a mortgage: $561
Institutionalized population: 247
Crime in 2021 (reported by the sheriff's office or county police, not the county total):
- Murders: 0
- Rapes: 4
- Robberies: 0
- Assaults: 17
- Burglaries: 27
- Thefts: 54
- Auto thefts: 16
Crime in 2020 (reported by the sheriff's office or county police, not the county total):
- Murders: 0
- Rapes: 1
- Robberies: 1
- Assaults: 11
- Burglaries: 32
- Thefts: 80
- Auto thefts: 21
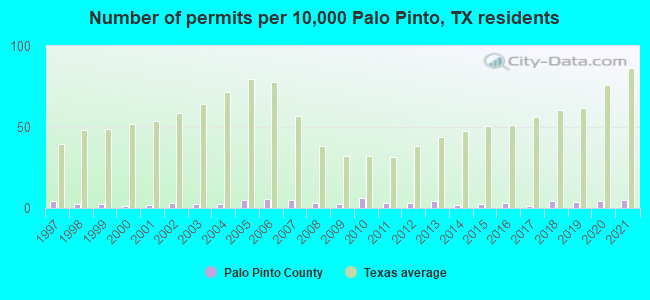
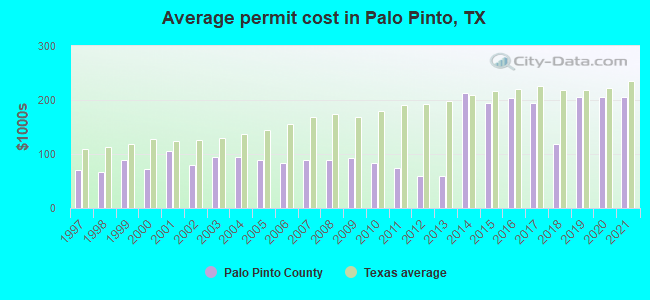
Single-family new house construction building permits:
- 2022: 54 buildings, average cost: $256,200
- 2021: 13 buildings, average cost: $204,900
- 2020: 11 buildings, average cost: $204,900
- 2019: 10 buildings, average cost: $204,900
- 2018: 11 buildings, average cost: $117,700
- 2017: 4 buildings, average cost: $194,200
- 2016: 9 buildings, average cost: $204,200
- 2015: 7 buildings, average cost: $195,200
- 2014: 5 buildings, average cost: $212,800
- 2013: 11 buildings, average cost: $60,100
- 2012: 9 buildings, average cost: $60,100
- 2011: 8 buildings, average cost: $74,800
- 2010: 16 buildings, average cost: $83,600
- 2009: 6 buildings, average cost: $91,800
- 2008: 9 buildings, average cost: $87,600
- 2007: 13 buildings, average cost: $87,600
- 2006: 15 buildings, average cost: $84,100
- 2005: 13 buildings, average cost: $88,400
- 2004: 7 buildings, average cost: $95,200
- 2003: 6 buildings, average cost: $95,200
- 2002: 8 buildings, average cost: $79,200
- 2001: 5 buildings, average cost: $105,400
- 2000: 4 buildings, average cost: $72,300
- 1999: 6 buildings, average cost: $87,900
- 1998: 6 buildings, average cost: $67,100
- 1997: 12 buildings, average cost: $69,800
Median real estate property taxes paid for housing units with mortgages in 2022: $3,419 (1.6%)
Median real estate property taxes paid for housing units with no mortgage in 2022: $1,563 (1.0%)
| Palo Pinto County: | 15.9% |
| Texas: | 14.0% |
Median age of residents in 2022: 41.8 years old
(Males: 41.2 years old, Females: 42.1 years old)
(Median age for: White residents: 46.7 years old, Black residents: 43.2 years old, American Indian residents: 19.8 years old, Asian residents: 35.1 years old, Hispanic or Latino residents: 26.0 years old, Other race residents: 41.5 years old)
Fair market rent in 2006 for a 1-bedroom apartment in Palo Pinto County is $409 a month.
Fair market rent for a 2-bedroom apartment is $507 a month.
Fair market rent for a 3-bedroom apartment is $700 a month.
Cities in this county include: Mineral Wells, Palo Pinto-Santo, Strawn, Graford, Gordon, Palo Pinto, Mingus.
Neighboring counties: Allendale County, South Carolina  , Ventura County, California
  , Ellis County
  , Warren County, Georgia , Marion County .
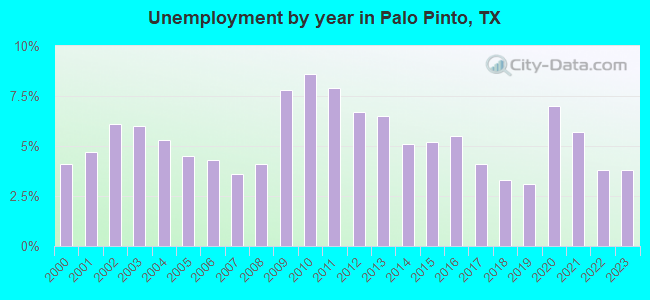
| Here: | 3.2% |
| Texas: | 3.5% |
Current college students: 610
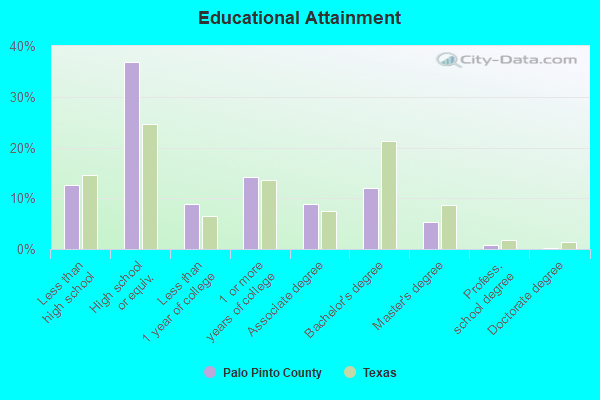
People 25 years of age or older with a high school degree or higher: 87.5%
People 25 years of age or older with a bachelor's degree or higher: 18.1%
Number of foreign born residents: 1,502 (40.2% naturalized citizens)
| Palo Pinto County: | 5.1% |
| Whole state: | 17.2% |
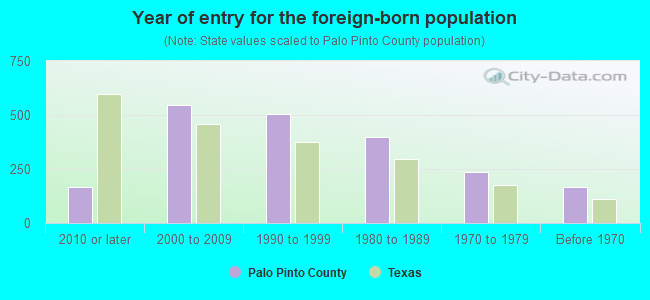
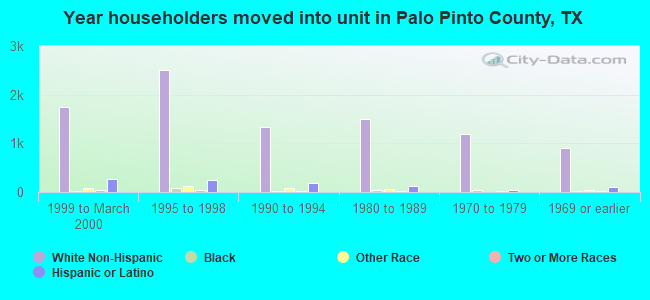
- Year of entry for the foreign-born population
- 1742010 or later
- 5102000 to 2009
- 3641990 to 1999
- 3981980 to 1989
- 2361970 to 1979
- 167Before 1970
Mean travel time to work (commute): minutes
Percentage of county residents living and working in this county: 99.2%
Housing units in structures:
- One, detached: 11,109
- One, attached: 173
- Two: 394
- 3 or 4: 464
- 5 to 9: 288
- 10 to 19: 142
- 20 to 49: 123
- 50 or more: 317
- Mobile homes: 2,548
- Boats, RVs, vans, etc.: 66
Housing units in Palo Pinto County with a mortgage: 3,041 (82 second mortgage, 0 home equity loan, 48 both second mortgage and home equity loan)
Houses without a mortgage: 20
| Here: | 13.0% with mortgage |
| State: | 98.4% with mortgage |
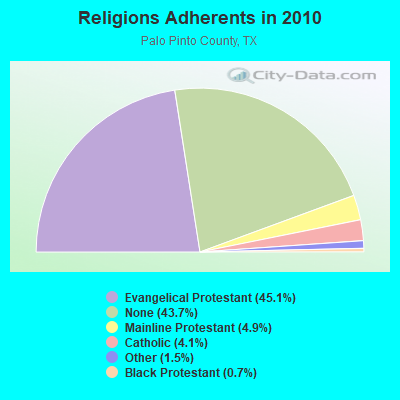
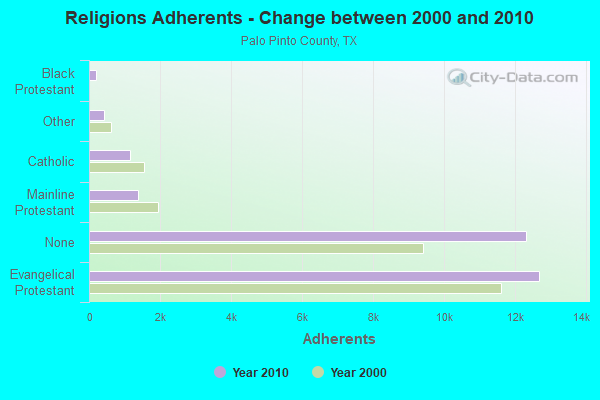
Religion statistics for Palo Pinto County
| Religion | Adherents | Congregations |
|---|---|---|
| Evangelical Protestant | 12,679 | 61 |
| Mainline Protestant | 1,376 | 10 |
| Catholic | 1,152 | 3 |
| Other | 429 | 3 |
| Black Protestant | 186 | 1 |
| None | 12,289 | - |
Source: Clifford Grammich, Kirk Hadaway, Richard Houseal, Dale E.Jones, Alexei Krindatch, Richie Stanley and Richard H.Taylor. 2012. 2010 U.S.Religion Census: Religious Congregations & Membership Study. Association of Statisticians of American Religious Bodies. Jones, Dale E., et al. 2002. Congregations and Membership in the United States 2000. Nashville, TN: Glenmary Research Center.
Food Environment Statistics:
| Palo Pinto County: | 2.93 / 10,000 pop. |
| State: | 1.47 / 10,000 pop. |
| This county: | 2.93 / 10,000 pop. |
| Texas: | 1.11 / 10,000 pop. |
| Palo Pinto County: | 7.33 / 10,000 pop. |
| Texas: | 3.95 / 10,000 pop. |
| This county: | 9.90 / 10,000 pop. |
| State: | 6.13 / 10,000 pop. |
| Palo Pinto County: | 9.2% |
| Texas: | 8.9% |
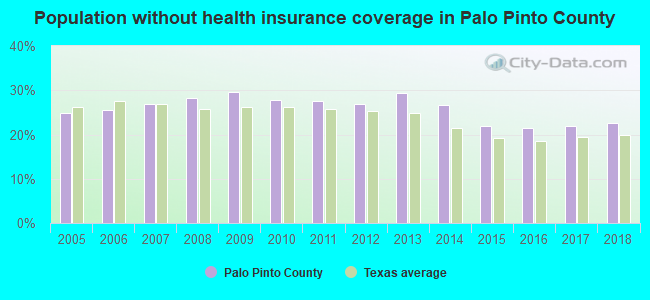
| Palo Pinto County: | 29.2% |
| State: | 26.6% |
| Here: | 18.7% |
| State: | 15.7% |
Agriculture in Palo Pinto County:
Average size of farms: 503 acresAverage value of agricultural products sold per farm: $15,890
Average value of crops sold per acre for harvested cropland: $82.14
The value of nursery, greenhouse, floriculture, and sod as a percentage of the total market value of agricultural products sold: 5.18%
The value of livestock, poultry, and their products as a percentage of the total market value of agricultural products sold: 84.45%
Average total farm production expenses per farm: $18,231
Harvested cropland as a percentage of land in farms: 5.98%
Irrigated harvested cropland as a percentage of land in farms: 5.78%
Average market value of all machinery and equipment per farm: $29,306
The percentage of farms operated by a family or individual: 92.95%
Average age of principal farm operators: 57 years
Average number of cattle and calves per 100 acres of all land in farms: 8.17
Milk cows as a percentage of all cattle and calves: 1.41%
All wheat for grain: 1446 harvested acres
Vegetables: 78 harvested acres
Land in orchards: 2,869 acres
Earthquake activity:
Palo Pinto County-area historical earthquake activity is significantly above Texas state average. It is 457% greater than the overall U.S. average.On 11/6/2011 at 03:53:10, a magnitude 5.7 (5.7 MW, Depth: 3.2 mi, Class: Moderate, Intensity: VI - VII) earthquake occurred 210.4 miles away from Palo Pinto County center
On 6/16/1978 at 11:46:54, a magnitude 5.3 (4.4 MB, 4.6 UK, 5.3 ML) earthquake occurred 146.6 miles away from the county center
On 9/3/2016 at 12:02:44, a magnitude 5.8 (5.8 MW, Depth: 3.5 mi) earthquake occurred 265.0 miles away from the county center
On 4/14/1995 at 00:32:56, a magnitude 5.7 (5.6 MB, 5.7 MS, 5.7 MW, Depth: 11.1 mi) earthquake occurred 346.1 miles away from the county center
On 11/7/2016 at 01:44:24, a magnitude 5.0 (5.0 MW, Depth: 2.8 mi) earthquake occurred 238.9 miles away from Palo Pinto County center
On 2/13/2016 at 17:07:06, a magnitude 5.1 (5.1 MW, Depth: 5.2 mi) earthquake occurred 259.6 miles away from the county center
Magnitude types: body-wave magnitude (MB), local magnitude (ML), surface-wave magnitude (MS), moment magnitude (MW)
Most recent natural disasters:
- Texas Covid-19 Pandemic, Incident Period: January 20, 2020, FEMA Id: 4485, Natural disaster type: Other
- Texas Severe Storms and Flooding, Incident Period: May 22, 2016 to June 24, 2016, Major Disaster (Presidential) Declared DR-4272: June 11, 2016, FEMA Id: 4272, Natural disaster type: Storm, Flood
- Texas Severe Storms, Tornadoes, Straight-line Winds, and Flooding, Incident Period: May 04, 2015 to June 23, 2015, Major Disaster (Presidential) Declared DR-4223: May 29, 2015, FEMA Id: 4223, Natural disaster type: Storm, Tornado, Flood, Wind
- Texas 101 Ranch Fire, Incident Period: August 30, 2011 to October 01, 2011, Fire Management Assistance Declared: August 30, 2011, FEMA Id: 2952, Natural disaster type: Fire
- Texas PK East Fire, Incident Period: April 16, 2011 to May 04, 2011, Fire Management Assistance Declared: April 16, 2011, FEMA Id: 2895, Natural disaster type: Fire
- Texas PK West Fire, Incident Period: April 13, 2011 to May 12, 2011, Fire Management Assistance Declared: April 15, 2011, FEMA Id: 2888, Natural disaster type: Fire
- Texas Hohertz Fire, Incident Period: April 09, 2011 to May 12, 2011, Fire Management Assistance Declared: April 16, 2011, FEMA Id: 2893, Natural disaster type: Fire
- Texas Wildfires, Incident Period: April 06, 2011 to August 29, 2011, Major Disaster (Presidential) Declared DR-1999: July 01, 2011, FEMA Id: 1999, Natural disaster type: Fire
- Texas 1148 Fire, Incident Period: April 09, 2009 to April 16, 2009, Fire Management Assistance Declared: April 10, 2009, FEMA Id: 2814, Natural disaster type: Fire
- Texas Wildfires, Incident Period: March 14, 2008 to September 01, 2008, Emergency Declared EM-3284: March 14, 2008, FEMA Id: 3284, Natural disaster type: Fire
- 12 other natural disasters have been reported since 1953.
The number of natural disasters in Palo Pinto County (22) is greater than the US average (15).
Major Disasters (Presidential) Declared: 9
Emergencies Declared: 6
Causes of natural disasters: Fires: 12, Storms: 6, Floods: 5, Hurricanes: 3, Tornadoes: 3, Wind: 1, Other: 1 (Note: some incidents may be assigned to more than one category).
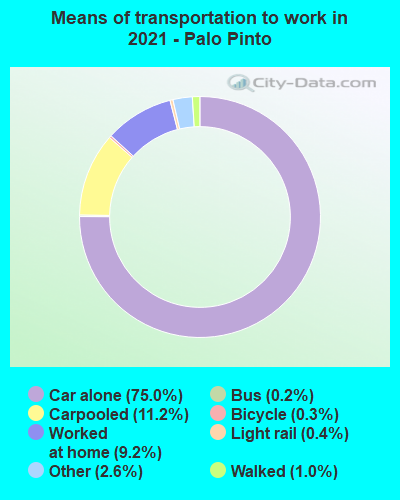
Means of transportation to work:
- Drove a car alone: 6,482 (67.4%)
- Carpooled: 1,457 (15.2%)
- Bus: 12 (0.1%)
- Light rail, streetcar or trolley: 14 (0.1%)
- Taxicab, motorcycle, or other means: 349 (3.6%)
- Walked: 100 (1.0%)
- Worked at home: 1,239 (12.9%)
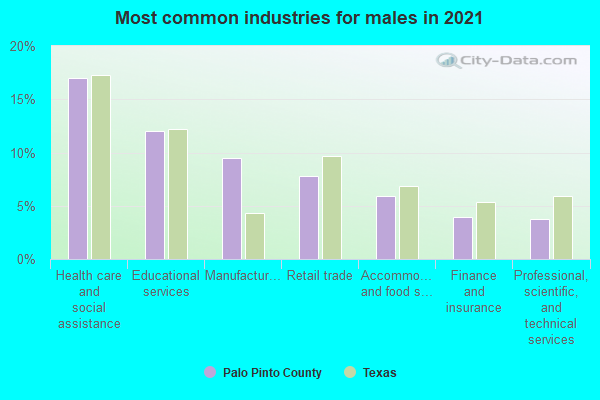
- Health care and social assistance (16%)
- Educational services (12%)
- Retail trade (9%)
- Manufacturing (8%)
- Accommodation and food services (7%)
- Construction (4%)
- Transportation and warehousing (4%)
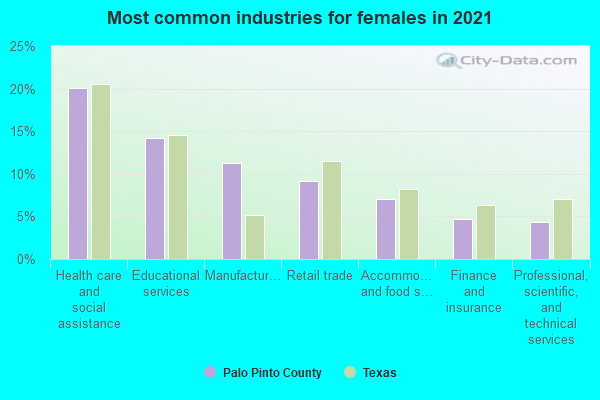
- Health care and social assistance (19%)
- Educational services (14%)
- Retail trade (10%)
- Manufacturing (10%)
- Accommodation and food services (9%)
- Construction (5%)
- Transportation and warehousing (5%)
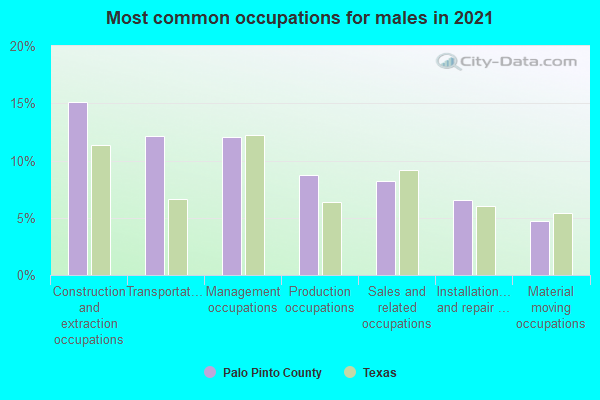
- Construction and extraction occupations (16%)
- Management occupations (13%)
- Production occupations (10%)
- Transportation occupations (9%)
- Sales and related occupations (8%)
- Installation, maintenance, and repair occupations (7%)
- Material moving occupations (4%)
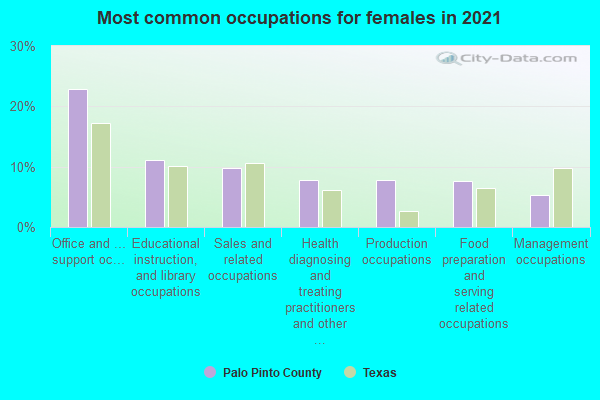
- Office and administrative support occupations (23%)
- Educational instruction, and library occupations (11%)
- Sales and related occupations (10%)
- Production occupations (7%)
- Health diagnosing and treating practitioners and other technical occupations (7%)
- Food preparation and serving related occupations (6%)
- Management occupations (6%)
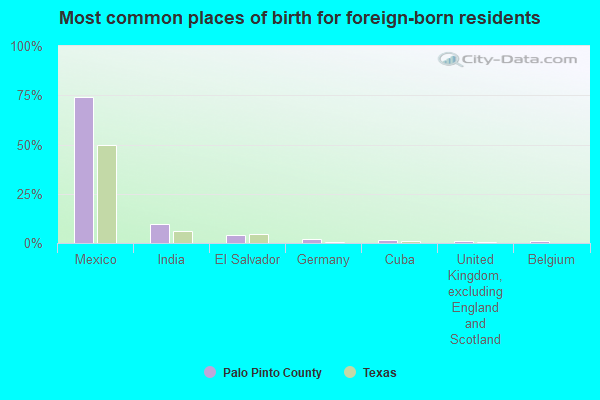
- Mexico (69%)
- India (13%)
- El Salvador (6%)
- Austria (3%)
- Germany (2%)
- Cuba (2%)
- Belgium (1%)
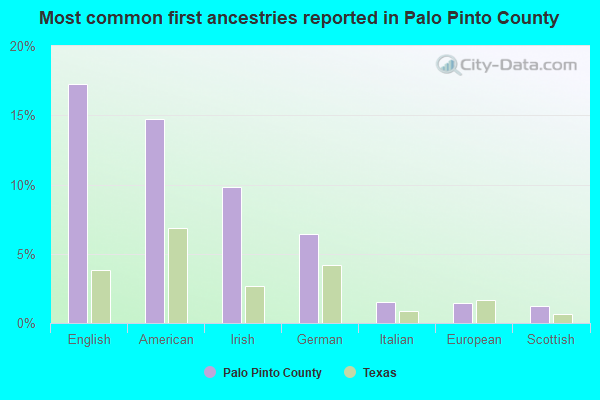
- English (20%)
- American (15%)
- Irish (9%)
- German (6%)
- Scotch-Irish (1%)
- Italian (1%)
- European (1%)
People in group quarters in Palo Pinto County, Texas in 2010:
- 150 people in nursing facilities/skilled-nursing facilities
- 97 people in local jails and other municipal confinement facilities
- 10 people in group homes intended for adults
- 6 people in other noninstitutional facilities
People in group quarters in Palo Pinto County, Texas in 2000:
- 197 people in nursing homes
- 106 people in local jails and other confinement facilities (including police lockups)
- 9 people in homes for the mentally retarded
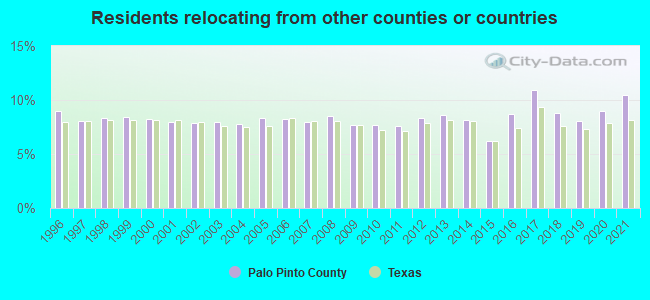
10.43% of this county's 2021 resident taxpayers lived in other counties in 2020 ($67,225 average adjusted gross income)
| Here: | 10.43% |
| Texas average: | 8.12% |
10 or fewer of this county's residents moved from foreign countries.
8.81% relocated from other counties in Texas ($54,777 average AGI)
1.62% relocated from other states ($12,446 average AGI)
Palo Pinto County: 1.62% Texas average: 2.83%
Top counties from which taxpayers relocated into this county between 2020 and 2021:
| from Parker County, TX | |
| from Tarrant County, TX | |
| from Erath County, TX | |
| from Dallas County, TX | |
| from Denton County, TX | |
| from Hood County, TX | |
| from Johnson County, TX |
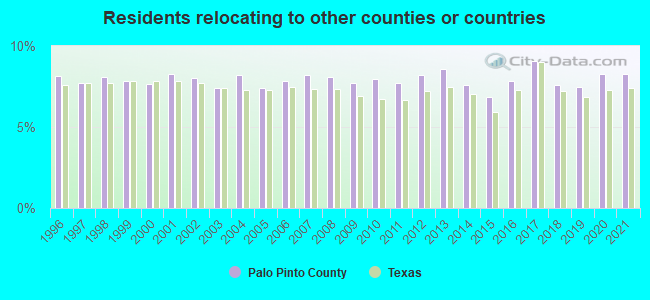
8.28% of this county's 2020 resident taxpayers moved to other counties in 2021 ($50,043 average adjusted gross income)
| Here: | 8.28% |
| Texas average: | 7.40% |
10 or fewer of this county's residents moved to foreign countries.
6.94% relocated to other counties in Texas ($44,046 average AGI)
1.34% relocated to other states ($5,997 average AGI)
Palo Pinto County: 1.34% Texas average: 2.08%
Top counties to which taxpayers relocated from this county between 2020 and 2021:
| to Parker County, TX | |
| to Tarrant County, TX | |
| to Young County, TX | |
| to Erath County, TX | |
| to Hood County, TX | |
| to Jack County, TX | |
| to Dallas County, TX |
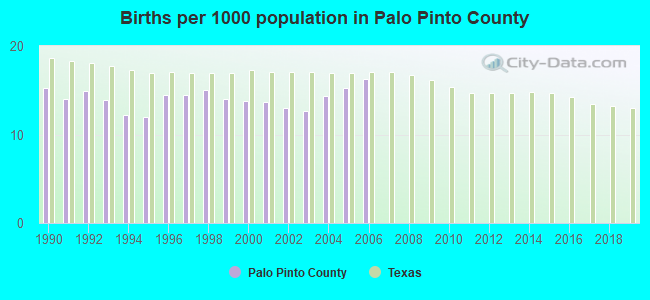
Births per 1000 population from 1990 to 1999: 14.0
Births per 1000 population from 2000 to 2006: 14.2
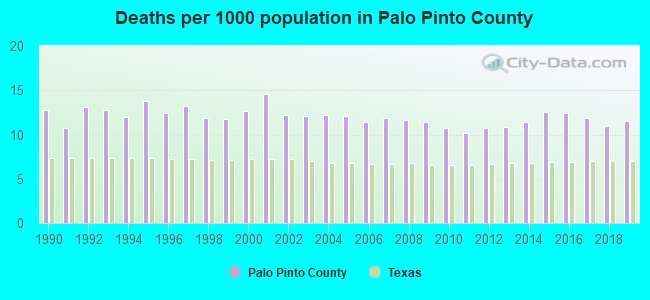
Deaths per 1000 population from 1990 to 1999: 12.4
Deaths per 1000 population from 2000 to 2009: 12.2
Deaths per 1000 population from 2010 to 2020: 11.7
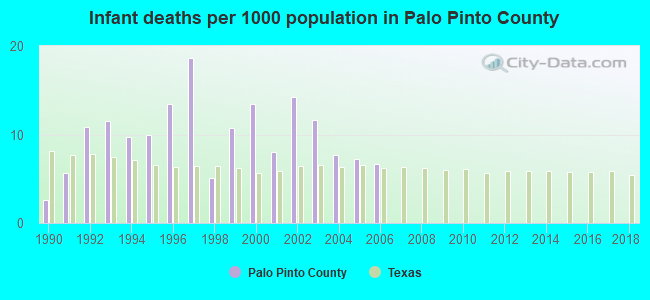
Infant deaths per 1000 live births from 1990 to 1999: 9.8
Infant deaths per 1000 live births from 2000 to 2006: 9.8
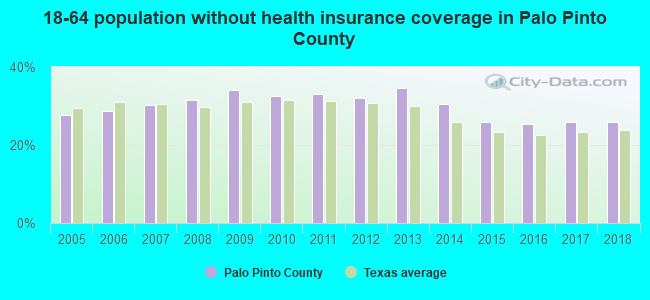
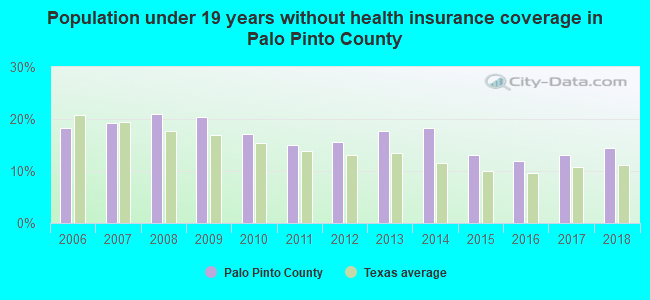
Persons under 19 years old without health insurance coverage in 2018: 14.5%
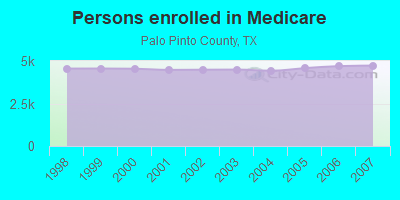
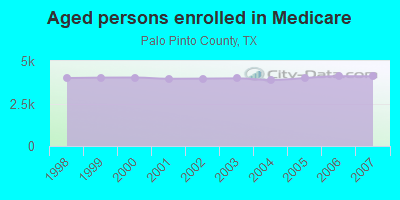
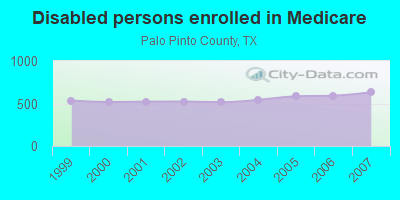
Persons enrolled in hospital insurance and/or supplemental medical insurance (Medicare) in July 1, 2007: 4,730 (4,098 aged, 632 disabled)
Children under 18 without health insurance coverage in 2007: 1,272 (18%)
Most common underlying causes of death in Palo Pinto County, Texas in 1999 - 2019:
- Atherosclerotic heart disease (511)
- Acute myocardial infarction, unspecified (495)
- Bronchus or lung, unspecified - Malignant neoplasms (478)
- Chronic obstructive pulmonary disease, unspecified (397)
- Atherosclerotic cardiovascular disease, so described (369)
- Stroke, not specified as haemorrhage or infarction (145)
- Alzheimer disease, unspecified (84)
- Congestive heart failure (23)
- Colon, unspecified - Malignant neoplasms (20)
- Unspecified dementia (20)
Population without health insurance coverage in 2000: 20%
Children under 18 without health insurance coverage in 2000: 20%
Short term general hospital admissions per 100,000 population in 2004: 10,013
Short term general hospital beds per 100,000 population in 2004: 154
Emergency room visits per 100,000 population in 2004: 64,242
General practice office based MDs per 100,000 population in 2005: 1,514
Medical specialist MDs per 100,000 population in 2005: 1,230
Dentists per 100,000 population in 1998: 7
Total births per 100,000 population, July 2005 - July 2006 : 35
Total deaths per 100,000 population, July 2005 - July 2006: 80
Limited-service eating places per 100,000 population in 2005 : 4
Crimes per 100,000 population in 1996: 1
Suicides per 1,000,000 population from 2000 to 2006: 205.0. This is more than state average.
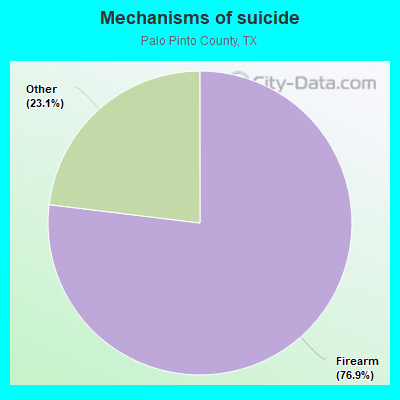
- Firearm - 157.7
- Other - 47.3
Household type by relationship:
Households: 29,337- Male householders: 5,606 (1,308 living alone), Female householders: 5,639 (1,672 living alone)
5,460 spouses (5,442 opposite-sex spouses), 1,249 unmarried partners, (1,210 opposite-sex unmarried partners), 8,011 children (6,914 natural, 389 adopted, 713 stepchildren), 864 grandchildren, 209 brothers or sisters, 510 parents, 22 foster children, 778 other relatives, 777 non-relatives
- In group quarters: 287
Size of family households: 3,960 2-persons, 1,346 3-persons, 1,141 4-persons, 636 5-persons, 339 6-persons, 182 7-or-more-persons.
Size of nonfamily households: 2,980 1-person, 556 2-persons, 125 3-persons, 3 4-persons.
3,634 married couples with children.
2,182 single-parent households (799 men, 1,383 women).
87.8% of residents of Palo Pinto speak English at home.
11.3% of residents speak Spanish at home (70% speak English very well, 17% speak English well, 10% speak English not well, 3% don't speak English at all).
0.6% of residents speak other Indo-European language at home (70% speak English very well, 30% speak English not well).
0.4% of residents speak Asian or Pacific Island language at home (100% speak English very well).
In fiscal year 2004:
Federal Government expenditure: $155,619,000 ($5,695 per capita)
Department of Defense expenditure: $8,748,000
Federal direct payments to individuals for retirement and disability: $71,108,000
Federal other direct payments to individuals: $39,468,000
Federal direct payments not to individuals: $337,000
Federal grants: $38,440,000
Federal procurement contracts: $2,415,000 ($1,084,000 Department of Defense)
Federal salaries and wages: $3,850,000 ($681,000 Department of Defense)
Federal Government direct loans: $1,173,000
Federal guaranteed/insured loans: $4,003,000
Federal Government insurance: $10,038,000
Population change from April 1, 2000 to July 1, 2005:
Births: 1,834| Here: | 67 per 1000 residents |
| State: | 85 per 1000 residents |
Deaths: 1,837
| Here: | 67 per 1000 residents |
| State: | 35 per 1000 residents |
Net international migration: +238
| Here: | +9 per 1000 residents |
| State: | +29 per 1000 residents |
Net internal migration: +269
| Here: | +10 per 1000 residents |
| State: | +10 per 1000 residents |
Total withdrawal of fresh water for public supply: 5.85 millions of gallons per day (all from surface)
| Here: | 6.1 |
| State: | 6.3 |
| Here: | 4.7 |
| State: | 4.0 |
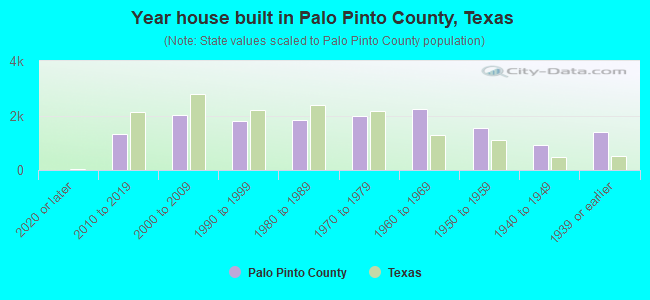
- Year house built in Palo Pinto County, Texas
- 732020 or later
- 1,5672010 to 2019
- 2,0752000 to 2009
- 1,7211990 to 1999
- 2,1601980 to 1989
- 1,8421970 to 1979
- 2,1361960 to 1969
- 1,3531950 to 1959
- 8491940 to 1949
- 1,2401939 or earlier
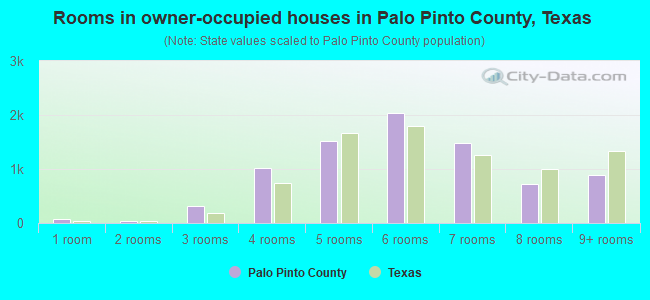
- Rooms in owner-occupied houses in Palo Pinto County, Texas
- 611 room
- 562 rooms
- 3013 rooms
- 1,0974 rooms
- 1,4235 rooms
- 2,0336 rooms
- 1,5047 rooms
- 7368 rooms
- 9229+ rooms
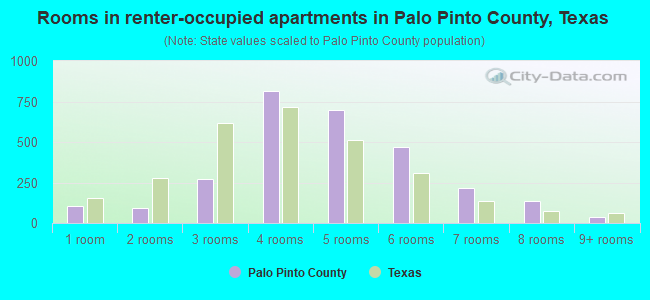
- Rooms in renter-occupied apartments in Palo Pinto County, Texas
- 711 room
- 1112 rooms
- 2513 rooms
- 8664 rooms
- 7435 rooms
- 5726 rooms
- 2817 rooms
- 1328 rooms
- 449+ rooms
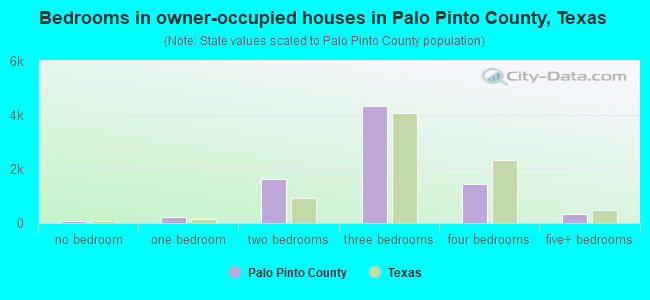
- Bedrooms in owner-occupied houses in Palo Pinto County, Texas
- 68no bedroom
- 2131 bedroom
- 1,5472 bedrooms
- 4,4363 bedrooms
- 1,3864 bedrooms
- 4415+ bedrooms
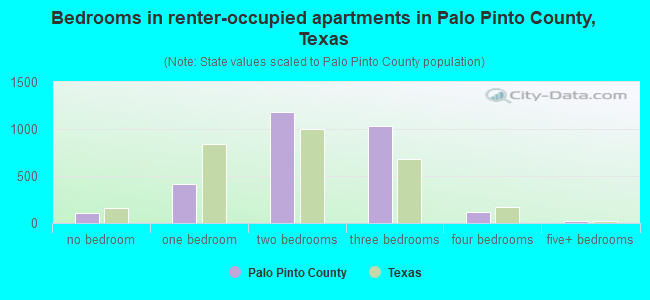
- Bedrooms in renter-occupied apartments in Palo Pinto County, Texas
- 71no bedroom
- 4041 bedroom
- 1,2842 bedrooms
- 1,1623 bedrooms
- 1674 bedrooms
- 35+ bedrooms
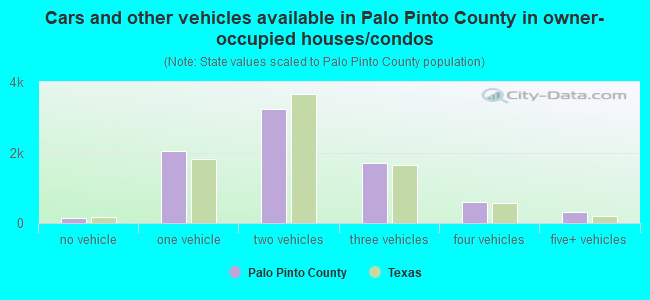
- Cars and other vehicles available in Palo Pinto County in owner-occupied houses/condos
- 174no vehicle
- 2,0901 vehicle
- 3,3332 vehicles
- 1,6253 vehicles
- 5664 vehicles
- 3325+ vehicles
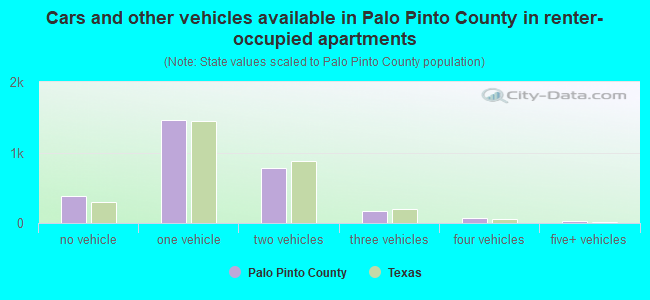
- Cars and other vehicles available in Palo Pinto County in renter-occupied apartments
- 290no vehicle
- 1,4961 vehicle
- 9652 vehicles
- 2373 vehicles
- 1124 vehicles
- 335+ vehicles
87.5% of Palo Pinto County residents lived in the same house 1 years ago.
Out of people who lived in different houses, 32% lived in this county.
Out of people who lived in different counties, 82% lived in Texas.
| Palo Pinto County: | 87.5% |
| State average: | 85.7% |
Place of birth for U.S.-born residents:
- This state: 21,633
- Other state: 5,684
- Northeast: 411
- Midwest: 1,750
- South: 1,607
- West: 1,935
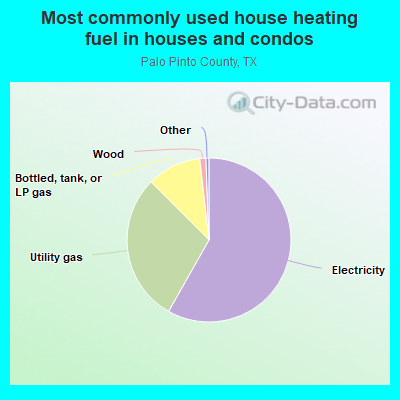
- 56.5%Electricity
- 28.7%Utility gas
- 12.5%Bottled, tank, or LP gas
- 1.3%Wood
- 0.6%Other fuel
- 0.4%No fuel used
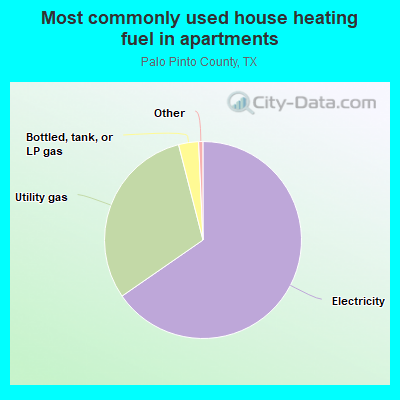
- 59.7%Electricity
- 35.5%Utility gas
- 2.9%Bottled, tank, or LP gas
- 1.7%No fuel used
- 0.2%Solar energy
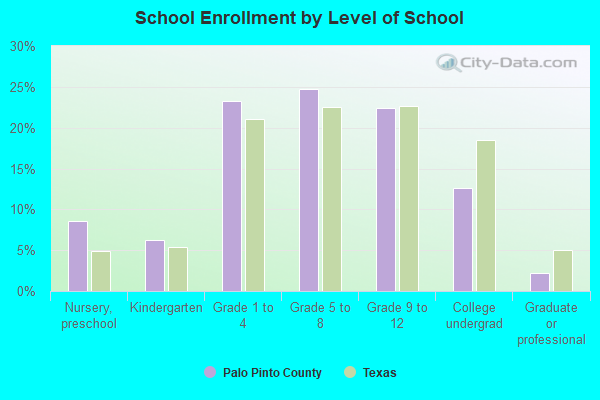
Private vs. public school enrollment:
| Here: | 7.6% |
| Texas: | 8.8% |
| Here: | 8.4% |
| Texas: | 8.0% |
| Here: | 23.2% |
| Texas: | 16.2% |
Palo Pinto County government finances - Expenditure in 2017:
- Bond Funds - Cash and Securities: $167,000
- Charges - Other: $2,449,000
- Construction - Regular Highways: $430,000
General - Other: $4,000
- Current Operations - General - Other: $4,959,000
Regular Highways: $2,942,000
Police Protection: $2,657,000
Correctional Institutions: $2,253,000
Judicial and Legal Services: $1,884,000
Financial Administration: $1,188,000
Central Staff Services: $849,000
Health - Other: $146,000
Natural Resources - Other: $119,000
Corrections - Other: $25,000
- General - Interest on Debt: $32,000
- Long Term Debt - Outstanding Unspecified Public Purpose: $810,000
Beginning Outstanding - Unspecified Public Purpose: $810,000
- Miscellaneous - Interest Earnings: $355,000
General Revenue - Other: $230,000
Fines and Forfeits: $10,000
- Other Capital Outlay - Regular Highways: $118,000
- Other Funds - Cash and Securities: $11,197,000
- State Intergovernmental - Other: $533,000
General Local Government Support: $41,000
- Tax - Property: $10,023,000
General Sales and Gross Receipts: $1,740,000
Motor Vehicle License: $884,000
Other Selective Sales: $141,000
- Total Salaries and Wages: $5,905,000
Palo Pinto County government finances - Revenue in 2017:
- Bond Funds - Cash and Securities: $167,000
- Charges - Other: $2,449,000
- Construction - Regular Highways: $430,000
General - Other: $4,000
- Current Operations - General - Other: $4,959,000
Regular Highways: $2,942,000
Police Protection: $2,657,000
Correctional Institutions: $2,253,000
Judicial and Legal Services: $1,884,000
Financial Administration: $1,188,000
Central Staff Services: $849,000
Health - Other: $146,000
Natural Resources - Other: $119,000
Corrections - Other: $25,000
- General - Interest on Debt: $32,000
- Long Term Debt - Outstanding Unspecified Public Purpose: $810,000
Beginning Outstanding - Unspecified Public Purpose: $810,000
- Miscellaneous - Interest Earnings: $355,000
General Revenue - Other: $230,000
Fines and Forfeits: $10,000
- Other Capital Outlay - Regular Highways: $118,000
- Other Funds - Cash and Securities: $11,197,000
- State Intergovernmental - Other: $533,000
General Local Government Support: $41,000
- Tax - Property: $10,023,000
General Sales and Gross Receipts: $1,740,000
Motor Vehicle License: $884,000
Other Selective Sales: $141,000
- Total Salaries and Wages: $5,905,000
Palo Pinto County government finances - Debt in 2017:
- Bond Funds - Cash and Securities: $167,000
- Charges - Other: $2,449,000
- Construction - Regular Highways: $430,000
General - Other: $4,000
- Current Operations - General - Other: $4,959,000
Regular Highways: $2,942,000
Police Protection: $2,657,000
Correctional Institutions: $2,253,000
Judicial and Legal Services: $1,884,000
Financial Administration: $1,188,000
Central Staff Services: $849,000
Health - Other: $146,000
Natural Resources - Other: $119,000
Corrections - Other: $25,000
- General - Interest on Debt: $32,000
- Long Term Debt - Outstanding Unspecified Public Purpose: $810,000
Beginning Outstanding - Unspecified Public Purpose: $810,000
- Miscellaneous - Interest Earnings: $355,000
General Revenue - Other: $230,000
Fines and Forfeits: $10,000
- Other Capital Outlay - Regular Highways: $118,000
- Other Funds - Cash and Securities: $11,197,000
- State Intergovernmental - Other: $533,000
General Local Government Support: $41,000
- Tax - Property: $10,023,000
General Sales and Gross Receipts: $1,740,000
Motor Vehicle License: $884,000
Other Selective Sales: $141,000
- Total Salaries and Wages: $5,905,000
Palo Pinto County government finances - Cash and Securities in 2017:
- Bond Funds - Cash and Securities: $167,000
- Charges - Other: $2,449,000
- Construction - Regular Highways: $430,000
General - Other: $4,000
- Current Operations - General - Other: $4,959,000
Regular Highways: $2,942,000
Police Protection: $2,657,000
Correctional Institutions: $2,253,000
Judicial and Legal Services: $1,884,000
Financial Administration: $1,188,000
Central Staff Services: $849,000
Health - Other: $146,000
Natural Resources - Other: $119,000
Corrections - Other: $25,000
- General - Interest on Debt: $32,000
- Long Term Debt - Outstanding Unspecified Public Purpose: $810,000
Beginning Outstanding - Unspecified Public Purpose: $810,000
- Miscellaneous - Interest Earnings: $355,000
General Revenue - Other: $230,000
Fines and Forfeits: $10,000
- Other Capital Outlay - Regular Highways: $118,000
- Other Funds - Cash and Securities: $11,197,000
- State Intergovernmental - Other: $533,000
General Local Government Support: $41,000
- Tax - Property: $10,023,000
General Sales and Gross Receipts: $1,740,000
Motor Vehicle License: $884,000
Other Selective Sales: $141,000
- Total Salaries and Wages: $5,905,000
Supplemental Security Income (SSI) in 2006:
- Total number of recipients: 591
- Number of aged recipients: 80
- Number of blind and disabled recipients: 511
- Number of recipients under 18: 94
- Number of recipients between 18 and 64: 359
- Number of recipients older than 64: 138
- Number of recipients also receiving OASDI: 228
- Amount of payments (thousands of dollars): 259
| Most common first names in Palo Pinto County, TX among deceased individuals | ||
| Name | Count | Lived (average) |
|---|---|---|
| James | 219 | 72.8 years |
| William | 205 | 76.3 years |
| Mary | 197 | 77.9 years |
| John | 177 | 76.3 years |
| Robert | 148 | 73.6 years |
| George | 107 | 75.8 years |
| Charles | 93 | 71.7 years |
| Thomas | 73 | 72.3 years |
| Willie | 58 | 79.7 years |
| Joe | 56 | 74.1 years |
| Most common last names in Palo Pinto County, TX among deceased individuals | ||
| Last name | Count | Lived (average) |
|---|---|---|
| Smith | 106 | 73.5 years |
| Davis | 76 | 76.3 years |
| Walker | 65 | 75.6 years |
| Moore | 62 | 76.6 years |
| Jones | 60 | 77.4 years |
| Glover | 55 | 74.8 years |
| Brown | 52 | 77.3 years |
| White | 49 | 77.3 years |
| Johnson | 47 | 73.9 years |
| Miller | 43 | 72.2 years |
| Businesses in Palo Pinto County, TX | ||||
| Name | Count | Name | Count | |
|---|---|---|---|---|
| AT&T | 1 | KFC | 1 | |
| Ace Hardware | 1 | Knights Inn | 1 | |
| AutoZone | 1 | McDonald's | 1 | |
| Best Western | 1 | Nike | 1 | |
| Blockbuster | 1 | Payless | 1 | |
| Burger King | 1 | Pizza Hut | 1 | |
| CVS | 1 | RadioShack | 1 | |
| Chevrolet | 1 | SONIC Drive-In | 1 | |
| Dairy Queen | 2 | Sears | 1 | |
| Days Inn | 1 | Subway | 2 | |
| Domino's Pizza | 1 | U-Haul | 3 | |
| FedEx | 3 | UPS | 1 | |
| Ford | 2 | Vans | 1 | |
| H&R Block | 1 | Walmart | 1 | |
| Holiday Inn | 1 | |||