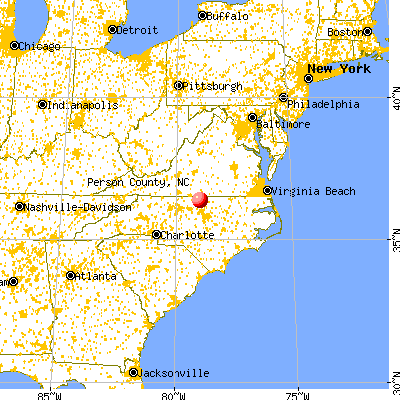
Person County, North Carolina (NC)
County owner-occupied free and clear houses and condos in 2010: 3,695
County owner-occupied houses and condos in 2000: 10,509
Renter-occupied apartments: 4,400 (it was 3,576 in 2000)
| % of renters here: | 25% |
| State: | 33% |
Land area: 392 sq. mi.
Water area: 11.8 sq. mi.
Population density: 102 people per square mile (average).
Industries providing employment: Educational, health and social services (23.2%), Manufacturing (15.6%), Retail trade (10.6%).
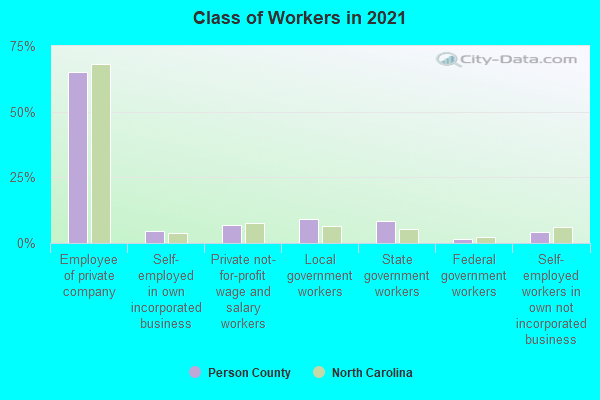
Type of workers:
- Private wage or salary: 81%
- Government: 15%
- Self-employed, not incorporated: 4%
- Unpaid family work: 0%
- OSM Map
- General Map
- Google Map
- MSN Map

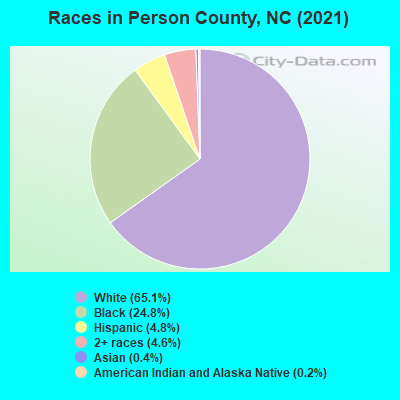
- 25,84765.0%White Non-Hispanic Alone
- 9,95825.0%Black Non-Hispanic Alone
- 2,0265.1%Hispanic or Latino
- 1,6824.2%Two or more races
- 1830.5%Asian alone
- 370.09%Some other race alone
- 310.08%American Indian and Alaska Native alone
- 60.02%Native Hawaiian and Other
Pacific Islander alone
| Median resident age: | 43.8 years |
| North Carolina median age: | 39.2 years |
| Males: 19,240 | |
| Females: 20,745 |

 | Yanceyville (79 replies) |
| NC's Triad vs The Triangle... (95 replies) |
| Triangle Population (35 replies) |
| Triangle housing market is not "cooling down" anytime soon (11 replies) |
| Franklin County Development and Growth (15 replies) |
| The next generation in NC (1 reply) |
| Person County: | 2.0 people |
| North Carolina: | 2 people |
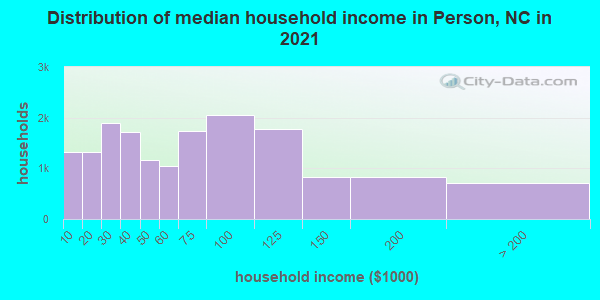
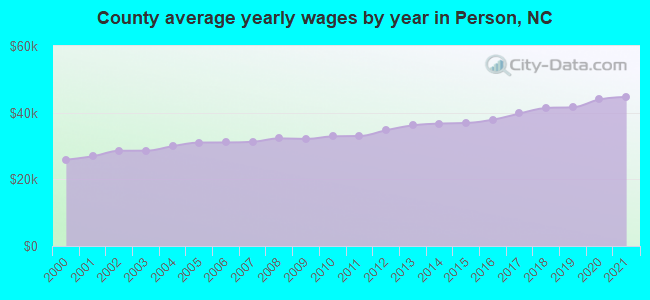
Estimated median household income in 2022: $61,875 ($37,159 in 1999)
| This county: | $61,875 |
| North Carolina: | $67,481 |
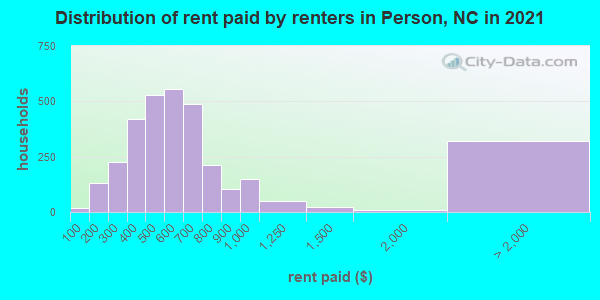
Median contract rent in 2022 for apartments: $558 (lower quartile is $385, upper quartile is $760)
| This county: | $558 |
| State: | $945 |
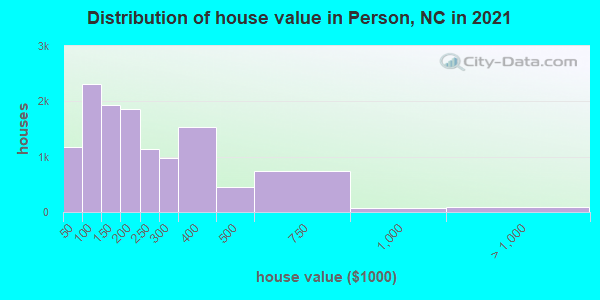
Estimated median house or condo value in 2022: $206,896 (it was $85,500 in 2000)
| Person: | $206,896 |
| North Carolina: | $280,600 |
Mean price in 2022:
Median monthly housing costs for homes and condos with a mortgage: $1,191Detached houses: $299,308
Here: $299,308 State: $375,326 Townhouses or other attached units: $305,465
Here: $305,465 State: $317,935 Mobile homes: $114,654
Here: $114,654 State: $124,933
Median monthly housing costs for units without a mortgage: $406
Institutionalized population: 337
Crime in 2021 (reported by the sheriff's office or county police, not the county total):
- Murders: 4
- Rapes: 9
- Robberies: 3
- Assaults: 20
- Burglaries: 226
- Thefts: 170
- Auto thefts: 23
Crime in 2020 (reported by the sheriff's office or county police, not the county total):
- Murders: 2
- Rapes: 4
- Robberies: 5
- Assaults: 43
- Burglaries: 110
- Thefts: 165
- Auto thefts: 28
Health of residents in Person County based on CDC Behavioral Risk Factor Surveillance System Survey Questionnaires from 2013 to 2021:
General health status score of residents in this county from 1 (poor) to 5 (excellent) is 3.5. This is about average.76.4% of residents exercised in the past month. This is about average.
43.2% of residents smoked 100+ cigarettes in their lives. This is about average.
50.1% of adult residents drank alcohol in the past 30 days. This is less than average.
Average weight of males is 193 pounds. This is about average.
Average weight of females is 161 pounds. This is about average.
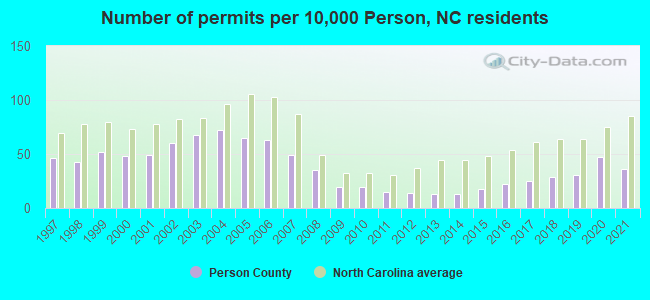
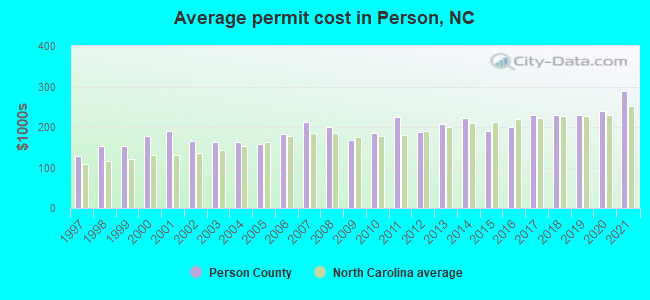
Single-family new house construction building permits:
- 2022: 152 buildings, average cost: $243,000
- 2021: 129 buildings, average cost: $290,200
- 2020: 168 buildings, average cost: $238,500
- 2019: 112 buildings, average cost: $230,300
- 2018: 105 buildings, average cost: $229,700
- 2017: 90 buildings, average cost: $229,100
- 2016: 77 buildings, average cost: $200,300
- 2015: 64 buildings, average cost: $190,600
- 2014: 45 buildings, average cost: $222,200
- 2013: 45 buildings, average cost: $208,400
- 2012: 51 buildings, average cost: $186,600
- 2011: 52 buildings, average cost: $225,100
- 2010: 68 buildings, average cost: $186,100
- 2009: 67 buildings, average cost: $167,800
- 2008: 123 buildings, average cost: $198,500
- 2007: 173 buildings, average cost: $212,000
- 2006: 223 buildings, average cost: $182,100
- 2005: 231 buildings, average cost: $158,000
- 2004: 255 buildings, average cost: $164,400
- 2003: 242 buildings, average cost: $162,400
- 2002: 214 buildings, average cost: $165,900
- 2001: 176 buildings, average cost: $190,100
- 2000: 172 buildings, average cost: $179,200
- 1999: 185 buildings, average cost: $154,400
- 1998: 153 buildings, average cost: $152,300
- 1997: 164 buildings, average cost: $128,200
Median real estate property taxes paid for housing units with mortgages in 2022: $1,283 (0.6%)
Median real estate property taxes paid for housing units with no mortgage in 2022: $1,097 (0.7%)
| Person County: | 16.5% |
| North Carolina: | 12.8% |
Median age of residents in 2022: 43.8 years old
(Males: 43.0 years old, Females: 45.5 years old)
(Median age for: White residents: 47.1 years old, Black residents: 43.0 years old, American Indian residents: 13.5 years old, Asian residents: 43.2 years old, Hispanic or Latino residents: 23.9 years old, Other race residents: 33.3 years old)
Fair market rent in 2006 for a 1-bedroom apartment in Person County is $439 a month.
Fair market rent for a 2-bedroom apartment is $530 a month.
Fair market rent for a 3-bedroom apartment is $633 a month.
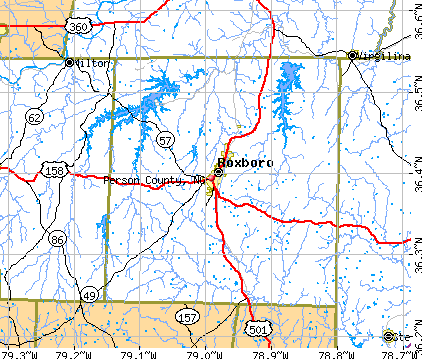
Cities in this county include: Roxboro.
2023 air pollution in Person County:
Ozone (1-hour): 0.036 ppm (standard limit: 0.12 ppm). Near U.S. average.
Notable locations in this county outside city limits:
Notable locations in Person County: Cherokee Scout Reservation (A), Red House (B), Yarbro (C), Dotmond (D), Cobbs Shop (E), Blanch Prison (F). Display/hide their locations on the map
Churches in Person County include: Griers Church (A), Gwynns Chapel (B), Hebron Church (C), High Rock Church (D), Hyco Church (E), Grace Church (F), Kerrs Chapel (G), Allens Chapel (H), Allred Memorial Tabernacle (I). Display/hide their locations on the map
Cemeteries: Gilead Cemetery (1), Cooper Cemetery (2), Apple Cemetery (3). Display/hide their locations on the map
Reservoirs: Caswell Wildlife Mgmt Area Pond T (A), Caswell Wildlife Mgmt Area Pond O (B), Boy Scout Lake (C), Wildwood Lake (D), Williams Lake (E), Carvers Lake (F), Butler Pond (G), Vinsons Lake (H). Display/hide their locations on the map
Streams, rivers, and creeks: Coy Creek (A), Coneys Creek (B), Byrds Creek (C), Burkes Creek (D), Benton Branch (E), Benaja Creek (F), Bear Branch (G), Wolf Island Creek (H), Whalebone Branch (I). Display/hide their locations on the map
Park in Person County: Caswell Game Land (1). Display/hide its location on the map
Neighboring counties: Fulton County, Kentucky  , Granville County
  , Guilford County
  , Humphreys County, Tennessee , Isle of Wight County, Virginia
  , Marshall County, Kentucky , Vance County
  .
.
| Here: | 3.1% |
| North Carolina: | 3.2% |
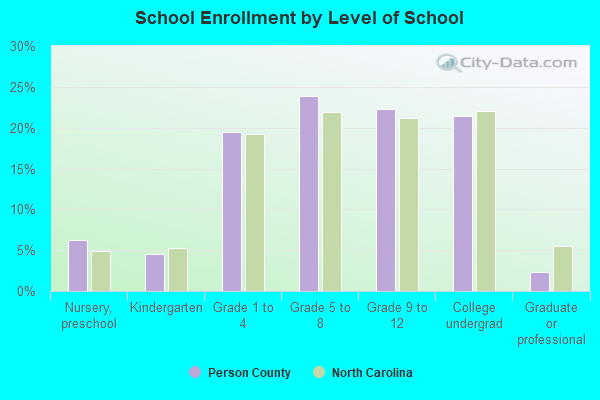
Current college students: 1,268
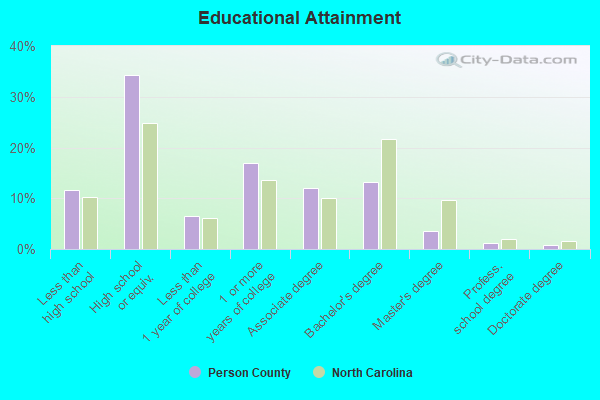
People 25 years of age or older with a high school degree or higher: 88.4%
People 25 years of age or older with a bachelor's degree or higher: 17.5%
Number of foreign born residents: 1,075 (56.5% naturalized citizens)
| Person County: | 2.7% |
| Whole state: | 8.6% |
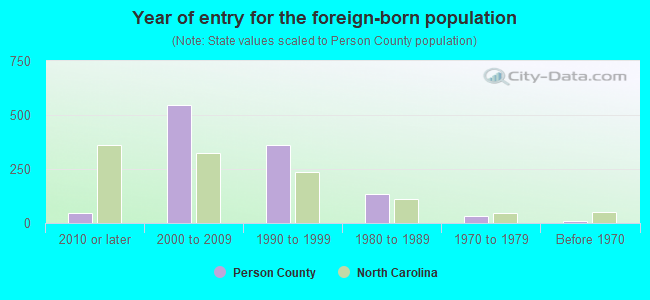
- Year of entry for the foreign-born population
- 1252010 or later
- 4382000 to 2009
- 2601990 to 1999
- 1331980 to 1989
- 341970 to 1979
- 9Before 1970
Mean travel time to work (commute): minutes
Percentage of county residents living and working in this county: 97.8%
Housing units in structures:
- One, detached: 14,115
- One, attached: 80
- Two: 114
- 3 or 4: 360
- 5 to 9: 382
- 10 to 19: 89
- 20 to 49: 69
- 50 or more: 56
- Mobile homes: 3,468
Housing units in Person County with a mortgage: 7,912 (642 second mortgage, 2 home equity loan, 611 both second mortgage and home equity loan)
Houses without a mortgage: 344
| Here: | 2.0% with mortgage |
| State: | 97.0% with mortgage |
Religion statistics for Person County
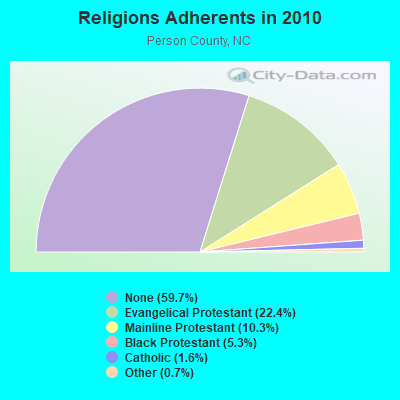
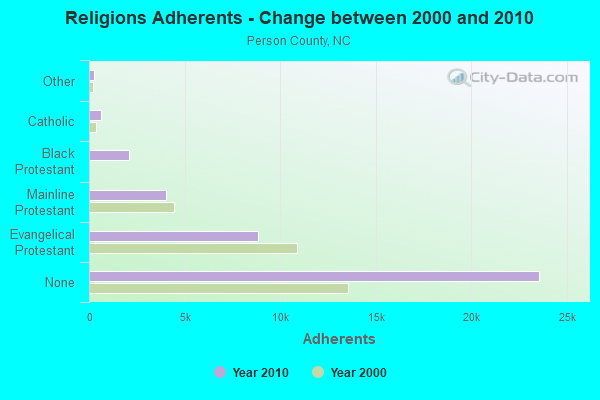
| Religion | Adherents | Congregations |
|---|---|---|
| Evangelical Protestant | 8,836 | 30 |
| Mainline Protestant | 4,048 | 16 |
| Black Protestant | 2,093 | 11 |
| Catholic | 640 | 1 |
| Other | 271 | 1 |
| None | 23,576 | - |
Source: Clifford Grammich, Kirk Hadaway, Richard Houseal, Dale E.Jones, Alexei Krindatch, Richie Stanley and Richard H.Taylor. 2012. 2010 U.S.Religion Census: Religious Congregations & Membership Study. Association of Statisticians of American Religious Bodies. Jones, Dale E., et al. 2002. Congregations and Membership in the United States 2000. Nashville, TN: Glenmary Research Center.
Food Environment Statistics:
| Person County: | 1.61 / 10,000 pop. |
| State: | 2.05 / 10,000 pop. |
| Here: | 0.27 / 10,000 pop. |
| North Carolina: | 0.14 / 10,000 pop. |
| This county: | 2.68 / 10,000 pop. |
| North Carolina: | 0.92 / 10,000 pop. |
| Person County: | 6.97 / 10,000 pop. |
| North Carolina: | 4.75 / 10,000 pop. |
| This county: | 4.02 / 10,000 pop. |
| State: | 7.57 / 10,000 pop. |
| Person County: | 10.9% |
| North Carolina: | 9.8% |
| Person County: | 32.0% |
| State: | 28.3% |
| Here: | 18.0% |
| State: | 15.6% |
Agriculture in Person County:
Average size of farms: 254 acresAverage value of agricultural products sold per farm: $48,454
Average value of crops sold per acre for harvested cropland: $610.74
The value of nursery, greenhouse, floriculture, and sod as a percentage of the total market value of agricultural products sold: 2.71%
The value of livestock, poultry, and their products as a percentage of the total market value of agricultural products sold: 17.83%
Average total farm production expenses per farm: $50,788
Harvested cropland as a percentage of land in farms: 25.62%
Irrigated harvested cropland as a percentage of land in farms: 9.35%
Average market value of all machinery and equipment per farm: $77,882
The percentage of farms operated by a family or individual: 90.11%
Average age of principal farm operators: 56 years
Average number of cattle and calves per 100 acres of all land in farms: 7.98
Milk cows as a percentage of all cattle and calves: 5.05%
Corn for grain: 1900 harvested acres
All wheat for grain: 5285 harvested acres
Soybeans for beans: 5275 harvested acres
Vegetables: 31 harvested acres
Land in orchards: 8 acres
Tornado activity:
Person County historical area-adjusted tornado activity is significantly below North Carolina state average. It is 13339948.0 times below overall U.S. average.Tornadoes in this county have caused 3 injuries recorded between 1950 and 2004.
On 5/7/1998, a tornado injured 2 people and caused $200,000 in damages.
Earthquake activity:
Person County-area historical earthquake activity is significantly above North Carolina state average. It is 42% smaller than the overall U.S. average.On 8/23/2011 at 17:51:04, a magnitude 5.8 (5.8 MW, Depth: 3.7 mi, Class: Moderate, Intensity: VI - VII) earthquake occurred 120.0 miles away from Person County center
On 8/9/2020 at 12:07:37, a magnitude 5.1 (5.1 MW, Depth: 4.7 mi) earthquake occurred 117.1 miles away from the county center
On 12/9/2003 at 20:59:14, a magnitude 4.5 (4.5 MB, 4.5 LG, Class: Light, Intensity: IV - V) earthquake occurred 102.2 miles away from the county center
On 12/9/2003 at 20:59:18, a magnitude 4.5 (4.5 ML, Depth: 6.2 mi) earthquake occurred 107.5 miles away from the county center
On 8/25/2011 at 05:07:52, a magnitude 4.5 (4.5 ML, Depth: 4.2 mi) earthquake occurred 121.4 miles away from Person County center
On 7/27/1980 at 18:52:21, a magnitude 5.2 (5.1 MB, 4.7 MS, 5.0 UK, 5.2 UK) earthquake occurred 299.8 miles away from the county center
Magnitude types: regional Lg-wave magnitude (LG), body-wave magnitude (MB), local magnitude (ML), surface-wave magnitude (MS), moment magnitude (MW)
Most recent natural disasters:
- North Carolina Covid-19 Pandemic, Incident Period: January 20, 2020, FEMA Id: 4487, Natural disaster type: Other
- North Carolina Tropical Storm Michael, Incident Period: October 10, 2018 - October 12, 2018, FEMA Id: 4412, Natural disaster type: Tropical Storm
- North Carolina Hurricane Florence, Incident Period: September 7, 2018 - September 29, 2018, FEMA Id: 4393, Natural disaster type: Hurricane
- North Carolina Hurricane Matthew, Incident Period: October 04, 2016 to October 24, 2016, Emergency Declared EM-3380: October 07, 2016, FEMA Id: 3380, Natural disaster type: Hurricane
- North Carolina Severe Winter Storm, Incident Period: March 06, 2014 to March 07, 2014, Major Disaster (Presidential) Declared DR-4167: March 31, 2014, FEMA Id: 4167, Natural disaster type: Winter Storm
- North Carolina Tropical Storm Hanna, Incident Period: September 04, 2008 to September 15, 2008, Major Disaster (Presidential) Declared DR-1801: October 08, 2008, FEMA Id: 1801, Natural disaster type: Tropical Storm
- North Carolina Hurricane Katrina Evacuation, Incident Period: August 29, 2005 to October 01, 2005, Emergency Declared EM-3222: September 05, 2005, FEMA Id: 3222, Natural disaster type: Hurricane
- North Carolina Hurricane Isabel, Incident Period: September 18, 2003 to September 26, 2003, Major Disaster (Presidential) Declared DR-1490: September 18, 2003, FEMA Id: 1490, Natural disaster type: Hurricane
- North Carolina Ice Storm, Incident Period: February 27, 2003 to February 28, 2003, Major Disaster (Presidential) Declared DR-1457: March 27, 2003, FEMA Id: 1457, Natural disaster type: Ice Storm
- North Carolina Severe Ice Storm, Incident Period: December 04, 2002 to December 06, 2002, Major Disaster (Presidential) Declared DR-1448: December 12, 2002, FEMA Id: 1448, Natural disaster type: Ice Storm
- 8 other natural disasters have been reported since 1953.
The number of natural disasters in Person County (18) is near the US average (15).
Major Disasters (Presidential) Declared: 9
Emergencies Declared: 6
Causes of natural disasters: Hurricanes: 7, Winter Storms: 3, Droughts: 2, Ice Storms: 2, Tropical Storms: 2, Blizzard: 1, Freeze: 1, Snowfall: 1, Other: 1 (Note: some incidents may be assigned to more than one category).
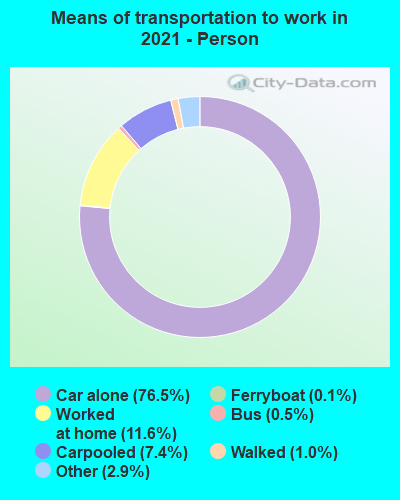
Means of transportation to work:
- Drove a car alone: 9,707 (71.0%)
- Carpooled: 903 (6.6%)
- Bus: 38 (0.3%)
- Ferryboat: 16 (0.1%)
- Taxicab, motorcycle, or other means: 493 (3.6%)
- Walked: 167 (1.2%)
- Worked at home: 2,384 (17.4%)

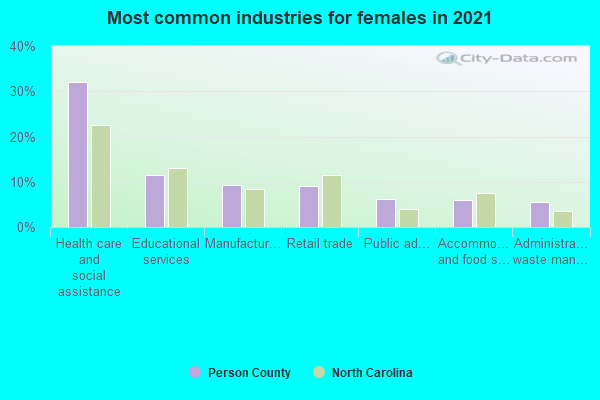
- Health care and social assistance (30%)
- Manufacturing (11%)
- Retail trade (11%)
- Educational services (9%)
- Administrative and support and waste management services (6%)
- Accommodation and food services (6%)
- Professional, scientific, and technical services (4%)
- Health care and social assistance (31%)
- Manufacturing (12%)
- Retail trade (11%)
- Educational services (9%)
- Administrative and support and waste management services (6%)
- Accommodation and food services (6%)
- Professional, scientific, and technical services (5%)
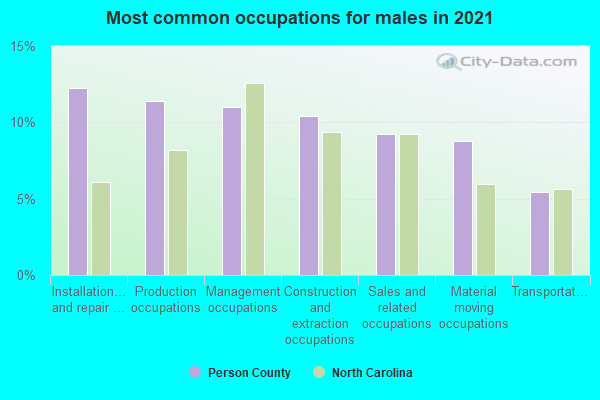
- Installation, maintenance, and repair occupations (11%)
- Construction and extraction occupations (11%)
- Production occupations (11%)
- Management occupations (11%)
- Sales and related occupations (9%)
- Material moving occupations (8%)
- Transportation occupations (6%)
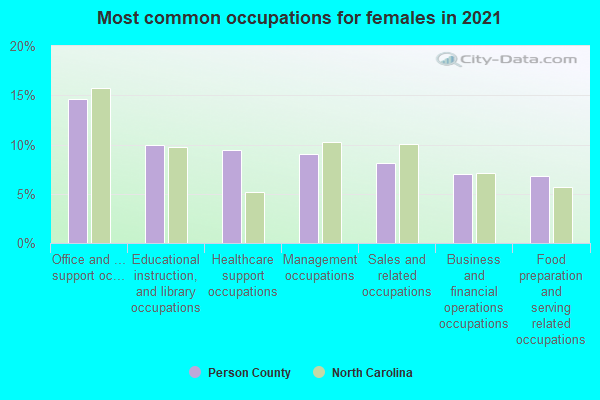
- Office and administrative support occupations (15%)
- Management occupations (10%)
- Sales and related occupations (10%)
- Healthcare support occupations (10%)
- Educational instruction, and library occupations (8%)
- Production occupations (8%)
- Business and financial operations occupations (7%)
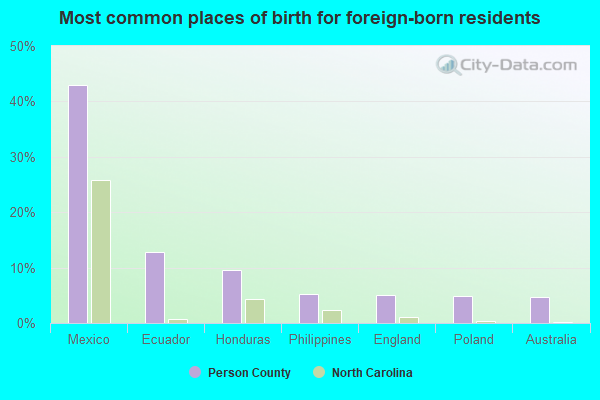
- Mexico (26%)
- Ecuador (8%)
- Honduras (8%)
- Colombia (7%)
- Philippines (5%)
- Brazil (5%)
- Laos (4%)
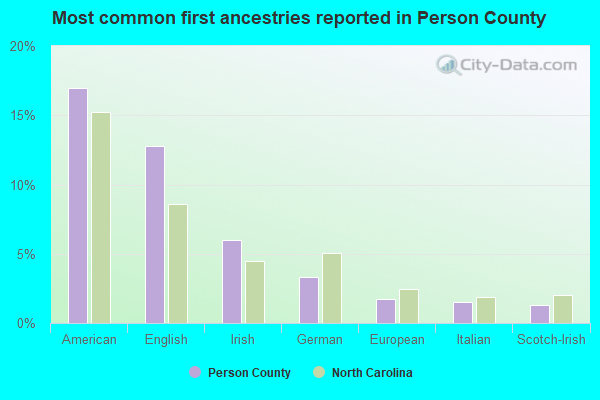
- American (17%)
- English (14%)
- Irish (5%)
- German (3%)
- European (2%)
- Scotch-Irish (1%)
- Italian (1%)
People in group quarters in Person County, North Carolina in 2010:
- 260 people in nursing facilities/skilled-nursing facilities
- 74 people in local jails and other municipal confinement facilities
- 64 people in group homes intended for adults
- 22 people in other noninstitutional facilities
- 19 people in workers' group living quarters and job corps centers
- 3 people in group homes for juveniles (non-correctional)
People in group quarters in Person County, North Carolina in 2000:
- 278 people in nursing homes
- 83 people in local jails and other confinement facilities (including police lockups)
- 20 people in other noninstitutional group quarters
- 6 people in homes for the mentally retarded
- 6 people in other group homes
5.88% of this county's 2021 resident taxpayers lived in other counties in 2020 ($55,041 average adjusted gross income)
| Here: | 5.88% |
| North Carolina average: | 8.85% |
10 or fewer of this county's residents moved from foreign countries.
4.30% relocated from other counties in North Carolina ($40,485 average AGI)
1.57% relocated from other states ($14,556 average AGI)
Person County: 1.57% North Carolina average: 4.18%
Top counties from which taxpayers relocated into this county between 2020 and 2021:
| from Durham County, NC | |
| from Wake County, NC | |
| from Orange County, NC | |
| from Alamance County, NC | |
| from Caswell County, NC | |
| from Granville County, NC | |
| from Halifax County, VA |
5.33% of this county's 2020 resident taxpayers moved to other counties in 2021 ($46,510 average adjusted gross income)
| Here: | 5.33% |
| North Carolina average: | 7.89% |
10 or fewer of this county's residents moved to foreign countries.
3.83% relocated to other counties in North Carolina ($30,855 average AGI)
1.50% relocated to other states ($15,654 average AGI)
Person County: 1.50% North Carolina average: 3.18%
Top counties to which taxpayers relocated from this county between 2020 and 2021:
| to Durham County, NC | |
| to Alamance County, NC | |
| to Wake County, NC | |
| to Orange County, NC | |
| to Granville County, NC | |
| to Caswell County, NC | |
| to Halifax County, VA |
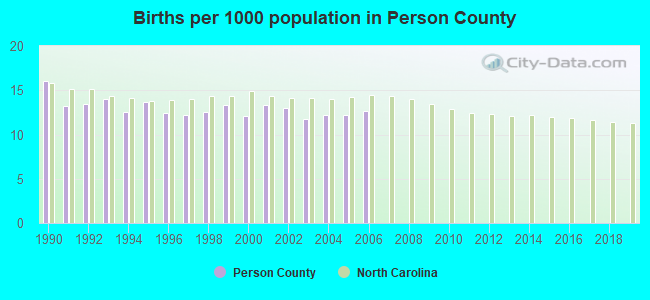
Births per 1000 population from 1990 to 1999: 13.3
Births per 1000 population from 2000 to 2006: 12.5
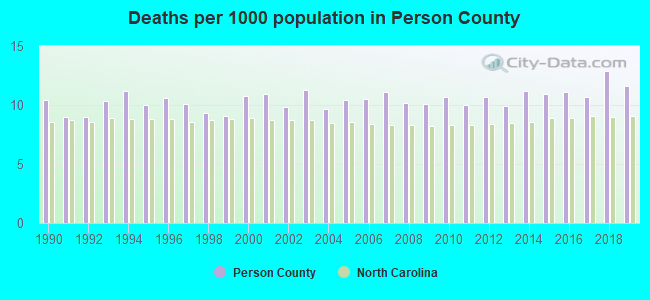
Deaths per 1000 population from 1990 to 1999: 9.9
Deaths per 1000 population from 2000 to 2009: 10.5
Deaths per 1000 population from 2010 to 2020: 11.2
Infant deaths per 1000 live births from 1990 to 1999: 10.3
Infant deaths per 1000 live births from 2000 to 2006: 11.4

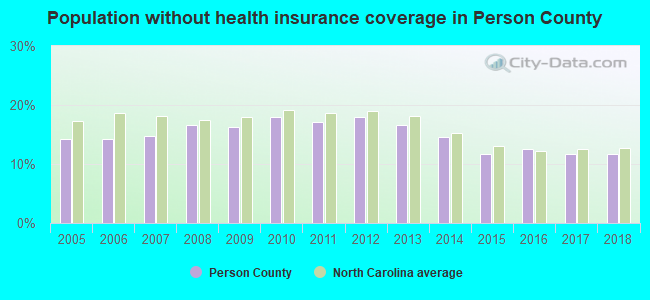
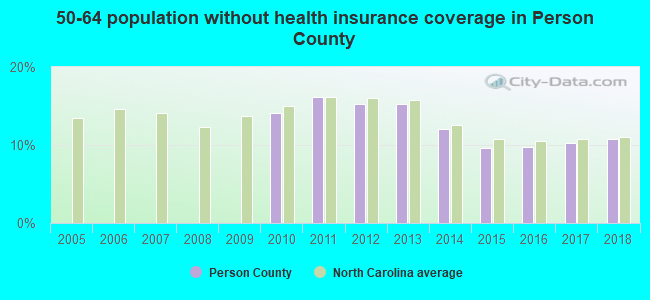
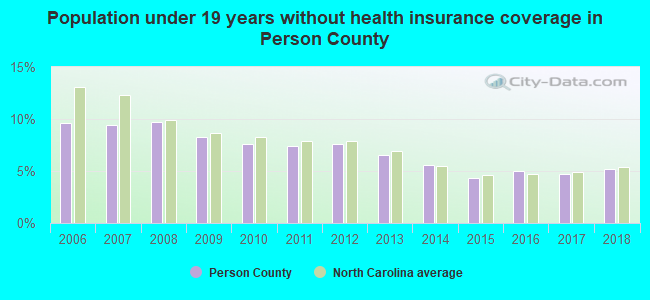
Persons under 19 years old without health insurance coverage in 2018: 5.2%
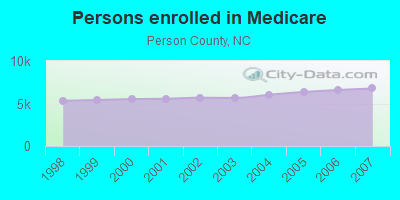
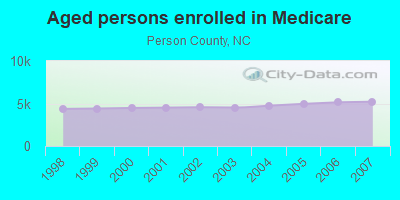
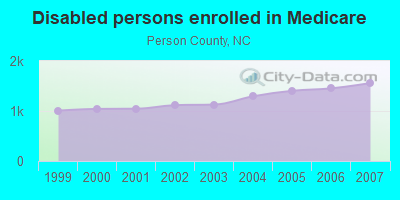
Persons enrolled in hospital insurance and/or supplemental medical insurance (Medicare) in July 1, 2007: 6,772 (5,214 aged, 1,558 disabled)
Children under 18 without health insurance coverage in 2007: 708 (8%)
Most common underlying causes of death in Person County, North Carolina in 1999 - 2019:
- Acute myocardial infarction, unspecified (634)
- Bronchus or lung, unspecified - Malignant neoplasms (568)
- Stroke, not specified as haemorrhage or infarction (413)
- Atherosclerotic heart disease (361)
- Chronic obstructive pulmonary disease, unspecified (361)
- Unspecified dementia (244)
- Alzheimer disease, unspecified (139)
- Pneumonia, unspecified (87)
- Septicaemia, unspecified (66)
- Congestive heart failure (59)
Population without health insurance coverage in 2000: 12%
Children under 18 without health insurance coverage in 2000: 9%
Short term general hospital admissions per 100,000 population in 2004: 7,322
Short term general hospital beds per 100,000 population in 2004: 298
Emergency room visits per 100,000 population in 2004: 44,687
General practice office based MDs per 100,000 population in 2005: 1,225
Medical specialist MDs per 100,000 population in 2005: 967
Dentists per 100,000 population in 1998: 8
Total births per 100,000 population, July 2005 - July 2006 : 18
Total deaths per 100,000 population, July 2005 - July 2006: 59
Limited-service eating places per 100,000 population in 2005 : 22
Beer, wine & liquor stores per 100,000 population in 2005: 1
Suicides per 1,000,000 population from 2000 to 2006: 172.5. This is more than state average.
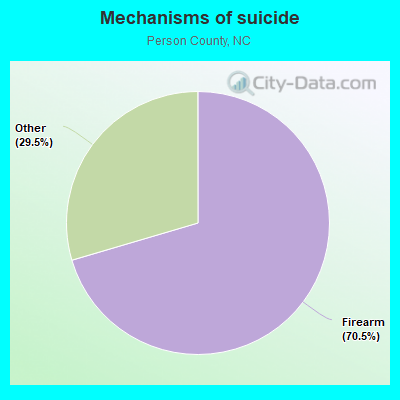
- Firearm - 121.5
- Other - 51.0
Household type by relationship:
Households: 39,985- Male householders: 7,561 (1,966 living alone), Female householders: 9,353 (2,749 living alone)
8,268 spouses (8,144 opposite-sex spouses), 1,031 unmarried partners, (982 opposite-sex unmarried partners), 10,213 children (9,687 natural, 133 adopted, 395 stepchildren), 1,534 grandchildren, 313 brothers or sisters, 243 parents, 48 foster children, 466 other relatives, 588 non-relatives
- In group quarters: 494
Size of family households: 5,532 2-persons, 3,220 3-persons, 1,563 4-persons, 752 5-persons, 212 6-persons, 47 7-or-more-persons.
Size of nonfamily households: 4,715 1-person, 818 2-persons, 48 3-persons, 6 4-persons.
4,233 married couples with children.
2,571 single-parent households (446 men, 2,125 women).
94.8% of residents of Person speak English at home.
3.7% of residents speak Spanish at home (62% speak English very well, 30% speak English well, 3% speak English not well, 5% don't speak English at all).
0.6% of residents speak other Indo-European language at home (75% speak English very well, 25% speak English well).
0.5% of residents speak Asian or Pacific Island language at home (35% speak English very well, 50% speak English well, 15% don't speak English at all).
0.3% of residents speak other language at home (100% speak English very well).
In fiscal year 2004:
Federal Government expenditure: $177,446,000 ($4,803 per capita)
Department of Defense expenditure: $5,760,000
Federal direct payments to individuals for retirement and disability: $74,663,000
Federal other direct payments to individuals: $38,560,000
Federal direct payments not to individuals: $2,741,000
Federal grants: $53,612,000
Federal procurement contracts: $3,885,000 ($3,057,000 Department of Defense)
Federal salaries and wages: $3,985,000 ($431,000 Department of Defense)
Federal Government direct loans: $1,176,000
Federal guaranteed/insured loans: $14,161,000
Federal Government insurance: $15,163,000
Population change from April 1, 2000 to July 1, 2005:
Births: 2,439| Here: | 66 per 1000 residents |
| State: | 72 per 1000 residents |
Deaths: 2,056
| Here: | 55 per 1000 residents |
| State: | 44 per 1000 residents |
Net international migration: +109
| Here: | +3 per 1000 residents |
| State: | +18 per 1000 residents |
Net internal migration: +1,162
| Here: | +31 per 1000 residents |
| State: | +27 per 1000 residents |
Total withdrawal of fresh water for public supply: 3.64 millions of gallons per day (1% from ground, 99% from surface)
| Here: | 6.2 |
| State: | 6.4 |
| Here: | 4.9 |
| State: | 4.4 |
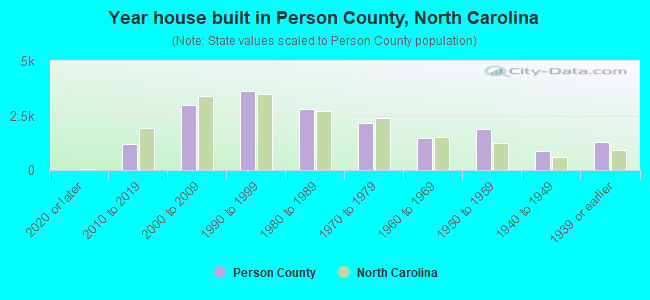
- Year house built in Person County, North Carolina
- 1152020 or later
- 1,2032010 to 2019
- 2,8992000 to 2009
- 3,4121990 to 1999
- 2,5861980 to 1989
- 2,2441970 to 1979
- 1,4981960 to 1969
- 1,8691950 to 1959
- 8971940 to 1949
- 1,3401939 or earlier
- Rooms in owner-occupied houses in Person County, North Carolina
- 941 room
- 02 rooms
- 1983 rooms
- 1,0614 rooms
- 2,7765 rooms
- 3,6836 rooms
- 2,3717 rooms
- 1,7158 rooms
- 1,2859+ rooms
- Rooms in renter-occupied apartments in Person County, North Carolina
- 951 room
- 172 rooms
- 3693 rooms
- 9624 rooms
- 9125 rooms
- 6516 rooms
- 3217 rooms
- 2688 rooms
- 1319+ rooms
- Bedrooms in owner-occupied houses in Person County, North Carolina
- 96no bedroom
- 981 bedroom
- 1,7812 bedrooms
- 8,7553 bedrooms
- 2,2844 bedrooms
- 1005+ bedrooms
- Bedrooms in renter-occupied apartments in Person County, North Carolina
- 96no bedroom
- 3271 bedroom
- 1,4962 bedrooms
- 1,4373 bedrooms
- 2164 bedrooms
- 1365+ bedrooms
- Cars and other vehicles available in Person County in owner-occupied houses/condos
- 358no vehicle
- 2,6251 vehicle
- 4,4992 vehicles
- 3,5203 vehicles
- 1,4484 vehicles
- 7545+ vehicles
- Cars and other vehicles available in Person County in renter-occupied apartments
- 466no vehicle
- 1,4961 vehicle
- 1,2992 vehicles
- 1933 vehicles
- 1414 vehicles
- 1365+ vehicles
92.5% of Person County residents lived in the same house 1 years ago.
Out of people who lived in different houses, 33% lived in this county.
Out of people who lived in different counties, 71% lived in North Carolina.
| Person County: | 92.5% |
| State average: | 87.3% |
Place of birth for U.S.-born residents:
- This state: 28,138
- Other state: 10,166
- Northeast: 2,633
- Midwest: 1,519
- South: 5,167
- West: 839
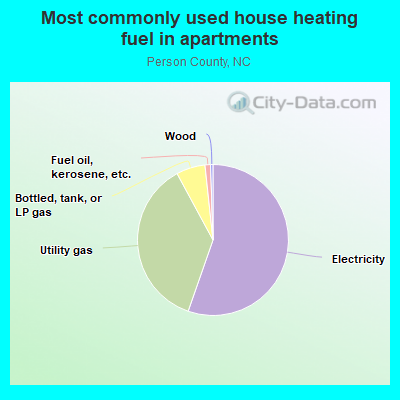
- 61.8%Electricity
- 18.6%Bottled, tank, or LP gas
- 15.4%Utility gas
- 2.4%Wood
- 1.6%Fuel oil, kerosene, etc.
- 0.1%No fuel used
- 55.0%Electricity
- 37.1%Utility gas
- 5.0%Bottled, tank, or LP gas
- 1.4%No fuel used
- 0.8%Wood
- 0.6%Fuel oil, kerosene, etc.
Private vs. public school enrollment:
| Here: | 13.7% |
| North Carolina: | 13.8% |
| Here: | 3.9% |
| North Carolina: | 11.9% |
| Here: | 13.9% |
| North Carolina: | 19.3% |
Person County government finances - Expenditure in 2017:
- Assistance and Subsidies - Public Welfare, Cash Assistance Programs - Other: $3,314,000
- Charges - Miscellaneous Commercial Activities: $2,222,000
Other: $1,443,000
Higher Education - Other: $1,114,000
Hospital Public: $1,108,000
Higher Education - Other: $993,000
Parks and Recreation: $888,000
Elementary and Secondary Education School Lunch: $579,000
Solid Waste Management: $536,000
Elementary and Secondary Education School Tuition and Transportation: $510,000
Elementary and Secondary Education School Lunch: $450,000
Elementary and Secondary Education School Tuition and Transportation: $402,000
Parks and Recreation: $361,000
Higher Education Auxiliary Enterprises: $277,000
Sewerage: $268,000
Natural Resources - Other: $169,000
Higher Education Auxiliary Enterprises: $122,000
Elementary and Secondary Education - Other: $33,000
Elementary and Secondary Education - Other: $14,000
- Construction - Public Welfare - Other: $2,166,000
Elementary and Secondary Education: $993,000
Elementary and Secondary Education: $642,000
Police Protection: $583,000
General Public Buildings: $333,000
Air Transportation: $224,000
Parks and Recreation: $15,000
- Current Operations - Elementary and Secondary Education: $46,629,000
Elementary and Secondary Education: $45,011,000
Other Higher Education: $15,029,000
Other Higher Education: $14,574,000
Health - Other: $9,616,000
Public Welfare - Other: $6,486,000
Police Protection: $5,871,000
General - Other: $3,423,000
Liquor Stores: $2,957,000
Correctional Institutions: $2,695,000
Liquor Stores: $2,121,000
Housing and Community Development: $1,401,000
Financial Administration: $1,299,000
Parks and Recreation: $1,167,000
Central Staff Services: $1,031,000
Local Fire Protection: $1,030,000
Natural Resources - Other: $1,020,000
Higher Education Auxiliary Enterprises: $887,000
Transit Utilities: $800,000
Parks and Recreation: $701,000
Libraries: $529,000
Judicial and Legal Services: $446,000
Higher Education Auxiliary Enterprises: $369,000
Sewerage: $183,000
Air Transportation: $38,000
Police Protection: $35,000
Health - Other: $28,000
- Federal Intergovernmental - Education: $2,589,000
Education: $1,407,000
General Local Government Support: $108,000
Other: $19,000
- General - Interest on Debt: $627,000
Interest on Debt: $143,000
- Intergovernmental to Local - Other - Elementary and Secondary Education: $376,000
Other - Elementary and Secondary Education: $216,000
Other - Health - Other: $105,000
Other - Central Staff Services: $70,000
Other - Health - Other: $14,000
- Intergovernmental to State - Natural Resources - Other: $71,000
- Local Intergovernmental - Education: $2,188,000
Education: $1,810,000
Other: $551,000
General Local Government Support: $215,000
Housing and Community Development: $8,000
- Long Term Debt - Outstanding Nonguaranteed - Industrial Revenue: $182,740,000
Beginning Outstanding - Public Debt for Private Purpose: $182,740,000
Beginning Outstanding - Public Debt for Private Purpose: $127,100,000
Retired Nonguaranteed - Public Debt for Private Purpose: $100,000,000
Outstanding Nonguaranteed - Industrial Revenue: $27,100,000
Beginning Outstanding - Unspecified Public Purpose: $12,009,000
Outstanding Unspecified Public Purpose: $10,637,000
Outstanding Unspecified Public Purpose: $10,548,000
Beginning Outstanding - Unspecified Public Purpose: $9,871,000
Issue, Unspecified Public Purpose: $2,285,000
Retired Unspecified Public Purpose: $1,519,000
Retired Unspecified Public Purpose: $1,461,000
- Miscellaneous - General Revenue - Other: $1,714,000
General Revenue - Other: $1,009,000
Donations From Private Sources: $296,000
Fines and Forfeits: $234,000
Interest Earnings: $183,000
Fines and Forfeits: $117,000
Rents: $108,000
Sale of Property: $67,000
Interest Earnings: $51,000
Donations From Private Sources: $19,000
Sale of Property: $9,000
- Other Capital Outlay - Elementary and Secondary Education: $1,375,000
Police Protection: $533,000
Other Higher Education: $419,000
Elementary and Secondary Education: $354,000
Health - Other: $264,000
Transit Utilities: $179,000
Other Higher Education: $172,000
General - Other: $103,000
Public Welfare - Other: $53,000
Financial Administration: $26,000
Parks and Recreation: $11,000
Natural Resources - Other: $3,000
Housing and Community Development: $1,000
Parks and Recreation: $1,000
- Other Funds - Cash and Securities: $5,203,000
Cash and Securities: $4,738,000
- Revenue - Liquor Stores: $3,498,000
Liquor Stores: $2,477,000
Transit Utilities: $313,000
- Sinking Funds - Cash and Securities: $182,740,000
Cash and Securities: $27,100,000
- State Intergovernmental - Education: $46,272,000
Education: $45,081,000
Public Welfare: $6,921,000
Health and Hospitals: $1,875,000
Other: $1,338,000
General Local Government Support: $545,000
Transit Utilities: $499,000
Housing and Community Development: $205,000
Water Utilities: $48,000
Other: $3,000
- Tax - Property: $32,079,000
Property: $11,587,000
General Sales and Gross Receipts: $7,571,000
Alcoholic Beverage Sales: $245,000
Alcoholic Beverage Sales: $234,000
Other Selective Sales: $197,000
Documentary and Stock Transfer: $128,000
Other License: $116,000
Motor Vehicle License: $14,000
- Total Salaries and Wages: $29,312,000
: $27,956,000
Person County government finances - Revenue in 2017:
- Assistance and Subsidies - Public Welfare, Cash Assistance Programs - Other: $3,314,000
- Charges - Miscellaneous Commercial Activities: $2,222,000
Other: $1,443,000
Higher Education - Other: $1,114,000
Hospital Public: $1,108,000
Higher Education - Other: $993,000
Parks and Recreation: $888,000
Elementary and Secondary Education School Lunch: $579,000
Solid Waste Management: $536,000
Elementary and Secondary Education School Tuition and Transportation: $510,000
Elementary and Secondary Education School Lunch: $450,000
Elementary and Secondary Education School Tuition and Transportation: $402,000
Parks and Recreation: $361,000
Higher Education Auxiliary Enterprises: $277,000
Sewerage: $268,000
Natural Resources - Other: $169,000
Higher Education Auxiliary Enterprises: $122,000
Elementary and Secondary Education - Other: $33,000
Elementary and Secondary Education - Other: $14,000
- Construction - Public Welfare - Other: $2,166,000
Elementary and Secondary Education: $993,000
Elementary and Secondary Education: $642,000
Police Protection: $583,000
General Public Buildings: $333,000
Air Transportation: $224,000
Parks and Recreation: $15,000
- Current Operations - Elementary and Secondary Education: $46,629,000
Elementary and Secondary Education: $45,011,000
Other Higher Education: $15,029,000
Other Higher Education: $14,574,000
Health - Other: $9,616,000
Public Welfare - Other: $6,486,000
Police Protection: $5,871,000
General - Other: $3,423,000
Liquor Stores: $2,957,000
Correctional Institutions: $2,695,000
Liquor Stores: $2,121,000
Housing and Community Development: $1,401,000
Financial Administration: $1,299,000
Parks and Recreation: $1,167,000
Central Staff Services: $1,031,000
Local Fire Protection: $1,030,000
Natural Resources - Other: $1,020,000
Higher Education Auxiliary Enterprises: $887,000
Transit Utilities: $800,000
Parks and Recreation: $701,000
Libraries: $529,000
Judicial and Legal Services: $446,000
Higher Education Auxiliary Enterprises: $369,000
Sewerage: $183,000
Air Transportation: $38,000
Police Protection: $35,000
Health - Other: $28,000
- Federal Intergovernmental - Education: $2,589,000
Education: $1,407,000
General Local Government Support: $108,000
Other: $19,000
- General - Interest on Debt: $627,000
Interest on Debt: $143,000
- Intergovernmental to Local - Other - Elementary and Secondary Education: $376,000
Other - Elementary and Secondary Education: $216,000
Other - Health - Other: $105,000
Other - Central Staff Services: $70,000
Other - Health - Other: $14,000
- Intergovernmental to State - Natural Resources - Other: $71,000
- Local Intergovernmental - Education: $2,188,000
Education: $1,810,000
Other: $551,000
General Local Government Support: $215,000
Housing and Community Development: $8,000
- Long Term Debt - Outstanding Nonguaranteed - Industrial Revenue: $182,740,000
Beginning Outstanding - Public Debt for Private Purpose: $182,740,000
Beginning Outstanding - Public Debt for Private Purpose: $127,100,000
Retired Nonguaranteed - Public Debt for Private Purpose: $100,000,000
Outstanding Nonguaranteed - Industrial Revenue: $27,100,000
Beginning Outstanding - Unspecified Public Purpose: $12,009,000
Outstanding Unspecified Public Purpose: $10,637,000
Outstanding Unspecified Public Purpose: $10,548,000
Beginning Outstanding - Unspecified Public Purpose: $9,871,000
Issue, Unspecified Public Purpose: $2,285,000
Retired Unspecified Public Purpose: $1,519,000
Retired Unspecified Public Purpose: $1,461,000
- Miscellaneous - General Revenue - Other: $1,714,000
General Revenue - Other: $1,009,000
Donations From Private Sources: $296,000
Fines and Forfeits: $234,000
Interest Earnings: $183,000
Fines and Forfeits: $117,000
Rents: $108,000
Sale of Property: $67,000
Interest Earnings: $51,000
Donations From Private Sources: $19,000
Sale of Property: $9,000
- Other Capital Outlay - Elementary and Secondary Education: $1,375,000
Police Protection: $533,000
Other Higher Education: $419,000
Elementary and Secondary Education: $354,000
Health - Other: $264,000
Transit Utilities: $179,000
Other Higher Education: $172,000
General - Other: $103,000
Public Welfare - Other: $53,000
Financial Administration: $26,000
Parks and Recreation: $11,000
Natural Resources - Other: $3,000
Housing and Community Development: $1,000
Parks and Recreation: $1,000
- Other Funds - Cash and Securities: $5,203,000
Cash and Securities: $4,738,000
- Revenue - Liquor Stores: $3,498,000
Liquor Stores: $2,477,000
Transit Utilities: $313,000
- Sinking Funds - Cash and Securities: $182,740,000
Cash and Securities: $27,100,000
- State Intergovernmental - Education: $46,272,000
Education: $45,081,000
Public Welfare: $6,921,000
Health and Hospitals: $1,875,000
Other: $1,338,000
General Local Government Support: $545,000
Transit Utilities: $499,000
Housing and Community Development: $205,000
Water Utilities: $48,000
Other: $3,000
- Tax - Property: $32,079,000
Property: $11,587,000
General Sales and Gross Receipts: $7,571,000
Alcoholic Beverage Sales: $245,000
Alcoholic Beverage Sales: $234,000
Other Selective Sales: $197,000
Documentary and Stock Transfer: $128,000
Other License: $116,000
Motor Vehicle License: $14,000
- Total Salaries and Wages: $29,312,000
: $27,956,000
Person County government finances - Debt in 2017:
- Assistance and Subsidies - Public Welfare, Cash Assistance Programs - Other: $3,314,000
- Charges - Miscellaneous Commercial Activities: $2,222,000
Other: $1,443,000
Higher Education - Other: $1,114,000
Hospital Public: $1,108,000
Higher Education - Other: $993,000
Parks and Recreation: $888,000
Elementary and Secondary Education School Lunch: $579,000
Solid Waste Management: $536,000
Elementary and Secondary Education School Tuition and Transportation: $510,000
Elementary and Secondary Education School Lunch: $450,000
Elementary and Secondary Education School Tuition and Transportation: $402,000
Parks and Recreation: $361,000
Higher Education Auxiliary Enterprises: $277,000
Sewerage: $268,000
Natural Resources - Other: $169,000
Higher Education Auxiliary Enterprises: $122,000
Elementary and Secondary Education - Other: $33,000
Elementary and Secondary Education - Other: $14,000
- Construction - Public Welfare - Other: $2,166,000
Elementary and Secondary Education: $993,000
Elementary and Secondary Education: $642,000
Police Protection: $583,000
General Public Buildings: $333,000
Air Transportation: $224,000
Parks and Recreation: $15,000
- Current Operations - Elementary and Secondary Education: $46,629,000
Elementary and Secondary Education: $45,011,000
Other Higher Education: $15,029,000
Other Higher Education: $14,574,000
Health - Other: $9,616,000
Public Welfare - Other: $6,486,000
Police Protection: $5,871,000
General - Other: $3,423,000
Liquor Stores: $2,957,000
Correctional Institutions: $2,695,000
Liquor Stores: $2,121,000
Housing and Community Development: $1,401,000
Financial Administration: $1,299,000
Parks and Recreation: $1,167,000
Central Staff Services: $1,031,000
Local Fire Protection: $1,030,000
Natural Resources - Other: $1,020,000
Higher Education Auxiliary Enterprises: $887,000
Transit Utilities: $800,000
Parks and Recreation: $701,000
Libraries: $529,000
Judicial and Legal Services: $446,000
Higher Education Auxiliary Enterprises: $369,000
Sewerage: $183,000
Air Transportation: $38,000
Police Protection: $35,000
Health - Other: $28,000
- Federal Intergovernmental - Education: $2,589,000
Education: $1,407,000
General Local Government Support: $108,000
Other: $19,000
- General - Interest on Debt: $627,000
Interest on Debt: $143,000
- Intergovernmental to Local - Other - Elementary and Secondary Education: $376,000
Other - Elementary and Secondary Education: $216,000
Other - Health - Other: $105,000
Other - Central Staff Services: $70,000
Other - Health - Other: $14,000
- Intergovernmental to State - Natural Resources - Other: $71,000
- Local Intergovernmental - Education: $2,188,000
Education: $1,810,000
Other: $551,000
General Local Government Support: $215,000
Housing and Community Development: $8,000
- Long Term Debt - Outstanding Nonguaranteed - Industrial Revenue: $182,740,000
Beginning Outstanding - Public Debt for Private Purpose: $182,740,000
Beginning Outstanding - Public Debt for Private Purpose: $127,100,000
Retired Nonguaranteed - Public Debt for Private Purpose: $100,000,000
Outstanding Nonguaranteed - Industrial Revenue: $27,100,000
Beginning Outstanding - Unspecified Public Purpose: $12,009,000
Outstanding Unspecified Public Purpose: $10,637,000
Outstanding Unspecified Public Purpose: $10,548,000
Beginning Outstanding - Unspecified Public Purpose: $9,871,000
Issue, Unspecified Public Purpose: $2,285,000
Retired Unspecified Public Purpose: $1,519,000
Retired Unspecified Public Purpose: $1,461,000
- Miscellaneous - General Revenue - Other: $1,714,000
General Revenue - Other: $1,009,000
Donations From Private Sources: $296,000
Fines and Forfeits: $234,000
Interest Earnings: $183,000
Fines and Forfeits: $117,000
Rents: $108,000
Sale of Property: $67,000
Interest Earnings: $51,000
Donations From Private Sources: $19,000
Sale of Property: $9,000
- Other Capital Outlay - Elementary and Secondary Education: $1,375,000
Police Protection: $533,000
Other Higher Education: $419,000
Elementary and Secondary Education: $354,000
Health - Other: $264,000
Transit Utilities: $179,000
Other Higher Education: $172,000
General - Other: $103,000
Public Welfare - Other: $53,000
Financial Administration: $26,000
Parks and Recreation: $11,000
Natural Resources - Other: $3,000
Housing and Community Development: $1,000
Parks and Recreation: $1,000
- Other Funds - Cash and Securities: $5,203,000
Cash and Securities: $4,738,000
- Revenue - Liquor Stores: $3,498,000
Liquor Stores: $2,477,000
Transit Utilities: $313,000
- Sinking Funds - Cash and Securities: $182,740,000
Cash and Securities: $27,100,000
- State Intergovernmental - Education: $46,272,000
Education: $45,081,000
Public Welfare: $6,921,000
Health and Hospitals: $1,875,000
Other: $1,338,000
General Local Government Support: $545,000
Transit Utilities: $499,000
Housing and Community Development: $205,000
Water Utilities: $48,000
Other: $3,000
- Tax - Property: $32,079,000
Property: $11,587,000
General Sales and Gross Receipts: $7,571,000
Alcoholic Beverage Sales: $245,000
Alcoholic Beverage Sales: $234,000
Other Selective Sales: $197,000
Documentary and Stock Transfer: $128,000
Other License: $116,000
Motor Vehicle License: $14,000
- Total Salaries and Wages: $29,312,000
: $27,956,000
Person County government finances - Cash and Securities in 2017:
- Assistance and Subsidies - Public Welfare, Cash Assistance Programs - Other: $3,314,000
- Charges - Miscellaneous Commercial Activities: $2,222,000
Other: $1,443,000
Higher Education - Other: $1,114,000
Hospital Public: $1,108,000
Higher Education - Other: $993,000
Parks and Recreation: $888,000
Elementary and Secondary Education School Lunch: $579,000
Solid Waste Management: $536,000
Elementary and Secondary Education School Tuition and Transportation: $510,000
Elementary and Secondary Education School Lunch: $450,000
Elementary and Secondary Education School Tuition and Transportation: $402,000
Parks and Recreation: $361,000
Higher Education Auxiliary Enterprises: $277,000
Sewerage: $268,000
Natural Resources - Other: $169,000
Higher Education Auxiliary Enterprises: $122,000
Elementary and Secondary Education - Other: $33,000
Elementary and Secondary Education - Other: $14,000
- Construction - Public Welfare - Other: $2,166,000
Elementary and Secondary Education: $993,000
Elementary and Secondary Education: $642,000
Police Protection: $583,000
General Public Buildings: $333,000
Air Transportation: $224,000
Parks and Recreation: $15,000
- Current Operations - Elementary and Secondary Education: $46,629,000
Elementary and Secondary Education: $45,011,000
Other Higher Education: $15,029,000
Other Higher Education: $14,574,000
Health - Other: $9,616,000
Public Welfare - Other: $6,486,000
Police Protection: $5,871,000
General - Other: $3,423,000
Liquor Stores: $2,957,000
Correctional Institutions: $2,695,000
Liquor Stores: $2,121,000
Housing and Community Development: $1,401,000
Financial Administration: $1,299,000
Parks and Recreation: $1,167,000
Central Staff Services: $1,031,000
Local Fire Protection: $1,030,000
Natural Resources - Other: $1,020,000
Higher Education Auxiliary Enterprises: $887,000
Transit Utilities: $800,000
Parks and Recreation: $701,000
Libraries: $529,000
Judicial and Legal Services: $446,000
Higher Education Auxiliary Enterprises: $369,000
Sewerage: $183,000
Air Transportation: $38,000
Police Protection: $35,000
Health - Other: $28,000
- Federal Intergovernmental - Education: $2,589,000
Education: $1,407,000
General Local Government Support: $108,000
Other: $19,000
- General - Interest on Debt: $627,000
Interest on Debt: $143,000
- Intergovernmental to Local - Other - Elementary and Secondary Education: $376,000
Other - Elementary and Secondary Education: $216,000
Other - Health - Other: $105,000
Other - Central Staff Services: $70,000
Other - Health - Other: $14,000
- Intergovernmental to State - Natural Resources - Other: $71,000
- Local Intergovernmental - Education: $2,188,000
Education: $1,810,000
Other: $551,000
General Local Government Support: $215,000
Housing and Community Development: $8,000
- Long Term Debt - Outstanding Nonguaranteed - Industrial Revenue: $182,740,000
Beginning Outstanding - Public Debt for Private Purpose: $182,740,000
Beginning Outstanding - Public Debt for Private Purpose: $127,100,000
Retired Nonguaranteed - Public Debt for Private Purpose: $100,000,000
Outstanding Nonguaranteed - Industrial Revenue: $27,100,000
Beginning Outstanding - Unspecified Public Purpose: $12,009,000
Outstanding Unspecified Public Purpose: $10,637,000
Outstanding Unspecified Public Purpose: $10,548,000
Beginning Outstanding - Unspecified Public Purpose: $9,871,000
Issue, Unspecified Public Purpose: $2,285,000
Retired Unspecified Public Purpose: $1,519,000
Retired Unspecified Public Purpose: $1,461,000
- Miscellaneous - General Revenue - Other: $1,714,000
General Revenue - Other: $1,009,000
Donations From Private Sources: $296,000
Fines and Forfeits: $234,000
Interest Earnings: $183,000
Fines and Forfeits: $117,000
Rents: $108,000
Sale of Property: $67,000
Interest Earnings: $51,000
Donations From Private Sources: $19,000
Sale of Property: $9,000
- Other Capital Outlay - Elementary and Secondary Education: $1,375,000
Police Protection: $533,000
Other Higher Education: $419,000
Elementary and Secondary Education: $354,000
Health - Other: $264,000
Transit Utilities: $179,000
Other Higher Education: $172,000
General - Other: $103,000
Public Welfare - Other: $53,000
Financial Administration: $26,000
Parks and Recreation: $11,000
Natural Resources - Other: $3,000
Housing and Community Development: $1,000
Parks and Recreation: $1,000
- Other Funds - Cash and Securities: $5,203,000
Cash and Securities: $4,738,000
- Revenue - Liquor Stores: $3,498,000
Liquor Stores: $2,477,000
Transit Utilities: $313,000
- Sinking Funds - Cash and Securities: $182,740,000
Cash and Securities: $27,100,000
- State Intergovernmental - Education: $46,272,000
Education: $45,081,000
Public Welfare: $6,921,000
Health and Hospitals: $1,875,000
Other: $1,338,000
General Local Government Support: $545,000
Transit Utilities: $499,000
Housing and Community Development: $205,000
Water Utilities: $48,000
Other: $3,000
- Tax - Property: $32,079,000
Property: $11,587,000
General Sales and Gross Receipts: $7,571,000
Alcoholic Beverage Sales: $245,000
Alcoholic Beverage Sales: $234,000
Other Selective Sales: $197,000
Documentary and Stock Transfer: $128,000
Other License: $116,000
Motor Vehicle License: $14,000
- Total Salaries and Wages: $29,312,000
: $27,956,000
Supplemental Security Income (SSI) in 2006:
- Total number of recipients: 1,009
- Number of aged recipients: 158
- Number of blind and disabled recipients: 851
- Number of recipients under 18: 141
- Number of recipients between 18 and 64: 543
- Number of recipients older than 64: 325
- Number of recipients also receiving OASDI: 493
- Amount of payments (thousands of dollars): 406
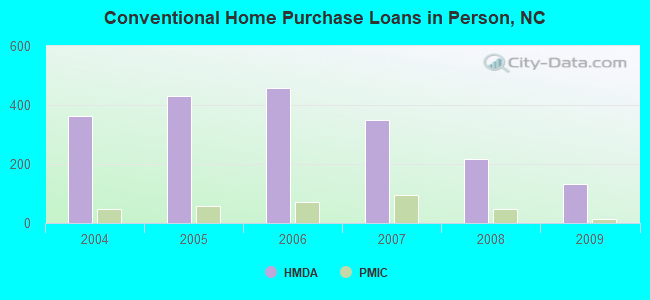
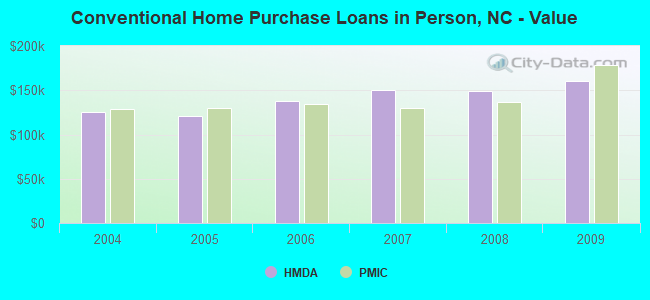
| Home Mortgage Disclosure Act Aggregated Statistics For Year 2009 (Based on 6 full tracts) | ||||||||||||||
| A) FHA, FSA/RHS & VA Home Purchase Loans | B) Conventional Home Purchase Loans | C) Refinancings | D) Home Improvement Loans | E) Loans on Dwellings For 5+ Families | F) Non-occupant Loans on < 5 Family Dwellings (A B C & D) | G) Loans On Manufactured Home Dwelling (A B C & D) | ||||||||
|---|---|---|---|---|---|---|---|---|---|---|---|---|---|---|
| Number | Average Value | Number | Average Value | Number | Average Value | Number | Average Value | Number | Average Value | Number | Average Value | Number | Average Value | |
| LOANS ORIGINATED | 94 | $127,330 | 133 | $159,940 | 693 | $160,346 | 24 | $80,917 | 0 | $0 | 114 | $198,518 | 113 | $78,522 |
| APPLICATIONS APPROVED, NOT ACCEPTED | 4 | $124,250 | 15 | $98,800 | 41 | $141,732 | 4 | $11,500 | 0 | $0 | 5 | $76,200 | 20 | $70,750 |
| APPLICATIONS DENIED | 26 | $125,846 | 34 | $128,118 | 256 | $151,277 | 41 | $25,366 | 1 | $208,000 | 30 | $195,533 | 52 | $82,308 |
| APPLICATIONS WITHDRAWN | 13 | $108,846 | 14 | $198,714 | 146 | $147,226 | 4 | $91,500 | 0 | $0 | 16 | $161,688 | 14 | $109,143 |
| FILES CLOSED FOR INCOMPLETENESS | 8 | $102,500 | 4 | $168,250 | 38 | $124,053 | 2 | $13,500 | 0 | $0 | 6 | $164,333 | 14 | $92,071 |
| Private Mortgage Insurance Companies Aggregated Statistics For Year 2009 (Based on 5 full tracts) | ||||||||
| A) Conventional Home Purchase Loans | B) Refinancings | C) Non-occupant Loans on < 5 Family Dwellings (A & B) | D) Loans On Manufactured Home Dwelling (A & B) | |||||
|---|---|---|---|---|---|---|---|---|
| Number | Average Value | Number | Average Value | Number | Average Value | Number | Average Value | |
| LOANS ORIGINATED | 13 | $178,462 | 16 | $171,625 | 2 | $186,500 | 1 | $50,000 |
| APPLICATIONS APPROVED, NOT ACCEPTED | 4 | $226,000 | 6 | $221,500 | 0 | $0 | 0 | $0 |
| APPLICATIONS DENIED | 2 | $177,500 | 3 | $226,333 | 0 | $0 | 0 | $0 |
| APPLICATIONS WITHDRAWN | 2 | $221,000 | 0 | $0 | 0 | $0 | 0 | $0 |
| FILES CLOSED FOR INCOMPLETENESS | 0 | $0 | 1 | $148,000 | 0 | $0 | 0 | $0 |
| Most common first names in Person County, NC among deceased individuals | ||
| Name | Count | Lived (average) |
|---|---|---|
| James | 213 | 72.3 years |
| Mary | 210 | 78.5 years |
| William | 200 | 72.7 years |
| John | 174 | 72.6 years |
| Robert | 102 | 72.3 years |
| Willie | 89 | 73.6 years |
| George | 86 | 75.7 years |
| Annie | 79 | 79.7 years |
| Thomas | 62 | 70.7 years |
| Charlie | 60 | 75.4 years |
| Most common last names in Person County, NC among deceased individuals | ||
| Last name | Count | Lived (average) |
|---|---|---|
| Clayton | 213 | 76.3 years |
| Long | 124 | 75.6 years |
| Harris | 112 | 74.2 years |
| Carver | 97 | 75.7 years |
| Oakley | 87 | 76.8 years |
| Walker | 84 | 77.6 years |
| Gentry | 84 | 77.9 years |
| Jones | 76 | 76.5 years |
| Davis | 75 | 73.7 years |
| Winstead | 75 | 73.8 years |
| Businesses in Person County, NC | ||||
| Name | Count | Name | Count | |
|---|---|---|---|---|
| Advance Auto Parts | 1 | Lane Furniture | 2 | |
| Arby's | 1 | Lowe's | 1 | |
| AutoZone | 1 | McDonald's | 2 | |
| Blockbuster | 1 | Nike | 1 | |
| Burger King | 1 | Papa John's Pizza | 1 | |
| CVS | 1 | Pizza Hut | 1 | |
| Chevrolet | 1 | RadioShack | 1 | |
| Curves | 1 | Rite Aid | 1 | |
| Domino's Pizza | 1 | Subway | 2 | |
| FedEx | 4 | Taco Bell | 1 | |
| GNC | 1 | U-Haul | 2 | |
| H&R Block | 1 | U.S. Cellular | 1 | |
| Hardee's | 1 | UPS | 3 | |
| Hilton | 1 | Walmart | 1 | |
| KFC | 1 | Wendy's | 1 | |
| La-Z-Boy | 2 | |||
Person County on our top lists:
- #68 on the list of "Top 101 counties with the lowest ground withdrawal of fresh water for public supply"