Crime rate in Centre Island, New York (NY): murders, rapes, robberies, assaults, burglaries, thefts, auto thefts, arson, law enforcement employees, police officers, crime map
Type |
2009 |
2010 |
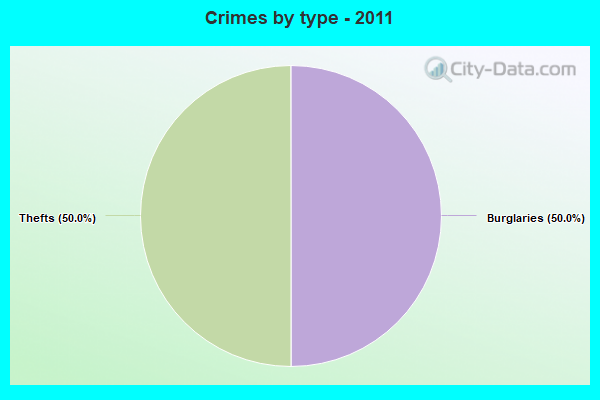
2011 |
2012 |
2013 |
2014 |
2015 |
2016 |
2017 |
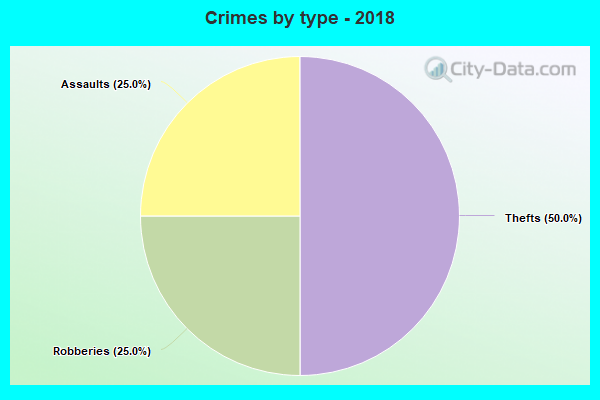
2018 |
2019 |
2020 |
2022 |
|---|---|---|---|---|---|---|---|---|---|---|---|---|---|
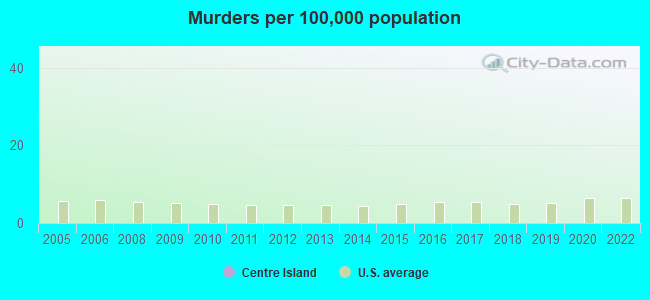
| Murders (per 100,000) | 0 (0.0) | 0 (0.0) | 0 (0.0) | 0 (0.0) | 0 (0.0) | 0 (0.0) | 0 (0.0) | 0 (0.0) | 0 (0.0) | 0 (0.0) | 0 (0.0) | 0 (0.0) | 0 (0.0) |
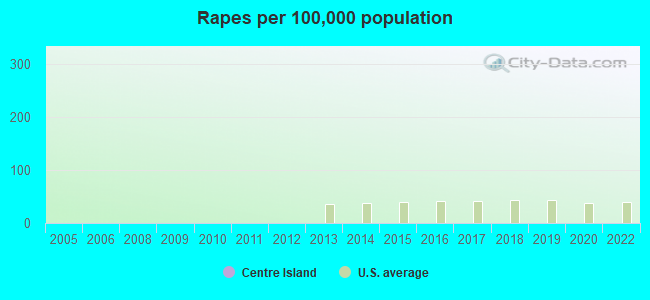
| Rapes (per 100,000) | 0 (0.0) | 0 (0.0) | 0 (0.0) | 0 (0.0) | 0 (0.0) | 0 (0.0) | 0 (0.0) | 0 (0.0) | 0 (0.0) | 0 (0.0) | 0 (0.0) | 0 (0.0) | 0 (0.0) |
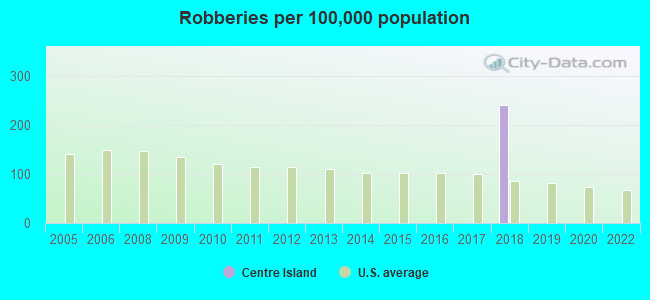
| Robberies (per 100,000) | 0 (0.0) | 0 (0.0) | 0 (0.0) | 0 (0.0) | 0 (0.0) | 0 (0.0) | 0 (0.0) | 0 (0.0) | 0 (0.0) | 1 (241.5) | 0 (0.0) | 0 (0.0) | 0 (0.0) |
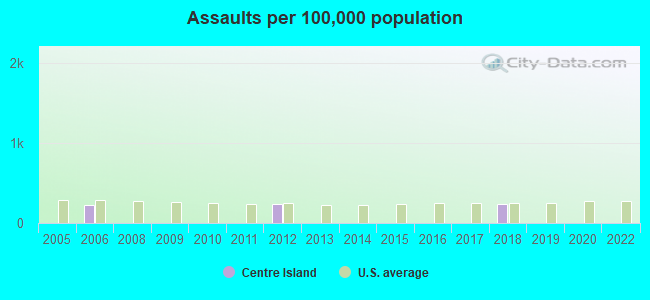
| Assaults (per 100,000) | 0 (0.0) | 0 (0.0) | 0 (0.0) | 1 (242.1) | 0 (0.0) | 0 (0.0) | 0 (0.0) | 0 (0.0) | 0 (0.0) | 1 (241.5) | 0 (0.0) | 0 (0.0) | 0 (0.0) |
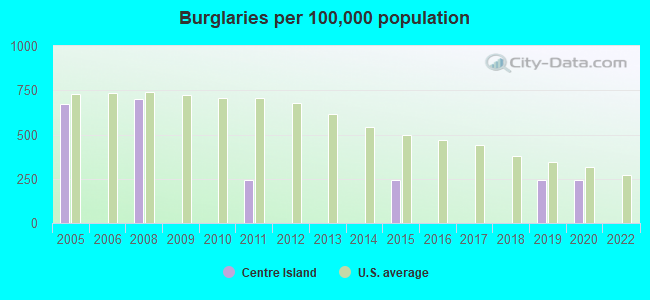
| Burglaries (per 100,000) | 0 (0.0) | 0 (0.0) | 1 (242.7) | 0 (0.0) | 0 (0.0) | 0 (0.0) | 1 (243.9) | 0 (0.0) | 0 (0.0) | 0 (0.0) | 1 (243.9) | 1 (244.5) | 0 (0.0) |
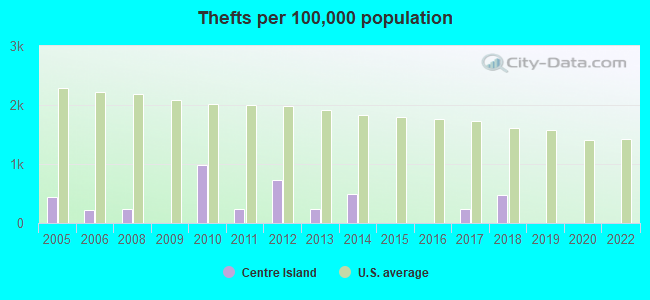
| Thefts (per 100,000) | 0 (0.0) | 4 (975.6) | 1 (242.7) | 3 (726.4) | 1 (243.3) | 2 (486.6) | 0 (0.0) | 0 (0.0) | 1 (245.1) | 2 (483.1) | 0 (0.0) | 0 (0.0) | 0 (0.0) |
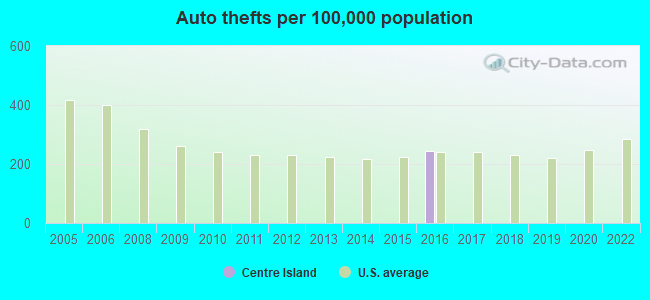
| Auto thefts (per 100,000) | 0 (0.0) | 0 (0.0) | 0 (0.0) | 0 (0.0) | 0 (0.0) | 0 (0.0) | 0 (0.0) | 1 (244.5) | 0 (0.0) | 0 (0.0) | 0 (0.0) | 0 (0.0) | 0 (0.0) |
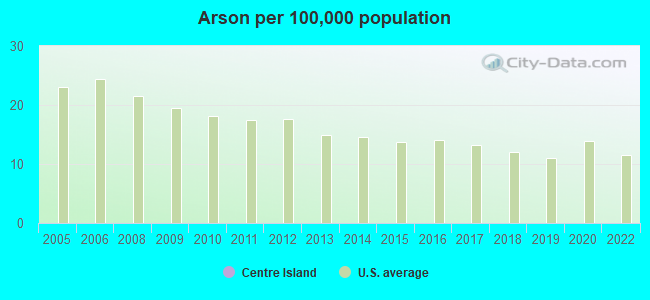
| Arson (per 100,000) | 0 (0.0) | 0 (0.0) | 0 (0.0) | 0 (0.0) | 0 (0.0) | 0 (0.0) | 0 (0.0) | 0 (0.0) | 0 (0.0) | 0 (0.0) | 0 (0.0) | 0 (0.0) | 0 (0.0) |
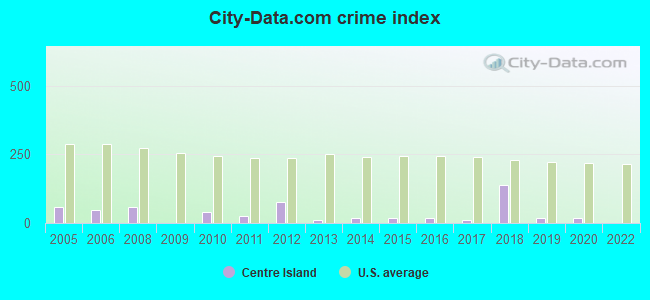
| City-Data.com crime index | 0.0 | 39.0 | 26.7 | 77.5 | 9.7 | 19.5 | 17.1 | 19.6 | 9.8 | 140.1 | 17.1 | 17.1 | 0.0 |
The City-Data.com crime index weighs serious crimes and violent crimes more heavily. Higher means more crime, U.S. average is 246.1. It adjusts for the number of visitors and daily workers commuting into cities.
Violent crime rate in 2022
| Centre Island: | 0.0 |
| U.S. Average: | 219.8 |
Violent crime rate in 2020
| Centre Island: | 0.0 |
| U.S. Average: | 228.2 |
Violent crime rate in 2019
| Centre Island: | 0.0 |
| U.S. Average: | 219.9 |
Violent crime rate in 2018
| Centre Island: | 241.5 |
| U.S. Average: | 221.2 |
Violent crime rate in 2017
| Centre Island: | 0.0 |
| U.S. Average: | 226.2 |
Violent crime rate in 2016
| Centre Island: | 0.0 |
| U.S. Average: | 227.3 |
Violent crime rate in 2015
| Centre Island: | 0.0 |
| U.S. Average: | 219.3 |
Violent crime rate in 2014
| Centre Island: | 0.0 |
| U.S. Average: | 211.1 |
Violent crime rate in 2013
| Centre Island: | 0.0 |
| U.S. Average: | 214.2 |
Violent crime rate in 2012
| Centre Island: | 121.1 |
| U.S. Average: | 187.4 |
Violent crime rate in 2011
| Centre Island: | 0.0 |
| U.S. Average: | 187.1 |
Violent crime rate in 2010
| Centre Island: | 0.0 |
| U.S. Average: | 195.7 |
Violent crime rate in 2009
| Centre Island: | 0.0 |
| U.S. Average: | 208.9 |
Violent crime rate in 2008
| Centre Island: | 0.0 |
| U.S. Average: | 222.5 |
Violent crime rate in 2006
| Centre Island: | 101.3 |
| U.S. Average: | 232.6 |
Violent crime rate in 2005
| Centre Island: | 0.0 |
| U.S. Average: | 227.0 |
Property crime rate in 2022
| Centre Island: | 0.0 |
| U.S. Average: | 166.5 |
Property crime rate in 2020
| Centre Island: | 48.9 |
| U.S. Average: | 169.6 |
Property crime rate in 2019
| Centre Island: | 48.8 |
| U.S. Average: | 179.7 |
Property crime rate in 2018
| Centre Island: | 24.2 |
| U.S. Average: | 190.2 |
Property crime rate in 2017
| Centre Island: | 12.3 |
| U.S. Average: | 206.4 |
Property crime rate in 2016
| Centre Island: | 36.7 |
| U.S. Average: | 216.6 |
Property crime rate in 2015
| Centre Island: | 48.8 |
| U.S. Average: | 221.5 |
Property crime rate in 2014
| Centre Island: | 24.3 |
| U.S. Average: | 230.8 |
Property crime rate in 2013
| Centre Island: | 12.2 |
| U.S. Average: | 250.4 |
Property crime rate in 2012
| Centre Island: | 36.3 |
| U.S. Average: | 267.3 |
Property crime rate in 2011
| Centre Island: | 60.7 |
| U.S. Average: | 273.5 |
Property crime rate in 2010
| Centre Island: | 48.8 |
| U.S. Average: | 276.4 |
Property crime rate in 2009
| Centre Island: | 0.0 |
| U.S. Average: | 285.6 |
Property crime rate in 2008
| Centre Island: | 151.9 |
| U.S. Average: | 302.2 |
Property crime rate in 2006
| Centre Island: | 10.1 |
| U.S. Average: | 317.3 |
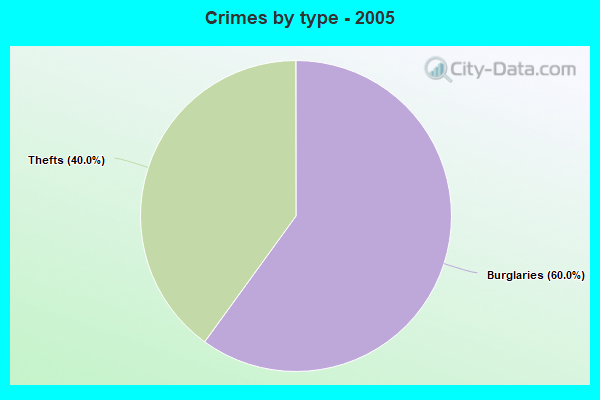
Property crime rate in 2005
| Centre Island: | 140.5 |
| U.S. Average: | 322.3 |
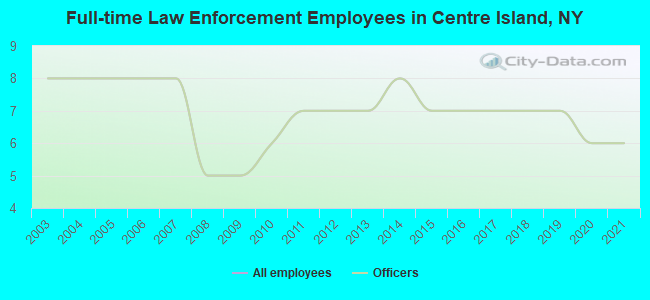
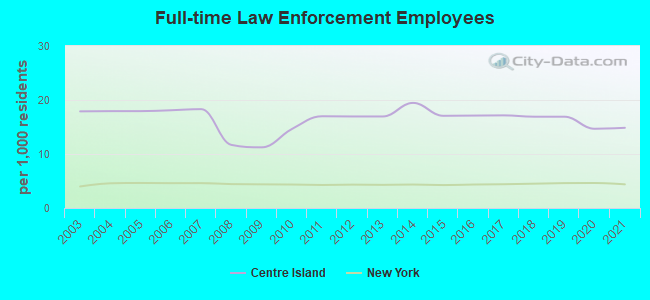
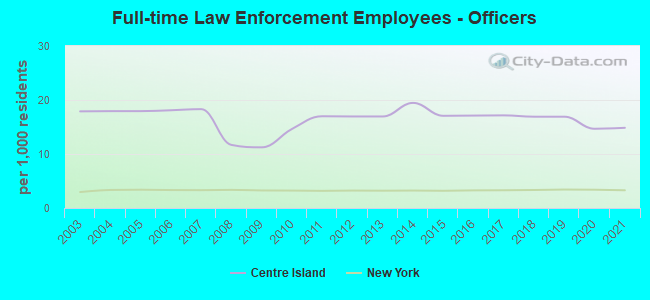
Full-time law enforcement employees in 2021, including police officers: 6 (6 officers - 6 male; 0 female).
| Officers per 1,000 residents here: | 14.85 |
| New York average: | 3.28 |
Full-time law enforcement employees in 2020, including police officers: 6 (6 officers - 6 male; 0 female).
| Officers per 1,000 residents here: | 14.67 |
| New York average: | 3.38 |
Full-time law enforcement employees in 2018, including police officers: 7 (7 officers - 7 male; 0 female).
| Officers per 1,000 residents here: | 16.91 |
| New York average: | 3.33 |
Full-time law enforcement employees in 2017, including police officers: 7 (7 officers - 7 male; 0 female).
| Officers per 1,000 residents here: | 17.16 |
| New York average: | 3.28 |
Full-time law enforcement employees in 2016, including police officers: 7 (7 officers - 7 male; 0 female).
| Officers per 1,000 residents here: | 17.11 |
| New York average: | 3.26 |
Full-time law enforcement employees in 2015, including police officers: 7 (7 officers - 7 male; 0 female).
| Officers per 1,000 residents here: | 17.07 |
| New York average: | 3.19 |
Full-time law enforcement employees in 2014, including police officers: 8 (8 officers - 8 male; 0 female).
| Officers per 1,000 residents here: | 19.46 |
| New York average: | 3.23 |
Full-time law enforcement employees in 2012, including police officers: 7 (7 officers - 7 male; 0 female).
| Officers per 1,000 residents here: | 16.95 |
| New York average: | 3.23 |
Full-time law enforcement employees in 2011, including police officers: 7 (7 officers - 7 male; 0 female).
| Officers per 1,000 residents here: | 16.99 |
| New York average: | 3.18 |
Full-time law enforcement employees in 2010, including police officers: 6 (6 officers - 6 male; 0 female).
| Officers per 1,000 residents here: | 14.63 |
| New York average: | 3.23 |
Full-time law enforcement employees in 2009, including police officers: 5 (5 officers - 5 male; 0 female).
| Officers per 1,000 residents here: | 11.24 |
| New York average: | 3.25 |
Full-time law enforcement employees in 2008, including police officers: 5 (5 officers - 5 male; 0 female).
| Officers per 1,000 residents here: | 11.68 |
| New York average: | 3.36 |
Full-time law enforcement employees in 2007, including police officers: 8 (8 officers - 8 male; 0 female).
| Officers per 1,000 residents here: | 18.31 |
| New York average: | 3.30 |
Full-time law enforcement employees in 2006, including police officers: 8 (8 officers - 8 male; 0 female).
| Officers per 1,000 residents here: | 18.10 |
| New York average: | 3.32 |
Full-time law enforcement employees in 2005, including police officers: 8 (8 officers - 8 male; 0 female).
| Officers per 1,000 residents here: | 17.94 |
| New York average: | 3.39 |
Full-time law enforcement employees in 2004, including police officers: 8 (8 officers - 8 male; 0 female).
| Officers per 1,000 residents here: | 17.94 |
| New York average: | 3.34 |
Full-time law enforcement employees in 2003, including police officers: 8 (8 officers - 8 male; 0 female).
| Officers per 1,000 residents here: | 17.90 |
| New York average: | 2.95 |

Zip codes: 11771.