Crime rate in Elizabeth, New Jersey (NJ): murders, rapes, robberies, assaults, burglaries, thefts, auto thefts, arson, law enforcement employees, police officers, crime map
Crime rate in Elizabeth, NJ
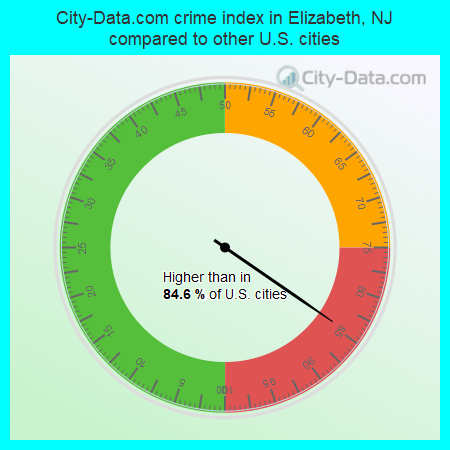
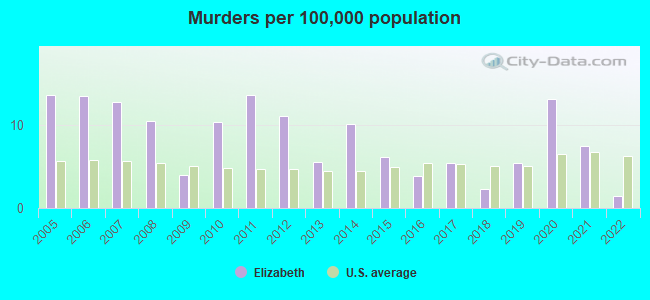
The 2022 crime rate in Elizabeth, NJ is 268 (City-Data.com crime index), which is about the average for the U.S. cities. It was higher than in 84.6% U.S. cities. The 2022 Elizabeth crime rate fell by 2% compared to 2021. The number of homicides stood at 2 - a decrease of 8 compared to 2021. In the last 5 years Elizabeth has seen decline of violent crime and decline of property crime.See how dangerous Elizabeth, NJ is compared to the nearest cities:
(Note: Higher means more crime)
(Note: Higher means more crime)
| Elizabeth: | 267.7 |
| Hillside: | 214.7 |
| Roselle: | 91.3 |
| Linden: | 231.5 |
| Roselle Park: | 61.3 |
| Union: | 81.6 |
| Kenilworth: | 55.1 |
| Irvington: | 204.0 |
| Bayonne: | 145.7 |
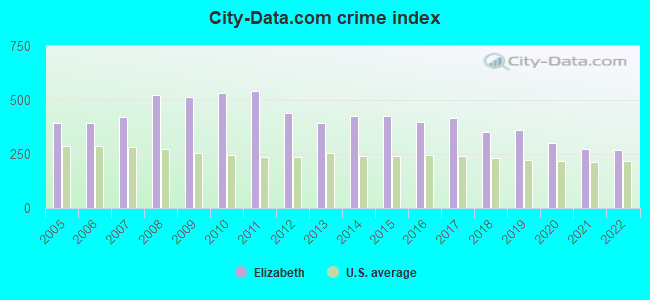
The City-Data.com crime index weighs serious crimes and violent crimes more heavily. Higher means more crime, U.S. average is 246.1. It adjusts for the number of visitors and daily workers commuting into cities.
- means the value is smaller than the state average.- means the value is about the same as the state average.
- means the value is bigger than the state average.
- means the value is much bigger than the state average.
According to our research of New Jersey and other state lists, there were 112 registered sex offenders living in Elizabeth, New Jersey as of April 19, 2024.
The ratio of all residents to sex offenders in Elizabeth is 1,149 to 1.
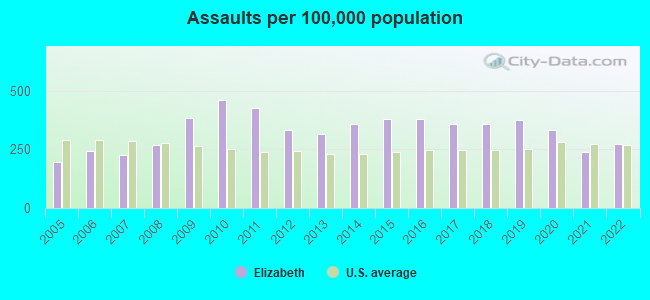
Violent crime rate in 2022
| Elizabeth: | 261.1 |
| U.S. Average: | 219.8 |
Violent crime rate in 2021
| Elizabeth: | 275.8 |
| U.S. Average: | 224.8 |
Violent crime rate in 2020
| Elizabeth: | 335.5 |
| U.S. Average: | 228.2 |
Violent crime rate in 2019
| Elizabeth: | 387.2 |
| U.S. Average: | 219.9 |
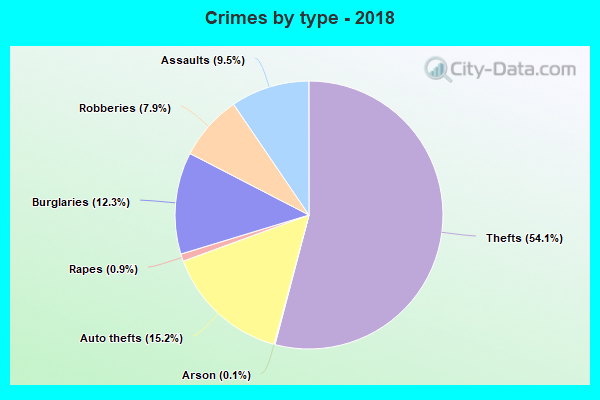
Violent crime rate in 2018
| Elizabeth: | 367.6 |
| U.S. Average: | 221.2 |
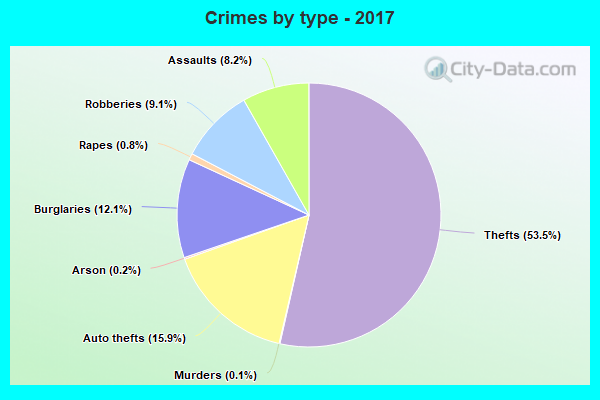
Violent crime rate in 2017
| Elizabeth: | 424.7 |
| U.S. Average: | 226.2 |
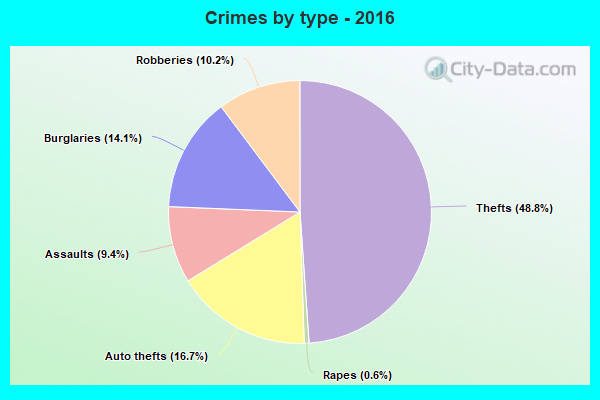
Violent crime rate in 2016
| Elizabeth: | 426.8 |
| U.S. Average: | 227.3 |
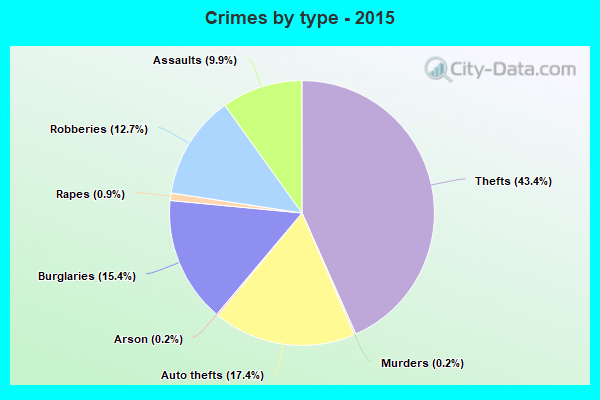
Violent crime rate in 2015
| Elizabeth: | 480.0 |
| U.S. Average: | 219.3 |
Violent crime rate in 2014
| Elizabeth: | 473.3 |
| U.S. Average: | 211.1 |
Violent crime rate in 2013
| Elizabeth: | 415.9 |
| U.S. Average: | 214.2 |
Violent crime rate in 2012
| Elizabeth: | 430.0 |
| U.S. Average: | 187.4 |
Violent crime rate in 2011
| Elizabeth: | 559.9 |
| U.S. Average: | 187.1 |
Violent crime rate in 2010
| Elizabeth: | 589.3 |
| U.S. Average: | 195.7 |
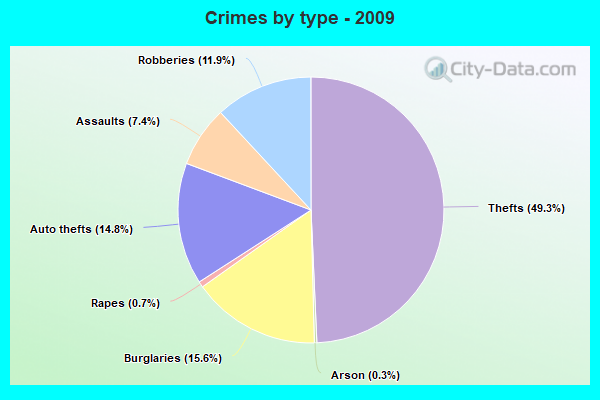
Violent crime rate in 2009
| Elizabeth: | 539.2 |
| U.S. Average: | 208.9 |
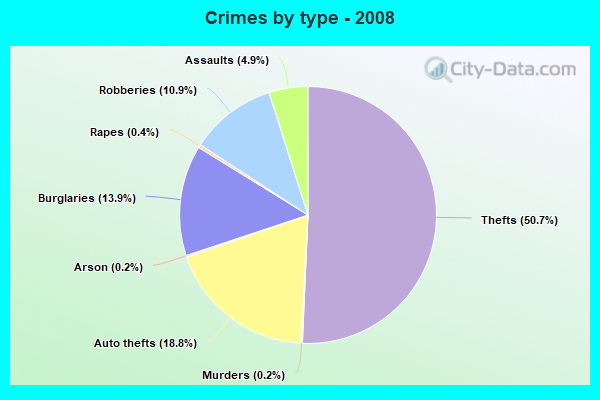
Violent crime rate in 2008
| Elizabeth: | 477.1 |
| U.S. Average: | 222.5 |
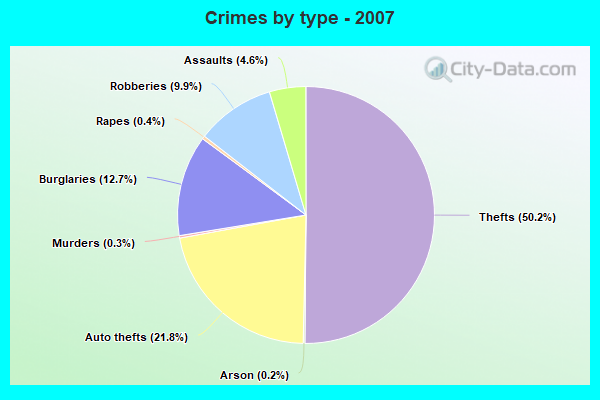
Violent crime rate in 2007
| Elizabeth: | 367.4 |
| U.S. Average: | 229.1 |
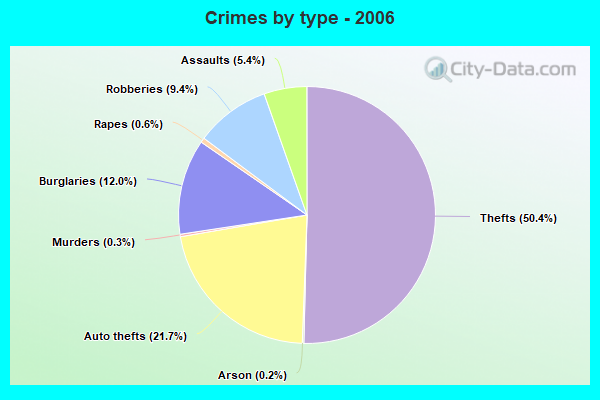
Violent crime rate in 2006
| Elizabeth: | 355.0 |
| U.S. Average: | 232.6 |
Violent crime rate in 2005
| Elizabeth: | 325.4 |
| U.S. Average: | 227.0 |
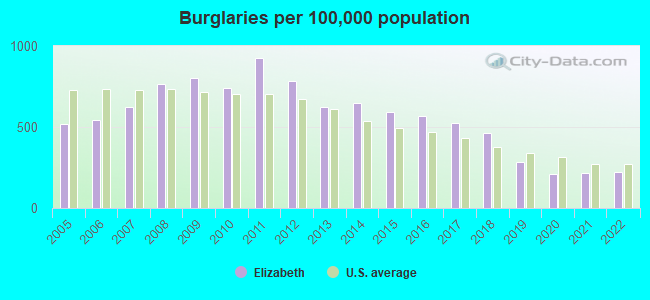
Property crime rate in 2022
| Elizabeth: | 213.0 |
| U.S. Average: | 166.5 |
Property crime rate in 2021
| Elizabeth: | 197.3 |
| U.S. Average: | 157.8 |
Property crime rate in 2020
| Elizabeth: | 196.8 |
| U.S. Average: | 169.6 |
Property crime rate in 2019
| Elizabeth: | 252.7 |
| U.S. Average: | 179.7 |
Property crime rate in 2018
| Elizabeth: | 282.7 |
| U.S. Average: | 190.2 |
Property crime rate in 2017
| Elizabeth: | 325.1 |
| U.S. Average: | 206.4 |
Property crime rate in 2016
| Elizabeth: | 312.2 |
| U.S. Average: | 216.6 |
Property crime rate in 2015
| Elizabeth: | 302.3 |
| U.S. Average: | 221.5 |
Property crime rate in 2014
| Elizabeth: | 316.2 |
| U.S. Average: | 230.8 |
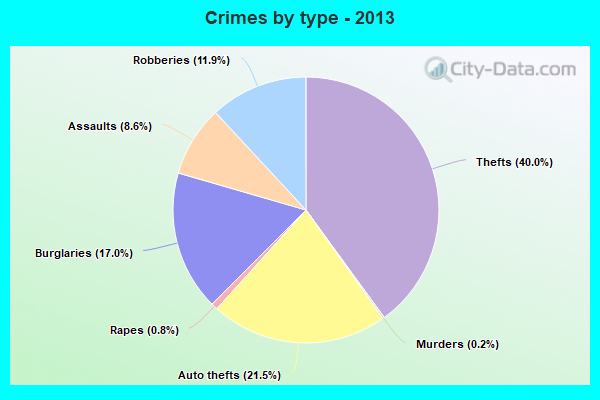
Property crime rate in 2013
| Elizabeth: | 316.2 |
| U.S. Average: | 250.4 |
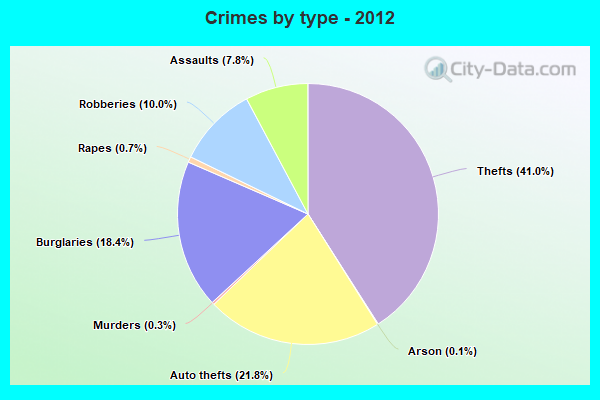
Property crime rate in 2012
| Elizabeth: | 381.9 |
| U.S. Average: | 267.3 |
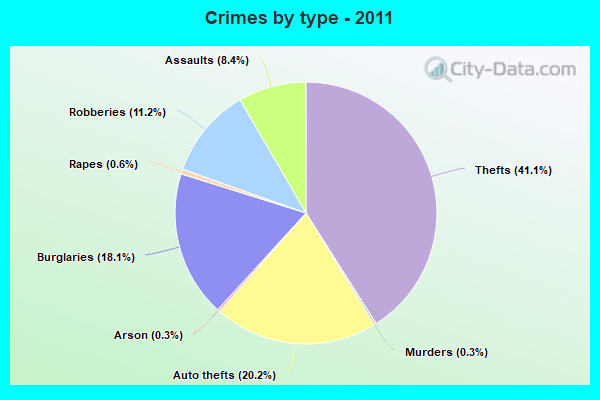
Property crime rate in 2011
| Elizabeth: | 445.7 |
| U.S. Average: | 273.5 |
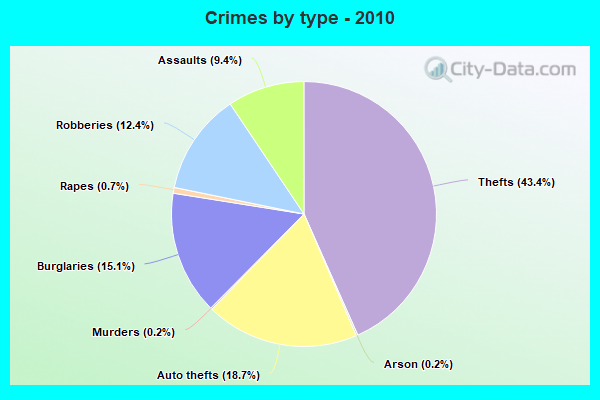
Property crime rate in 2010
| Elizabeth: | 391.9 |
| U.S. Average: | 276.4 |
Property crime rate in 2009
| Elizabeth: | 400.8 |
| U.S. Average: | 285.6 |
Property crime rate in 2008
| Elizabeth: | 448.9 |
| U.S. Average: | 302.2 |
Property crime rate in 2007
| Elizabeth: | 374.5 |
| U.S. Average: | 309.2 |
Property crime rate in 2006
| Elizabeth: | 336.3 |
| U.S. Average: | 317.3 |
Property crime rate in 2005
| Elizabeth: | 358.6 |
| U.S. Average: | 322.3 |
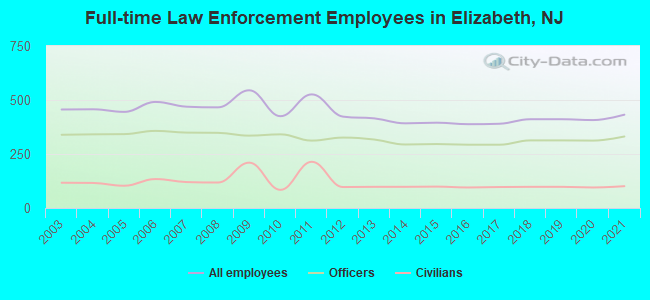
Full-time law enforcement employees in 2021, including police officers: 432 (331 officers - 292 male; 39 female).
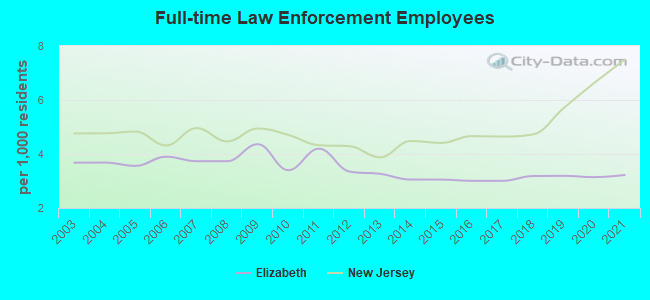
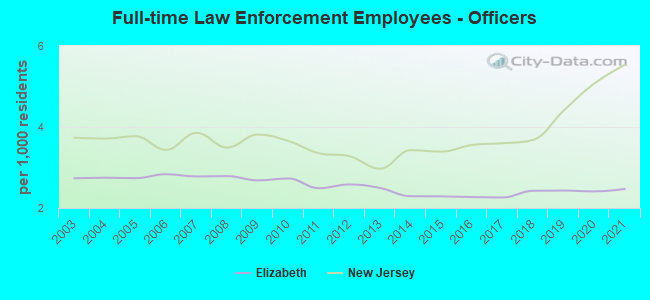
| Officers per 1,000 residents here: | 2.47 |
| New Jersey average: | 5.53 |
Full-time law enforcement employees in 2020, including police officers: 407 (312 officers - 271 male; 41 female).
| Officers per 1,000 residents here: | 2.41 |
| New Jersey average: | 5.07 |
Full-time law enforcement employees in 2019, including police officers: 411 (313 officers - 283 male; 30 female).
| Officers per 1,000 residents here: | 2.43 |
| New Jersey average: | 4.40 |
Full-time law enforcement employees in 2018, including police officers: 411 (313 officers - 283 male; 30 female).
| Officers per 1,000 residents here: | 2.42 |
| New Jersey average: | 3.68 |
Full-time law enforcement employees in 2017, including police officers: 390 (293 officers - 264 male; 29 female).
| Officers per 1,000 residents here: | 2.26 |
| New Jersey average: | 3.60 |
Full-time law enforcement employees in 2016, including police officers: 388 (293 officers - 263 male; 30 female).
| Officers per 1,000 residents here: | 2.27 |
| New Jersey average: | 3.56 |
Full-time law enforcement employees in 2015, including police officers: 395 (296 officers - 268 male; 28 female).
| Officers per 1,000 residents here: | 2.29 |
| New Jersey average: | 3.39 |
Full-time law enforcement employees in 2014, including police officers: 392 (294 officers - 267 male; 27 female).
| Officers per 1,000 residents here: | 2.29 |
| New Jersey average: | 3.43 |
Full-time law enforcement employees in 2013, including police officers: 415 (317 officers - 290 male; 27 female).
| Officers per 1,000 residents here: | 2.49 |
| New Jersey average: | 2.97 |
Full-time law enforcement employees in 2012, including police officers: 423 (326 officers - 299 male; 27 female).
| Officers per 1,000 residents here: | 2.58 |
| New Jersey average: | 3.28 |
Full-time law enforcement employees in 2011, including police officers: 526 (312 officers - 289 male; 23 female).
| Officers per 1,000 residents here: | 2.49 |
| New Jersey average: | 3.35 |
Full-time law enforcement employees in 2010, including police officers: 425 (341 officers - 318 male; 23 female).
| Officers per 1,000 residents here: | 2.73 |
| New Jersey average: | 3.66 |
Full-time law enforcement employees in 2009, including police officers: 545 (335 officers - 314 male; 21 female).
| Officers per 1,000 residents here: | 2.68 |
| New Jersey average: | 3.81 |
Full-time law enforcement employees in 2008, including police officers: 466 (348 officers - 327 male; 21 female).
| Officers per 1,000 residents here: | 2.79 |
| New Jersey average: | 3.49 |
Full-time law enforcement employees in 2007, including police officers: 469 (349 officers - 330 male; 19 female).
| Officers per 1,000 residents here: | 2.78 |
| New Jersey average: | 3.86 |
Full-time law enforcement employees in 2006, including police officers: 491 (357 officers - 336 male; 21 female).
| Officers per 1,000 residents here: | 2.84 |
| New Jersey average: | 3.44 |
Full-time law enforcement employees in 2005, including police officers: 445 (342 officers - 322 male; 20 female).
| Officers per 1,000 residents here: | 2.74 |
| New Jersey average: | 3.77 |
Full-time law enforcement employees in 2004, including police officers: 457 (341 officers - 322 male; 19 female).
| Officers per 1,000 residents here: | 2.75 |
| New Jersey average: | 3.71 |
Full-time law enforcement employees in 2003, including police officers: 456 (339 officers - 322 male; 17 female).
| Officers per 1,000 residents here: | 2.73 |
| New Jersey average: | 3.74 |