Crime rate in Fort Myers, Florida (FL): murders, rapes, robberies, assaults, burglaries, thefts, auto thefts, arson, law enforcement employees, police officers, crime map
Crime rate in Fort Myers, FL
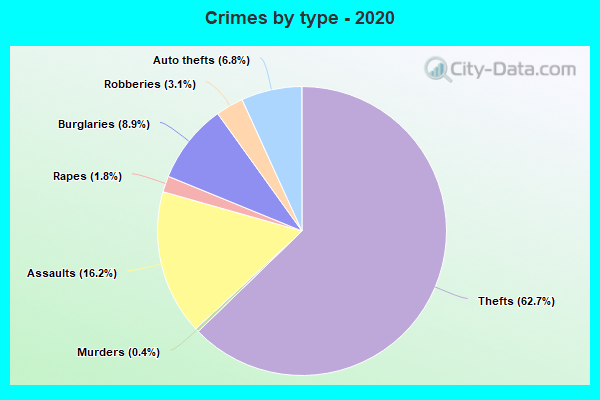
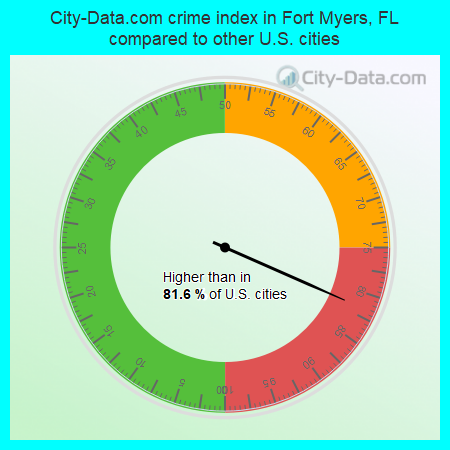
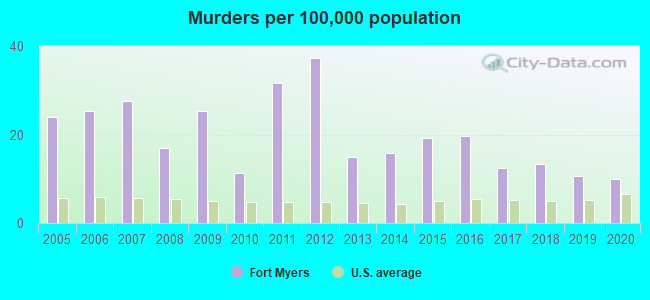
The 2020 crime rate in Fort Myers, FL is 243 (City-Data.com crime index), which is comparable to the U.S. average. It was higher than in 81.6% U.S. cities. The 2020 Fort Myers crime rate fell by 12% compared to 2019. The number of homicides stood at 9. In the last 5 years Fort Myers has seen decline of violent crime and decline of property crime.See how dangerous Fort Myers, FL is compared to the nearest cities:
(Note: Higher means more crime)
(Note: Higher means more crime)
| Fort Myers: | 242.7 |
| Cape Coral: | 9.3 |
| Sanibel: | 27.3 |
| Punta Gorda: | 72.1 |
| Naples: | 106.2 |
| North Port: | 88.2 |
| Arcadia: | 479.8 |
| Venice: | 86.4 |
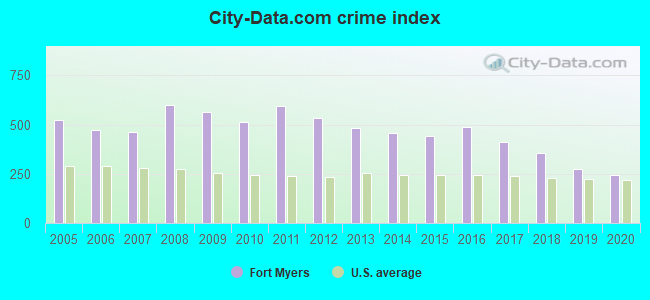
The City-Data.com crime index weighs serious crimes and violent crimes more heavily. Higher means more crime, U.S. average is 246.1. It adjusts for the number of visitors and daily workers commuting into cities.
- means the value is smaller than the state average.- means the value is about the same as the state average.
- means the value is bigger than the state average.
- means the value is much bigger than the state average.
According to our research of Florida and other state lists, there were 343 registered sex offenders living in Fort Myers, Florida as of April 15, 2024.
The ratio of all residents to sex offenders in Fort Myers is 220 to 1.
Violent crime rate in 2020
| Fort Myers: | 294.9 |
| U.S. Average: | 228.2 |
Violent crime rate in 2019
| Fort Myers: | 321.3 |
| U.S. Average: | 219.9 |
Violent crime rate in 2018
| Fort Myers: | 403.4 |
| U.S. Average: | 221.2 |
Violent crime rate in 2017
| Fort Myers: | 522.4 |
| U.S. Average: | 226.2 |
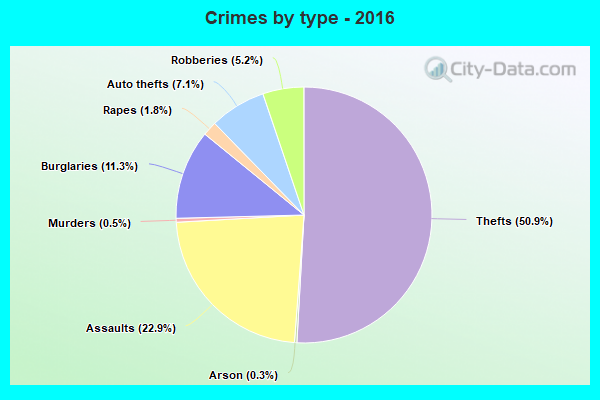
Violent crime rate in 2016
| Fort Myers: | 683.6 |
| U.S. Average: | 227.3 |
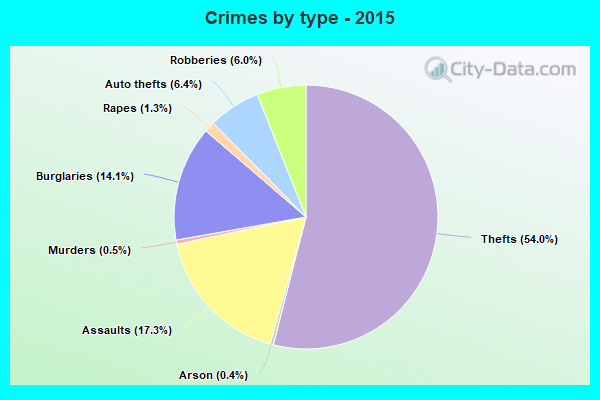
Violent crime rate in 2015
| Fort Myers: | 562.7 |
| U.S. Average: | 219.3 |
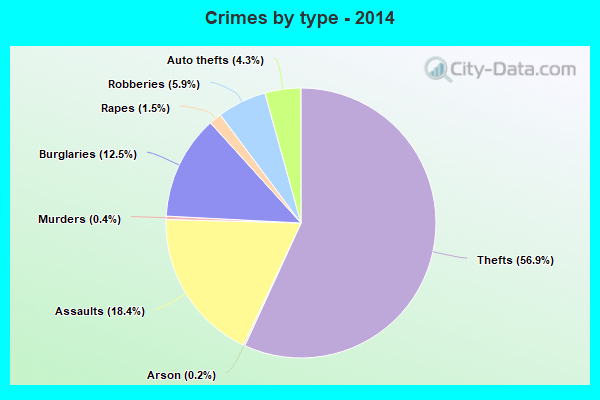
Violent crime rate in 2014
| Fort Myers: | 606.0 |
| U.S. Average: | 211.1 |
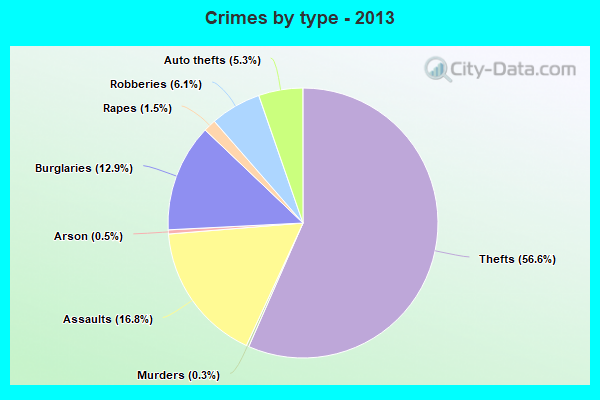
Violent crime rate in 2013
| Fort Myers: | 618.7 |
| U.S. Average: | 214.2 |
Violent crime rate in 2012
| Fort Myers: | 661.7 |
| U.S. Average: | 187.4 |
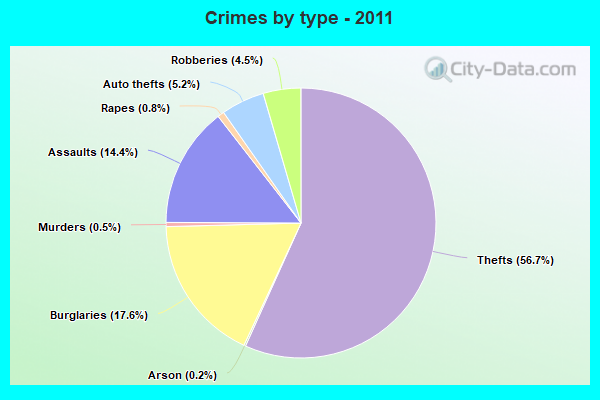
Violent crime rate in 2011
| Fort Myers: | 682.5 |
| U.S. Average: | 187.1 |
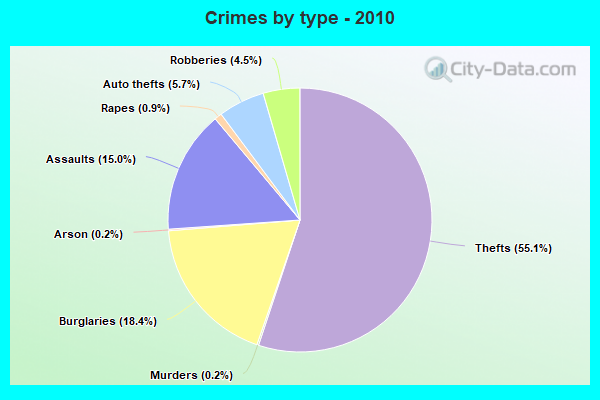
Violent crime rate in 2010
| Fort Myers: | 600.3 |
| U.S. Average: | 195.7 |
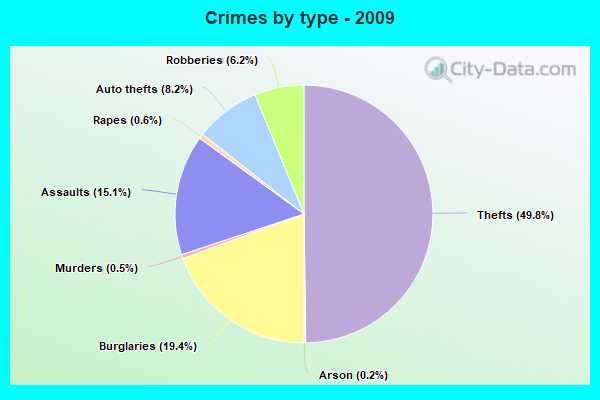
Violent crime rate in 2009
| Fort Myers: | 666.1 |
| U.S. Average: | 208.9 |
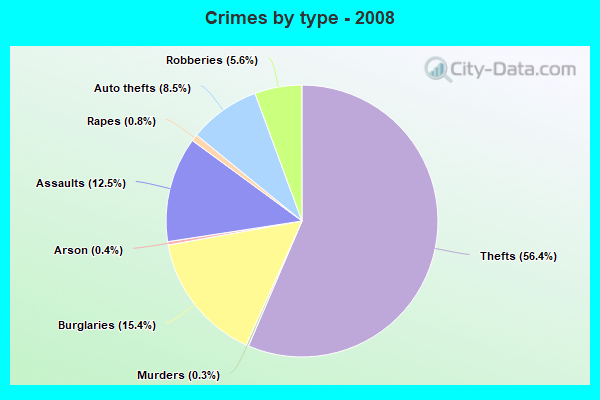
Violent crime rate in 2008
| Fort Myers: | 664.3 |
| U.S. Average: | 222.5 |
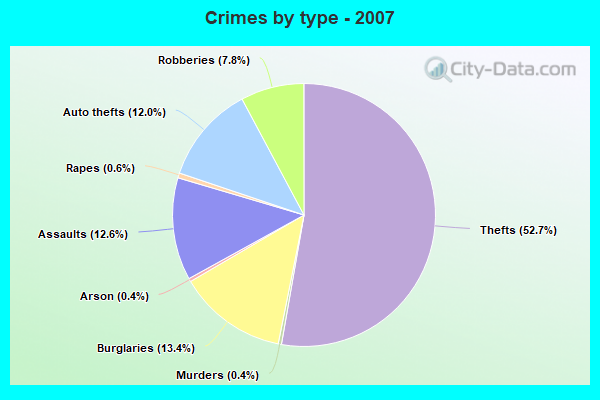
Violent crime rate in 2007
| Fort Myers: | 529.7 |
| U.S. Average: | 229.1 |
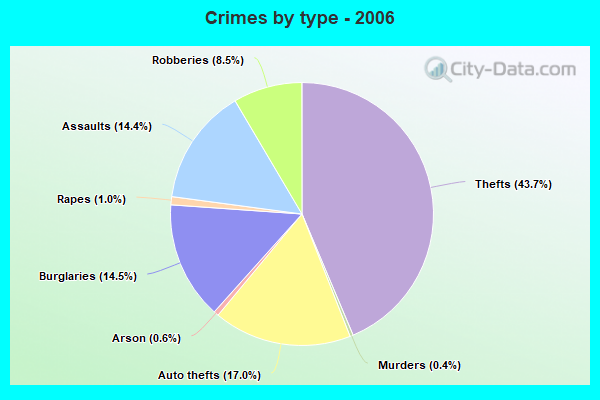
Violent crime rate in 2006
| Fort Myers: | 563.2 |
| U.S. Average: | 232.6 |
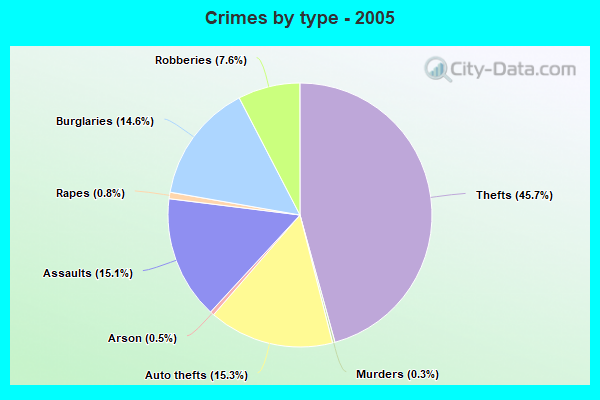
Violent crime rate in 2005
| Fort Myers: | 627.6 |
| U.S. Average: | 227.0 |
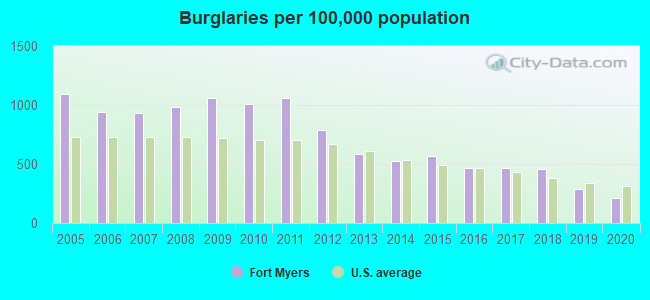
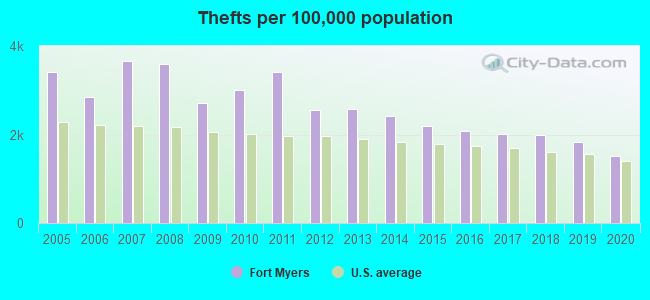
Property crime rate in 2020
| Fort Myers: | 142.3 |
| U.S. Average: | 169.6 |
Property crime rate in 2019
| Fort Myers: | 175.9 |
| U.S. Average: | 179.7 |
Property crime rate in 2018
| Fort Myers: | 237.1 |
| U.S. Average: | 190.2 |
Property crime rate in 2017
| Fort Myers: | 236.6 |
| U.S. Average: | 206.4 |
Property crime rate in 2016
| Fort Myers: | 239.3 |
| U.S. Average: | 216.6 |
Property crime rate in 2015
| Fort Myers: | 262.4 |
| U.S. Average: | 221.5 |
Property crime rate in 2014
| Fort Myers: | 253.6 |
| U.S. Average: | 230.8 |
Property crime rate in 2013
| Fort Myers: | 282.6 |
| U.S. Average: | 250.4 |
Property crime rate in 2012
| Fort Myers: | 331.4 |
| U.S. Average: | 267.3 |
Property crime rate in 2011
| Fort Myers: | 428.8 |
| U.S. Average: | 273.5 |
Property crime rate in 2010
| Fort Myers: | 399.0 |
| U.S. Average: | 276.4 |
Property crime rate in 2009
| Fort Myers: | 414.8 |
| U.S. Average: | 285.6 |
Property crime rate in 2008
| Fort Myers: | 458.9 |
| U.S. Average: | 302.2 |
Property crime rate in 2007
| Fort Myers: | 324.6 |
| U.S. Average: | 309.2 |
Property crime rate in 2006
| Fort Myers: | 326.3 |
| U.S. Average: | 317.3 |
Property crime rate in 2005
| Fort Myers: | 368.3 |
| U.S. Average: | 322.3 |

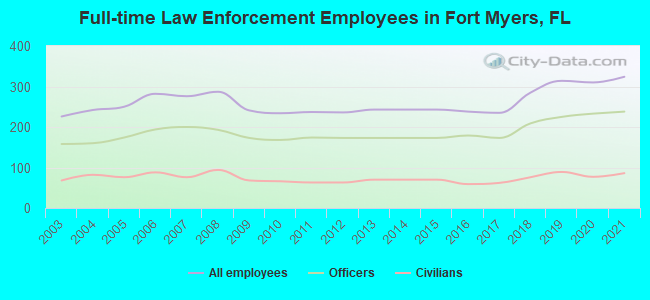
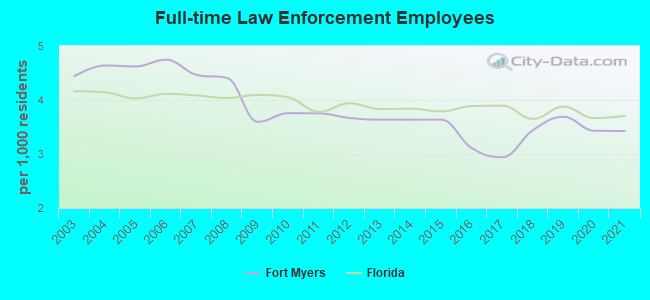
Full-time law enforcement employees in 2021, including police officers: 324 (238 officers - 191 male; 47 female).
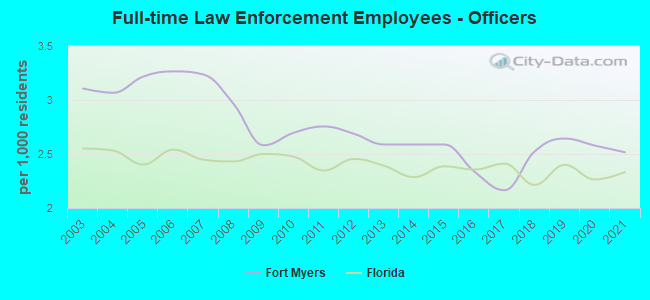
| Officers per 1,000 residents here: | 2.52 |
| Florida average: | 2.33 |
Full-time law enforcement employees in 2020, including police officers: 310 (233 officers - 189 male; 44 female).
| Officers per 1,000 residents here: | 2.58 |
| Florida average: | 2.26 |
Full-time law enforcement employees in 2019, including police officers: 314 (225 officers - 178 male; 47 female).
| Officers per 1,000 residents here: | 2.64 |
| Florida average: | 2.40 |
Full-time law enforcement employees in 2018, including police officers: 285 (209 officers - 164 male; 45 female).
| Officers per 1,000 residents here: | 2.52 |
| Florida average: | 2.21 |
Full-time law enforcement employees in 2017, including police officers: 235 (173 officers - 137 male; 36 female).
| Officers per 1,000 residents here: | 2.16 |
| Florida average: | 2.41 |
Full-time law enforcement employees in 2016, including police officers: 238 (179 officers - 143 male; 36 female).
| Officers per 1,000 residents here: | 2.34 |
| Florida average: | 2.36 |
Full-time law enforcement employees in 2013, including police officers: 243 (173 officers - 137 male; 36 female).
| Officers per 1,000 residents here: | 2.59 |
| Florida average: | 2.39 |
Full-time law enforcement employees in 2012, including police officers: 236 (173 officers - 138 male; 35 female).
| Officers per 1,000 residents here: | 2.69 |
| Florida average: | 2.45 |
Full-time law enforcement employees in 2011, including police officers: 237 (174 officers - 138 male; 36 female).
| Officers per 1,000 residents here: | 2.76 |
| Florida average: | 2.35 |
Full-time law enforcement employees in 2010, including police officers: 234 (168 officers - 134 male; 34 female).
| Officers per 1,000 residents here: | 2.70 |
| Florida average: | 2.47 |
Full-time law enforcement employees in 2009, including police officers: 241 (173 officers - 139 male; 34 female).
| Officers per 1,000 residents here: | 2.58 |
| Florida average: | 2.50 |
Full-time law enforcement employees in 2008, including police officers: 287 (193 officers - 163 male; 30 female).
| Officers per 1,000 residents here: | 2.96 |
| Florida average: | 2.43 |
Full-time law enforcement employees in 2007, including police officers: 276 (200 officers - 169 male; 31 female).
| Officers per 1,000 residents here: | 3.24 |
| Florida average: | 2.45 |
Full-time law enforcement employees in 2006, including police officers: 282 (194 officers - 161 male; 33 female).
| Officers per 1,000 residents here: | 3.27 |
| Florida average: | 2.54 |
Full-time law enforcement employees in 2005, including police officers: 250 (174 officers - 149 male; 25 female).
| Officers per 1,000 residents here: | 3.22 |
| Florida average: | 2.40 |
Full-time law enforcement employees in 2004, including police officers: 242 (160 officers - 141 male; 19 female).
| Officers per 1,000 residents here: | 3.07 |
| Florida average: | 2.53 |
Full-time law enforcement employees in 2003, including police officers: 226 (158 officers - 142 male; 16 female).
| Officers per 1,000 residents here: | 3.11 |
| Florida average: | 2.55 |