Crime rate in Gary, Indiana (IN): murders, rapes, robberies, assaults, burglaries, thefts, auto thefts, arson, law enforcement employees, police officers, crime map
Crime rate in Gary, IN
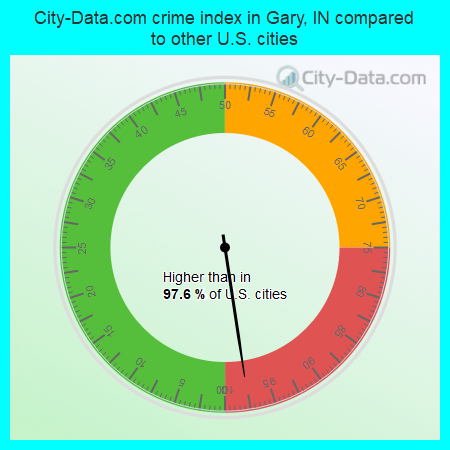
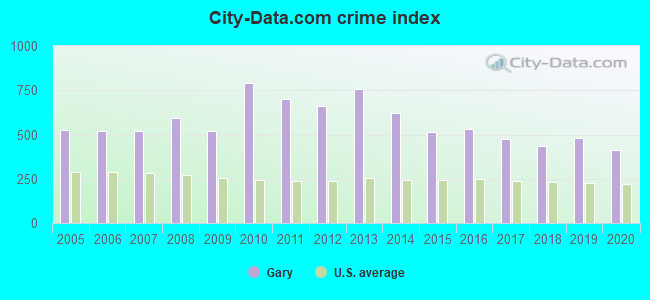
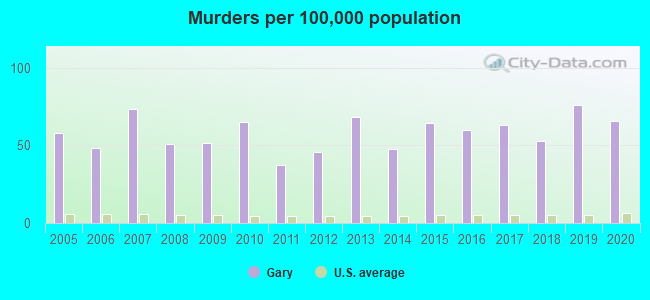
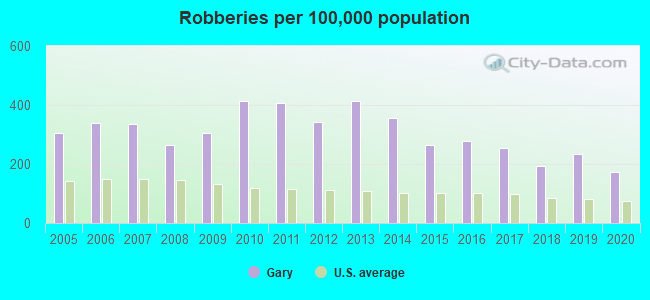
The 2020 crime rate in Gary, IN is 414 (City-Data.com crime index), which is 1.7 times higher than the U.S. average. It was higher than in 94.5% U.S. cities. The 2020 Gary crime rate fell by 14% compared to 2019. The number of homicides stood at 49 - a decrease of 8 compared to 2019. In the last 5 years Gary has seen decreasing violent crime and decreasing property crime.See how dangerous Gary, IN is compared to the nearest cities:
(Note: Higher means more crime)
(Note: Higher means more crime)
| Gary: | 413.8 |
| Lake Station: | 19.3 |
| Griffith: | 75.2 |
| Hobart: | 133.8 |
| Highland: | 78.6 |
| Merrillville: | 7.2 |
| East Chicago: | 292.6 |
| Hammond: | 364.5 |
| Schererville: | 78.5 |
The City-Data.com crime index weighs serious crimes and violent crimes more heavily. Higher means more crime, U.S. average is 246.1. It adjusts for the number of visitors and daily workers commuting into cities.
- means the value is smaller than the state average.- means the value is about the same as the state average.
- means the value is bigger than the state average.
- means the value is much bigger than the state average.
According to our research of Indiana and other state lists, there were 17 registered sex offenders living in Gary, Indiana as of April 17, 2024.
The ratio of all residents to sex offenders in Gary is 4,544 to 1.
The ratio of registered sex offenders to all residents in this city is much lower than the state average.
Violent crime rate in 2020
| Gary: | 345.2 |
| U.S. Average: | 228.2 |
Violent crime rate in 2019
| Gary: | 405.7 |
| U.S. Average: | 219.9 |
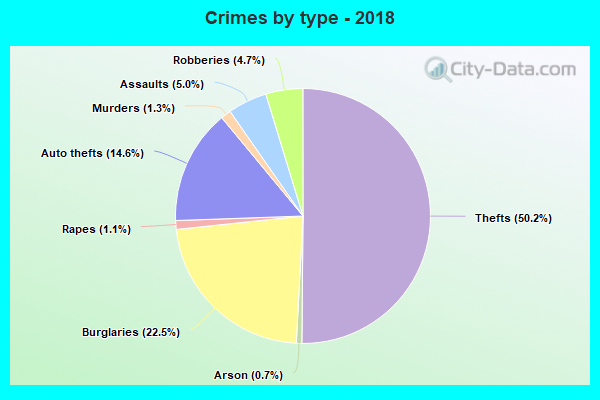
Violent crime rate in 2018
| Gary: | 349.3 |
| U.S. Average: | 221.2 |
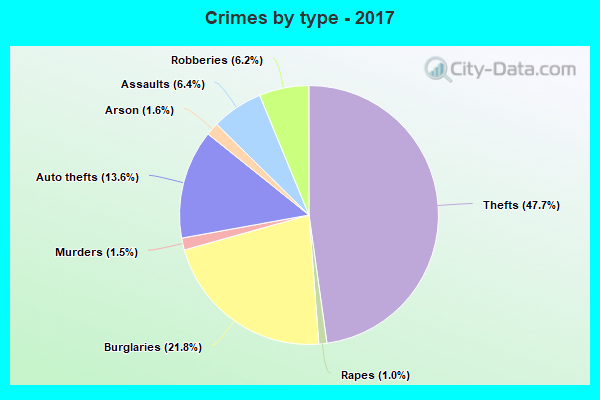
Violent crime rate in 2017
| Gary: | 426.7 |
| U.S. Average: | 226.2 |
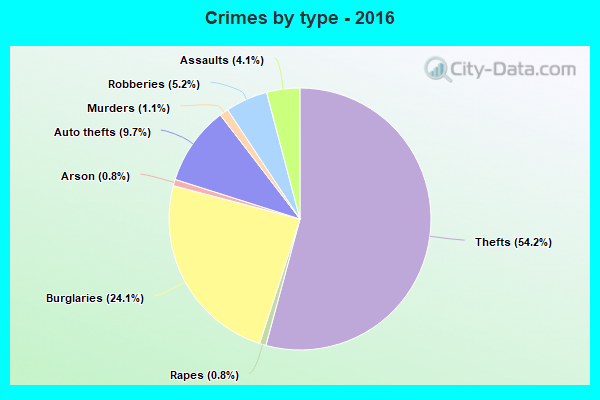
Violent crime rate in 2016
| Gary: | 411.5 |
| U.S. Average: | 227.3 |
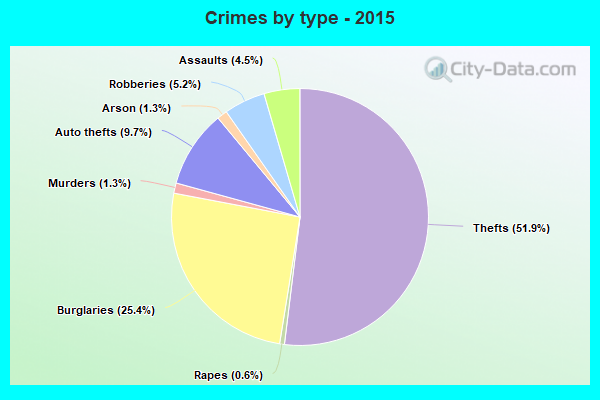
Violent crime rate in 2015
| Gary: | 407.3 |
| U.S. Average: | 219.3 |
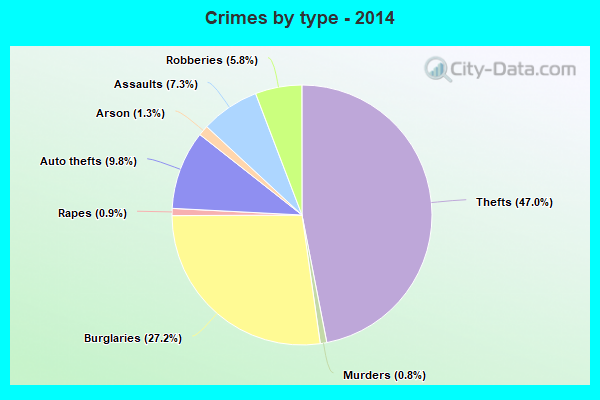
Violent crime rate in 2014
| Gary: | 555.7 |
| U.S. Average: | 211.1 |
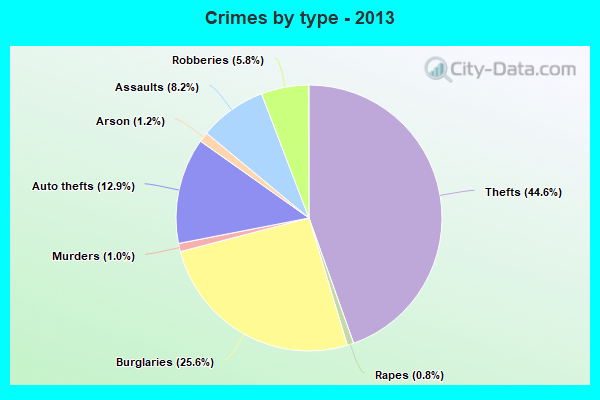
Violent crime rate in 2013
| Gary: | 697.8 |
| U.S. Average: | 214.2 |
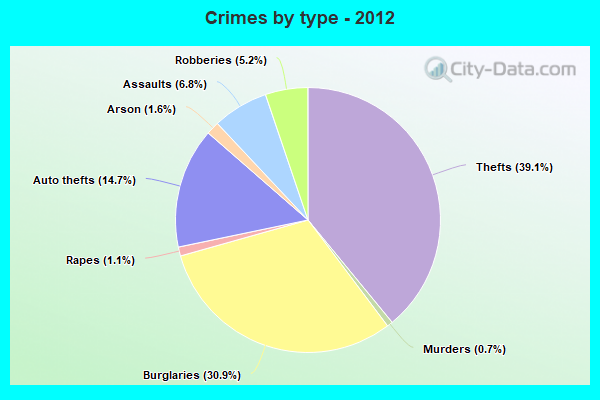
Violent crime rate in 2012
| Gary: | 556.1 |
| U.S. Average: | 187.4 |
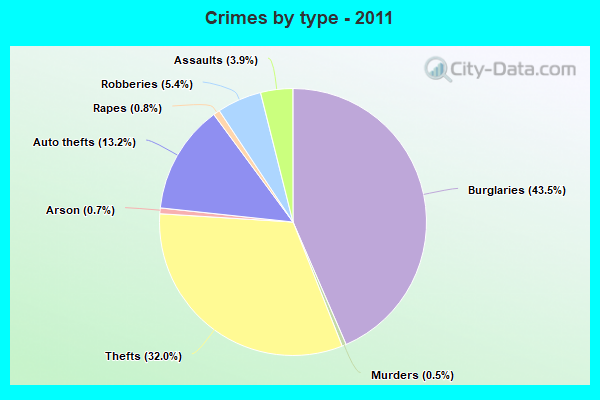
Violent crime rate in 2011
| Gary: | 480.8 |
| U.S. Average: | 187.1 |
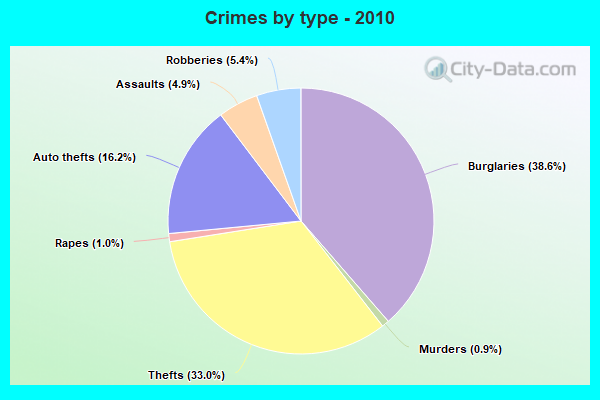
Violent crime rate in 2010
| Gary: | 598.4 |
| U.S. Average: | 195.7 |
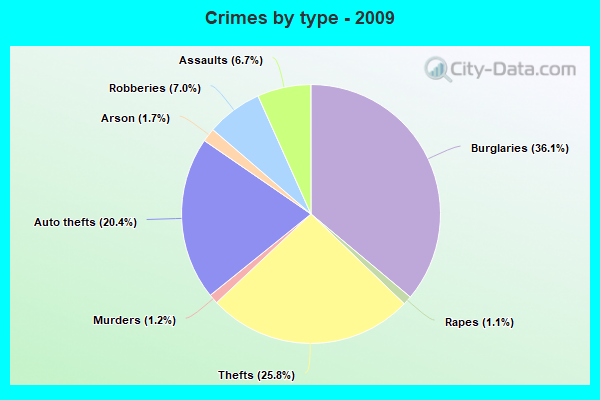
Violent crime rate in 2009
| Gary: | 449.0 |
| U.S. Average: | 208.9 |
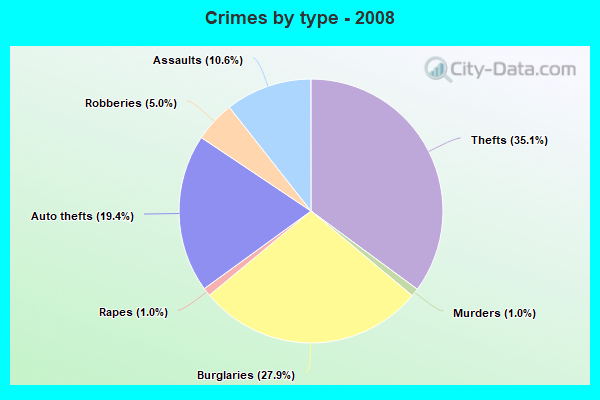
Violent crime rate in 2008
| Gary: | 568.4 |
| U.S. Average: | 222.5 |
Violent crime rate in 2007
| Gary: | 406.0 |
| U.S. Average: | 229.1 |
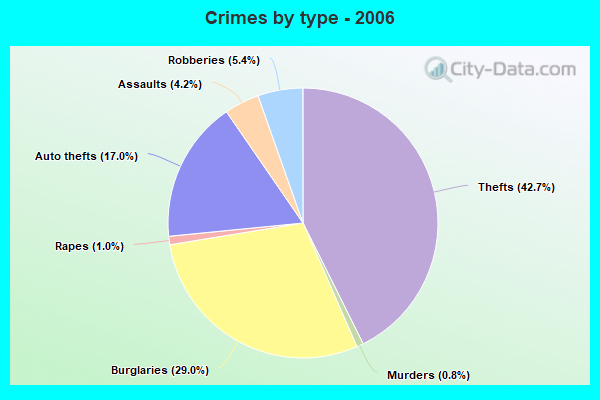
Violent crime rate in 2006
| Gary: | 385.1 |
| U.S. Average: | 232.6 |
Violent crime rate in 2005
| Gary: | 403.8 |
| U.S. Average: | 227.0 |
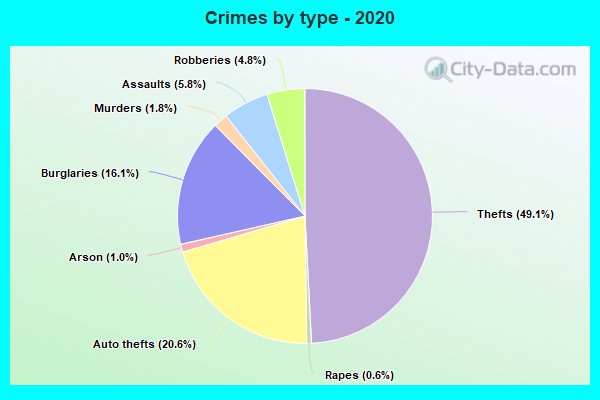
Property crime rate in 2020
| Gary: | 315.6 |
| U.S. Average: | 169.6 |
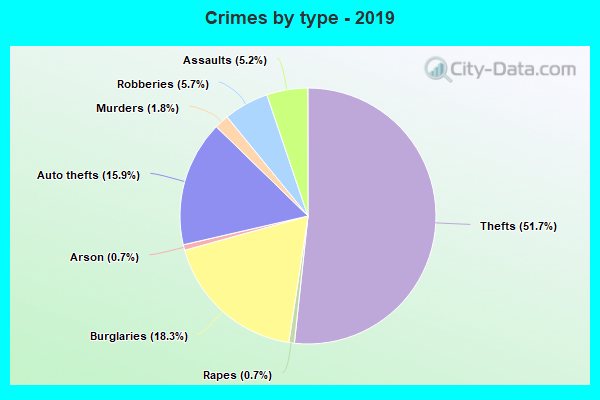
Property crime rate in 2019
| Gary: | 357.3 |
| U.S. Average: | 179.7 |
Property crime rate in 2018
| Gary: | 380.8 |
| U.S. Average: | 190.2 |
Property crime rate in 2017
| Gary: | 360.1 |
| U.S. Average: | 206.4 |
Property crime rate in 2016
| Gary: | 482.2 |
| U.S. Average: | 216.6 |
Property crime rate in 2015
| Gary: | 460.8 |
| U.S. Average: | 221.5 |
Property crime rate in 2014
| Gary: | 572.5 |
| U.S. Average: | 230.8 |
Property crime rate in 2013
| Gary: | 668.9 |
| U.S. Average: | 250.4 |
Property crime rate in 2012
| Gary: | 678.9 |
| U.S. Average: | 267.3 |
Property crime rate in 2011
| Gary: | 915.7 |
| U.S. Average: | 273.5 |
Property crime rate in 2010
| Gary: | 897.8 |
| U.S. Average: | 276.4 |
Property crime rate in 2009
| Gary: | 503.0 |
| U.S. Average: | 285.6 |
Property crime rate in 2008
| Gary: | 539.1 |
| U.S. Average: | 302.2 |
Property crime rate in 2007
| Gary: | 502.6 |
| U.S. Average: | 309.2 |
Property crime rate in 2006
| Gary: | 555.3 |
| U.S. Average: | 317.3 |
Property crime rate in 2005
| Gary: | 521.6 |
| U.S. Average: | 322.3 |
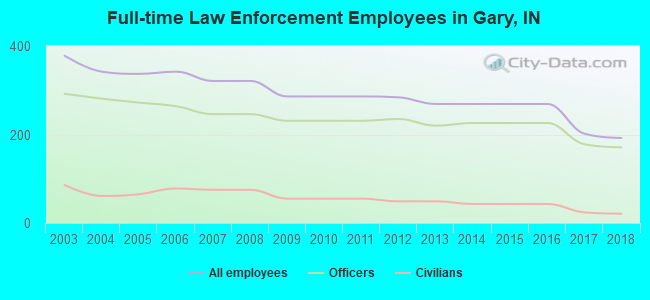
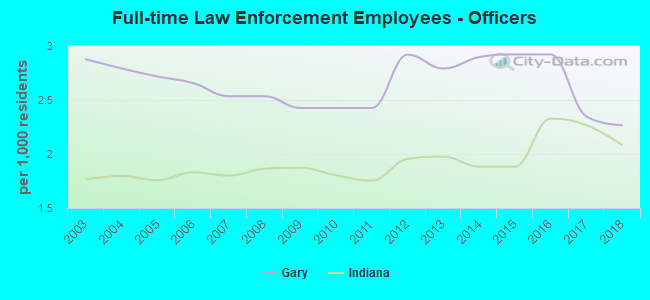
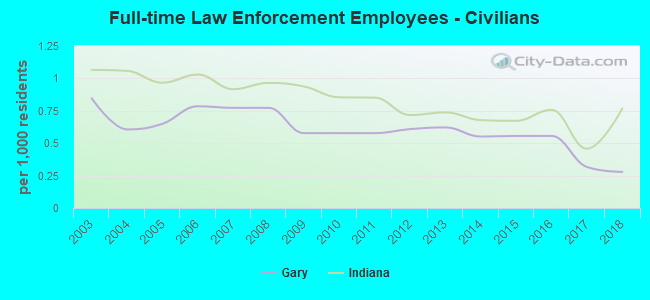
Full-time law enforcement employees in 2018, including police officers: 192 (171 officers - 156 male; 15 female).
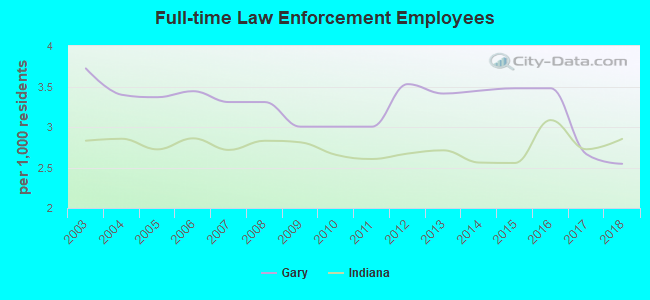
| Officers per 1,000 residents here: | 2.27 |
| Indiana average: | 2.08 |
Full-time law enforcement employees in 2017, including police officers: 202 (178 officers - 162 male; 16 female).
| Officers per 1,000 residents here: | 2.35 |
| Indiana average: | 2.27 |
Full-time law enforcement employees in 2015, including police officers: 269 (226 officers - 206 male; 20 female).
| Officers per 1,000 residents here: | 2.92 |
| Indiana average: | 1.88 |
Full-time law enforcement employees in 2014, including police officers: 269 (226 officers - 206 male; 20 female).
| Officers per 1,000 residents here: | 2.90 |
| Indiana average: | 1.88 |
Full-time law enforcement employees in 2013, including police officers: 269 (220 officers - 196 male; 24 female).
| Officers per 1,000 residents here: | 2.79 |
| Indiana average: | 1.97 |
Full-time law enforcement employees in 2012, including police officers: 284 (235 officers - 211 male; 24 female).
| Officers per 1,000 residents here: | 2.92 |
| Indiana average: | 1.96 |
Full-time law enforcement employees in 2009, including police officers: 286 (231 officers - 208 male; 23 female).
| Officers per 1,000 residents here: | 2.43 |
| Indiana average: | 1.87 |
Full-time law enforcement employees in 2007, including police officers: 321 (246 officers - 229 male; 17 female).
| Officers per 1,000 residents here: | 2.53 |
| Indiana average: | 1.80 |
Full-time law enforcement employees in 2006, including police officers: 342 (264 officers - 243 male; 21 female).
| Officers per 1,000 residents here: | 2.66 |
| Indiana average: | 1.83 |
Full-time law enforcement employees in 2005, including police officers: 337 (272 officers - 249 male; 23 female).
| Officers per 1,000 residents here: | 2.72 |
| Indiana average: | 1.76 |
Full-time law enforcement employees in 2004, including police officers: 342 (281 officers - 256 male; 25 female).
| Officers per 1,000 residents here: | 2.79 |
| Indiana average: | 1.80 |
Full-time law enforcement employees in 2003, including police officers: 378 (292 officers - 265 male; 27 female).
| Officers per 1,000 residents here: | 2.88 |
| Indiana average: | 1.77 |

Zip codes: 46402, 46403, 46404, 46405, 46406, 46407, 46408, 46409, 46410.