Crime rate in Harlingen, Texas (TX): murders, rapes, robberies, assaults, burglaries, thefts, auto thefts, arson, law enforcement employees, police officers, crime map
Crime rate in Harlingen, TX
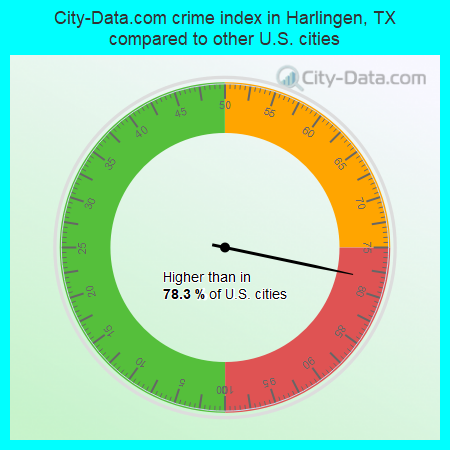
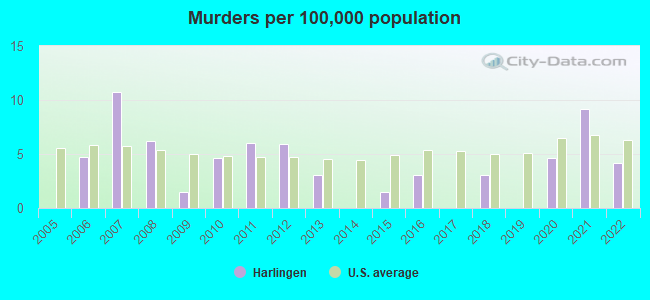
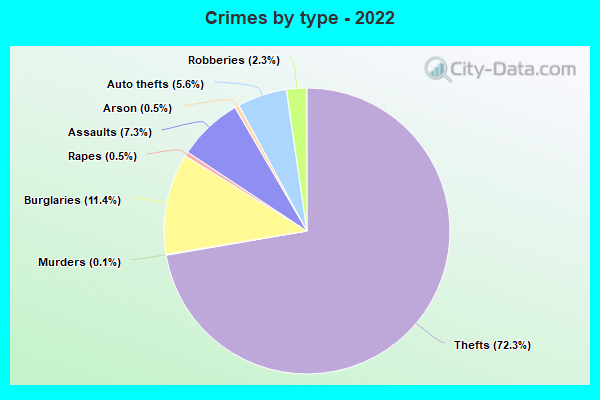
The 2022 crime rate in Harlingen, TX is 219 (City-Data.com crime index), which is about the average for the U.S. cities. It was higher than in 78.3% U.S. cities. The 2022 Harlingen crime rate fell by 19% compared to 2021. The number of homicides stood at 3 - a decrease of 3 compared to 2021. In the last 5 years Harlingen has seen decreasing violent crime and decreasing property crime.See how dangerous Harlingen, TX is compared to the nearest cities:
(Note: Higher means more crime)
(Note: Higher means more crime)
| Harlingen: | 219.4 |
| Palm Valley: | 12.2 |
| Primera: | 38.2 |
| Combes: | 159.2 |
| San Benito: | 190.0 |
| Rio Hondo: | 193.8 |
| La Feria: | 285.2 |
| Santa Rosa: | 18.5 |
| Rancho Viejo: | 32.1 |
The City-Data.com crime index weighs serious crimes and violent crimes more heavily. Higher means more crime, U.S. average is 246.1. It adjusts for the number of visitors and daily workers commuting into cities.
- means the value is smaller than the state average.- means the value is about the same as the state average.
- means the value is bigger than the state average.
- means the value is much bigger than the state average.
According to our research of Texas and other state lists, there were 250 registered sex offenders living in Harlingen, Texas as of April 19, 2024.
The ratio of all residents to sex offenders in Harlingen is 265 to 1.
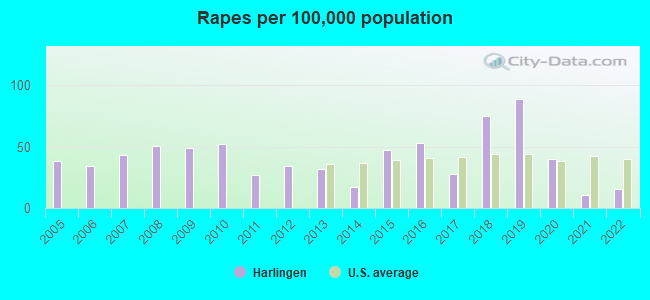
Violent crime rate in 2022
| Harlingen: | 175.6 |
| U.S. Average: | 219.8 |
Violent crime rate in 2021
| Harlingen: | 222.4 |
| U.S. Average: | 224.8 |
Violent crime rate in 2020
| Harlingen: | 238.4 |
| U.S. Average: | 228.2 |
Violent crime rate in 2019
| Harlingen: | 255.0 |
| U.S. Average: | 219.9 |
Violent crime rate in 2018
| Harlingen: | 248.0 |
| U.S. Average: | 221.2 |
Violent crime rate in 2017
| Harlingen: | 191.3 |
| U.S. Average: | 226.2 |
Violent crime rate in 2016
| Harlingen: | 244.3 |
| U.S. Average: | 227.3 |
Violent crime rate in 2015
| Harlingen: | 176.2 |
| U.S. Average: | 219.3 |
Violent crime rate in 2014
| Harlingen: | 119.3 |
| U.S. Average: | 211.1 |
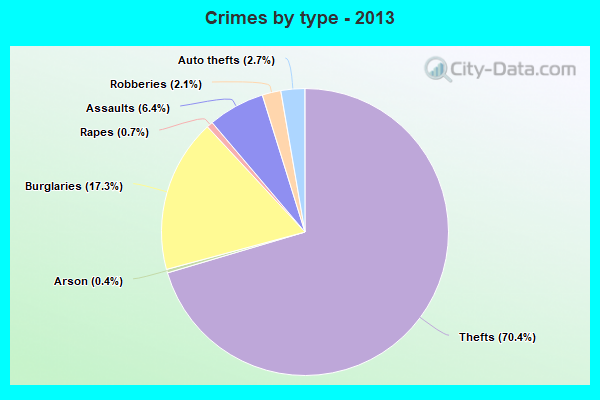
Violent crime rate in 2013
| Harlingen: | 220.8 |
| U.S. Average: | 214.2 |
Violent crime rate in 2012
| Harlingen: | 228.0 |
| U.S. Average: | 187.4 |
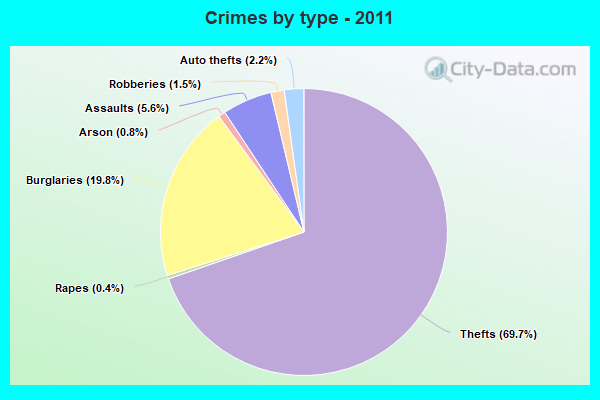
Violent crime rate in 2011
| Harlingen: | 277.1 |
| U.S. Average: | 187.1 |
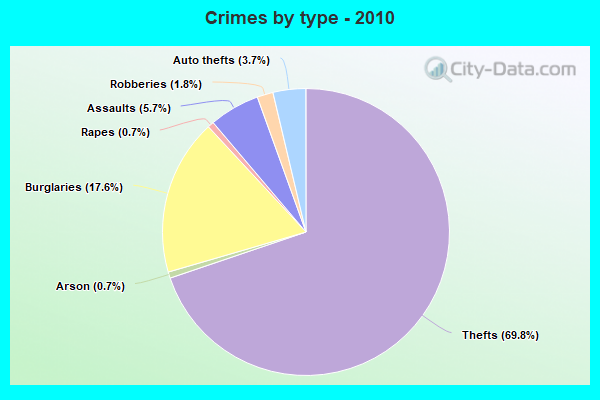
Violent crime rate in 2010
| Harlingen: | 340.8 |
| U.S. Average: | 195.7 |
Violent crime rate in 2009
| Harlingen: | 255.5 |
| U.S. Average: | 208.9 |
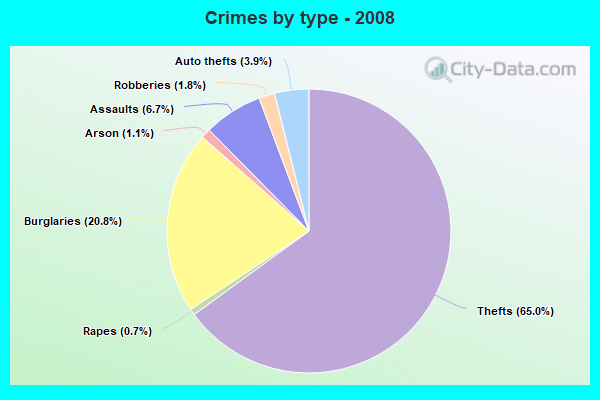
Violent crime rate in 2008
| Harlingen: | 385.1 |
| U.S. Average: | 222.5 |
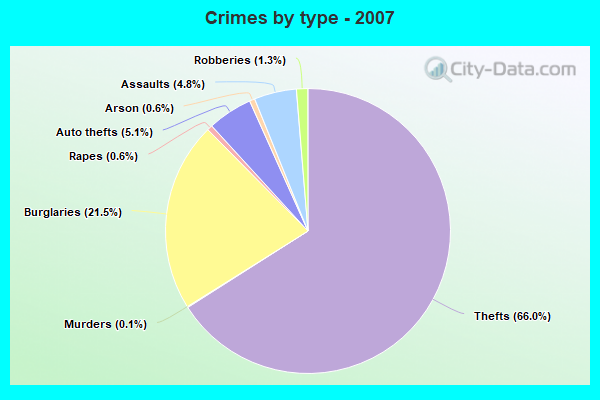
Violent crime rate in 2007
| Harlingen: | 251.8 |
| U.S. Average: | 229.1 |
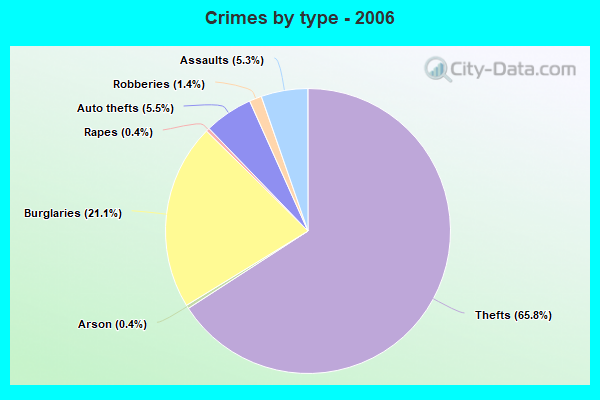
Violent crime rate in 2006
| Harlingen: | 256.0 |
| U.S. Average: | 232.6 |
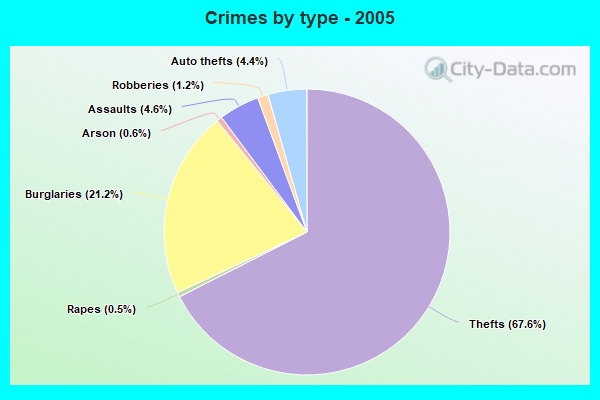
Violent crime rate in 2005
| Harlingen: | 241.5 |
| U.S. Average: | 227.0 |
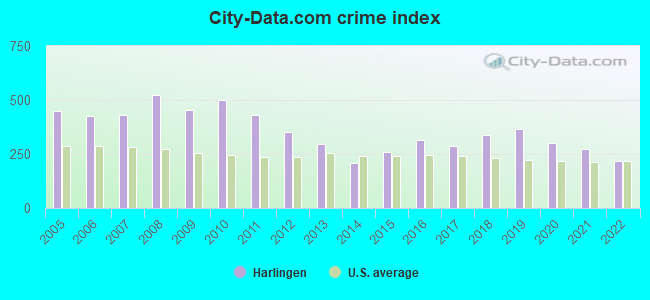
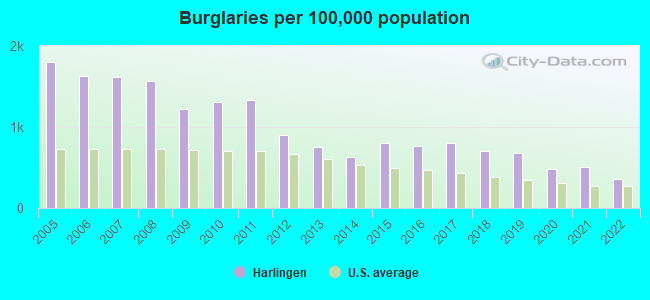
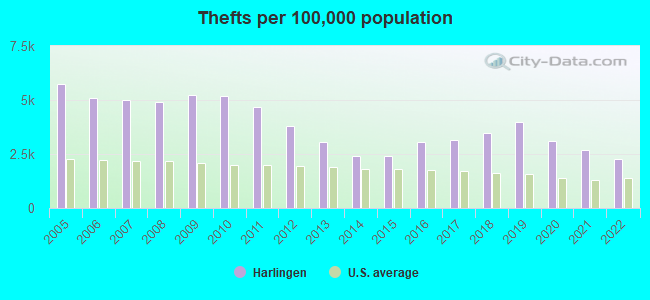
Property crime rate in 2022
| Harlingen: | 213.1 |
| U.S. Average: | 166.5 |
Property crime rate in 2021
| Harlingen: | 266.6 |
| U.S. Average: | 157.8 |
Property crime rate in 2020
| Harlingen: | 280.0 |
| U.S. Average: | 169.6 |
Property crime rate in 2019
| Harlingen: | 359.2 |
| U.S. Average: | 179.7 |
Property crime rate in 2018
| Harlingen: | 332.1 |
| U.S. Average: | 190.2 |
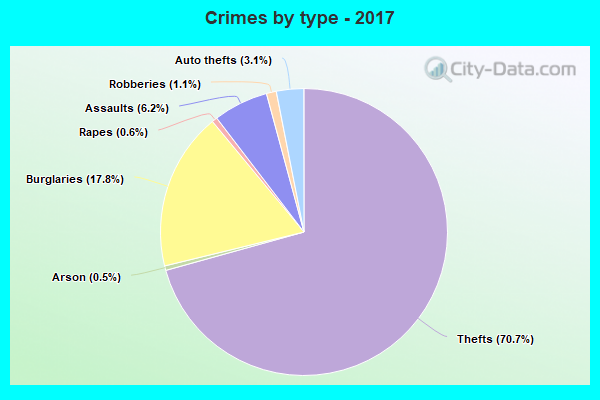
Property crime rate in 2017
| Harlingen: | 338.6 |
| U.S. Average: | 206.4 |
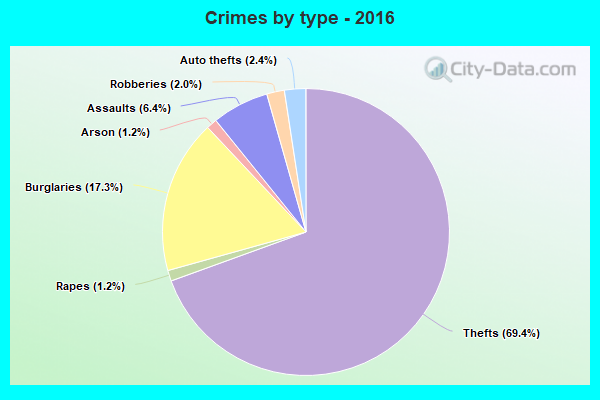
Property crime rate in 2016
| Harlingen: | 321.4 |
| U.S. Average: | 216.6 |
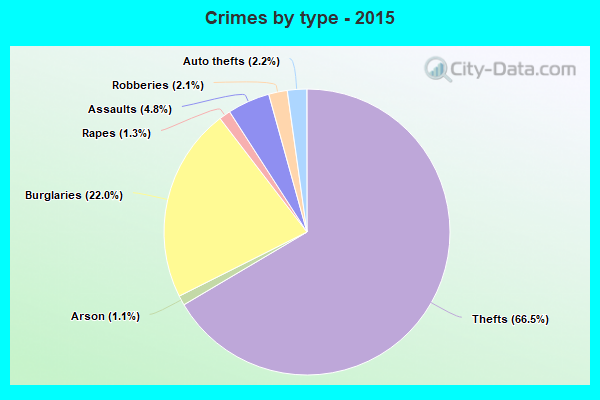
Property crime rate in 2015
| Harlingen: | 293.8 |
| U.S. Average: | 221.5 |
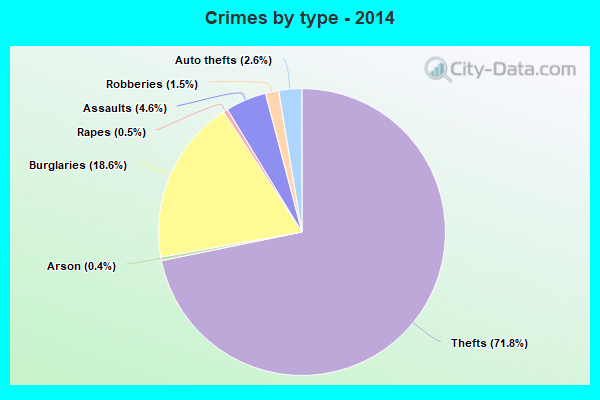
Property crime rate in 2014
| Harlingen: | 259.2 |
| U.S. Average: | 230.8 |
Property crime rate in 2013
| Harlingen: | 320.6 |
| U.S. Average: | 250.4 |
Property crime rate in 2012
| Harlingen: | 395.8 |
| U.S. Average: | 267.3 |
Property crime rate in 2011
| Harlingen: | 522.2 |
| U.S. Average: | 273.5 |
Property crime rate in 2010
| Harlingen: | 564.0 |
| U.S. Average: | 276.4 |
Property crime rate in 2009
| Harlingen: | 551.3 |
| U.S. Average: | 285.6 |
Property crime rate in 2008
| Harlingen: | 601.9 |
| U.S. Average: | 302.2 |
Property crime rate in 2007
| Harlingen: | 539.7 |
| U.S. Average: | 309.2 |
Property crime rate in 2006
| Harlingen: | 549.4 |
| U.S. Average: | 317.3 |
Property crime rate in 2005
| Harlingen: | 601.1 |
| U.S. Average: | 322.3 |
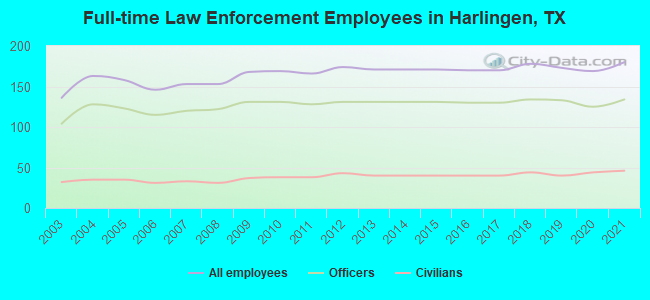
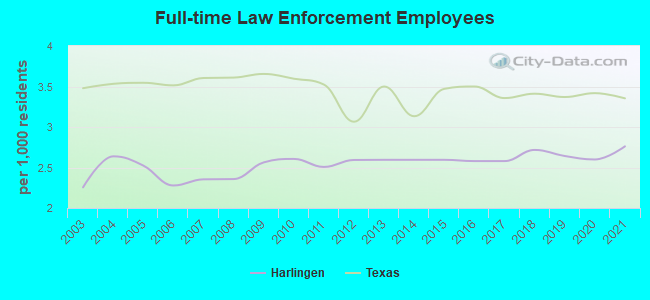
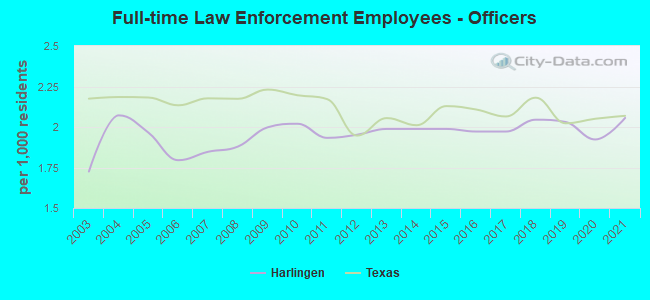
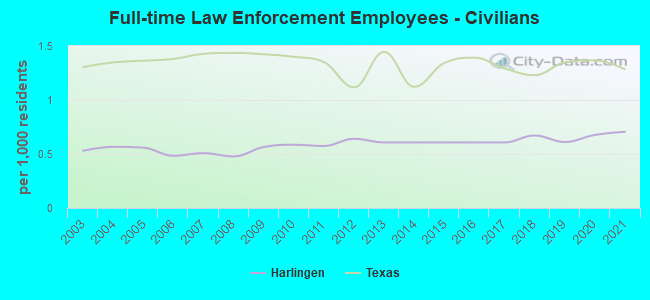
Full-time law enforcement employees in 2021, including police officers: 180 (134 officers - 121 male; 13 female).
| Officers per 1,000 residents here: | 2.06 |
| Texas average: | 2.07 |
Full-time law enforcement employees in 2020, including police officers: 169 (125 officers - 114 male; 11 female).
| Officers per 1,000 residents here: | 1.92 |
| Texas average: | 2.05 |
Full-time law enforcement employees in 2019, including police officers: 173 (133 officers - 123 male; 10 female).
| Officers per 1,000 residents here: | 2.03 |
| Texas average: | 2.02 |
Full-time law enforcement employees in 2018, including police officers: 178 (134 officers - 123 male; 11 female).
| Officers per 1,000 residents here: | 2.05 |
| Texas average: | 2.18 |
Full-time law enforcement employees in 2016, including police officers: 170 (130 officers - 119 male; 11 female).
| Officers per 1,000 residents here: | 1.97 |
| Texas average: | 2.11 |
Full-time law enforcement employees in 2013, including police officers: 171 (131 officers - 123 male; 8 female).
| Officers per 1,000 residents here: | 1.99 |
| Texas average: | 2.05 |
Full-time law enforcement employees in 2012, including police officers: 174 (131 officers - 125 male; 6 female).
| Officers per 1,000 residents here: | 1.95 |
| Texas average: | 1.95 |
Full-time law enforcement employees in 2011, including police officers: 166 (128 officers - 122 male; 6 female).
| Officers per 1,000 residents here: | 1.93 |
| Texas average: | 2.17 |
Full-time law enforcement employees in 2010, including police officers: 169 (131 officers - 124 male; 7 female).
| Officers per 1,000 residents here: | 2.02 |
| Texas average: | 2.20 |
Full-time law enforcement employees in 2009, including police officers: 168 (131 officers - 124 male; 7 female).
| Officers per 1,000 residents here: | 2.00 |
| Texas average: | 2.23 |
Full-time law enforcement employees in 2008, including police officers: 153 (122 officers - 115 male; 7 female).
| Officers per 1,000 residents here: | 1.88 |
| Texas average: | 2.17 |
Full-time law enforcement employees in 2007, including police officers: 153 (120 officers - 113 male; 7 female).
| Officers per 1,000 residents here: | 1.85 |
| Texas average: | 2.18 |
Full-time law enforcement employees in 2006, including police officers: 146 (115 officers - 110 male; 5 female).
| Officers per 1,000 residents here: | 1.79 |
| Texas average: | 2.13 |
Full-time law enforcement employees in 2005, including police officers: 158 (123 officers - 118 male; 5 female).
| Officers per 1,000 residents here: | 1.96 |
| Texas average: | 2.18 |
Full-time law enforcement employees in 2004, including police officers: 163 (128 officers - 122 male; 6 female).
| Officers per 1,000 residents here: | 2.07 |
| Texas average: | 2.19 |
Full-time law enforcement employees in 2003, including police officers: 136 (104 officers - 99 male; 5 female).
| Officers per 1,000 residents here: | 1.72 |
| Texas average: | 2.17 |


Zip codes: 78550.