Crime rate in Oakland, California (CA): murders, rapes, robberies, assaults, burglaries, thefts, auto thefts, arson, law enforcement employees, police officers, crime map
Crime rate in Oakland, CA
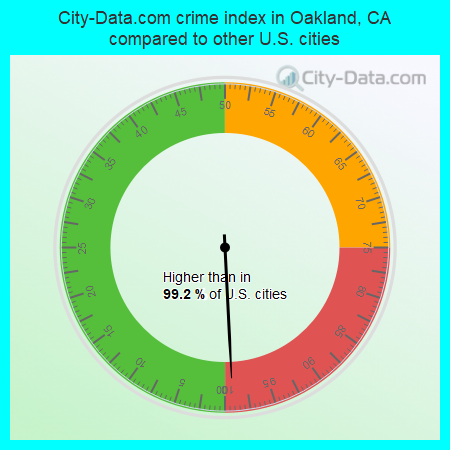
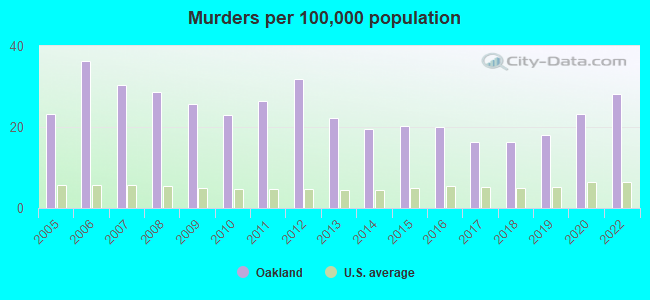
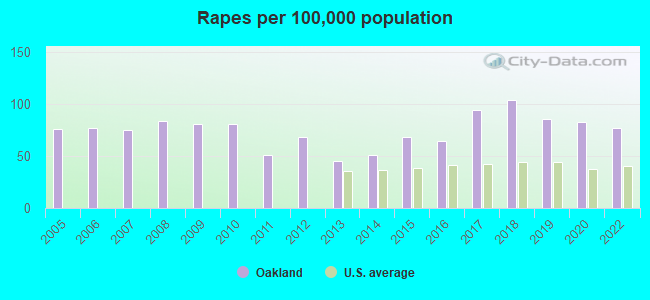
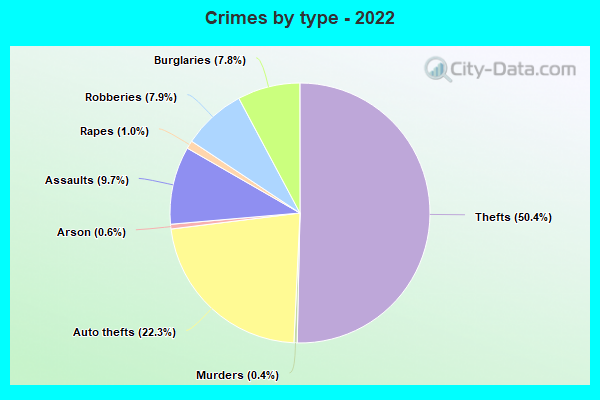
The 2022 crime rate in Oakland, CA is 815 (City-Data.com crime index), which is 3.3 times higher than the U.S. average. It was higher than in 99.2% U.S. cities. The 2022 Oakland crime rate rose by 18% compared to 2020. The number of homicides stood at 121 - an increase of 19 compared to 2020. In the last 5 years Oakland has seen rise of violent crime and increasing property crime.See how dangerous Oakland, CA is compared to the nearest cities:
(Note: Higher means more crime)
(Note: Higher means more crime)
| Oakland: | 814.9 |
| Piedmont: | 252.7 |
| Alameda: | 308.1 |
| Emeryville: | 1,025.3 |
| Berkeley: | 475.2 |
| Moraga: | 102.8 |
| Orinda: | 50.9 |
| San Leandro: | 440.2 |
| Albany: | 209.0 |
The City-Data.com crime index weighs serious crimes and violent crimes more heavily. Higher means more crime, U.S. average is 246.1. It adjusts for the number of visitors and daily workers commuting into cities.
- means the value is about the same as the state average.- means the value is bigger than the state average.
- means the value is much bigger than the state average.
According to our research of California and other state lists, there were 919 registered sex offenders living in Oakland, California as of April 19, 2024.
The ratio of all residents to sex offenders in Oakland is 457 to 1.
Violent crime rate in 2022
| Oakland: | 841.4 |
| U.S. Average: | 219.8 |
Violent crime rate in 2020
| Oakland: | 721.7 |
| U.S. Average: | 228.2 |
Violent crime rate in 2019
| Oakland: | 705.7 |
| U.S. Average: | 219.9 |
Violent crime rate in 2018
| Oakland: | 713.3 |
| U.S. Average: | 221.2 |
Violent crime rate in 2017
| Oakland: | 721.1 |
| U.S. Average: | 226.2 |
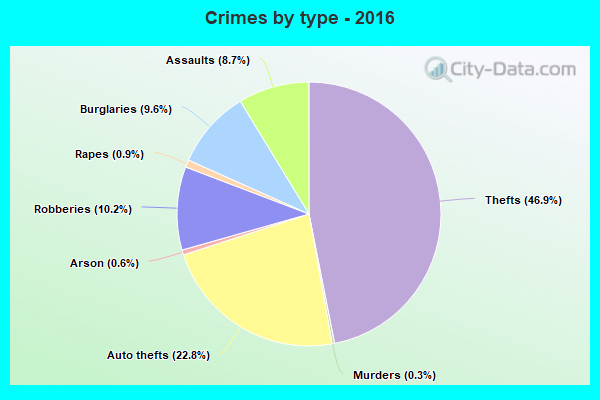
Violent crime rate in 2016
| Oakland: | 775.4 |
| U.S. Average: | 227.3 |
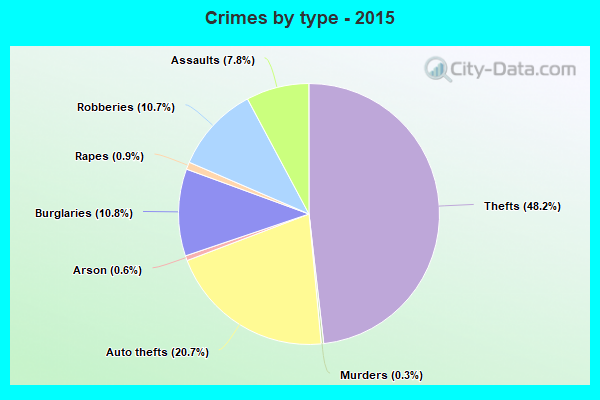
Violent crime rate in 2015
| Oakland: | 785.6 |
| U.S. Average: | 219.3 |
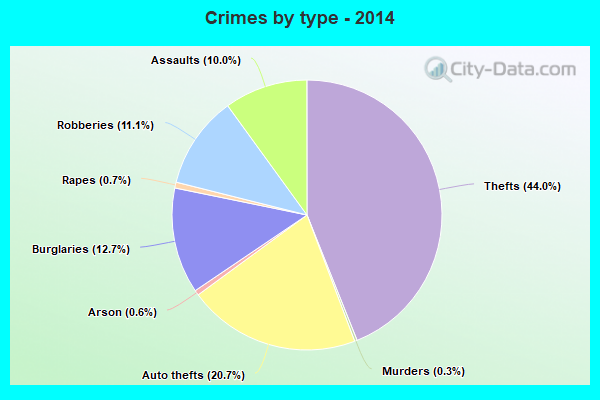
Violent crime rate in 2014
| Oakland: | 897.5 |
| U.S. Average: | 211.1 |
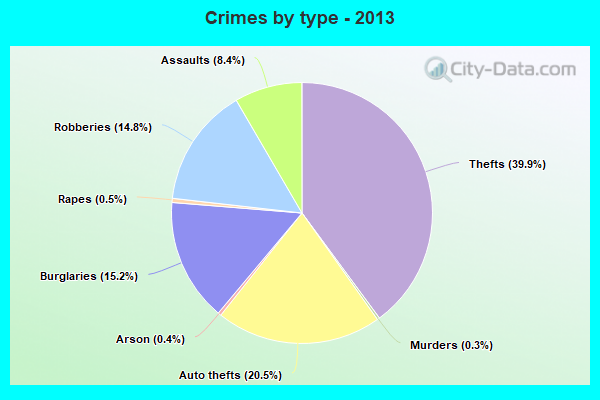
Violent crime rate in 2013
| Oakland: | 1,044.1 |
| U.S. Average: | 214.2 |
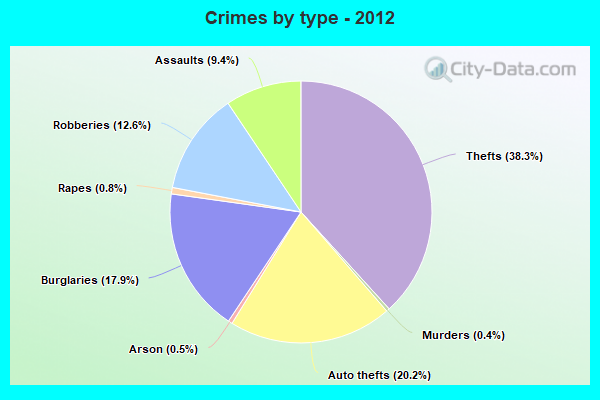
Violent crime rate in 2012
| Oakland: | 1,078.3 |
| U.S. Average: | 187.4 |
Violent crime rate in 2011
| Oakland: | 906.4 |
| U.S. Average: | 187.1 |
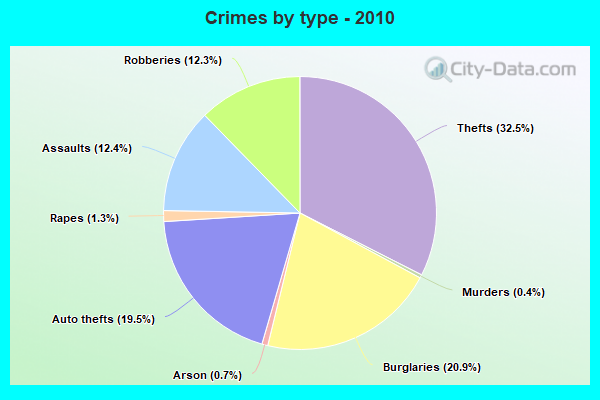
Violent crime rate in 2010
| Oakland: | 877.2 |
| U.S. Average: | 195.7 |
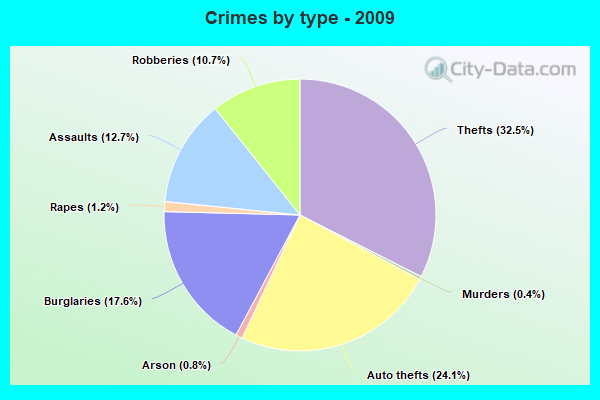
Violent crime rate in 2009
| Oakland: | 918.4 |
| U.S. Average: | 208.9 |
Violent crime rate in 2008
| Oakland: | 1,069.3 |
| U.S. Average: | 222.5 |
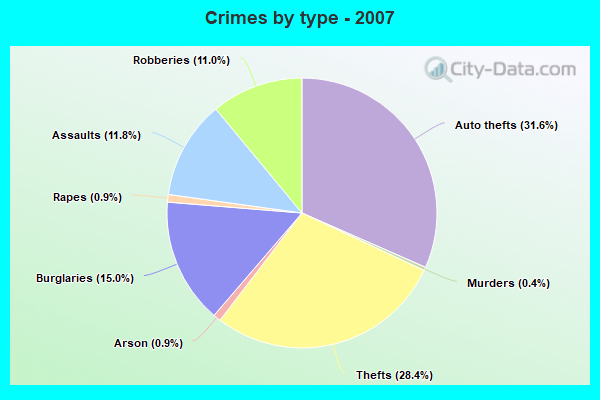
Violent crime rate in 2007
| Oakland: | 923.4 |
| U.S. Average: | 229.1 |
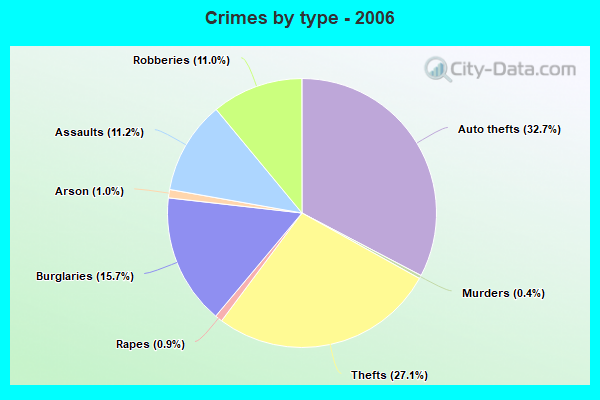
Violent crime rate in 2006
| Oakland: | 926.5 |
| U.S. Average: | 232.6 |
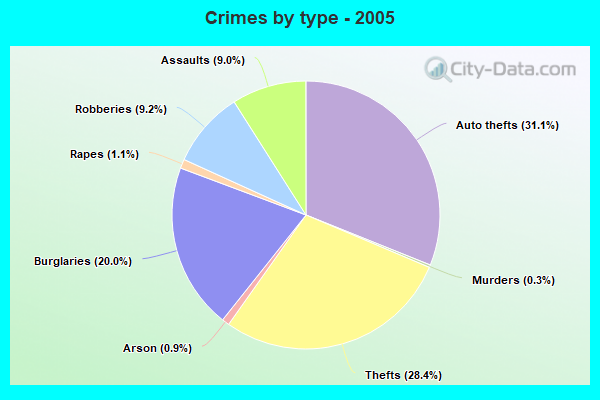
Violent crime rate in 2005
| Oakland: | 694.2 |
| U.S. Average: | 227.0 |
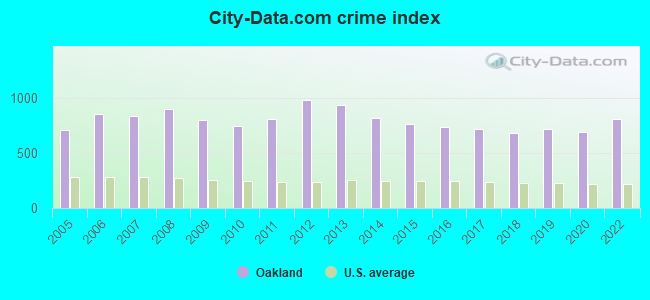
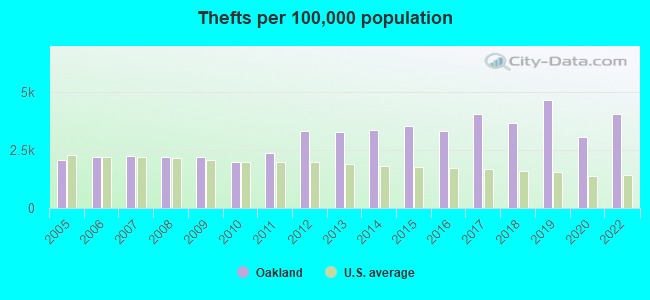
Property crime rate in 2022
| Oakland: | 597.7 |
| U.S. Average: | 166.5 |
Property crime rate in 2020
| Oakland: | 498.5 |
| U.S. Average: | 169.6 |
Property crime rate in 2019
| Oakland: | 527.0 |
| U.S. Average: | 179.7 |
Property crime rate in 2018
| Oakland: | 470.8 |
| U.S. Average: | 190.2 |
Property crime rate in 2017
| Oakland: | 521.0 |
| U.S. Average: | 206.4 |
Property crime rate in 2016
| Oakland: | 546.5 |
| U.S. Average: | 216.6 |
Property crime rate in 2015
| Oakland: | 564.3 |
| U.S. Average: | 221.5 |
Property crime rate in 2014
| Oakland: | 602.7 |
| U.S. Average: | 230.8 |
Property crime rate in 2013
| Oakland: | 668.7 |
| U.S. Average: | 250.4 |
Property crime rate in 2012
| Oakland: | 735.9 |
| U.S. Average: | 267.3 |
Property crime rate in 2011
| Oakland: | 620.1 |
| U.S. Average: | 273.5 |
Property crime rate in 2010
| Oakland: | 531.0 |
| U.S. Average: | 276.4 |
Property crime rate in 2009
| Oakland: | 588.9 |
| U.S. Average: | 285.6 |
Property crime rate in 2008
| Oakland: | 636.5 |
| U.S. Average: | 302.2 |
Property crime rate in 2007
| Oakland: | 646.1 |
| U.S. Average: | 309.2 |
Property crime rate in 2006
| Oakland: | 673.8 |
| U.S. Average: | 317.3 |
Property crime rate in 2005
| Oakland: | 646.0 |
| U.S. Average: | 322.3 |
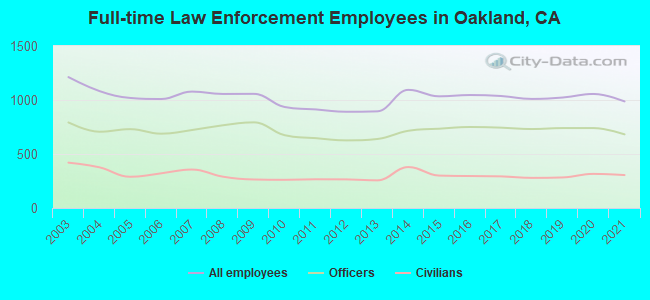
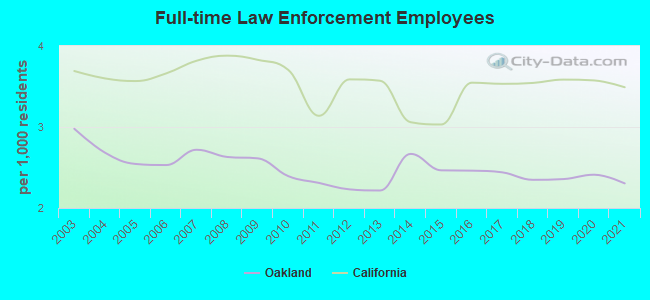
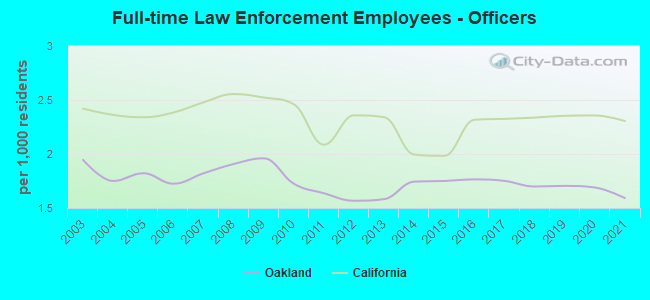
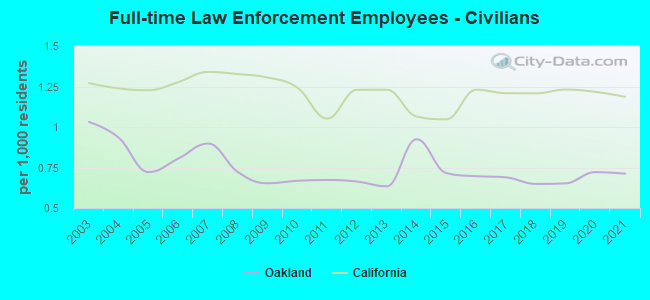
Full-time law enforcement employees in 2021, including police officers: 987 (682 officers - 579 male; 103 female).
| Officers per 1,000 residents here: | 1.59 |
| California average: | 2.30 |
Full-time law enforcement employees in 2020, including police officers: 1,056 (740 officers - 632 male; 108 female).
| Officers per 1,000 residents here: | 1.69 |
| California average: | 2.36 |
Full-time law enforcement employees in 2019, including police officers: 1,023 (740 officers - 636 male; 104 female).
| Officers per 1,000 residents here: | 1.70 |
| California average: | 2.35 |
Full-time law enforcement employees in 2018, including police officers: 1,010 (731 officers - 633 male; 98 female).
| Officers per 1,000 residents here: | 1.70 |
| California average: | 2.34 |
Full-time law enforcement employees in 2017, including police officers: 1,037 (744 officers - 647 male; 97 female).
| Officers per 1,000 residents here: | 1.75 |
| California average: | 2.32 |
Full-time law enforcement employees in 2016, including police officers: 1,046 (750 officers - 655 male; 95 female).
| Officers per 1,000 residents here: | 1.76 |
| California average: | 2.32 |
Full-time law enforcement employees in 2015, including police officers: 1,034 (734 officers - 647 male; 87 female).
| Officers per 1,000 residents here: | 1.75 |
| California average: | 1.98 |
Full-time law enforcement employees in 2014, including police officers: 1,094 (715 officers - 632 male; 83 female).
| Officers per 1,000 residents here: | 1.74 |
| California average: | 2.00 |
Full-time law enforcement employees in 2013, including police officers: 895 (639 officers - 565 male; 74 female).
| Officers per 1,000 residents here: | 1.58 |
| California average: | 2.34 |
Full-time law enforcement employees in 2012, including police officers: 891 (626 officers - 559 male; 67 female).
| Officers per 1,000 residents here: | 1.57 |
| California average: | 2.36 |
Full-time law enforcement employees in 2011, including police officers: 913 (647 officers - 575 male; 72 female).
| Officers per 1,000 residents here: | 1.64 |
| California average: | 2.09 |
Full-time law enforcement employees in 2010, including police officers: 935 (674 officers - 600 male; 74 female).
| Officers per 1,000 residents here: | 1.73 |
| California average: | 2.46 |
Full-time law enforcement employees in 2009, including police officers: 1,057 (793 officers - 706 male; 87 female).
| Officers per 1,000 residents here: | 1.96 |
| California average: | 2.52 |
Full-time law enforcement employees in 2008, including police officers: 1,056 (766 officers - 682 male; 84 female).
| Officers per 1,000 residents here: | 1.91 |
| California average: | 2.55 |
Full-time law enforcement employees in 2007, including police officers: 1,078 (722 officers - 640 male; 82 female).
| Officers per 1,000 residents here: | 1.82 |
| California average: | 2.48 |
Full-time law enforcement employees in 2006, including police officers: 1,009 (688 officers - 583 male; 105 female).
| Officers per 1,000 residents here: | 1.73 |
| California average: | 2.38 |
Full-time law enforcement employees in 2005, including police officers: 1,019 (730 officers - 622 male; 108 female).
| Officers per 1,000 residents here: | 1.82 |
| California average: | 2.34 |
Full-time law enforcement employees in 2004, including police officers: 1,083 (706 officers - 631 male; 75 female).
| Officers per 1,000 residents here: | 1.75 |
| California average: | 2.36 |
Full-time law enforcement employees in 2003, including police officers: 1,212 (792 officers - 711 male; 81 female).
| Officers per 1,000 residents here: | 1.95 |
| California average: | 2.42 |


Zip codes: 94601, 94602, 94603, 94605, 94606, 94607, 94610, 94611, 94612, 94613, 94619, 94621.