Crime rate in Oklahoma City, Oklahoma (OK): murders, rapes, robberies, assaults, burglaries, thefts, auto thefts, arson, law enforcement employees, police officers, crime map
Crime rate in Oklahoma City, OK
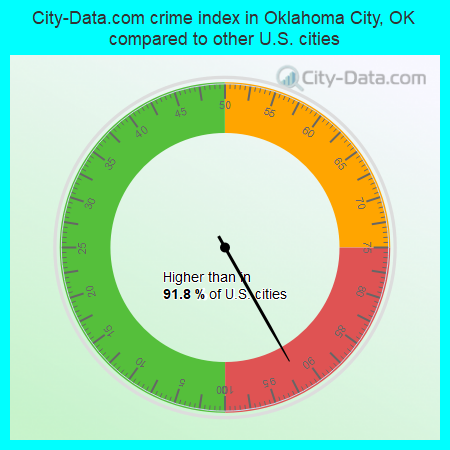
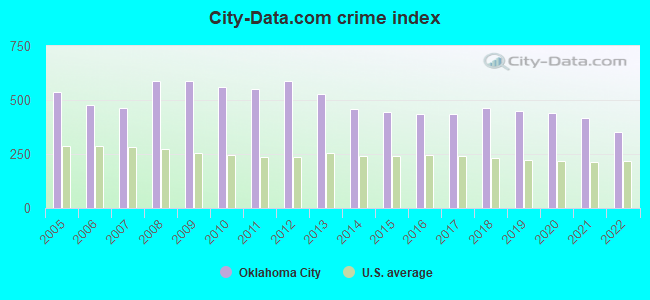
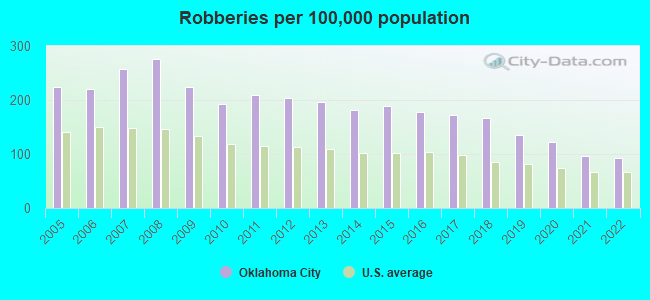
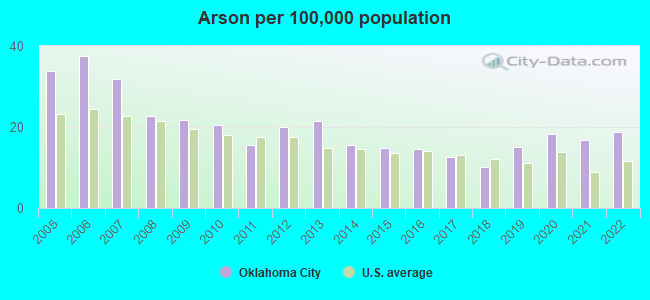
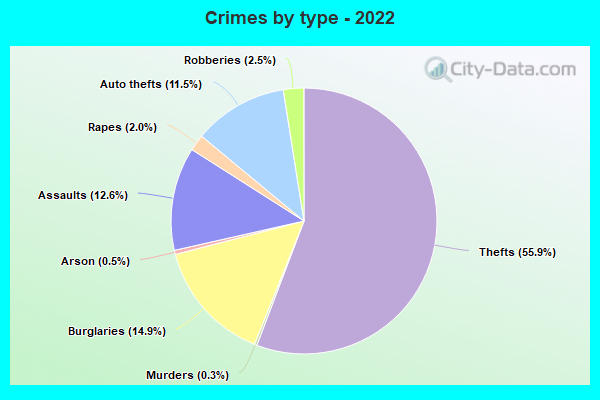
The 2022 crime rate in Oklahoma City, OK is 354 (City-Data.com crime index), which is 1.4 times greater than the U.S. average. It was higher than in 91.8% U.S. cities. The 2022 Oklahoma City crime rate fell by 15% compared to 2021. The number of homicides stood at 65 - a decrease of 18 compared to 2021. In the last 5 years Oklahoma City has seen decline of violent crime and decreasing property crime.(Note: Higher means more crime)
| Oklahoma City: | 354.5 |
| Nichols Hills: | 90.1 |
| Forest Park: | 35.5 |
| Warr Acres: | 300.1 |
| Del City: | 334.2 |
| Bethany: | 189.4 |
| The Village: | 182.6 |
| Valley Brook: | 476.9 |
| Midwest City: | 218.9 |
The City-Data.com crime index weighs serious crimes and violent crimes more heavily. Higher means more crime, U.S. average is 246.1. It adjusts for the number of visitors and daily workers commuting into cities.
- means the value is smaller than the state average.- means the value is about the same as the state average.
- means the value is bigger than the state average.
- means the value is much bigger than the state average.
According to our research of Oklahoma and other state lists, there were 1,372 registered sex offenders living in Oklahoma City, Oklahoma as of April 24, 2024.
The ratio of all residents to sex offenders in Oklahoma City is 465 to 1.
The ratio of registered sex offenders to all residents in this city is near the state average.
Violent crime rate in 2022
| Oklahoma City: | 371.6 |
| U.S. Average: | 219.8 |
Violent crime rate in 2021
| Oklahoma City: | 385.2 |
| U.S. Average: | 224.8 |
Violent crime rate in 2020
| Oklahoma City: | 426.4 |
| U.S. Average: | 228.2 |
Violent crime rate in 2019
| Oklahoma City: | 423.8 |
| U.S. Average: | 219.9 |
Violent crime rate in 2018
| Oklahoma City: | 487.1 |
| U.S. Average: | 221.2 |
Violent crime rate in 2017
| Oklahoma City: | 449.0 |
| U.S. Average: | 226.2 |
Violent crime rate in 2016
| Oklahoma City: | 442.7 |
| U.S. Average: | 227.3 |
Violent crime rate in 2015
| Oklahoma City: | 438.2 |
| U.S. Average: | 219.3 |
Violent crime rate in 2014
| Oklahoma City: | 432.9 |
| U.S. Average: | 211.1 |
Violent crime rate in 2013
| Oklahoma City: | 465.6 |
| U.S. Average: | 214.2 |
Violent crime rate in 2012
| Oklahoma City: | 513.6 |
| U.S. Average: | 187.4 |
Violent crime rate in 2011
| Oklahoma City: | 474.1 |
| U.S. Average: | 187.1 |
Violent crime rate in 2010
| Oklahoma City: | 500.5 |
| U.S. Average: | 195.7 |
Violent crime rate in 2009
| Oklahoma City: | 509.0 |
| U.S. Average: | 208.9 |
Violent crime rate in 2008
| Oklahoma City: | 533.0 |
| U.S. Average: | 222.5 |
Violent crime rate in 2007
| Oklahoma City: | 385.6 |
| U.S. Average: | 229.1 |
Violent crime rate in 2006
| Oklahoma City: | 365.8 |
| U.S. Average: | 232.6 |
Violent crime rate in 2005
| Oklahoma City: | 389.1 |
| U.S. Average: | 227.0 |
Property crime rate in 2022
| Oklahoma City: | 278.7 |
| U.S. Average: | 166.5 |
Property crime rate in 2021
| Oklahoma City: | 389.6 |
| U.S. Average: | 157.8 |
Property crime rate in 2020
| Oklahoma City: | 392.0 |
| U.S. Average: | 169.6 |
Property crime rate in 2019
| Oklahoma City: | 406.1 |
| U.S. Average: | 179.7 |
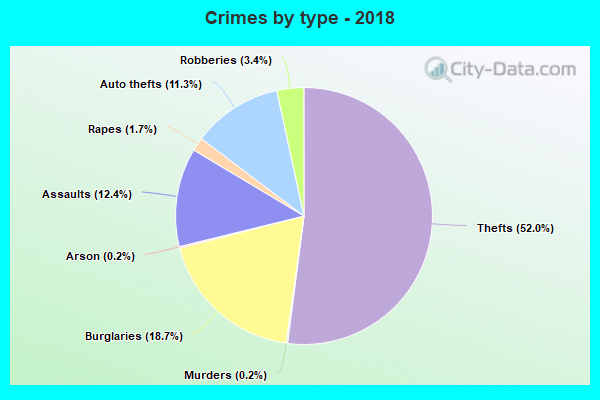
Property crime rate in 2018
| Oklahoma City: | 394.8 |
| U.S. Average: | 190.2 |
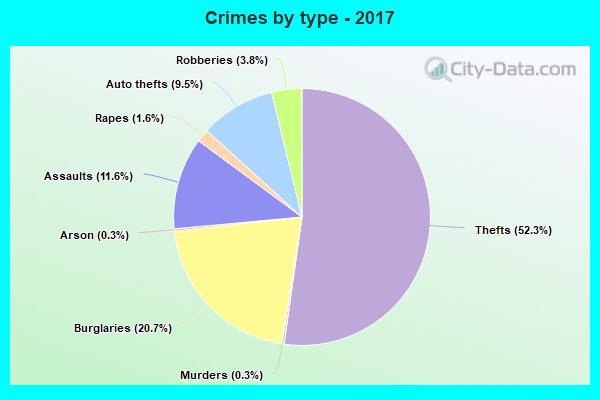
Property crime rate in 2017
| Oklahoma City: | 372.1 |
| U.S. Average: | 206.4 |
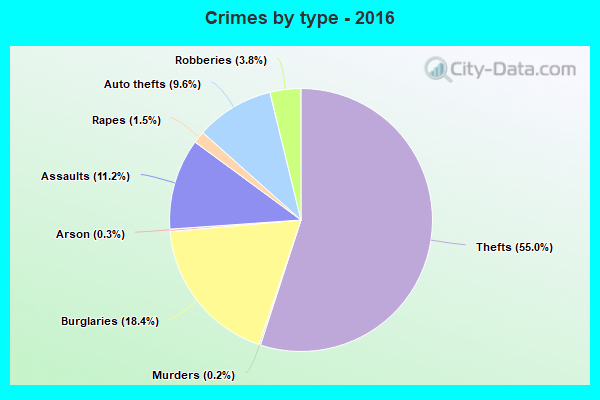
Property crime rate in 2016
| Oklahoma City: | 369.9 |
| U.S. Average: | 216.6 |
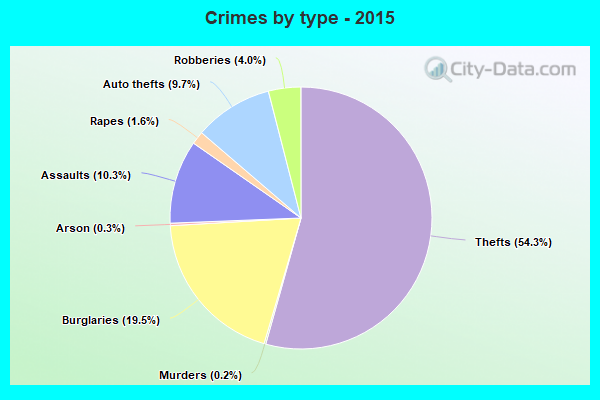
Property crime rate in 2015
| Oklahoma City: | 382.3 |
| U.S. Average: | 221.5 |
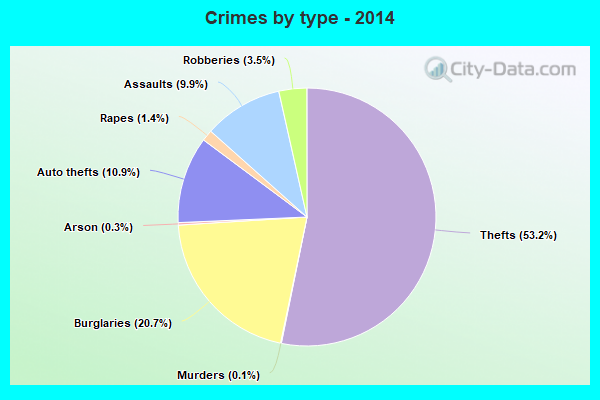
Property crime rate in 2014
| Oklahoma City: | 438.4 |
| U.S. Average: | 230.8 |
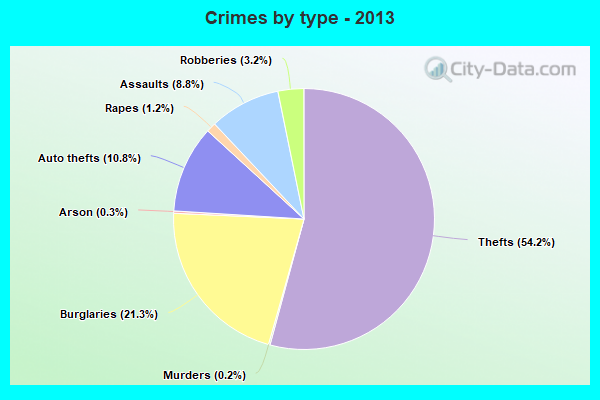
Property crime rate in 2013
| Oklahoma City: | 534.5 |
| U.S. Average: | 250.4 |
Property crime rate in 2012
| Oklahoma City: | 618.7 |
| U.S. Average: | 267.3 |
Property crime rate in 2011
| Oklahoma City: | 612.4 |
| U.S. Average: | 273.5 |
Property crime rate in 2010
| Oklahoma City: | 604.9 |
| U.S. Average: | 276.4 |
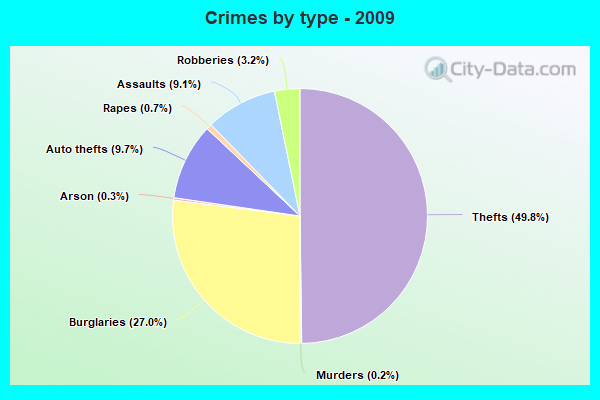
Property crime rate in 2009
| Oklahoma City: | 658.9 |
| U.S. Average: | 285.6 |
Property crime rate in 2008
| Oklahoma City: | 615.8 |
| U.S. Average: | 302.2 |
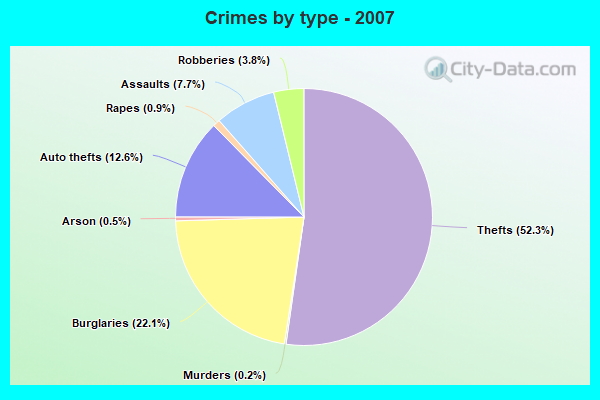
Property crime rate in 2007
| Oklahoma City: | 494.1 |
| U.S. Average: | 309.2 |
Property crime rate in 2006
| Oklahoma City: | 548.2 |
| U.S. Average: | 317.3 |
Property crime rate in 2005
| Oklahoma City: | 600.8 |
| U.S. Average: | 322.3 |

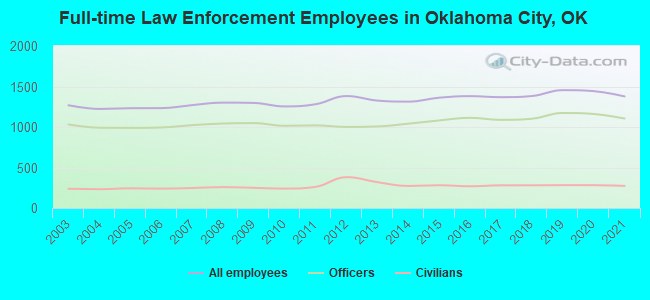
Full-time law enforcement employees in 2021, including police officers: 1,378 (1,105 officers - 979 male; 126 female).
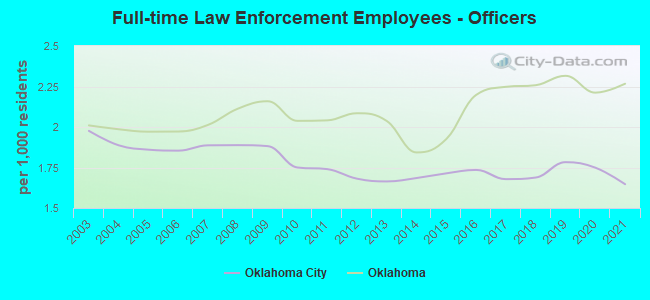
| Officers per 1,000 residents here: | 1.65 |
| Oklahoma average: | 2.27 |
Full-time law enforcement employees in 2020, including police officers: 1,443 (1,161 officers - 1,034 male; 127 female).
| Officers per 1,000 residents here: | 1.75 |
| Oklahoma average: | 2.21 |
Full-time law enforcement employees in 2019, including police officers: 1,455 (1,173 officers - 1,043 male; 130 female).
| Officers per 1,000 residents here: | 1.78 |
| Oklahoma average: | 2.32 |
Full-time law enforcement employees in 2018, including police officers: 1,382 (1,102 officers - 991 male; 111 female).
| Officers per 1,000 residents here: | 1.69 |
| Oklahoma average: | 2.26 |
Full-time law enforcement employees in 2017, including police officers: 1,368 (1,088 officers - 979 male; 109 female).
| Officers per 1,000 residents here: | 1.68 |
| Oklahoma average: | 2.25 |
Full-time law enforcement employees in 2016, including police officers: 1,381 (1,113 officers - 994 male; 119 female).
| Officers per 1,000 residents here: | 1.73 |
| Oklahoma average: | 2.20 |
Full-time law enforcement employees in 2015, including police officers: 1,362 (1,081 officers - 971 male; 110 female).
| Officers per 1,000 residents here: | 1.71 |
| Oklahoma average: | 1.93 |
Full-time law enforcement employees in 2014, including police officers: 1,313 (1,041 officers - 928 male; 113 female).
| Officers per 1,000 residents here: | 1.68 |
| Oklahoma average: | 1.84 |
Full-time law enforcement employees in 2013, including police officers: 1,326 (1,007 officers - 898 male; 109 female).
| Officers per 1,000 residents here: | 1.66 |
| Oklahoma average: | 2.04 |
Full-time law enforcement employees in 2012, including police officers: 1,382 (1,001 officers - 891 male; 110 female).
| Officers per 1,000 residents here: | 1.68 |
| Oklahoma average: | 2.08 |
Full-time law enforcement employees in 2011, including police officers: 1,281 (1,020 officers - 907 male; 113 female).
| Officers per 1,000 residents here: | 1.74 |
| Oklahoma average: | 2.04 |
Full-time law enforcement employees in 2010, including police officers: 1,254 (1,015 officers - 898 male; 117 female).
| Officers per 1,000 residents here: | 1.75 |
| Oklahoma average: | 2.04 |
Full-time law enforcement employees in 2009, including police officers: 1,297 (1,048 officers - 927 male; 121 female).
| Officers per 1,000 residents here: | 1.88 |
| Oklahoma average: | 2.16 |
Full-time law enforcement employees in 2008, including police officers: 1,301 (1,043 officers - 925 male; 118 female).
| Officers per 1,000 residents here: | 1.89 |
| Oklahoma average: | 2.11 |
Full-time law enforcement employees in 2007, including police officers: 1,270 (1,023 officers - 905 male; 118 female).
| Officers per 1,000 residents here: | 1.89 |
| Oklahoma average: | 2.01 |
Full-time law enforcement employees in 2006, including police officers: 1,233 (994 officers - 885 male; 109 female).
| Officers per 1,000 residents here: | 1.85 |
| Oklahoma average: | 1.97 |
Full-time law enforcement employees in 2005, including police officers: 1,232 (989 officers - 879 male; 110 female).
| Officers per 1,000 residents here: | 1.86 |
| Oklahoma average: | 1.97 |
Full-time law enforcement employees in 2004, including police officers: 1,223 (991 officers - 884 male; 107 female).
| Officers per 1,000 residents here: | 1.89 |
| Oklahoma average: | 1.99 |
Full-time law enforcement employees in 2003, including police officers: 1,268 (1,031 officers - 915 male; 116 female).
| Officers per 1,000 residents here: | 1.98 |
| Oklahoma average: | 2.01 |


Zip codes: 73078, 73097, 73099, 73102, 73103, 73104, 73105, 73106, 73107, 73108, 73109, 73111, 73112, 73114, 73118, 73119, 73128, 73129, 73131, 73134, 73139, 73142, 73149, 73151, 73159, 73162, 73169, 73173, 73179.